Intensity of continuous renal replacement therapy for acute kidney injury
Appendices
Appendix 1. Electronic search strategies
| Database | Search terms |
| CENTRAL |
|
| MEDLINE |
|
| EMBASE |
|
| LILACS |
|
Appendix 2. Risk of bias assessment tool
| Potential source of bias | Assessment criteria |
| Random sequence generation Selection bias (biased allocation to interventions) due to inadequate generation of a randomised sequence | Low risk of bias: Random number table; computer random number generator; coin tossing; shuffling cards or envelopes; throwing dice; drawing of lots; minimisation (minimisation may be implemented without a random element, and this is considered to be equivalent to being random) |
| High risk of bias: Sequence generated by odd or even date of birth; date (or day) of admission; sequence generated by hospital or clinic record number; allocation by judgement of the clinician; by preference of the participant; based on the results of a laboratory test or a series of tests; by availability of the intervention | |
| Unclear: Insufficient information about the sequence generation process to permit judgement | |
| Allocation concealment Selection bias (biased allocation to interventions) due to inadequate concealment of allocations prior to assignment | Low risk of bias: Randomisation method described that would not allow investigator/participant to know or influence intervention group before eligible participant entered in the study (e.g. central allocation, including telephone, web‐based, and pharmacy‐controlled, randomisation; sequentially numbered drug containers of identical appearance; sequentially numbered, opaque, sealed envelopes) |
| High risk of bias: Using an open random allocation schedule (e.g. a list of random numbers); assignment envelopes were used without appropriate safeguards (e.g. if envelopes were unsealed or non‐opaque or not sequentially numbered); alternation or rotation; date of birth; case record number; any other explicitly unconcealed procedure | |
| Unclear: Randomisation stated but no information on method used is available | |
| Blinding of participants and personnel Performance bias due to knowledge of the allocated interventions by participants and personnel during the study | Low risk of bias: No blinding or incomplete blinding, but the review authors judge that the outcome is not likely to be influenced by lack of blinding; blinding of participants and key study personnel ensured, and unlikely that the blinding could have been broken |
| High risk of bias: No blinding or incomplete blinding, and the outcome is likely to be influenced by lack of blinding; blinding of key study participants and personnel attempted, but likely that the blinding could have been broken, and the outcome is likely to be influenced by lack of blinding | |
| Unclear: Insufficient information to permit judgement | |
| Blinding of outcome assessment Detection bias due to knowledge of the allocated interventions by outcome assessors. | Low risk of bias: No blinding of outcome assessment, but the review authors judge that the outcome measurement is not likely to be influenced by lack of blinding; blinding of outcome assessment ensured, and unlikely that the blinding could have been broken |
| High risk of bias: No blinding of outcome assessment, and the outcome measurement is likely to be influenced by lack of blinding; blinding of outcome assessment, but likely that the blinding could have been broken, and the outcome measurement is likely to be influenced by lack of blinding | |
| Unclear: Insufficient information to permit judgement | |
| Incomplete outcome data Attrition bias due to amount, nature or handling of incomplete outcome data. | Low risk of bias: No missing outcome data; reasons for missing outcome data unlikely to be related to true outcome (for survival data, censoring unlikely to be introducing bias); missing outcome data balanced in numbers across intervention groups, with similar reasons for missing data across groups; for dichotomous outcome data, the proportion of missing outcomes compared with observed event risk not enough to have a clinically relevant impact on the intervention effect estimate; for continuous outcome data, plausible effect size (difference in means or standardised difference in means) among missing outcomes not enough to have a clinically relevant impact on observed effect size; missing data have been imputed using appropriate methods |
| High risk of bias: Reason for missing outcome data likely to be related to true outcome, with either imbalance in numbers or reasons for missing data across intervention groups; for dichotomous outcome data, the proportion of missing outcomes compared with observed event risk enough to induce clinically relevant bias in intervention effect estimate; for continuous outcome data, plausible effect size (difference in means or standardised difference in means) among missing outcomes enough to induce clinically relevant bias in observed effect size; ‘as‐treated’ analysis done with substantial departure of the intervention received from that assigned at randomisation; potentially inappropriate application of simple imputation | |
| Unclear: Insufficient information to permit judgement | |
| Selective reporting Reporting bias due to selective outcome reporting | Low risk of bias: The study protocol is available and all of the study’s pre‐specified (primary and secondary) outcomes that are of interest in the review have been reported in the pre‐specified way; the study protocol is not available but it is clear that the published reports include all expected outcomes, including those that were pre‐specified (convincing text of this nature may be uncommon) |
| High risk of bias: Not all of the study’s pre‐specified primary outcomes have been reported; one or more primary outcomes is reported using measurements, analysis methods or subsets of the data (e.g. sub scales) that were not pre‐specified; one or more reported primary outcomes were not pre‐specified (unless clear justification for their reporting is provided, such as an unexpected adverse effect); one or more outcomes of interest in the review are reported incompletely so that they cannot be entered in a meta‐analysis; the study report fails to include results for a key outcome that would be expected to have been reported for such a study | |
| Unclear: Insufficient information to permit judgement | |
| Other bias Bias due to problems not covered elsewhere in the table | Low risk of bias: The study appears to be free of other sources of bias |
| High risk of bias: Had a potential source of bias related to the specific study design used; stopped early due to some data‐dependent process (including a formal‐stopping rule); had extreme baseline imbalance; has been claimed to have been fraudulent; had some other problem | |
| Unclear: Insufficient information to assess whether an important risk of bias exists; insufficient rationale or evidence that an identified problem will introduce bias |

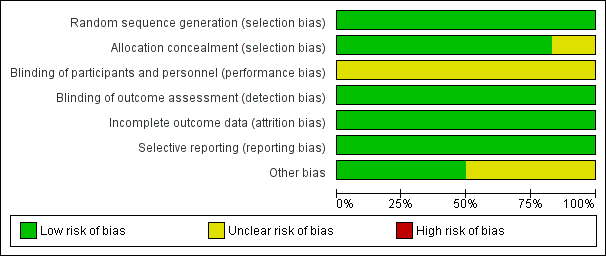
Risk of bias graph: review authors' judgements about each risk of bias item presented as percentages across all included studies

Risk of bias summary: review authors' judgements about each risk of bias item for each included study

Funnel plot of comparison: 1 High Intensity versus less intensive CRRT, outcome: 1.1 Mortality
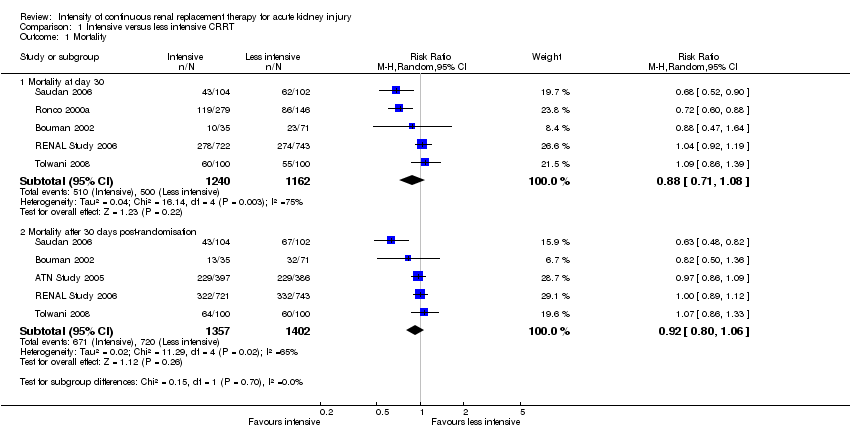
Comparison 1 Intensive versus less intensive CRRT, Outcome 1 Mortality.

Comparison 1 Intensive versus less intensive CRRT, Outcome 2 Mortality in prespecified groups.

Comparison 1 Intensive versus less intensive CRRT, Outcome 3 Recovery of kidney function.

Comparison 1 Intensive versus less intensive CRRT, Outcome 4 Kidney function recovery in prespecified subgroup.
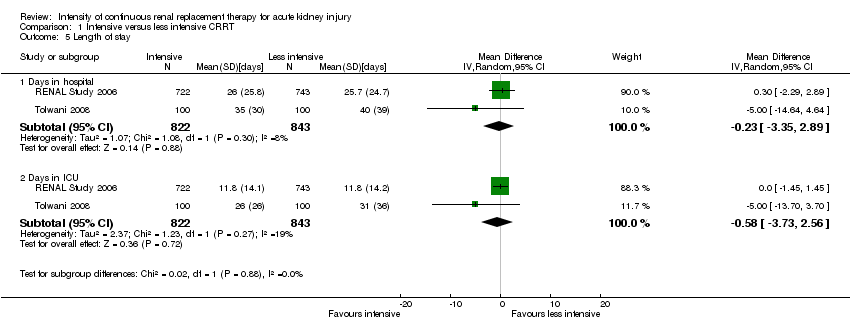
Comparison 1 Intensive versus less intensive CRRT, Outcome 5 Length of stay.

Comparison 1 Intensive versus less intensive CRRT, Outcome 6 Metabolic control.
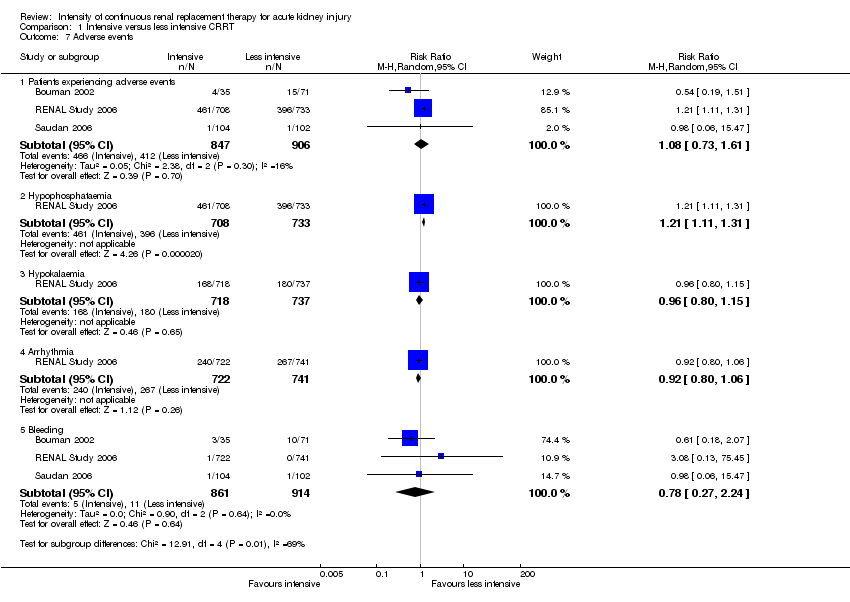
Comparison 1 Intensive versus less intensive CRRT, Outcome 7 Adverse events.
| Intensive versus less intensive CRRT for AKI | ||||||
| Patient or population: patients with AKI | ||||||
| Outcomes | Illustrative comparative risks* (95% CI) | Relative effect | No. of participants | Quality of the evidence | Comments | |
| Assumed risk | Corresponding risk | |||||
| Less intensive CRRT | Intensive CRRT | |||||
| Mortality at day 30 | Study population | RR 0.88 | 2402 (5) | ⊕⊕⊝⊝ | ||
| 430 per 1000 | 420 per 1000 | |||||
| Moderate | ||||||
| Mortality after 30 days post‐randomisation | Study population | RR 0.92 | 2759 (5) | ⊕⊕⊝⊝ | ||
| 514 per 1000 | 483 per 1000 | |||||
| Moderate | ||||||
| 593 per 1000 | 557 per 1000 | |||||
| Patients free of RRT after discontinuing CRRT | Study population | RR 1.12 | 2402 (5) | ⊕⊕⊝⊝ | ||
| 483 per 1000 | 541 per 1000 | |||||
| Moderate | ||||||
| 390 per 1000 | 437 per 1000 | |||||
| Patients free of RRT after discontinuing CRRT | Study population | RR 0.98 | 988 (3) | ⊕⊕⊕⊝ | ||
| 923 per 1000 | 904 per 1000 | |||||
| Moderate | ||||||
| 800 per 1000 | 784 per 1000 | |||||
| Adverse events: hypophosphataemia | Study population | RR 1.21 | 1441 (1) | ⊕⊕⊕⊕ | ||
| 540 per 1000 | 654 per 1000 | |||||
| Moderate | ||||||
| 540 per 1000 | 653 per 1000 | |||||
| *The basis for the assumed risk (e.g. the median control group risk across studies) is provided in footnotes. The corresponding risk (and its 95% confidence interval) is based on the assumed risk in the comparison group and the relative effect of the intervention (and its 95% CI). | ||||||
| GRADE Working Group grades of evidence | ||||||
| ¹ inconsistency: due to substantial heterogeneity (I2 values ranged from 73% to 78%) ² imprecision: due to wide CI which crossed the threshold for clinically meaningful effects ³ Indirectness: critically ill patients with AKI in CRRT have high short‐term mortality risk; mortality is a competing end point for kidney recovery at day 90 | ||||||
| Intensive versus less intensive CRRT for AKI: subgroups | ||||||
| Patient or population: patients with AKI who need CRRT | ||||||
| Outcomes | Illustrative comparative risks* (95% CI) | Relative effect | No. of participants | Quality of the evidence | Comments | |
| Assumed risk | Corresponding risk | |||||
| Standard dose | High dose | |||||
| Mortality: patients with sepsis | Study population | RR 0.94 | 966 (5) | ⊕⊕⊝⊝ | ||
| 524 per 1000 | 492 per 1000 | |||||
| Moderate | ||||||
| 618 per 1000 | 581 per 1000 | |||||
| Mortality: patients without sepsis | Study population | RR 0.89 | 1216 (4) | ⊕⊕⊝⊝ | ||
| 465 per 1000 | 414 per 1000 | |||||
| Moderate | ||||||
| 564 per 1000 | 502 per 1000 | |||||
| Mortality: patients with AKI related to cardiac or general surgery | Study population | RR 0.73 | 531 (2) | ⊕⊕⊕⊕ | ||
| 505 per 1000 | 368 per 1000 | |||||
| Moderate | ||||||
| 459 per 1000 | 335 per 1000 | |||||
| Mortality: patients with AKI not related to surgery | Study population | RR 0.94 | 1871 (3) | ⊕⊕⊝⊝ | ||
| 414 per 1000 | 389 per 1000 | |||||
| Moderate | ||||||
| 550 per 1000 | 517 per 1000 | |||||
| *The basis for the assumed risk (e.g. the median control group risk across studies) is provided in footnotes. The corresponding risk (and its 95% confidence interval) is based on the assumed risk in the comparison group and the relative effect of the intervention (and its 95% CI). | ||||||
| GRADE Working Group grades of evidence | ||||||
| ¹ inconsistency: due to substantial heterogeneity (I2 values ranged from 73% to 78%) ² imprecision: due to wide CI which crossed the threshold for clinically meaningful effects | ||||||
| Outcome or subgroup title | No. of studies | No. of participants | Statistical method | Effect size |
| 1 Mortality Show forest plot | 6 | Risk Ratio (M‐H, Random, 95% CI) | Subtotals only | |
| 1.1 Mortality at day 30 | 5 | 2402 | Risk Ratio (M‐H, Random, 95% CI) | 0.88 [0.71, 1.08] |
| 1.2 Mortality after 30 days post‐randomisation | 5 | 2759 | Risk Ratio (M‐H, Random, 95% CI) | 0.92 [0.80, 1.06] |
| 2 Mortality in prespecified groups Show forest plot | 5 | Risk Ratio (M‐H, Random, 95% CI) | Subtotals only | |
| 2.1 Patients with sepsis | 5 | 966 | Risk Ratio (M‐H, Random, 95% CI) | 0.94 [0.69, 1.27] |
| 2.2 Patients without sepsis | 4 | 1216 | Risk Ratio (M‐H, Random, 95% CI) | 0.89 [0.69, 1.15] |
| 2.3 Patients with SOFA cardiovascular score < 3 | 1 | 404 | Risk Ratio (M‐H, Random, 95% CI) | 0.91 [0.71, 1.18] |
| 2.4 Patients with SOFA cardiovascular ≥ 3 | 1 | 1056 | Risk Ratio (M‐H, Random, 95% CI) | 1.04 [0.92, 1.18] |
| 2.5 Patients with AKI related to surgical causes | 2 | 531 | Risk Ratio (M‐H, Random, 95% CI) | 0.73 [0.61, 0.88] |
| 2.6 Patients with AKI unrelated to surgical causes | 3 | 1871 | Risk Ratio (M‐H, Random, 95% CI) | 0.94 [0.73, 1.20] |
| 3 Recovery of kidney function Show forest plot | 5 | Risk Ratio (M‐H, Random, 95% CI) | Subtotals only | |
| 3.1 Free of RRT after discontinuing CRRT | 5 | 2402 | Risk Ratio (M‐H, Random, 95% CI) | 1.12 [0.91, 1.37] |
| 3.2 Free of RRT after discontinuing CRRT at day 30 | 5 | 1416 | Risk Ratio (M‐H, Random, 95% CI) | 1.03 [0.96, 1.11] |
| 3.3 Free of RRT after discontinuing CRRT at day 90 | 3 | 988 | Risk Ratio (M‐H, Random, 95% CI) | 0.98 [0.94, 1.01] |
| 4 Kidney function recovery in prespecified subgroup Show forest plot | 5 | Risk Ratio (M‐H, Random, 95% CI) | Subtotals only | |
| 4.1 Patients with AKI related to surgical causes | 2 | 531 | Risk Ratio (M‐H, Random, 95% CI) | 1.27 [1.05, 1.53] |
| 4.2 Patients with AKI related to non‐surgical causes | 3 | 1870 | Risk Ratio (M‐H, Random, 95% CI) | 1.12 [0.73, 1.71] |
| 5 Length of stay Show forest plot | 2 | Mean Difference (IV, Random, 95% CI) | Subtotals only | |
| 5.1 Days in hospital | 2 | 1665 | Mean Difference (IV, Random, 95% CI) | ‐0.23 [‐3.35, 2.89] |
| 5.2 Days in ICU | 2 | 1665 | Mean Difference (IV, Random, 95% CI) | ‐0.58 [‐3.73, 2.56] |
| 6 Metabolic control Show forest plot | 1 | Risk Ratio (M‐H, Random, 95% CI) | Totals not selected | |
| 6.1 Normalised metabolic acidosis | 1 | Risk Ratio (M‐H, Random, 95% CI) | 0.0 [0.0, 0.0] | |
| 7 Adverse events Show forest plot | 3 | Risk Ratio (M‐H, Random, 95% CI) | Subtotals only | |
| 7.1 Patients experiencing adverse events | 3 | 1753 | Risk Ratio (M‐H, Random, 95% CI) | 1.08 [0.73, 1.61] |
| 7.2 Hypophosphataemia | 1 | 1441 | Risk Ratio (M‐H, Random, 95% CI) | 1.21 [1.11, 1.31] |
| 7.3 Hypokalaemia | 1 | 1455 | Risk Ratio (M‐H, Random, 95% CI) | 0.96 [0.80, 1.15] |
| 7.4 Arrhythmia | 1 | 1463 | Risk Ratio (M‐H, Random, 95% CI) | 0.92 [0.80, 1.06] |
| 7.5 Bleeding | 3 | 1775 | Risk Ratio (M‐H, Random, 95% CI) | 0.78 [0.27, 2.24] |