Intensidad de la terapia de reemplazo renal continua para la insuficiencia renal aguda
Information
- DOI:
- https://doi.org/10.1002/14651858.CD010613.pub2Copy DOI

- Database:
-
- Cochrane Database of Systematic Reviews
- Version published:
-
- 04 October 2016see what's new
- Type:
-
- Intervention
- Stage:
-
- Review
- Cochrane Editorial Group:
-
Cochrane Kidney and Transplant Group
- Copyright:
-
- Copyright © 2016 The Cochrane Collaboration. Published by John Wiley & Sons, Ltd.
Article metrics
Altmetric:
Cited by:
Authors
Contributions of authors
-
Draft the protocol: AF, DB, AC
-
Study selection: AF, DB
-
Extract data from studies: AF, DB
-
Enter data into RevMan: AF
-
Carry out the analysis: AF, AC
-
Interpret the analysis: AF, DB, AC
-
Draft the final review: AF, DB, AC
-
Disagreement resolution: AC
-
Update the review: AF
Sources of support
Internal sources
-
No sources of support supplied, Other.
External sources
-
No sources of support supplied
Declarations of interest
-
Alicia I Fayad: none known
-
Daniel G Buamscha: none known
-
Agustín Ciapponi: none known
Acknowledgements
The authors wish to thank the referees for their advice and feedback during the preparation of this review.
The authors would also like to thank all study authors who provided additional information about their studies and Daniel Comande, Librarian of the Institute for Clinical Effectiveness and Health Policy (Argentina) for his help in search for the literature.
We would like to thank Ms Narelle Willis and Ms Gail Higgins from Cochrane Kidney and Transplant for their help with this review and especially to Marta Roque Figuls, Iberoamerican Cochrane Centre for her support and editorial advice during the preparation of this systematic review.
Version history
| Published | Title | Stage | Authors | Version |
| 2016 Oct 04 | Intensity of continuous renal replacement therapy for acute kidney injury | Review | Alicia I Fayad, Daniel G Buamscha, Agustín Ciapponi | |
| 2013 Jun 24 | Intensity of continuous renal replacement therapy for acute kidney injury | Protocol | Alicia I Fayad, Daniel G Buamscha, Agustín Ciapponi | |
Differences between protocol and review
We modified the definitions of intensive and less intensive CRRT according to suggestions of the Editorial Committee and external referees.
'Summary of findings' tables have been incorporated.
Keywords
MeSH
Medical Subject Headings (MeSH) Keywords
Medical Subject Headings Check Words
Humans;
PICOs

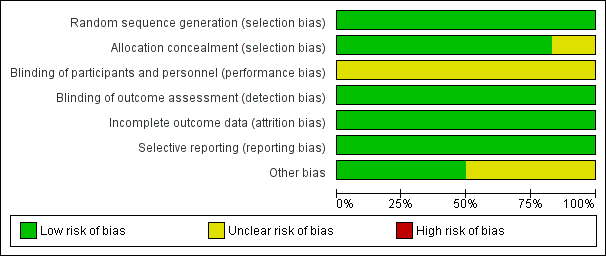
Risk of bias graph: review authors' judgements about each risk of bias item presented as percentages across all included studies

Risk of bias summary: review authors' judgements about each risk of bias item for each included study

Funnel plot of comparison: 1 High Intensity versus less intensive CRRT, outcome: 1.1 Mortality
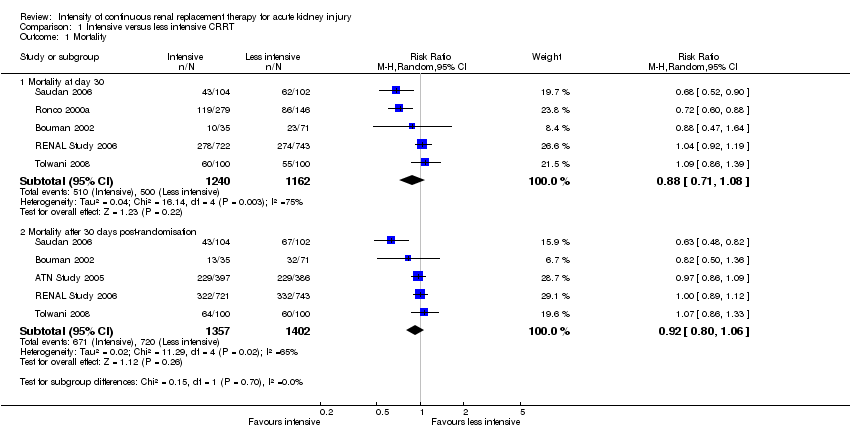
Comparison 1 Intensive versus less intensive CRRT, Outcome 1 Mortality.

Comparison 1 Intensive versus less intensive CRRT, Outcome 2 Mortality in prespecified groups.

Comparison 1 Intensive versus less intensive CRRT, Outcome 3 Recovery of kidney function.

Comparison 1 Intensive versus less intensive CRRT, Outcome 4 Kidney function recovery in prespecified subgroup.
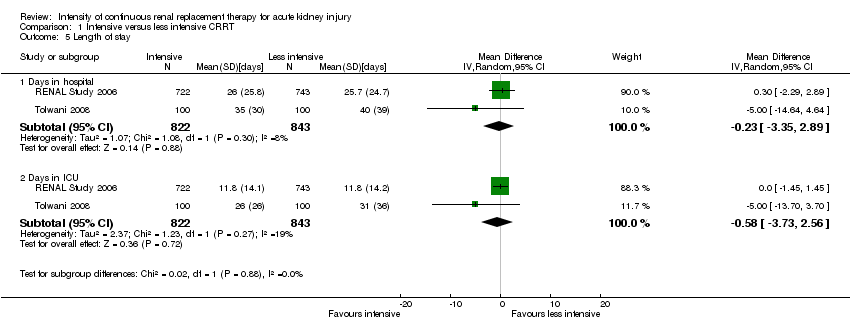
Comparison 1 Intensive versus less intensive CRRT, Outcome 5 Length of stay.

Comparison 1 Intensive versus less intensive CRRT, Outcome 6 Metabolic control.
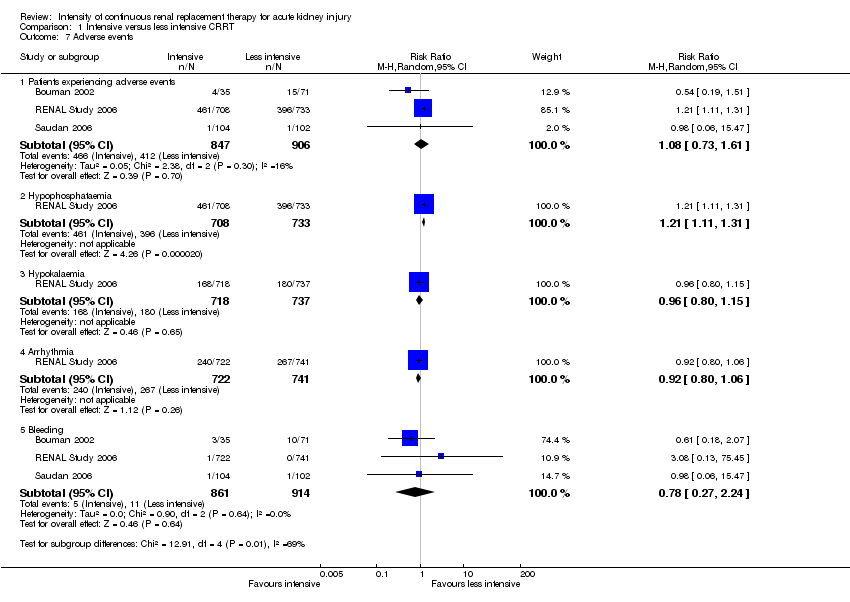
Comparison 1 Intensive versus less intensive CRRT, Outcome 7 Adverse events.
| Intensive versus less intensive CRRT for AKI | ||||||
| Patient or population: patients with AKI | ||||||
| Outcomes | Illustrative comparative risks* (95% CI) | Relative effect | No. of participants | Quality of the evidence | Comments | |
| Assumed risk | Corresponding risk | |||||
| Less intensive CRRT | Intensive CRRT | |||||
| Mortality at day 30 | Study population | RR 0.88 | 2402 (5) | ⊕⊕⊝⊝ | ||
| 430 per 1000 | 420 per 1000 | |||||
| Moderate | ||||||
| Mortality after 30 days post‐randomisation | Study population | RR 0.92 | 2759 (5) | ⊕⊕⊝⊝ | ||
| 514 per 1000 | 483 per 1000 | |||||
| Moderate | ||||||
| 593 per 1000 | 557 per 1000 | |||||
| Patients free of RRT after discontinuing CRRT | Study population | RR 1.12 | 2402 (5) | ⊕⊕⊝⊝ | ||
| 483 per 1000 | 541 per 1000 | |||||
| Moderate | ||||||
| 390 per 1000 | 437 per 1000 | |||||
| Patients free of RRT after discontinuing CRRT | Study population | RR 0.98 | 988 (3) | ⊕⊕⊕⊝ | ||
| 923 per 1000 | 904 per 1000 | |||||
| Moderate | ||||||
| 800 per 1000 | 784 per 1000 | |||||
| Adverse events: hypophosphataemia | Study population | RR 1.21 | 1441 (1) | ⊕⊕⊕⊕ | ||
| 540 per 1000 | 654 per 1000 | |||||
| Moderate | ||||||
| 540 per 1000 | 653 per 1000 | |||||
| *The basis for the assumed risk (e.g. the median control group risk across studies) is provided in footnotes. The corresponding risk (and its 95% confidence interval) is based on the assumed risk in the comparison group and the relative effect of the intervention (and its 95% CI). | ||||||
| GRADE Working Group grades of evidence | ||||||
| ¹ inconsistency: due to substantial heterogeneity (I2 values ranged from 73% to 78%) ² imprecision: due to wide CI which crossed the threshold for clinically meaningful effects ³ Indirectness: critically ill patients with AKI in CRRT have high short‐term mortality risk; mortality is a competing end point for kidney recovery at day 90 | ||||||
| Intensive versus less intensive CRRT for AKI: subgroups | ||||||
| Patient or population: patients with AKI who need CRRT | ||||||
| Outcomes | Illustrative comparative risks* (95% CI) | Relative effect | No. of participants | Quality of the evidence | Comments | |
| Assumed risk | Corresponding risk | |||||
| Standard dose | High dose | |||||
| Mortality: patients with sepsis | Study population | RR 0.94 | 966 (5) | ⊕⊕⊝⊝ | ||
| 524 per 1000 | 492 per 1000 | |||||
| Moderate | ||||||
| 618 per 1000 | 581 per 1000 | |||||
| Mortality: patients without sepsis | Study population | RR 0.89 | 1216 (4) | ⊕⊕⊝⊝ | ||
| 465 per 1000 | 414 per 1000 | |||||
| Moderate | ||||||
| 564 per 1000 | 502 per 1000 | |||||
| Mortality: patients with AKI related to cardiac or general surgery | Study population | RR 0.73 | 531 (2) | ⊕⊕⊕⊕ | ||
| 505 per 1000 | 368 per 1000 | |||||
| Moderate | ||||||
| 459 per 1000 | 335 per 1000 | |||||
| Mortality: patients with AKI not related to surgery | Study population | RR 0.94 | 1871 (3) | ⊕⊕⊝⊝ | ||
| 414 per 1000 | 389 per 1000 | |||||
| Moderate | ||||||
| 550 per 1000 | 517 per 1000 | |||||
| *The basis for the assumed risk (e.g. the median control group risk across studies) is provided in footnotes. The corresponding risk (and its 95% confidence interval) is based on the assumed risk in the comparison group and the relative effect of the intervention (and its 95% CI). | ||||||
| GRADE Working Group grades of evidence | ||||||
| ¹ inconsistency: due to substantial heterogeneity (I2 values ranged from 73% to 78%) ² imprecision: due to wide CI which crossed the threshold for clinically meaningful effects | ||||||
| Outcome or subgroup title | No. of studies | No. of participants | Statistical method | Effect size |
| 1 Mortality Show forest plot | 6 | Risk Ratio (M‐H, Random, 95% CI) | Subtotals only | |
| 1.1 Mortality at day 30 | 5 | 2402 | Risk Ratio (M‐H, Random, 95% CI) | 0.88 [0.71, 1.08] |
| 1.2 Mortality after 30 days post‐randomisation | 5 | 2759 | Risk Ratio (M‐H, Random, 95% CI) | 0.92 [0.80, 1.06] |
| 2 Mortality in prespecified groups Show forest plot | 5 | Risk Ratio (M‐H, Random, 95% CI) | Subtotals only | |
| 2.1 Patients with sepsis | 5 | 966 | Risk Ratio (M‐H, Random, 95% CI) | 0.94 [0.69, 1.27] |
| 2.2 Patients without sepsis | 4 | 1216 | Risk Ratio (M‐H, Random, 95% CI) | 0.89 [0.69, 1.15] |
| 2.3 Patients with SOFA cardiovascular score < 3 | 1 | 404 | Risk Ratio (M‐H, Random, 95% CI) | 0.91 [0.71, 1.18] |
| 2.4 Patients with SOFA cardiovascular ≥ 3 | 1 | 1056 | Risk Ratio (M‐H, Random, 95% CI) | 1.04 [0.92, 1.18] |
| 2.5 Patients with AKI related to surgical causes | 2 | 531 | Risk Ratio (M‐H, Random, 95% CI) | 0.73 [0.61, 0.88] |
| 2.6 Patients with AKI unrelated to surgical causes | 3 | 1871 | Risk Ratio (M‐H, Random, 95% CI) | 0.94 [0.73, 1.20] |
| 3 Recovery of kidney function Show forest plot | 5 | Risk Ratio (M‐H, Random, 95% CI) | Subtotals only | |
| 3.1 Free of RRT after discontinuing CRRT | 5 | 2402 | Risk Ratio (M‐H, Random, 95% CI) | 1.12 [0.91, 1.37] |
| 3.2 Free of RRT after discontinuing CRRT at day 30 | 5 | 1416 | Risk Ratio (M‐H, Random, 95% CI) | 1.03 [0.96, 1.11] |
| 3.3 Free of RRT after discontinuing CRRT at day 90 | 3 | 988 | Risk Ratio (M‐H, Random, 95% CI) | 0.98 [0.94, 1.01] |
| 4 Kidney function recovery in prespecified subgroup Show forest plot | 5 | Risk Ratio (M‐H, Random, 95% CI) | Subtotals only | |
| 4.1 Patients with AKI related to surgical causes | 2 | 531 | Risk Ratio (M‐H, Random, 95% CI) | 1.27 [1.05, 1.53] |
| 4.2 Patients with AKI related to non‐surgical causes | 3 | 1870 | Risk Ratio (M‐H, Random, 95% CI) | 1.12 [0.73, 1.71] |
| 5 Length of stay Show forest plot | 2 | Mean Difference (IV, Random, 95% CI) | Subtotals only | |
| 5.1 Days in hospital | 2 | 1665 | Mean Difference (IV, Random, 95% CI) | ‐0.23 [‐3.35, 2.89] |
| 5.2 Days in ICU | 2 | 1665 | Mean Difference (IV, Random, 95% CI) | ‐0.58 [‐3.73, 2.56] |
| 6 Metabolic control Show forest plot | 1 | Risk Ratio (M‐H, Random, 95% CI) | Totals not selected | |
| 6.1 Normalised metabolic acidosis | 1 | Risk Ratio (M‐H, Random, 95% CI) | 0.0 [0.0, 0.0] | |
| 7 Adverse events Show forest plot | 3 | Risk Ratio (M‐H, Random, 95% CI) | Subtotals only | |
| 7.1 Patients experiencing adverse events | 3 | 1753 | Risk Ratio (M‐H, Random, 95% CI) | 1.08 [0.73, 1.61] |
| 7.2 Hypophosphataemia | 1 | 1441 | Risk Ratio (M‐H, Random, 95% CI) | 1.21 [1.11, 1.31] |
| 7.3 Hypokalaemia | 1 | 1455 | Risk Ratio (M‐H, Random, 95% CI) | 0.96 [0.80, 1.15] |
| 7.4 Arrhythmia | 1 | 1463 | Risk Ratio (M‐H, Random, 95% CI) | 0.92 [0.80, 1.06] |
| 7.5 Bleeding | 3 | 1775 | Risk Ratio (M‐H, Random, 95% CI) | 0.78 [0.27, 2.24] |