Dental cavity liners for Class I and Class II resin‐based composite restorations
Information
- DOI:
- https://doi.org/10.1002/14651858.CD010526.pub2Copy DOI

- Database:
-
- Cochrane Database of Systematic Reviews
- Version published:
-
- 25 October 2016see what's new
- Type:
-
- Intervention
- Stage:
-
- Review
- Cochrane Editorial Group:
-
Cochrane Oral Health Group
- Copyright:
-
- Copyright © 2016 The Cochrane Collaboration. Published by John Wiley & Sons, Ltd.
Article metrics
Altmetric:
Cited by:
Authors
Contributions of authors
Conceiving and designing the review: Andrew B Schenkel conceived and designed the review with significant contributions from Ivy Peltz and Analia Veitz‐Keenan.
Co‐ordinating the review: Andrew B Schenkel.
Screening the search results and retrieving the papers: Andrew B Schenkel and Ivy Peltz with Analia Veitz‐Keenan moderating any disagreements.
Data extraction and risk of bias assessment: Andrew B Schenkel, Analia Veitz‐Keena and Ivy Peltz (as stated in the review).
Analysing the data and interpreting the results: Andrew B Schenkel and Analia Veitz‐Keenan.
Writing the results, discussion, conclusions and abstract: Andrew B Schenkel wrote the protocol and main text with significant contributions from Ivy Peltz and Analia Veitz‐Keenan.
Sources of support
Internal sources
-
New York University College of Dentistry, USA.
External sources
-
Cochrane Oral Health Global Alliance, Other.
The production of Cochrane Oral Health reviews has been supported financially by our Global Alliance since 2011 (oralhealth.cochrane.org/partnerships‐alliances). Contributors over the past year have been the British Association for the Study of Community Dentistry, UK; British Society of Paediatric Dentistry, UK; Canadian Dental Hygienists Association, Canada; Centre for Dental Education and Research at All India Institute of Medical Sciences, India; National Center for Dental Hygiene Research & Practice, USA; New York University College of Dentistry, USA; and NHS Education for Scotland, UK.
-
National Institute for Health Research (NIHR), UK.
This project was supported by the NIHR, via Cochrane Infrastructure funding to Cochrane Oral Health. The views and opinions expressed therein are those of the authors and do not necessarily reflect those of the Systematic Reviews Programme, NIHR, NHS or the Department of Health.
Declarations of interest
Andrew B Schenkel: no interests to declare.
Ivy Peltz: no interests to declare.
Analia Veitz‐Keenan participated in the Strober study as a dental practitioner investigator for the PEARL (Practitioners Engaged in Applied Research and Learning) Network. She did not however, have access to any final collected data and she did not participate in the data extraction and risk of bias analysis for the Stober study in this systematic review.
Acknowledgements
The authors would like to acknowledge the assistance provided by Cochrane Oral Health and in particular, the assistance of our Contact Editor Anne‐Marie Glenny without whose help this review would not have been possible.
Version history
| Published | Title | Stage | Authors | Version |
| 2019 Mar 05 | Dental cavity liners for Class I and Class II resin‐based composite restorations | Review | Andrew B Schenkel, Analia Veitz‐Keenan | |
| 2016 Oct 25 | Dental cavity liners for Class I and Class II resin‐based composite restorations | Review | Andrew B Schenkel, Ivy Peltz, Analia Veitz‐Keenan | |
| 2013 May 31 | Dental cavity liners for Class I and Class II resin‐based composite restorations | Protocol | Andrew B Schenkel, Ivy Peltz, Analia Veitz‐Keenan | |
Differences between protocol and review
This review differs from the protocol in several aspects. In the 'Selection of studies' section the protocol states "Full‐text copies of all eligible and potentially eligible studies will be obtained and these will be further evaluated in detail by two review authors (AS and IP) to identify those studies which actually meet all the inclusion criteria. A third review author will moderate any disagreement (AVK)." Due to time constraints and other personal obligations author Ivy Peltz (IP) was unable to evaluate in detail the full‐texts of the eligible and potentially eligible studies. This role was taken on by author Analia Veitz‐Keenan (AVK) and author IP served to moderate any disagreement between authors Andrew Schenkel (AS) and AVK.
Additionally, for developing the 'Summary of findings' table for the 'Presentation of main results' section, two review authors (AS and IP) planned to extract the findings from each of the included studies and the third review author was expected to moderate any disagreement (AVK). However, this was not explicitly stated in the protocol. Nevertheless, due to time constraints and other personal obligations author IP was unable to complete the extraction of the findings from each of the included studies. This aspect of the data extraction was taken on by author AVK and author IP was available to moderate any disagreement between authors AS and AVK.
Also, this review was intended to be limited to postoperative hypersensitivity (POH) after two weeks; however, no studies reported any data for this time frame (recall interval). Therefore this review included one month POH data which was the time frame most often reported.
Keywords
MeSH
Medical Subject Headings (MeSH) Keywords
- *Composite Resins;
- Dental Caries [classification, surgery];
- Dental Cavity Lining [*instrumentation];
- Dental Restoration Failure [statistics & numerical data];
- *Dental Restoration, Permanent [adverse effects, classification];
- Dentin Sensitivity [epidemiology, etiology, *prevention & control];
- Pain, Postoperative [*prevention & control];
- Randomized Controlled Trials as Topic;
- *Thermal Conductivity;
Medical Subject Headings Check Words
Adolescent; Adult; Humans;
PICOs

Risk of bias summary: review authors' judgements about each risk of bias item for each included study.
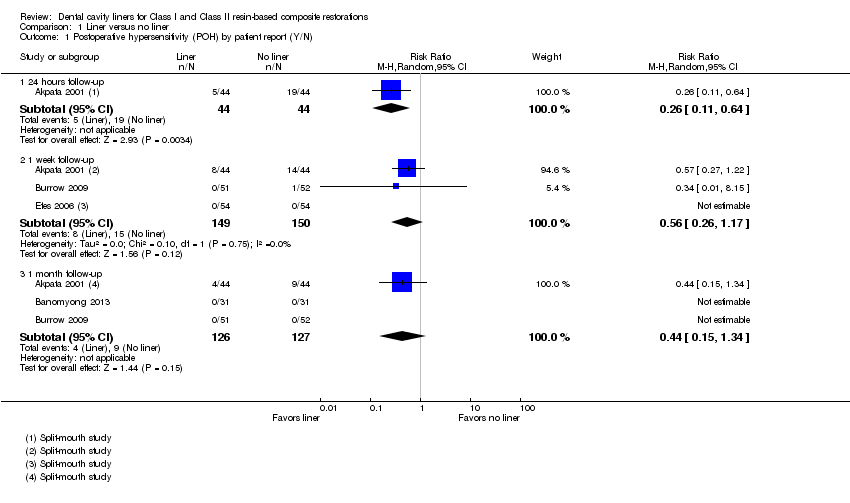
Comparison 1 Liner versus no liner, Outcome 1 Postoperative hypersensitivity (POH) by patient report (Y/N).

Comparison 1 Liner versus no liner, Outcome 2 Postoperative hypersensitivity (POH) by patient report (VAS).

Comparison 1 Liner versus no liner, Outcome 3 Cold response measurement (CRM) (time it took in seconds for patient to feel cold sensation).

Comparison 1 Liner versus no liner, Outcome 4 Cold response measurement (CRM) (VAS).

Comparison 1 Liner versus no liner, Outcome 5 Cold response measurement (CRM) (Y/N).

Comparison 1 Liner versus no liner, Outcome 6 Restoration failure at 1 year follow‐up.
| Liner versus no liner for Class I and Class II resin‐based composite restorations | ||||||
| Patient or population: Patients requiring Class I or Class II resin‐based composite restorations Settings: General practice Intervention: Liner Comparison: No liner | ||||||
| Outcomes | Illustrative comparative risks* (95% CI) | Relative effect | Number of restorations | Quality of the evidence | Comments | |
| Assumed risk* | Corresponding risk | |||||
| No liner | Liner | |||||
| Postoperative hypersensitivity (POH) (Patient‐reported Y/N) Follow‐up: 1 week | 100 per 1000 | 56 per 1000 | RR 0.56 | 299 | ⊕⊕⊝⊝1 | POH was also measured at 24 hours (1 trial at high risk of bias) and 1 month (3 trials at high/unclear risk of bias). A benefit in favour of liners was shown at 24 hours; this difference was not maintained at any other time point 1 additional high risk of bias study measured patient‐reported POH using VAS. A benefit was shown in favour of liners at 1 week and 1 month follow‐up |
| Postoperative cold response measurement (CRM) (time it took in seconds for patient to feel cold sensation) Follow‐up: 1 week | The mean postoperative CRM at 1 week (time it took in seconds for patient to feel cold sensation) was 16 seconds | MD 6 seconds more | 88 | ⊕⊕⊝⊝2 | CRM was also measured at 24 hours (1 trial at high risk of bias) and 1 month (1 trial at high risk of bias). No difference was shown between the use of liners and no liners at either time point Other methods of measuring CRM (using VAS or Y/N response) showed no difference between liners and no liners at any time point | |
| Restoration failure Follow‐up: 1 year | 7 per 1000 | 7 per 1000 | RR 1.00 | 281 | ⊕⊕⊝⊝1 | Restoration failure at 2‐year follow‐up also showed no difference between the use of liners or not |
| Adverse events | None reported | |||||
| *The basis for the assumed risk (e.g. the median control group risk across studies) is provided in footnotes. The corresponding risk (and its 95% CI) is based on the assumed risk in the comparison group and the relative effect of the intervention (and its 95% CI) | ||||||
| GRADE Working Group grades of evidence | ||||||
| *Assumed risk based on control group risk. | ||||||
| Outcome or subgroup title | No. of studies | No. of participants | Statistical method | Effect size |
| 1 Postoperative hypersensitivity (POH) by patient report (Y/N) Show forest plot | 4 | Risk Ratio (M‐H, Random, 95% CI) | Subtotals only | |
| 1.1 24 hours follow‐up | 1 | 88 | Risk Ratio (M‐H, Random, 95% CI) | 0.26 [0.11, 0.64] |
| 1.2 1 week follow‐up | 3 | 299 | Risk Ratio (M‐H, Random, 95% CI) | 0.56 [0.26, 1.17] |
| 1.3 1 month follow‐up | 3 | 253 | Risk Ratio (M‐H, Random, 95% CI) | 0.44 [0.15, 1.34] |
| 2 Postoperative hypersensitivity (POH) by patient report (VAS) Show forest plot | 1 | Mean Difference (IV, Random, 95% CI) | Totals not selected | |
| 2.1 1 week follow‐up | 1 | Mean Difference (IV, Random, 95% CI) | 0.0 [0.0, 0.0] | |
| 2.2 1 month follow‐up | 1 | Mean Difference (IV, Random, 95% CI) | 0.0 [0.0, 0.0] | |
| 3 Cold response measurement (CRM) (time it took in seconds for patient to feel cold sensation) Show forest plot | 1 | Mean Difference (IV, Random, 95% CI) | Totals not selected | |
| 3.1 24 hours follow‐up | 1 | Mean Difference (IV, Random, 95% CI) | 0.0 [0.0, 0.0] | |
| 3.2 1 week follow‐up | 1 | Mean Difference (IV, Random, 95% CI) | 0.0 [0.0, 0.0] | |
| 3.3 1 month follow‐up | 1 | Mean Difference (IV, Random, 95% CI) | 0.0 [0.0, 0.0] | |
| 4 Cold response measurement (CRM) (VAS) Show forest plot | 2 | Mean Difference (IV, Random, 95% CI) | Subtotals only | |
| 4.1 1 week follow‐up | 2 | 447 | Mean Difference (IV, Random, 95% CI) | ‐0.20 [‐0.67, 0.26] |
| 4.2 1 month follow‐up | 2 | 444 | Mean Difference (IV, Random, 95% CI) | ‐0.33 [‐0.76, 0.11] |
| 5 Cold response measurement (CRM) (Y/N) Show forest plot | 1 | Risk Ratio (M‐H, Random, 95% CI) | Totals not selected | |
| 5.1 1 week follow‐up | 1 | Risk Ratio (M‐H, Random, 95% CI) | 0.0 [0.0, 0.0] | |
| 5.2 1 month follow‐up | 1 | Risk Ratio (M‐H, Random, 95% CI) | 0.0 [0.0, 0.0] | |
| 6 Restoration failure at 1 year follow‐up Show forest plot | 4 | 281 | Risk Ratio (M‐H, Random, 95% CI) | 1.0 [0.07, 15.00] |