Recubrimiento para las caries dentales en las restauraciones de clase I y clase II con composite basado en resina
Resumen
Antecedentes
El composite basado en resina (CBR) se acepta en la actualidad como un material viable para la restauración de caries en los dientes permanentes posteriores que requieren tratamiento quirúrgico. A pesar de que la conductibilidad térmica del material de restauración del CBR se acerca bastante a la de la estructura del diente natural, la hipersensibilidad posoperatoria continúa siendo en ocasiones un problema. Los recubrimientos para las caries dentales se han utilizado históricamente para proteger la pulpa de los efectos tóxicos de algunos materiales de restauración dentales y para prevenir el dolor de la conductibilidad térmica cuando se coloca una capa aislante entre el material restaurativo y la estructura restante del diente.
Objetivos
El objetivo de esta revisión fue evaluar los efectos de la utilización de recubrimientos para las caries dentales en las restauraciones posteriores de Clase I y Clase II, con composite basado en resina, en dientes permanentes de niños y adultos.
Métodos de búsqueda
El especialista en información del Grupo Cochrane de Salud Oral (Cochrane Oral Health Group) buscó en las siguientes bases de datos: registro de ensayos del Grupo Cochrane de Salud Oral (Cochrane Oral Health's Trials Register) (hasta el 25 mayo 2016), Registro Cochrane Central de Ensayos Controlados (Cochrane Central Register of Controlled Trials)(CENTRAL; 2016, número 4) en la Cochrane Library (búsqueda 25 mayo 2016), MEDLINE Ovid (1946 hasta 25 mayo 2016), Embase Ovid (1980 hasta 25 mayo 2016) y en LILACS BIREME Virtual Health Library (Latin American and Caribbean Health Science Information database; 1982 hasta 25 mayo 2016). Se hicieron búsquedas de ensayos en curso en ClinicalTrials.gov y en la World Health Organization International Clinical Trials Registry Platform. No se impusieron restricciones de idioma o fecha de publicación en la búsqueda en las bases de datos electrónicas.
Criterios de selección
Se incluyeron ensayos controlados aleatorios que evalúan los efectos de la utilización de recubrimientos debajo de las restauraciones posteriores de Clase I y Clase II con composite basado en resina en dientes permanentes (tanto en adultos como en niños). Se incluyeron diseños paralelos y de boca dividida.
Obtención y análisis de los datos
Se usaron los procedimientos metodológicos normales prescritos por Cochrane para la recopilación y el análisis de datos. Dos revisores examinaron los resultados de la búsqueda y evaluaron la elegibilidad de los estudios para la inclusión sobre la base de los criterios de inclusión de la revisión. Se realizaron evaluaciones del riesgo de sesgo y extracción de datos de forma independiente y por duplicado. Cuando la información no estaba clara, se contactó con los autores de los estudios para obtener aclaraciones.
Resultados principales
Ocho estudios, con más de 700 participantes, compararon el uso de los recubrimientos para las caries dentales a ningún recubrimiento para las restauraciones de Clase I y Clase II con composite basado en resina.
Siete estudios evaluaron la hipersensibilidad posoperatoria medida con diversos métodos. Todos los estudios presentaban un riesgo de sesgo incierto o alto. Hubo pruebas inconsistentes que consideraron la hipersensibilidad posoperatoria (medida con respuesta al frío o informada por el paciente), con efectos beneficiosos demostrados en algunos, pero no todos, los momentos de medición (pruebas de baja calidad).
Cuatro ensayos midieron la duración de la restauración. Dos de los estudios se consideraron de alto riesgo y dos con riesgo de sesgo incierto. No se observaron diferencias en las tasas de fracaso de la restauración en el seguimiento un año más tarde, y no se informaron fracasos en ninguno de los grupos para tres de los cuatro estudios; el cuarto estudio tenía un cociente de riesgos (CR) 1,00 (intervalo de confianza [IC] del 95%: 0,07 a 15,00) (pruebas de baja calidad). Tres estudios evaluaron la duración de la restauración a dos años de seguimiento y, nuevamente, no se observó ningún fracaso en ninguno de los grupos.
No se informaron eventos adversos en ninguno de los estudios incluidos.
Conclusiones de los autores
Hay pruebas inconsistentes de baja calidad con respecto a la diferencia en la hipersensibilidad posoperatoria después de la colocación de un recubrimiento para la caries dental en las restauraciones posteriores de Clase I y Clase II, con composite basado en resina, en los dientes permanentes posteriores de adultos o niños a partir de los 15 años de edad. Además, no se encontraron pruebas que demostraran una diferencia en la duración de las restauraciones con o sin recubrimientos para las caries dentales.
PICOs
Resumen en términos sencillos
Recubrimientos para las caries dentales debajo de obturaciones de resina del color del diente, colocados en los dientes permanentes en la parte posterior de la boca
Pregunta de la revisión
Esta revisión se realizó para evaluar los efectos del uso de los recubrimientos debajo de las obturaciones, con resina de color del diente, de las caries sobre la superficie de mordida (Clase I) y la superficie de mordida y los lados (Clase II) de dientes permanentes en la parte posterior de la boca en niños y adultos.
Antecedentes
La caries dental es la enfermedad más común que afecta a niños y adultos de todo el mundo. Si no se trata, el ácido producido por las bacterias en la biocapa o placa dental forma caries u orificios en los dientes. Pueden utilizarse varias técnicas y diversos materiales para restaurar u obturar los dientes afectados por la caries. Uno de estos materiales es el composite basado en resina, del color del diente, o CBR. Este material se usa cada vez más como alternativa a la amalgama (una mezcla de partículas de aleación metálica y mercurio).
Desde el siglo XIX, con frecuencia se vienen colocando recubrimientos en las caries dentales por debajo del material de relleno. Se piensa que los recubrimientos protegen el tejido vivo de la pulpa del diente de los materiales de relleno y también de la posibilidad de permitir más calor o frío que el diente natural. Aunque se piensa que los materiales de relleno de CBR son similares al material natural de los dientes en cuanto a la conducción del calor, en ocasiones la sensibilidad al cambio de temperatura aún sigue siendo un problema para los pacientes después del tratamiento.
Características de los estudios
Las pruebas de esta revisión, realizada por los autores de la Grupo Cochrane de Salud Oral, están actualizadas al 25 de mayo de 2016.
Se incluyeron ocho estudios, con más de 700 participantes. Dos estudios se realizaron en los Estados Unidos, dos en Tailandia, dos en Alemania y uno en Arabia Saudita y Turquía. Los estudios compararon el uso de los recubrimientos debajo de las obturaciones de resina de color del diente (CBR) en los dientes permanentes de la parte posterior de la boca con ningún recubrimiento para las obturaciones de Clase I y Clase II. Uno de los dos estudios de los EE.UU. tuvo lugar en consultorios dentales; los otros en escuelas universitarias de Odontología. Todos los participantes tenían más de 15 años de edad.
Resultados clave
Se encontraron muy pocas pruebas para demostrar que un recubrimiento debajo de las obturaciones con CBR de Clase I y II en dientes permanentes de la parte posterior de la boca reduce la hipersensibilidad en adultos o niños desde los 15 años de edad. No se encontraron pruebas que indicaran que hubo diferencias en la duración de las obturaciones cuando se colocaron con o sin recubrimiento de la caries.
Calidad de la evidencia
El conjunto de pruebas identificado en esta revisión no permite establecer conclusiones sólidas acerca de los efectos de los recubrimientos para las caries dentales. La calidad de las pruebas identificadas en esta revisión es baja, y hay una falta de confianza en los cálculos del efecto. Además, no se encontraron pruebas para demostrar una diferencia en el tiempo de duración de las restauraciones una vez aplicadas, con o sin recubrimientos para las caries dentales.
Authors' conclusions
Summary of findings
| Liner versus no liner for Class I and Class II resin‐based composite restorations | ||||||
| Patient or population: Patients requiring Class I or Class II resin‐based composite restorations Settings: General practice Intervention: Liner Comparison: No liner | ||||||
| Outcomes | Illustrative comparative risks* (95% CI) | Relative effect | Number of restorations | Quality of the evidence | Comments | |
| Assumed risk* | Corresponding risk | |||||
| No liner | Liner | |||||
| Postoperative hypersensitivity (POH) (Patient‐reported Y/N) Follow‐up: 1 week | 100 per 1000 | 56 per 1000 | RR 0.56 | 299 | ⊕⊕⊝⊝1 | POH was also measured at 24 hours (1 trial at high risk of bias) and 1 month (3 trials at high/unclear risk of bias). A benefit in favour of liners was shown at 24 hours; this difference was not maintained at any other time point 1 additional high risk of bias study measured patient‐reported POH using VAS. A benefit was shown in favour of liners at 1 week and 1 month follow‐up |
| Postoperative cold response measurement (CRM) (time it took in seconds for patient to feel cold sensation) Follow‐up: 1 week | The mean postoperative CRM at 1 week (time it took in seconds for patient to feel cold sensation) was 16 seconds | MD 6 seconds more | 88 | ⊕⊕⊝⊝2 | CRM was also measured at 24 hours (1 trial at high risk of bias) and 1 month (1 trial at high risk of bias). No difference was shown between the use of liners and no liners at either time point Other methods of measuring CRM (using VAS or Y/N response) showed no difference between liners and no liners at any time point | |
| Restoration failure Follow‐up: 1 year | 7 per 1000 | 7 per 1000 | RR 1.00 | 281 | ⊕⊕⊝⊝1 | Restoration failure at 2‐year follow‐up also showed no difference between the use of liners or not |
| Adverse events | None reported | |||||
| *The basis for the assumed risk (e.g. the median control group risk across studies) is provided in footnotes. The corresponding risk (and its 95% CI) is based on the assumed risk in the comparison group and the relative effect of the intervention (and its 95% CI) | ||||||
| GRADE Working Group grades of evidence | ||||||
| *Assumed risk based on control group risk. | ||||||
Background
Description of the condition
Dental caries is a condition in which a tooth has been subjected to a demineralization process that can lead to a carious lesion and eventually to a cavity in the tooth. Demineralization is due to an acidic environment created by the metabolic by‐products of certain bacteria (Fejerskov 2003). Dental caries is currently the most prevalent disease in the world, affecting 60% to 90% of the school‐aged population in low‐income, middle‐income and high‐income countries and almost all of the adults in most countries (Petersen 2003; Petersen 2005). Caries prevalence varies significantly from country to country with some of the low‐income countries having the lowest caries rates (Edelstein 2006). This is thought to be due to the maintenance of a traditional diet with lower sugar consumption and lower levels of urbanization in the poorest, low‐income countries (Diehnelt 2001). As these poorest countries begin to develop, urbanization and sugar consumption increase and a rise in caries prevalence is seen (Diehnelt 2001). Caries prevalence also varies significantly within individual low‐income, middle‐income and high‐income countries with people having the lowest education levels, the lowest socioeconomic status and those living in poverty having the highest prevalence (Selwitz 2007).
Dental caries can be classified by location and extent of the lesions produced by the demineralization. The most common classification system is the one created by GV Black that assigns a classification to the lesion based on its location on the tooth. In this system, a lesion located in the pits and fissures (grooves) of the occlusal (biting) surface of a tooth is considered a Class I lesion, and a lesion located on a proximal (in between) surface of a posterior tooth is considered a Class II lesion (Black 1924). Once a carious lesion has developed to the point where it must be restored, the traditional method of restoring the lesion is to surgically remove the caries using a dental drill and filling the resulting cavity with a restorative material. The most common materials currently in use for the permanent restoration of carious lesions in posterior teeth are dental amalgam and resin‐based composite.
Description of the intervention
Resin‐based composite (RBC) is currently accepted as a viable material for the restoration of caries for posterior permanent teeth requiring surgical treatment (Demarco 2012). These materials are formulated to be placed into the prepared tooth cavity in a soft, viscous state, and then made to harden through a process known as polymerization. Polymerization can be initiated by one of two methods. In the first method, a catalyst is mixed with a base, and chemical activation hardens the material. In the second method, the material is formulated to harden via light activation. The light‐activated materials have the advantages of setting more quickly, of not having to be mixed and of giving the operator control over when the material will harden. Since the 19th century, dental materials have been developed and used to protect the pulp by being placed between the tooth structure and the restorative material (Harris 1863). Liners are purported to protect the pulp from the toxic effects of some dental restorative materials and to prevent the pain of thermal conductivity by placing an insulating layer between restorative material and the remaining tooth structure (Roberson 2006). Like liners, sealers are sometimes advocated to reduce thermal sensitivity under metallic restorations. However, while it is possible to place a resin‐based composite without a liner, sealers are an integral part of the technique of placing an RBC restoration, since the sealer is used to bond the material to the tooth structure. Both liners and sealers can also be light cured or chemically cured.
Despite the fact that the thermal conductivity of the RBC restorative material closely approximates that of natural tooth structure, postoperative thermal sensitivity is sometimes still an issue (Briso 2007). The liners most commonly used in restorative dentistry include calcium hydroxide and glass ionomer cements, both of which are available in either chemical or light‐cured formulations. Current evidence indicates that posterior composite restorative dental materials are likely to be very well tolerated by the pulp, and that significant adverse reactions are most likely the result of the presence of bacteria and their by‐products (Summitt 2006). Even when the placement of liners is limited to the deeper restorations, their clinical benefits may not live up to their theoretical value (Unemori 2007).
How the intervention might work
Current theories regarding postoperative tooth sensitivity following the placement of RBC restorations are based on microleakage as the cause either directly by hydrodynamic flow of fluid through the dentinal tubules or from bacterial by‐products reaching the pulp through the tubules (Summitt 2006). Liners are advocated to provide a better seal of the tubules in order to reduce or eliminate postoperative sequelae (Murray 2001). Liners are also sometimes advocated to stimulate favorable pulpal reactions underneath restorations in close proximity to the pulpal tissue (Murray 2002). However, overall there is little clinical evidence linking the use of liners to a reduction in postoperative sensitivity (Wegehaupt 2009). Liners placed for the purpose of pulpal protection are thought to medicate the pulpal tissue, causing sedation and hopefully stimulation of reparative dentin formation (Roberson 2006). Calcium hydroxide liners are most frequently advocated for the deepest restorations due to their high pH, which stimulates the formation of reparative dentin (Murray 2002a). Zinc oxide eugenol liners are most frequently advocated due to their sedative effect on pulpal tissue but are not commonly used under RBCs (Murray 2001). Liners placed for the purpose of reducing postoperative sensitivity are thought to better seal the dentinal tubules than bonding the RBC restoration directly to tooth structure. The improved seal would reduce microleakage and prevent or reduce the hydrodynamic flow of fluid through the tubules, subsequently preventing or reducing the by‐products of bacterial activity from reaching the pulp (Summitt 2006).
Why it is important to do this review
Dentists frequently choose the materials and the techniques they use in practice based on the education and clinical experiences they receive while in school (Lynch 2006). However, survey results show that there is significant variation in what is being taught in dental schools, both within and among different countries across the globe, regarding the placement of liners underneath RBC restorations (Castillo‐de Oyagüe 2012; Gordan 2000; Hayashi 2009; Liew 2011; Lynch 2006; Lynch 2006a; Lynch 2006b; Lynch 2007; Lynch 2007a; Lynch 2011; Sadeghi 2009; Wilson 2000). All of the surveys reviewed asked similar questions, and responses were obtained for preparations that were shallow (outer one‐third of dentin), moderate (middle one‐third of dentin), and deep (inner one‐third of dentin). The surveys revealed that for shallow preparations dental school faculty members do not typically recommend a liner. Approximately half of the respondents advocated the placement of liners for moderate preparations. The majority of respondents did advocate the placement of liners for deep preparations, but some controversy remains. In fact, some dental educators contend that the placement of liners (as opposed to the direct bonding of the RBC to the tooth) is not beneficial, and may be detrimental, even in the restoration of deep caries (Castillo‐de Oyagüe 2012; Gordan 2000; Hayashi 2009; Lynch 2006; Lynch 2006a; Lynch 2006b; Lynch 2007; Lynch 2007a; Lynch 2011; Sadeghi 2009; Wilson 2000). There is some evidence that the placement of a liner underneath an RBC restoration shortens the life expectancy of that restoration significantly (Demarco 2012). This may be due to the fact that the lining material does not bond to tooth structure or does not bond well to RBC allowing greater microleakage. The liners reported on in these surveys were exclusively calcium hydroxide and glass ionomer cement. In 2002 Deliperi and Bardwell suggested the use of flowable composite as a cavity liner in order to "reduce marginal discoloration, recurrent caries and postoperative sensitivity, and potentially improve longevity of these Class I and Class II RBC restorations" (Deliperi 2002). The surveys revealed that no dental school curricula incorporated the use of flowable composite as a liner. One of the few clinical studies conducted on the subject showed no improvement in restoration performance by placing a flowable composite liner under a Class II RBC (Efes 2006).
Whenever possible, the most biocompatible, longest lasting restorations should be utilized in the restoration of defective or missing tooth structure. While much time, effort and expense is spent researching, developing, manufacturing, testing, marketing, and placing dental cavity liners, little evidence exists as to whether or not these materials are effective. This review has compiled the evidence regarding the effectiveness of cavity liners for the translation into practice, thus assisting in the creation of an evidence‐based rationale for the use of cavity liners.
Objectives
To assess the effects of using dental cavity liners in the placement of Class I and Class II resin‐based composite posterior restorations in permanent teeth in children and adults.
Methods
Criteria for considering studies for this review
Types of studies
All studies included were randomised controlled clinical trials comparing the use of liners under Class I and Class II posterior resin‐based composite restorations in permanent teeth. We included both parallel and split‐mouth designs.
We excluded studies examining:
-
bases;
-
amalgam or any other metallic restorations;
-
any indirect restorations;
-
anterior restorations;
-
liners in vitro.
Types of participants
Adults or children with at least one restoration in a posterior permanent tooth/teeth undergoing a Class I or Class II resin‐based composite restoration(s).
Types of interventions
Any type of dental cavity liner placed under a Class I or Class II resin‐based composite restoration on a posterior tooth was considered, including but not limited to calcium hydroxide, glass ionomer, resin‐modified glass ionomer, flowable composite, zinc phosphate cement, zinc and eugenol cement . The comparison group in included trials received Class I or Class II resin‐based composite restoration on a posterior tooth directly bonded to the tooth without the use of a dental cavity liner.
Types of outcome measures
Primary outcomes
-
Postoperative hypersensitivity to hot, cold, biting, chewing, and/or sweets experienced by the patient within one month following the intervention. Postoperative hypersensitivity could be measured by a visual analog scale (VAS) or by hypersensitivity present or absent as tested by dentist or patient self‐report.
-
Restoration failure. Survival time of the resin‐based composite restoration (in months) from the time of placement with a minimum follow‐up of one year.
Secondary outcomes
-
Cost of materials.
-
Adverse events: pulpal involvement, tooth fracture, hypersensitivity reactions to the materials, etc. or any other adverse event described in any of the studies.
Search methods for identification of studies
Electronic searches
Cochrane Oral Health's Information Specialist conducted systematic searches in the following databases for randomised controlled trials and controlled clinical trials. There were no language, publication year or publication status restrictions:
-
Cochrane Oral Health's Trials Register (searched 25 May 2016) (Appendix 1);
-
Cochrane Central Register of Controlled Trials (CENTRAL; 2016, Issue 4) in the Cochrane Library (searched 25 May 2016) (Appendix 2);
-
MEDLINE Ovid (1946 to 25 May 2016) (Appendix 3);
-
Embase Ovid (1980 to 25 May 2016) (Appendix 4);
-
LILACS BIREME Virtual Health Library (Latin American and Caribbean Health Science Information database; 1982 to 25 May 2016) (Appendix 5).
Subject strategies were modelled on the search strategy designed for MEDLINE Ovid. Where appropriate, they were combined with subject strategy adaptations of the highly sensitive search strategy designed by Cochrane for identifying randomised controlled trials and controlled clinical trials as described in the Cochrane Handbook for Systematic Reviews of Interventions Chapter 6 (Lefebvre 2011).
Searching other resources
We searched the following trial registries for ongoing studies:
-
US National Institutes of Health Ongoing Trials Register ClinicalTrials.gov (clinicaltrials.gov; searched 25 May 2016) (Appendix 6);
-
World Health Organization International Clinical Trials Registry Platform (apps.who.int/trialsearch; searched 25 May 2016) (Appendix 6).
The reference lists of relevant articles were checked and we contacted known experts in the field.
We did not perform a separate search for adverse effects of interventions used. We considered adverse effects described in included studies only.
Data collection and analysis
Selection of studies
Two review authors (Andrew Schenkel (AS) reviewed all and Ivy Peltz (IP)) and Analia Veitz‐Keenan (AVK) each reviewed some) screened titles and abstracts from the electronic searches to identify potentially eligible studies, which required further evaluation to determine whether they met the inclusion criteria for this review. No language restrictions were imposed. The third review author moderated any disagreement as appropriate (either IP or AVK). Full‐text copies of all eligible and potentially eligible studies were obtained and these were further evaluated in detail by two review authors (AS reviewed all and IP or AVK reviewed some) to identify those studies which actually met all the inclusion criteria. The third review author moderated any disagreement (AVK or IP as appropriate). From this group, we recorded those studies not meeting the inclusion criteria in the excluded studies section of the review and the reasons for exclusion were noted in the 'Characteristics of excluded studies' table. A PRISMA flow chart was created to summarize this process.
Data extraction and management
A form was created for data extraction. The form included the author, the date, the journal, the type of trial, the type of randomization (sample size, allocation concealment, masking, and dropouts), the type of intervention, the comparison, outcomes reported, duration of the trial, and funding details. Two review authors extracted the data independently from each study (AS from all and IP or AVK from some). The third review author (AVK or IP as appropriate) moderated any disagreements.
The form also included the following categories.
-
Conducted in: (country).
-
Number of centers.
-
Setting.
-
Number of participants recruited.
-
Recruitment period.
-
Inclusion criteria.
-
Exclusion criteria.
-
Number of participants randomized.
-
Number of patients evaluated.
-
Study design.
-
Parallel‐group.
-
Split‐mouth study.
-
-
Type(s) of treatment(s) and control intervention(s).
-
Type of liner(s).
-
Treatment and control interventions.
-
Mode of administration of intervention(s) and control(s).
-
When were outcomes measured.
-
Duration of follow‐up.
-
Were groups comparable at baseline.
-
Were there any co‐interventions.
-
Any other issues.
Assessment of risk of bias in included studies
We followed the assessment of risk of bias suggested by the Cochrane Handbook for Systematic Reviews of Interventions (Higgins 2011) and utilised the two‐part tool, addressing the seven specific key domains (sequence generation, allocation concealment, blinding of participants and personnel, blinding of outcome assessment, incomplete outcome data, selective outcome reporting and 'other bias') as described in the Cochrane Handbook for Systematic Reviews of Interventions. For each domain in the tool we included one or more specific entry in a 'Risk of bias' table. Within each entry, the first part of the tool described what was reported to have happened in the study in sufficient detail to support a judgment about the risk of bias. The second part of the tool assigned a judgment of 'low risk' of bias, 'high risk' of bias, or 'unclear risk' of bias regarding the risk of bias for that domain.
The domains of sequence generation, allocation concealment, selective outcome reporting and 'other bias' were each addressed in the tool by a single entry for each study. For blinding of participants and personnel, blinding of outcome assessment and for incomplete outcome data, two or more entries could be used because assessments generally need to be made separately for different outcomes (or for the same outcome at different time points). We made an overall judgment of 'low risk' of bias for a study when any plausible bias across all seven domains was unlikely to have altered the results. We made an overall judgment of 'unclear risk' of bias for a study when any plausible bias across one or more of the key domains raises some doubt that it may have altered the results. We made an overall judgment of 'high risk' of bias for a study when any plausible bias across one or more of the key domains seriously weakened our confidence in the results reported in that study.
Two review authors conducted the assessment of risk of bias independently and in duplicate (AS for all studies and IP or AVK for some studies). The third review author (AVK or IP as appropriate) moderated any disagreements. For each included study we presented a 'Risk of bias' table as described in the Cochrane Handbook for Systematic Reviews of Interventions. We also included a 'Risk of bias summary' graph as described in the Cochrane Handbook for Systematic Reviews of Interventions (Higgins 2011).
Measures of treatment effect
For dichotomous outcomes, we presented the estimate of treatment effect of an intervention as a risk ratio (sensitivity present/not present) together with the 95% confidence interval. For continuous outcomes (such as mean VAS scores), we used mean differences and standard deviations to summarize the data for each trial. We considered each category of sensitivity separately if there were enough data from included studies or pooled together as one category if there were not enough separate data. We standardised VAS scales of different lengths as a result.
Unit of analysis issues
Where the unit of randomization was a tooth, a trial participant was permitted to contribute more than one tooth to the study. This clustering of teeth within an individual was accounted for in the analysis of the outcomes in order to avoid unit of analysis errors. If it had been unclear from the reports of included trials whether clustering had been considered, we would have contacted authors to clarify how this dependence had been accounted for in the analysis.
Where repeated measures were made (e.g. sensitivity measurements over weeks), we considered time points of up to 30 days after restoration placement likely to provide the most clinically meaningful data for postoperative hypersensitivity.
Dealing with missing data
In cases of missing or incomplete data, we attempted to contact the study authors.
Assessment of heterogeneity
We assessed heterogeneity by inspection of the point estimates and confidence intervals on the forest plots. We assessed the variation in treatment effects by means of Cochran's test for heterogeneity and the I2 statistic. We considered heterogeneity statistically significant if the P value was < 0.1. A rough guide to the interpretation of the I2 statistic given in the Cochrane Handbook for Systematic Reviews of Interventions is: 0% to 40% might not be important, 30% to 60% may represent moderate heterogeneity, 50% to 90% may represent substantial heterogeneity, and 75% to 100% may represent considerable heterogeneity (Higgins 2011).
Assessment of reporting biases
If there had been more than 10 studies in one outcome we would have constructed a funnel plot in order to look for evidence of publication bias.
Data synthesis
Where studies of similar comparisons reporting the same outcome measures were included, we combined these in a meta‐analysis. We combined risk ratios for dichotomous data, and mean differences for continuous data, using random‐effects models, provided there were more than three studies in the meta‐analysis.
Treatment effects from split‐mouth trials were combined with those from parallel‐group trials where appropriate using the generic inverse variance method incorporated in Review Manager (RevMan) (RevMan 2014). Where this was not appropriate we have presented a narrative synthesis.
Subgroup analysis and investigation of heterogeneity
The following subgroups would have been investigated, if data had allowed.
-
Different types of liners.
-
Different depths of caries.
Sensitivity analysis
Had sufficient trials been identified, we would have conducted sensitivity analysis including only those trials at low risk of bias.
Presentation of main results
We developed a 'Summary of findings' table for the primary outcomes of this review following GRADE methods (GRADE 2004) and using GRADEproGDT software (GRADEproGDT 2014). The quality of the body of evidence was assessed with reference to the overall risk of bias of the included studies, the directness of the evidence, the inconsistency of the results, the precision of the estimates, the risk of publication bias, and the magnitude of the effect. We categorised the quality of the body of evidence for each of the primary outcomes as high, moderate, low or very low.
Results
Description of studies
See 'Characteristics of included studies' and 'Characteristics of excluded studies' tables.
Results of the search
The electronic searches identified a total of 1300 references of which 453 proved to be duplicates. Other sources identified three additional references to make a total of 850 records that were screened. Two review authors independently screened these titles and abstracts (where available). From these, we identified 27 reports of trials as potentially eligible according to the defined inclusion criteria for this review with regard to study design, participants, and interventions. We obtained full‐text copies of these 27 reports, and after further evaluation, we excluded 18 of these studies. We recorded the reasons for exclusion of these 18 studies in the 'Characteristics of excluded studies' table. Eight studies (nine reports) (Akpata 2001; Banomyong 2013; Boeckler 2012; Browning 2006; Burrow 2009; Efes 2006; Strober 2013; Wegehaupt 2009) met the inclusion criteria for this review. This process is presented as a flow chart in Figure 1.
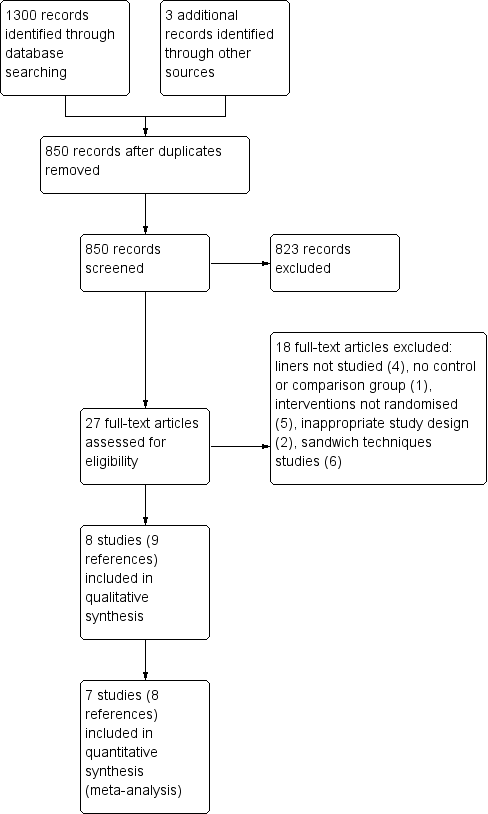
Study flow diagram.
Included studies
Characteristics of the trial settings and investigators
Three of the eight included studies were designed as split‐mouth studies (Akpata 2001; Boeckler 2012; Efes 2006). The remaining five were parallel‐group studies (Banomyong 2013; Browning 2006; Burrow 2009; Strober 2013; Wegehaupt 2009). Of the eight included studies, two were conducted in the USA (Browning 2006; Strober 2013), two in Thailand (Banomyong 2013; Burrow 2009), two in Germany (Boeckler 2012; Wegehaupt 2009), and one each in Saudi Arabia (Akpata 2001) and Turkey (Efes 2006).
Only two studies provided funding information (Boeckler 2012; Strober 2013). Boeckler 2012 was conducted in a university‐based dental school setting and funding was provided by Ivoclar Vivadent. Strober 2013 was conducted in 28 private dental practices that were part of a practice‐based research network in the USA, and funding was provided by grant U01‐DE016755, which was awarded to the College of Dentistry, New York University, New York City, by the National Institute of Dental and Craniofacial Research, National Institutes of Health, Bethesda, USA. The other six studies (Akpata 2001; Banomyong 2013; Browning 2006; Burrow 2009; Efes 2006; Wegehaupt 2009) were conducted in university‐based dental school settings. It is possible that these studies may have received institutional funding.
Sample size calculations were reported in only one of the included trials (Strober 2013).
Characteristics of the participants
All included trials were conducted in patients with solely adult dentition. Trials recruited between 44 and 351 participants, with a mean of 99 participants per trial. However, the largest study (Strober 2013) considerably skews this mean. Removing the largest study from this calculation yields a mean of 64 participants for the remaining seven studies.
The participants all needed restorations placed due to primary or secondary carious lesions in one or more permanent teeth. Six studies specified moderate to large sized lesions (Banomyong 2013; Browning 2006; Burrow 2009; Efes 2006; Strober 2013; Wegehaupt 2009), one study included small or moderately large (bucco‐lingual dimension up to half the inter‐cuspal width) sized lesions (Akpata 2001) and one study included lesions of any size without limitations (Boeckler 2012). One study (Akpata 2001) included only male participants while all other studies including both males and females.
Characteristics of outcome measures
Primary outcomes
Seven of the included trials evaluated postoperative hypersensitivity (POH) measured by various methods (Akpata 2001; Banomyong 2013; Boeckler 2012; Burrow 2009; Efes 2006; Strober 2013; Wegehaupt 2009). Five studies measured POH via a yes/no patient report (Akpata 2001; Banomyong 2013; Burrow 2009; Efes 2006; Wegehaupt 2009). Two studies measured POH via a cold response measurement (CRM) on a visual analog scale (VAS) (Burrow 2009; Strober 2013). One study (Akpata 2001) measured POH via CRM in time (seconds) and one study (Burrow 2009) measured POH via a yes/no CRM. One study (Boeckler 2012) measured POH via CRM using subjective descriptive patient response criteria at baseline, six months, one and two years. This study found two restorations in the intervention group (liner) and two restorations in the control group (no liner) exhibiting significant POH at baseline but no subjects reported any POH at six months, one year or two years. No discussion of these results was included in this study. These data were not included in any analyses in this review since this review is limited to POH measured up to one month postoperatively.
Four of the included trials measured restoration longevity (Banomyong 2013; Boeckler 2012; Browning 2006; Efes 2006).
Secondary outcomes
We listed cost of materials and adverse events (pulpal involvement, tooth fracture, hypersensitivity reactions to the materials, etc. or any other adverse event described in any of the studies) as secondary outcomes that we would include in this review. No adverse events were reported in any of the included studies. Authors of one study indicated that they would report adverse events but no adverse events were reported (Strober 2013). Strober 2013 stated that an adverse event was considered to be "lingering pain upon removal of the stimulus". None of the other included studies made any mention of any adverse events. Only one study (Strober 2013) included cost. (See 'Effects of interventions' section for their analysis.)
Excluded studies
See 'Characteristics of excluded studies' table for information on each excluded study.
We obtained full‐text copies of the following 18 studies, which appeared from their titles and abstracts to be eligible for inclusion. Evaluation of these trials resulted in their exclusion from this review for the following reasons.
-
No control or comparison group included in the trial (one report: Huth 2003).
-
Inappropriate study design in the trial (two reports: Rasmusson 1998a; Whitworth 2005b).
-
Liners were not studied in the trial (four reports: Akpata 2006; Fagundes 2009; Loguercio 2001; Shi 2010).
-
Not actually a randomized controlled trial (five reports: Ernst 2002; Ernst 2003; Kaurani 2007; Noro 1983; Unemori 20011).
-
Restorative 'sandwich' techniquec utilized in the trial (six reports: Andersson‐Wenckert 2002; Andersson‐Wenckert 2004; Grogono 1990; Knibbs 1992; van Dijken 1999; Vilkinis 2000).
aThis study compared one brand of resin‐based composite placed without a liner to a second brand of resin‐based composite placed with a flowable composite as a liner.
bThe decision of which restoration to place (composite or amalgam) was left to the discretion of the operator, and information regarding how this decision was made was not provided.
cThe placement of a restoration utilizing the 'sandwich' technique has many similarities to the placement of a restoration utilizing a cavity liner under a resin‐based composite material. The techniques differ significantly, however, in that the resin‐modified glass ionomer (RMGI) placed under the resin composite in the 'sandwich' technique is much thicker and extends out to the cavo‐surface margin at the gingival margin of the Class II restoration ('open sandwich' technique). This requires the RMGI material to perform the same function as the resin‐based composite in this area. This is a much different function from RMGI liners (or any liners) placed entirely beneath a resin‐based composite restoration and not exposed to the oral cavity. Even in the 'closed sandwich' technique, where the RMGI is not brought out to the cavo‐surface margin, the extra thickness of RMGI alone does not qualify it to be considered a liner.
Risk of bias in included studies
We assessed five studies as being at overall high risk of bias (Akpata 2001; Banomyong 2013; Browning 2006; Burrow 2009; Strober 2013). The remaining three studies were at unclear risk of bias (Boeckler 2012; Efes 2006; Wegehaupt 2009) (Figure 2).

Risk of bias summary: review authors' judgements about each risk of bias item for each included study.
Allocation
Random sequence generation
We deemed four studies to have adequate sequence generation and therefore we classified them as being at low risk of bias for this domain (Boeckler 2012; Burrow 2009; Strober 2013; Wegehaupt 2009). We judged the remaining four studies as being at unclear risk of bias for this domain because they gave no information other than that they were 'randomized' (Akpata 2001; Banomyong 2013; Browning 2006; Efes 2006).
Allocation concealment
Two studies employed adequate methods of allocation concealment. We therefore classified them as being at low risk of bias for this domain (Burrow 2009; Strober 2013). The remaining six studies did not mention allocation concealment, so we classified them as being at unclear risk of bias for this domain (Akpata 2001; Banomyong 2013; Boeckler 2012; Browning 2006; Efes 2006; Wegehaupt 2009).
Blinding
Performance bias ‐ Blinding of participants and personnel
Four studies were deemed to have adequate blinding of participants (Banomyong 2013; Browning 2006; Burrow 2009; Wegehaupt 2009). The remaining four studies gave no information regarding blinding of the participants (Akpata 2001; Boeckler 2012; Efes 2006; Strober 2013).
It is important to note that blinding of personnel was not possible for the types of trials included in this review. In all cases, the operator placing the restoration was aware of whether or not a liner had been placed under the restoration. The impact of this lack of blinding was felt to be unclear in all studies. In those studies in which the operators and the outcome assessors were the same persons, the risk of bias was considered to be high for detection bias, but not necessarily for performance bias.
Detection bias ‐ Blinding of outcome assessors
We deemed four studies to have adequate blinding of outcome assessors and therefore we classified them as being at low risk of bias for this domain (Akpata 2001; Boeckler 2012; Browning 2006; Efes 2006). Three studies were judged as being at high risk of bias for this domain because the outcome assessor and the operator placing the restoration were the same person (Banomyong 2013; Burrow 2009; Strober 2013). As previously stated, there is no way to blind the operator in this type of study. Since the operator and the outcome assessor were the same person and the operator could not be blinded, the outcome assessor also could not have been adequately blinded since she or he might have remembered which restoration had the liner and which restoration did not. The remaining study did not provide any information regarding blinding of outcome assessors so we classified it as being at unclear risk of bias for this domain (Wegehaupt 2009). Additionally, we judged Strober 2013 to be at high risk of bias for this domain because we question the protocol of the study regarding data collection and recording. Practice‐based network studies are typically conducted in an actual dental office setting as opposed to an artificially controlled clinical setting such as a dental school. Often, a single dentist in the practice serves as the 'practitioner‐investigator' (P‐I). The P‐I is frequently the only dentists in the practice and must perform all the tasks required for the study, providing no opportunity for blinding of the outcome assessor. In these cases, the P‐I would examine and evaluate each subject and his/her carious lesions for exclusion or inclusion and would also place the restorations, with or without the liner, and evaluate all the restorations at all intervals and record all data. In Strober 2013 it was specifically reported that this was the case. This protocol may affect the risk of bias for this and all practice‐based network studies.
Incomplete outcome data
We deemed six studies to have adequate outcome data and therefore we classified them as being at low risk of bias for this domain (Akpata 2001; Boeckler 2012; Burrow 2009; Efes 2006; Strober 2013; Wegehaupt 2009). We judged the remaining two studies as being at high risk of bias for this domain, one because of a high number of dropouts (Banomyong 2013) and the other because the authors gave no information regarding how the missing data were treated (Browning 2006).
Selective reporting
All eight studies were deemed to have adequate outcome data reported and therefore we classified all eight studies as being at low risk of bias for this domain.
Other potential sources of bias
We deemed seven studies to have no other potential sources of bias and therefore classified them as being at low risk of bias for this domain (Banomyong 2013; Boeckler 2012; Browning 2006; Burrow 2009; Efes 2006; Strober 2013; Wegehaupt 2009). We judged one study as being at high risk of bias for this domain because that study did not utilize a validated instrument to measure patient‐reported sensitivity (Akpata 2001).
Effects of interventions
See: Summary of findings for the main comparison
Liner versus no liner
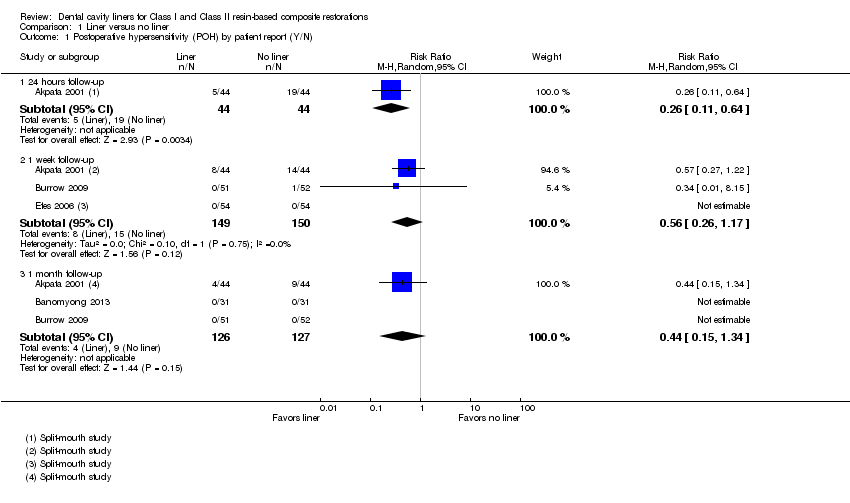
Postoperative hypersensitivity (POH) ‐ Patient‐reported
Five studies, three of which were at high risk of bias, measured POH using a dichotomous yes/no patient report (Akpata 2001; Banomyong 2013; Burrow 2009; Efes 2006; Wegehaupt 2009).
In one study (n = 88; high risk of bias) patient‐reported dichotomous data on POH at 24 hours showed a reduced risk of hypersensitivity in the liner group (risk ratio (RR) 0.26; 95% confidence interval (CI) 0.11 to 0.64) (Analysis 1.1). This difference was not shown at one week or one month follow‐up (Analysis 1.1) (Akpata 2001).
One study (n = 344), at high risk of bias, presented visual analog scale (VAS) results for patient‐reported POH at one week and one month (Strober 2013). A lower mean VAS score was shown in favour of the liner group at both time points (mean difference (MD) ‐0.33; 95% CI ‐0.43 to ‐0.23 and MD ‐0.20; 95% CI ‐0.31 to ‐0.09 respectively) (Analysis 1.2).
An additional study (Wegehaupt 2009) instructed patients to record "whether any hypersensitivity, pain, or discomfort occurred following treatment." Nine of 75 patients in the liner group and 12 of 48 patients that did not receive a liner responded "yes" when asked if any hypersensitivity, pain, or discomfort occurred after the restoration was placed. Based on these data they concluded that the occurrence of pain or hypersensitivity does not depend on the remaining dentin thickness, calcium hydroxide lining, or the restorative system used. There was no information regarding when this POH occurred.
Postoperative hypersensitivity (POH) ‐ Cold response measurement (CRM)
One study (n = 88; high risk of bias) measured POH via CRM in time (seconds) (Akpata 2001). While a beneficial effect was seen in favor of cavities prepared using a liner at one week assessment (MD 6.00; 95% CI 1.36 to 10.64), this difference was not seen at any other time point (24 hours or one month) (Analysis 1.3).
Two studies (n = 447; high risk of bias) measured POH via a cold response measurement on a VAS (Burrow 2009; Strober 2013). No difference between cavities prepared with and without liners were shown at either one week (MD ‐0.20; 95% CI ‐0.67 to 0.26) or one month follow‐up (MD ‐0.33; 95% CI ‐0.76 to 0.11) (Analysis 1.4).
Burrow 2009 also measured POH via a yes/no CRM. Again, no difference between cavities prepared with and without liners were shown at either one week (Analysis 1.5).
An additional study (Boeckler 2012) measured POH via CRM using subjective descriptive patient‐response criteria at baseline, six months, one and two years. This study found two restorations in the intervention group (liner) and two restorations in the control group (no liner) exhibiting significant POH at baseline but no subjects reported any POH at six months, one or two years. No data for POH measured up to one month postoperatively were reported.
Restoration failure
Four of the included trials measured restoration longevity (Banomyong 2013; Boeckler 2012; Browning 2006; Efes 2006). Two of the studies were judged to be at high risk and two at unclear risk of bias. No difference in restoration failure rates was shown at one year follow‐up, with no failures reported in either group for three of the four studies; the fourth study had a RR 1.00 (95% CI 0.07 to 15.00). Three studies evaluated restoration longevity at two years follow‐up and, again, no failures were shown in either group (Analysis 1.6).
Cost
Only one study (Strober 2013) included cost. Strober 2013 concluded that dentists in the United States could save approximately USD 4.50 per filling in materials and office overhead costs by eliminating a resin‐modified glass ionomer lining under resin composite restorations. The authors calculated that this would result in a saving of approximately USD 2000 per dentist per year for an annual saving of approximately USD 82.8 million in the United States.
Adverse events
No adverse events were reported in any of the included studies. Only one study indicated that adverse events would be reported; however, no such report was included in the findings (Strober 2013). Strober 2013 stated that they considered an adverse event to be "lingering pain upon removal of the stimulus." None of the other included studies made any mention of any adverse events.
Discussion
Summary of main results
Eight studies, recruiting over 700 participants compared the use of dental cavity liners to no liners for Class I and Class II resin‐based composite restorations. All studies were at unclear or high risk of bias. There was inconsistent evidence regarding postoperative hypersensitivity (either measured using cold response or patient‐reported), with a benefit shown at some, but not all, time points (low‐quality evidence).
Four trials measured restoration longevity. Two of the studies were judged to be at high risk and two at unclear risk of bias. No difference in restoration failure rates was shown at one year follow‐up, with no failures reported in either group for three of the four studies; the fourth study had a risk ratio (RR) 1.00 (95% confidence interval (CI) 0.07 to 15.00) (low‐quality evidence). Three studies evaluated restoration longevity at two years follow‐up and, again, no failures were shown in either group.
No adverse events were reported in any of the included studies.
Overall completeness and applicability of evidence
There is limited available evidence on the effects of using a dental cavity liner beneath Class I and Class II resin‐based composite restorations. The evidence identified is applicable when placing composite‐based restorations in posterior teeth of adult patients. None of the trials evaluated the effects of using a dental cavity liner in the permanent teeth of children under the age of 15. Thus, it may not be appropriate to apply this evidence to permanent teeth in younger children.
Quality of the evidence
The body of evidence identified in this review does not allow for robust conclusions about the effects of dental cavity liners. The quality of the evidence for each outcome was considered to be of low quality due to only single studies reporting certain outcomes/time points, a high/unclear risk of bias in the individual studies and imprecision in the pooled estimate. A GRADE rating of low‐quality evidence can be interpreted as meaning that there is a lack of confidence in the effect estimates. Further research is very likely to change these estimates, and our confidence in them.
Potential biases in the review process
Searching of multiple databases, with no language or date restrictions, was intended to limit bias by including all relevant studies. Some studies did not have usable data, and this introduces bias into the review as it distorts our overall view of the effects of dental cavity liners.
Agreements and disagreements with other studies or reviews
To the best knowledge of these review authors, no studies have been conducted showing any significant benefit to the placement of any dental cavity liner under Class I and Class II resin‐based composite posterior restorations in permanent teeth in children and adults either in terms of postoperative hypersensitivity reduction, restoration longevity or any other benefit. To our knowledge, no other systematic reviews have been published on this topic. Our findings are similar to a recently published systematic review investigating the effects of a dental cavity liner under Class I and Class II resin‐based composite posterior restorations in primary teeth in children (Schwendicke 2015).
Risk of bias summary: review authors' judgements about each risk of bias item for each included study.
Comparison 1 Liner versus no liner, Outcome 1 Postoperative hypersensitivity (POH) by patient report (Y/N).

Comparison 1 Liner versus no liner, Outcome 2 Postoperative hypersensitivity (POH) by patient report (VAS).

Comparison 1 Liner versus no liner, Outcome 3 Cold response measurement (CRM) (time it took in seconds for patient to feel cold sensation).

Comparison 1 Liner versus no liner, Outcome 4 Cold response measurement (CRM) (VAS).

Comparison 1 Liner versus no liner, Outcome 5 Cold response measurement (CRM) (Y/N).

Comparison 1 Liner versus no liner, Outcome 6 Restoration failure at 1 year follow‐up.
| Liner versus no liner for Class I and Class II resin‐based composite restorations | ||||||
| Patient or population: Patients requiring Class I or Class II resin‐based composite restorations Settings: General practice Intervention: Liner Comparison: No liner | ||||||
| Outcomes | Illustrative comparative risks* (95% CI) | Relative effect | Number of restorations | Quality of the evidence | Comments | |
| Assumed risk* | Corresponding risk | |||||
| No liner | Liner | |||||
| Postoperative hypersensitivity (POH) (Patient‐reported Y/N) Follow‐up: 1 week | 100 per 1000 | 56 per 1000 | RR 0.56 | 299 | ⊕⊕⊝⊝1 | POH was also measured at 24 hours (1 trial at high risk of bias) and 1 month (3 trials at high/unclear risk of bias). A benefit in favour of liners was shown at 24 hours; this difference was not maintained at any other time point 1 additional high risk of bias study measured patient‐reported POH using VAS. A benefit was shown in favour of liners at 1 week and 1 month follow‐up |
| Postoperative cold response measurement (CRM) (time it took in seconds for patient to feel cold sensation) Follow‐up: 1 week | The mean postoperative CRM at 1 week (time it took in seconds for patient to feel cold sensation) was 16 seconds | MD 6 seconds more | 88 | ⊕⊕⊝⊝2 | CRM was also measured at 24 hours (1 trial at high risk of bias) and 1 month (1 trial at high risk of bias). No difference was shown between the use of liners and no liners at either time point Other methods of measuring CRM (using VAS or Y/N response) showed no difference between liners and no liners at any time point | |
| Restoration failure Follow‐up: 1 year | 7 per 1000 | 7 per 1000 | RR 1.00 | 281 | ⊕⊕⊝⊝1 | Restoration failure at 2‐year follow‐up also showed no difference between the use of liners or not |
| Adverse events | None reported | |||||
| *The basis for the assumed risk (e.g. the median control group risk across studies) is provided in footnotes. The corresponding risk (and its 95% CI) is based on the assumed risk in the comparison group and the relative effect of the intervention (and its 95% CI) | ||||||
| GRADE Working Group grades of evidence | ||||||
| *Assumed risk based on control group risk. | ||||||
| Outcome or subgroup title | No. of studies | No. of participants | Statistical method | Effect size |
| 1 Postoperative hypersensitivity (POH) by patient report (Y/N) Show forest plot | 4 | Risk Ratio (M‐H, Random, 95% CI) | Subtotals only | |
| 1.1 24 hours follow‐up | 1 | 88 | Risk Ratio (M‐H, Random, 95% CI) | 0.26 [0.11, 0.64] |
| 1.2 1 week follow‐up | 3 | 299 | Risk Ratio (M‐H, Random, 95% CI) | 0.56 [0.26, 1.17] |
| 1.3 1 month follow‐up | 3 | 253 | Risk Ratio (M‐H, Random, 95% CI) | 0.44 [0.15, 1.34] |
| 2 Postoperative hypersensitivity (POH) by patient report (VAS) Show forest plot | 1 | Mean Difference (IV, Random, 95% CI) | Totals not selected | |
| 2.1 1 week follow‐up | 1 | Mean Difference (IV, Random, 95% CI) | 0.0 [0.0, 0.0] | |
| 2.2 1 month follow‐up | 1 | Mean Difference (IV, Random, 95% CI) | 0.0 [0.0, 0.0] | |
| 3 Cold response measurement (CRM) (time it took in seconds for patient to feel cold sensation) Show forest plot | 1 | Mean Difference (IV, Random, 95% CI) | Totals not selected | |
| 3.1 24 hours follow‐up | 1 | Mean Difference (IV, Random, 95% CI) | 0.0 [0.0, 0.0] | |
| 3.2 1 week follow‐up | 1 | Mean Difference (IV, Random, 95% CI) | 0.0 [0.0, 0.0] | |
| 3.3 1 month follow‐up | 1 | Mean Difference (IV, Random, 95% CI) | 0.0 [0.0, 0.0] | |
| 4 Cold response measurement (CRM) (VAS) Show forest plot | 2 | Mean Difference (IV, Random, 95% CI) | Subtotals only | |
| 4.1 1 week follow‐up | 2 | 447 | Mean Difference (IV, Random, 95% CI) | ‐0.20 [‐0.67, 0.26] |
| 4.2 1 month follow‐up | 2 | 444 | Mean Difference (IV, Random, 95% CI) | ‐0.33 [‐0.76, 0.11] |
| 5 Cold response measurement (CRM) (Y/N) Show forest plot | 1 | Risk Ratio (M‐H, Random, 95% CI) | Totals not selected | |
| 5.1 1 week follow‐up | 1 | Risk Ratio (M‐H, Random, 95% CI) | 0.0 [0.0, 0.0] | |
| 5.2 1 month follow‐up | 1 | Risk Ratio (M‐H, Random, 95% CI) | 0.0 [0.0, 0.0] | |
| 6 Restoration failure at 1 year follow‐up Show forest plot | 4 | 281 | Risk Ratio (M‐H, Random, 95% CI) | 1.0 [0.07, 15.00] |