| Dose | CIC 80 μg BID vs. FP 88 μg BID | CIC 160 μg OD vs. FP 88 μg BID | CIC 80 μg BID vs. FP 88 μg BID | CIC 160 μg OD vs. FP 88 μg BID | CIC 80 μg OD vs. FP 88 μg BID |
| Dose ratio | 1:1 | 1:1 | 1:1 | 1:1 | 1:2 |
| Study | Pedersen 2006 | Pedersen 2009 | Hiremath 2006 | Paunovic 2010 | Pedersen 2009 |
| Primary outcomes | |
| Asthma symptoms: asthma symptom score | Median difference (Hodges Lehmann point estimate) ITT and PP: 0.00, 95% CI ‐0.29 to 0.14 | Median difference (Hodges Lehmann point estimate) Unclear if ITT or PP *: 0.07, 95% CI ‐0.14 to 0.28 Non‐inferiority acceptance limit = 0.30 sum score | Not assessed | Asthma symptom score decreased and was similar in both groups | Median difference (Hodges Lehmann point estimate) Unclear if ITT or PP **: 0.07, 95% CI ‐0.14 to 0.28 Non‐inferiority acceptance limit = 0.30 sum score |
| Asthma symptoms: use of rescue medication | Median difference (Hodges Lehmann point estimate) ITT and PP: 0.00, 95% CI ‐1.23 to 2.12 | Median change from baseline (Hodges Lehmann point estimate) ITT: CIC: ‐1.13; FP: ‐1.29 PP: CIC: ‐1.14; FP: ‐1.29 All P < 0.0001 | Not assessed | Use of rescue medication decreased and was similar in both groups | Median change from baseline (Hodges Lehmann point estimate) ITT: CIC: ‐1.20; FP: ‐1.29 PP: CIC: ‐1.21; FP: ‐1.29 All P < 0.0001 |
| Asthma symptoms: a sthma symptom‐free days | Median difference (Hodges Lehmann point estimate) ITT: ‐1.01, 95% CI ‐4.60 to 2.46 PP: ‐1.01, 95% CI ‐4.82 to 2.51 | Not assessed | Not assessed | Not assessed | Not assessed |
| Asthma symptoms: % of asthma symptom and rescue medication‐free days combined | Not assessed | Mean percentage was high and did not differ significantly between the treatment groups (PP) | Median CIC: 91.5%; FP: 94% P = 0.1320 (2‐sided between treatments) | Not assessed | PP: mean percentage was high and did not differ between the treatment groups |
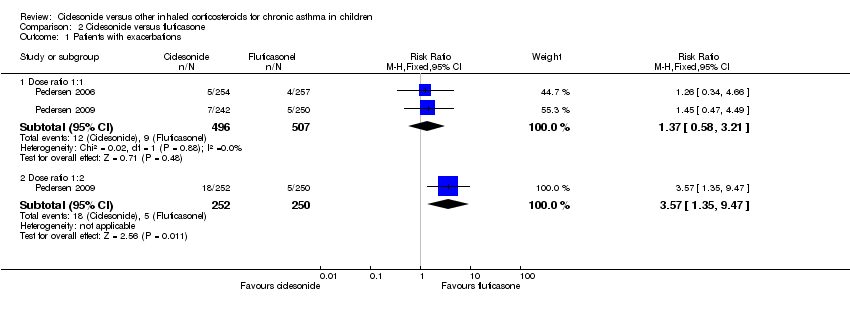
| Exacerbations: number of patients with exacerbations | RR 1.26, 95% CI 0.34 to 4.66; Analysis 2.1 | RR 1.45, 95% CI 0.47 to 4.49; Analysis 2.1 | Not assessed | CIC: 2.3%; FP: 2.2% | RR 3.57, 95% CI 1.35 to 9.47; Analysis 2.1 |
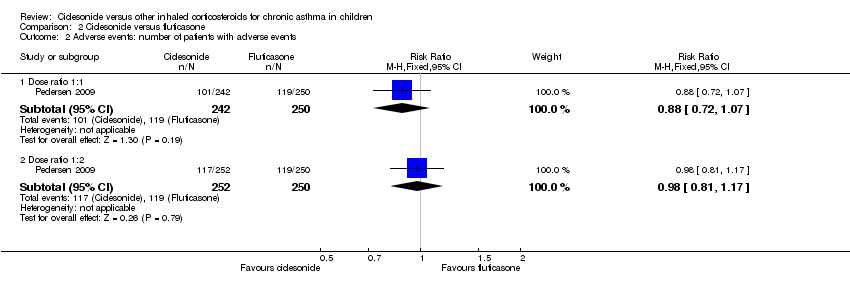
| Adverse events: % of patients with adverse events | A similar percentage of patients reported adverse events | RR 0.88, 95% CI 0.72 to 1.07; Analysis 2.2 | The incidence of adverse events was similar in both groups | Not assessed | RR 0.98, 95% CI 0.81 to 1.17; Analysis 2.2 |
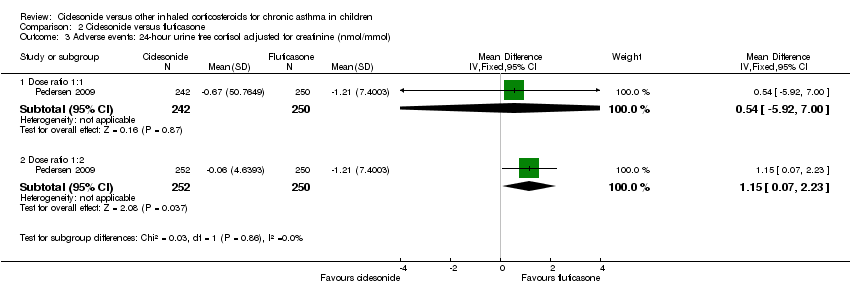
| Adverse events: cortisol 24‐hour urine sample (nmol/mmol) | ITT: difference between 2 groups was not statistically significant ITT and restricted ITT (which included only those urine cortisol measurements with a corresponding urine creatinine value within the normal range) A statistically significant difference in favour of CIC was seen in the restricted ITT analysis (P = 0.006). The findings were similar for patients who were ICS‐naive and patients who had received ICS prior to study entry although the differences were numerically greater in previously ICS‐naive patients | Safety analysis**: MD 0.54 nmol/mmol, 95% CI ‐5.92 to 7.00; Analysis 2.3 | Not assessed | Not assessed | Safety analysis**: MD 1.15 nmol/mmol, 95% CI 0.07 to 2.23; Analysis 2.3 |
| Secondary outcomes | |
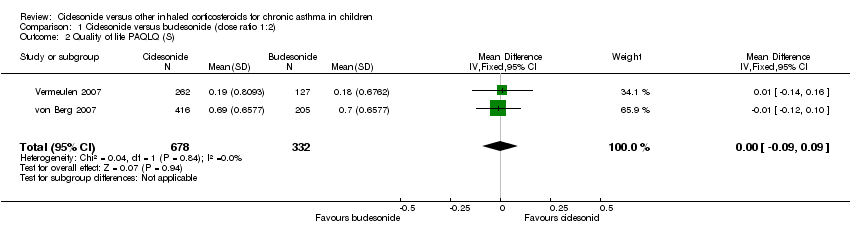
| Quality of life: PAQLQ | Not assessed | ITT and PP: Non‐inferiority was confirmed CIC 160 compared to FP (P < 0.0001, one‐sided) Non‐inferiority limit = ‐0.5 | Not assessed | Not assessed | ITT and PP: Non‐inferiority was confirmed for CIC80 compared to FP (P < 0.0001, one‐sided) Non‐inferiority limit = ‐0.5 |
| Quality of life: PACQLQ | Not assessed | ITT and PP: Non‐inferiority was confirmed CIC 160 compared to FP (P < 0.0001, one‐sided) Non‐inferiority limit = 15 | Not assessed | Not assessed | ITT and PP: Non‐inferiority was confirmed for CIC80 compared to FP (P < 0.0001, one‐sided) Non‐inferiority limit = 15 |
| Compliance | Not assessed | Not assessed | Not assessed | Not assessed | Not assessed |
| Change in lung function: FEV1 (L) | ITT: MD (least square means) 0.0 L, 95% CI ‐0.042 to 0.042; Analysis 2.4 PP: MD (least square means) 0.001, 95% ‐0.044 to 0.046 | ITT: MD (least square means) ‐0.02 L, 95% CI ‐0.07 to 0.04; Analysis 2.4 PP: MD (least square means) ‐0.026, 95% CI ‐0.086 to 0.34 | Improvement similar between groups no point estimates | Improvement similar between groups no point estimates | ITT: MD (least square means) ‐0.05 L, 95% CI ‐0.11 to 0.01; Analysis 2.4 PP: MD (least square means) ‐0.056, 95% CI ‐0.12 to ‐0.004 |
| Airway inflammation | Not assessed | Not assessed | Not assessed | Not assessed | Not assessed |