Ciclesonide versus other inhaled corticosteroids for chronic asthma in children
Information
- DOI:
- https://doi.org/10.1002/14651858.CD010352Copy DOI

- Database:
-
- Cochrane Database of Systematic Reviews
- Version published:
-
- 28 February 2013see what's new
- Type:
-
- Intervention
- Stage:
-
- Review
- Cochrane Editorial Group:
-
Cochrane Airways Group
- Copyright:
-
- Copyright © 2013 The Cochrane Collaboration. Published by John Wiley & Sons, Ltd.
Article metrics
Altmetric:
Cited by:
Authors
Contributions of authors
SFK: conception and design of study, and analysis and the interpretation of data. Drafting the review. Final approval of the document to be published.
BLR: drafting the review and commenting on it critically for intellectual content. Final approval of the document to be published.
RPJMS: drafting the review and commenting on it critically for intellectual content. Final approval of the document to be published.
NB: drafting the review and commenting on it critically for intellectual content. Final approval of the document to be published.
Sources of support
Internal sources
-
SFK used to be a staff member of the Dutch Cochrane Centre and is now a staff member of the Australasian Cochrane Centre, Australia.
Received salary
External sources
-
NB Dutch Quality Fund for Medical Specialists (SKMS), Netherlands.
Declarations of interest
None declared.
Acknowledgements
We are grateful to the staff of the editorial base of the Cochrane Airways Group for providing assistance in running searches and obtaining papers.
We would like to acknowledge the authors of the previous review: P. Manning (initiation of protocol; assessment of studies, data extraction, write up), P.G. Gibson (protocol development, write up, contact editor) and T. Lasserson (assessment of studies, data extraction, data entry and analysis, write up) for their excellent work. The results of their efforts formed the basis of this review.
Version history
| Published | Title | Stage | Authors | Version |
| 2013 Feb 28 | Ciclesonide versus other inhaled corticosteroids for chronic asthma in children | Review | Sharon Kramer, Bart L Rottier, Rob JPM Scholten, Nicole Boluyt | |
Differences between protocol and review
This review is a result of an amendment of a review published in 2009 by Manning assessing the effect of ciclesonide compared to other ICS in adults and children. In this review we only focused on a population younger than 18 years of age. We based the methods of this review on the methods of the review of Manning 2009 and apart from the change of population of interest we made some additional changes. Our primary outcomes were asthma symptoms, exacerbations and adverse effect. We did not include surrogate measures of lung function as our primary outcome since this is not an outcome that is regarded as relevant to patients, but this outcome was included as one of our secondary outcomes.
In the earlier review, study quality was assessed using the Jadad scale. We assessed risk of bias using The Cochrane Collaboration's 'Risk of bias' tool. Studies identified in the earlier review were re‐assessed. Furthermore, we provide 'Summary of findings' tables according to GRADE for primary outcomes.
For the planning of exploring heterogeneity we did not use any cut of points based on values of the I2 statistics, but decisions would have been based on combined information of I2, Chi2, study characteristics and sample size of individual studies. Additional subgroups were pre‐defined to explore heterogeneity including subgroups according to age (< six years and ≥ six years), asthma severity, dose of ciclesonide and delivery device (identical or different devices used for ciclesonide and BDP/budesonide/fluticasone) as well as inhalation manoeuvre.
Keywords
MeSH
Medical Subject Headings (MeSH) Keywords
- Adrenal Cortex Hormones [*administration & dosage, adverse effects];
- Androstadienes [administration & dosage, adverse effects];
- Anti‐Asthmatic Agents [*administration & dosage, adverse effects];
- Asthma [*drug therapy];
- Budesonide [administration & dosage, adverse effects];
- Fluticasone;
- Pregnenediones [*administration & dosage, adverse effects];
- Randomized Controlled Trials as Topic;
Medical Subject Headings Check Words
Adolescent; Child; Child, Preschool; Humans;
PICOs
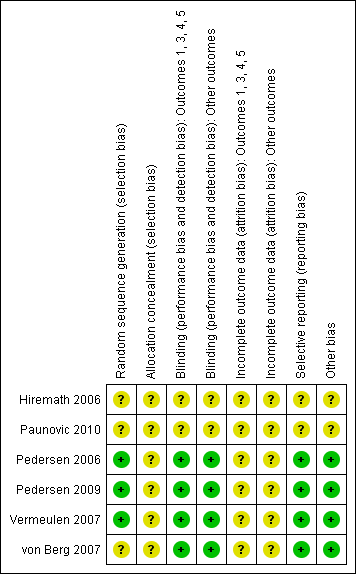
Risk of bias summary: review authors' judgements about each risk of bias item for each included study.

Comparison 1 Ciclesonide versus budesonide (dose ratio 1:2), Outcome 1 Patients with exacerbations.
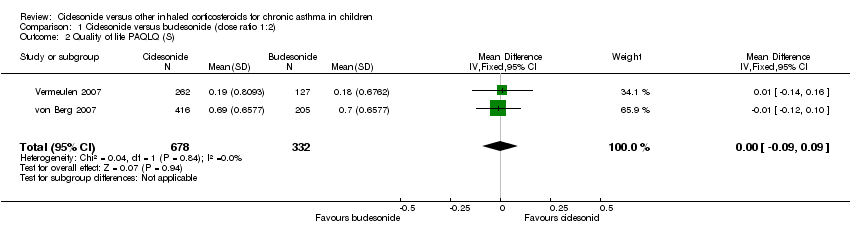
Comparison 1 Ciclesonide versus budesonide (dose ratio 1:2), Outcome 2 Quality of life PAQLQ (S).

Comparison 1 Ciclesonide versus budesonide (dose ratio 1:2), Outcome 3 FEV1 least square means (L).
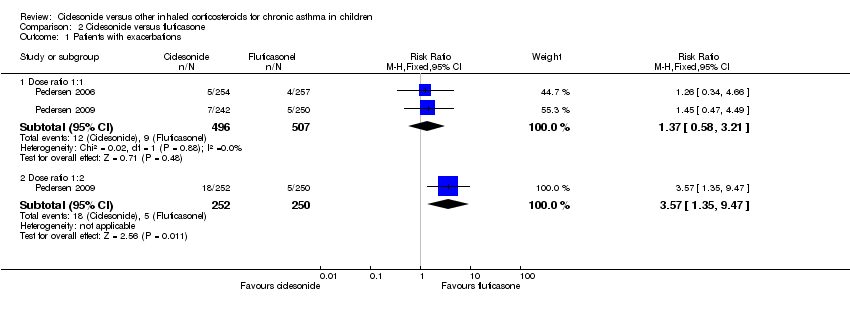
Comparison 2 Ciclesonide versus fluticasone, Outcome 1 Patients with exacerbations.
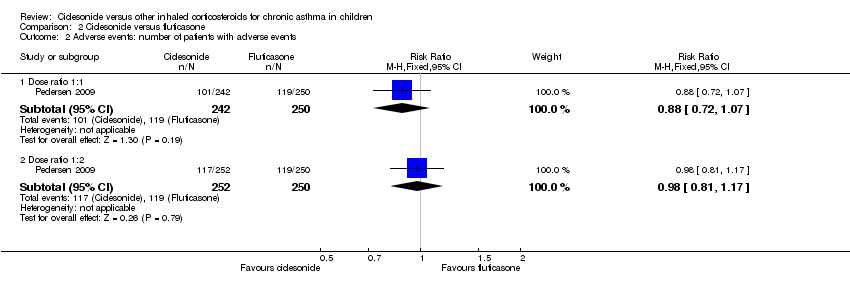
Comparison 2 Ciclesonide versus fluticasone, Outcome 2 Adverse events: number of patients with adverse events.
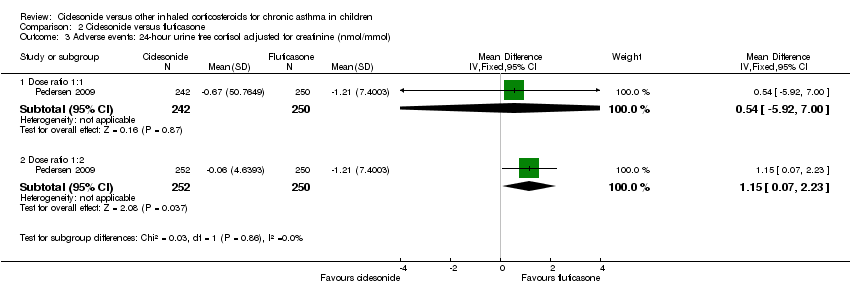
Comparison 2 Ciclesonide versus fluticasone, Outcome 3 Adverse events: 24‐ hour urine free cortisol adjusted for creatinine (nmol/mmol).

Comparison 2 Ciclesonide versus fluticasone, Outcome 4 Generic FEV1 least square mean (L).
| Ciclesonide versus budesonide (dose ratio 1:2) for chronic asthma in children | ||||||
| Patient or population: patients with chronic asthma in children | ||||||
| Outcomes | Illustrative comparative risks* (95% CI) | Relative effect | No of participants | Quality of the evidence | Comments | |
| Assumed risk | Corresponding risk | |||||
| Budesonide (dose ratio 1:2) | Ciclesonide | |||||
| Asthma symptoms | See comment | See comment | Not estimable | 1024 | ⊕⊕⊝⊝ | Both studies used a 5‐point scale, but insufficient data were reported to allow meta‐analysis |
| Patients with exacerbations | 12 per 1000 | 26 per 1000 | RR 2.2 | 1024 | ⊕⊝⊝⊝ | |
| Adverse events | See comment | See comment | Not estimable | 1024 | ⊕⊕⊝⊝ | The data could not be meta‐analysed because the definitions of adverse events were too diverse |
| *The basis for the assumed risk (e.g. the median control group risk across studies) is provided in footnotes. The corresponding risk (and its 95% confidence interval) is based on the assumed risk in the comparison group and the relative effect of the intervention (and its 95% CI). | ||||||
| GRADE Working Group grades of evidence | ||||||
| 1 In one study the dose of budesonide was much higher than what is commonly prescribed in clinical practice. | ||||||
| Ciclesonide versus fluticasone (dose ratio 1:1) for chronic asthma in children | ||||||
| Patient or population: patients with chronic asthma in children | ||||||
| Outcomes | Illustrative comparative risks* (95% CI) | Relative effect | No of participants | Quality of the evidence | Comments | |
| Assumed risk | Corresponding risk | |||||
| Fluticasone (dose ratio 1:1) | Ciclesonide | |||||
| Asthma symptoms | See comment | See comment | Not estimable | 1468 | ⊕⊕⊕⊝ | 2 studies used a 5‐point scale and 1 study did not provide details how asthma symptoms were measured. Data could not be pooled due to diversity in scales |
| Patients with exacerbations | 18 per 1000 | 24 per 1000 | RR 1.37 | 1003 | ⊕⊝⊝⊝ | |
| Adverse events | See comment | See comment | Not estimable | 1560 | ⊕⊕⊝⊝ | Adverse events were defined differently across studies therefore results could not be pooled |
| *The basis for the assumed risk (e.g. the median control group risk across studies) is provided in footnotes. The corresponding risk (and its 95% confidence interval) is based on the assumed risk in the comparison group and the relative effect of the intervention (and its 95% CI). | ||||||
| GRADE Working Group grades of evidence | ||||||
| 1 Two fully published studies were sponsored by the manufacturer and at least one of the authors of each study was an employee of the manufacturer that sponsored the study. | ||||||
| Ciclesonide versus fluticasone (dose ratio 1:2) for chronic asthma in children | ||||||
| Patient or population: patients with chronic asthma in children | ||||||
| Outcomes | Illustrative comparative risks* (95% CI) | Relative effect | No of participants | Quality of the evidence | Comments | |
| Assumed risk | Corresponding risk | |||||
| Fluticasone (dose ratio 1:2) | Ciclesonide | |||||
| Asthma symptom | The mean asthma symptom in the control groups was | The mean asthma symptom in the intervention groups was | 482 | ⊕⊕⊝⊝ | Estimates are medians indicating data was skewed | |
| Patients with exacerbations | 20 per 1000 | 70 per 1000 | RR 3.48 | 502 | ⊕⊝⊝⊝ | |
| Adverse events | 476 per 1000 | 471 per 1000 | RR 0.99 (0.89 to 1.08) | 502 | ⊕⊝⊝⊝ | |
| *The basis for the assumed risk (e.g. the median control group risk across studies) is provided in footnotes. The corresponding risk (and its 95% confidence interval) is based on the assumed risk in the comparison group and the relative effect of the intervention (and its 95% CI). | ||||||
| GRADE Working Group grades of evidence | ||||||
| 1 Based on one study that was underpowered for a non‐inferiority trial. | ||||||
| Study ID | Ciclesonide dose | Comparator ICS | Application | Inhalation technique | Treatment period |
| Ciclesonide versus budesonide | |||||
| 160 μg OD (ex‐actuator; equivalent to 200 μg ex‐valve) 2 x 80 μg puffs in the evening | Budesonide 400 μg OD 2 x 200 μg puffs | Ciclesonide: HFA‐MDI with an AeroChamber®; Budesonide: Turbohaler® | Not described | 12 weeks | |
| 320 μg OD (ex‐actuator; equivalent to 2 puffs of 200 μg ex‐valve) 2 x 160 μg puffs administered in the evening | Budesonide 800 μg OD (4 inhalations of | Ciclesonide: HFA‐MDI without spacer Budesonide: Turbohaler® | Not described | 12 weeks | |
| Ciclesonide versus fluticasone | |||||
| 160 μg OD | Fluticasone 88 μg BID | MDI with spacer, AeroChamber Plus® | Not described | 12 weeks | |
| 160 μg OD | Fluticasone 88 μg BID | No information provided | Not described | 12 weeks | |
| 80 μg BID (ex‐actuator; equivalent to 100 μg BID ex‐valve) | Fluticasone 88 μg BID (ex‐actuator dose, equivalent to 100 μg BID ex‐valve) | HFA‐MDI without spacer | Adequate inhalation technique no details described | 12 weeks | |
| 80 or 160 μg OD (ex‐actuator; equivalent to 100 and 200 μg ex‐valve) administered in the evening | Fluticasone 88 μg BID (176 ex‐actuator; equivalent to 100 μg BID ex‐valve) in the morning and evening | HFA 134‐MDI without spacer | Good inhalation technique, no details described | 12 weeks | |
| BID: twice daily; ex‐actuator: drugs that leaves the inhaler; ex‐valve: drugs that leaves the metering chamber valve; HFA‐MDI: hydrofluoroalkane‐propelled metered dose inhaler; ICS: inhaled corticosteroid; MDI: metered dose inhaler; OD: once daily. | |||||
| Dose | CIC 160 μg OD versus BUD 400 μg OD | CIC 320 μg OD versus BUD 800 μg OD |
| Dose ratio | 1:2 | 1:2 |
| Study | ||
| Primary outcomes | ||
| Asthma symptoms: asthma symptom score (sum score) | ITT: MD 0.01, 95% CI ‐0.14 to 0.16 PP: MD 0.03, 95% CI ‐0.20 to 0.25 Non‐inferiority acceptance limit = 0.3 | Median change from baseline (no CIs reported) ITT: CIC: ‐0.07; BUD: ‐0.14 PP: CIC: ‐0.07; BUD: ‐0.14 |
| Asthma symptoms: use of rescue medication (puff/day) | ITT: MD 0.06 puffs/day, 95% CI ‐0.26 to 0.38 | Not assessed |
| Asthma symptoms: % of asthma symptom and rescue medication‐free days | ITT: CIC: mean 73%; BUD: mean 70% No difference between groups | ITT and PP: CIC: median 84%; BUD: median 85% Lower limit of the between difference was ‐1.4% and above non‐inferiority limit of ‐8% |
| Exacerbations: patients with exacerbations* | ITT: RR 2.71, 95% CI 0.61 to 12.11; Analysis 1.1 | ITT: RR 1.69, 95% CI 0.36 to 8.00; Analysis 1.1 |
| Adverse events: patients with adverse events | Adverse events were reported in 38% of patients in both groups | ITT: RR** 1.44, 95% CI 0.96 to 2.18 |
| Adverse events: change in body height | Mean change from baseline (least square mean) CIC: 1.18 cm; BUD: 0.70 cm | Not assessed |
| Adverse events: 24‐hour urine cortisol adjusted for creatinine | ITT: 2.99 nmol/mmol creatinine; P < 0.0001, one‐sided (decrease greater in the BUD group) | ITT: significant difference between groups (lower level in BUD group) |
| Secondary outcomes | ||
| Quality of life: PAQLQ(S) | ITT: MD ‐0.11, 95% CI ‐0.12 to 0.10, one‐sided superiority; Analysis 1.2 Non‐inferiority acceptance limits = not provided PP not reported | ITT: MD (least square mean) 0.01, 95% CI ‐0.14 to 0.16; Analysis 1.2 Non‐inferiority acceptance limit = ‐0.5% PP results were similar |
| Quality of life: PACQLQ | ITT: MD ‐0.08, 95% CI ‐0.27 to 0.11, one‐sided superiority Non‐inferiority acceptance limit not provided PP not reported | Not assessed |
| Compliance | Not assessed | Not assessed |
| Lung function: FEV1 (L) | ITT: MD (least square means) ‐0.019 L, 95% CI ‐0.059 to 0.022; Analysis 1.3 PP: MD (least square means) ‐0.034 L, 95% CI ‐75 to 10 Non‐inferiority acceptance limit = ‐100 mL | ITT: MD (least square means) ‐0.03 L, 95% ‐0.14 to 0.8; Analysis 1.3 PP: MD (least square means) ‐0.02 L, 95% CI ‐0.13 to 0.1 Non‐inferiority acceptance limit = ‐150 mL |
| Airway inflammation | Not assessed | Not assessed |
| BUD: budesonide; CI: confidence interval; CIC: ciclesonide; ITT: intention to treat analysis; MD: mean difference; OD: once daily; PACQLQ: Pediatric Asthma Caregiver Quality of Life Questionnaire; PAQLQ: Pediatric Asthma Quality of Life Questionnaire; PP: per protocol; RR: risk ratio. * Exacerbations were defined as an increasing asthma symptoms requiring change or addition of patient's medication other than increasing rescue medication. ** Adverse events that needed treatment, reported in over 2% of patients in CIC or BUD group of safety population (N = 403). | ||
| Dose | CIC 80 μg BID vs. FP 88 μg BID | CIC 160 μg OD vs. FP 88 μg BID | CIC 80 μg BID vs. FP 88 μg BID | CIC 160 μg OD vs. FP 88 μg BID | CIC 80 μg OD vs. FP 88 μg BID |
| Dose ratio | 1:1 | 1:1 | 1:1 | 1:1 | 1:2 |
| Study | |||||
| Primary outcomes | |||||
| Asthma symptoms: asthma symptom score | Median difference (Hodges Lehmann point estimate) ITT and PP: 0.00, 95% CI ‐0.29 to 0.14 | Median difference (Hodges Lehmann point estimate) Unclear if ITT or PP *: 0.07, 95% CI ‐0.14 to 0.28 Non‐inferiority acceptance limit = 0.30 sum score | Not assessed | Asthma symptom score decreased and was similar in both groups | Median difference (Hodges Lehmann point estimate) Unclear if ITT or PP **: 0.07, 95% CI ‐0.14 to 0.28 Non‐inferiority acceptance limit = 0.30 sum score |
| Asthma symptoms: use of rescue medication | Median difference (Hodges Lehmann point estimate) ITT and PP: 0.00, 95% CI ‐1.23 to 2.12 | Median change from baseline (Hodges Lehmann point estimate) ITT: CIC: ‐1.13; FP: ‐1.29 PP: CIC: ‐1.14; FP: ‐1.29 All P < 0.0001 | Not assessed | Use of rescue medication decreased and was similar in both groups | Median change from baseline (Hodges Lehmann point estimate) ITT: CIC: ‐1.20; FP: ‐1.29 PP: CIC: ‐1.21; FP: ‐1.29 All P < 0.0001 |
| Asthma symptoms: a sthma symptom‐free days | Median difference (Hodges Lehmann point estimate) ITT: ‐1.01, 95% CI ‐4.60 to 2.46 PP: ‐1.01, 95% CI ‐4.82 to 2.51 | Not assessed | Not assessed | Not assessed | Not assessed |
| Asthma symptoms: % of asthma symptom and rescue medication‐free days combined | Not assessed | Mean percentage was high and did not differ significantly between the treatment groups (PP) | Median CIC: 91.5%; FP: 94% P = 0.1320 (2‐sided between treatments) | Not assessed | PP: mean percentage was high and did not differ between the treatment groups |
| Exacerbations: number of patients with exacerbations | RR 1.26, 95% CI 0.34 to 4.66; Analysis 2.1 | RR 1.45, 95% CI 0.47 to 4.49; Analysis 2.1 | Not assessed | CIC: 2.3%; FP: 2.2% | RR 3.57, 95% CI 1.35 to 9.47; Analysis 2.1 |
| Adverse events: % of patients with adverse events | A similar percentage of patients reported adverse events | RR 0.88, 95% CI 0.72 to 1.07; Analysis 2.2 | The incidence of adverse events was similar in both groups | Not assessed | RR 0.98, 95% CI 0.81 to 1.17; Analysis 2.2 |
| Adverse events: cortisol 24‐hour urine sample (nmol/mmol) | ITT: difference between 2 groups was not statistically significant ITT and restricted ITT (which included only those urine cortisol measurements with a corresponding urine creatinine value within the normal range) A statistically significant difference in favour of CIC was seen in the restricted ITT analysis (P = 0.006). The findings were similar for patients who were ICS‐naive and patients who had received ICS prior to study entry although the differences were numerically greater in previously ICS‐naive patients | Safety analysis**: MD 0.54 nmol/mmol, 95% CI ‐5.92 to 7.00; Analysis 2.3 | Not assessed | Not assessed | Safety analysis**: MD 1.15 nmol/mmol, 95% CI 0.07 to 2.23; Analysis 2.3 |
| Secondary outcomes | |||||
| Quality of life: PAQLQ | Not assessed | ITT and PP: Non‐inferiority was confirmed CIC 160 compared to FP (P < 0.0001, one‐sided) Non‐inferiority limit = ‐0.5 | Not assessed | Not assessed | ITT and PP: Non‐inferiority was confirmed for CIC80 compared to FP (P < 0.0001, one‐sided) Non‐inferiority limit = ‐0.5 |
| Quality of life: PACQLQ | Not assessed | ITT and PP: Non‐inferiority was confirmed CIC 160 compared to FP (P < 0.0001, one‐sided) Non‐inferiority limit = 15 | Not assessed | Not assessed | ITT and PP: Non‐inferiority was confirmed for CIC80 compared to FP (P < 0.0001, one‐sided) Non‐inferiority limit = 15 |
| Compliance | Not assessed | Not assessed | Not assessed | Not assessed | Not assessed |
| Change in lung function: FEV1 (L) | ITT: MD (least square means) 0.0 L, 95% CI ‐0.042 to 0.042; Analysis 2.4 PP: MD (least square means) 0.001, 95% ‐0.044 to 0.046 | ITT: MD (least square means) ‐0.02 L, 95% CI ‐0.07 to 0.04; Analysis 2.4 PP: MD (least square means) ‐0.026, 95% CI ‐0.086 to 0.34 | Improvement similar between groups no point estimates | Improvement similar between groups no point estimates | ITT: MD (least square means) ‐0.05 L, 95% CI ‐0.11 to 0.01; Analysis 2.4 PP: MD (least square means) ‐0.056, 95% CI ‐0.12 to ‐0.004 |
| Airway inflammation | Not assessed | Not assessed | Not assessed | Not assessed | Not assessed |
| BID: twice daily; CI: confidence interval; CIC: ciclesonide; FP: fluticasone; ICS: inhaled corticosteroid; ITT: intention to treat analysis; OD: once daily; PACQLQ: Pediatric Asthma Caregiver Quality of Life Questionnaire; PAQLQ: Pediatric Asthma Quality of Life Questionnaire; PP: per protocol analysis. * = In this study analyses were based on PP population and analysis of ITT population was used to confirm results, description of the results are unclear but we assumed it to be based on analysis of PP population. ** = safety analysis excluded patients with concurrent nasal, ophthalmological or dermatological corticosteroid treatment. | |||||
| Outcome or subgroup title | No. of studies | No. of participants | Statistical method | Effect size |
| 1 Patients with exacerbations Show forest plot | 2 | 1024 | Risk Ratio (M‐H, Fixed, 95% CI) | 2.20 [0.75, 6.43] |
| 2 Quality of life PAQLQ (S) Show forest plot | 2 | 1010 | Mean Difference (IV, Fixed, 95% CI) | ‐0.00 [‐0.09, 0.09] |
| 3 FEV1 least square means (L) Show forest plot | 2 | 1021 | Mean Difference (IV, Fixed, 95% CI) | ‐0.02 [‐0.10, 0.05] |
| Outcome or subgroup title | No. of studies | No. of participants | Statistical method | Effect size |
| 1 Patients with exacerbations Show forest plot | 2 | Risk Ratio (M‐H, Fixed, 95% CI) | Subtotals only | |
| 1.1 Dose ratio 1:1 | 2 | 1003 | Risk Ratio (M‐H, Fixed, 95% CI) | 1.37 [0.58, 3.21] |
| 1.2 Dose ratio 1:2 | 1 | 502 | Risk Ratio (M‐H, Fixed, 95% CI) | 3.57 [1.35, 9.47] |
| 2 Adverse events: number of patients with adverse events Show forest plot | 1 | Risk Ratio (M‐H, Fixed, 95% CI) | Subtotals only | |
| 2.1 Dose ratio 1:1 | 1 | 492 | Risk Ratio (M‐H, Fixed, 95% CI) | 0.88 [0.72, 1.07] |
| 2.2 Dose ratio 1:2 | 1 | 502 | Risk Ratio (M‐H, Fixed, 95% CI) | 0.98 [0.81, 1.17] |
| 3 Adverse events: 24‐ hour urine free cortisol adjusted for creatinine (nmol/mmol) Show forest plot | 1 | Mean Difference (IV, Fixed, 95% CI) | Subtotals only | |
| 3.1 Dose ratio 1:1 | 1 | 492 | Mean Difference (IV, Fixed, 95% CI) | 0.54 [‐5.92, 7.00] |
| 3.2 Dose ratio 1:2 | 1 | 502 | Mean Difference (IV, Fixed, 95% CI) | 1.15 [0.07, 2.23] |
| 4 Generic FEV1 least square mean (L) Show forest plot | 2 | Mean Difference (Fixed, 95% CI) | Subtotals only | |
| 4.1 Dose ratio 1:1 | 2 | 1000 | Mean Difference (Fixed, 95% CI) | ‐0.01 [‐0.04, 0.02] |
| 4.2 Dose ratio 1:2 | 1 | 499 | Mean Difference (Fixed, 95% CI) | ‐0.05 [‐0.11, 0.01] |