Fixed‐dose combinations of drugs versus single‐drug formulations for treating pulmonary tuberculosis
Abstract
Background
People who are newly diagnosed with pulmonary tuberculosis (TB) typically receive a standard first‐line treatment regimen that consists of two months of isoniazid, rifampicin, pyrazinamide, and ethambutol followed by four months of isoniazid and rifampicin. Fixed‐dose combinations (FDCs) of these drugs are widely recommended.
Objectives
To compare the efficacy, safety, and acceptability of anti‐tuberculosis regimens given as fixed‐dose combinations compared to single‐drug formulations for treating people with newly diagnosed pulmonary tuberculosis.
Search methods
We searched the Cochrane Infectious Disease Group Specialized Register; the Cochrane Central Register of Controlled Trials (CENTRAL, published in the Cochrane Library, Issue 11 2015); MEDLINE (1966 to 20 November 2015); EMBASE (1980 to 20 November 2015); LILACS (1982 to 20 November 2015); the metaRegister of Controlled Trials; and the World Health Organization International Clinical Trials Registry Platform (WHO ICTRP), without language restrictions, up to 20 November 2015.
Selection criteria
Randomized controlled trials that compared the use of FDCs with single‐drug formulations in adults (aged 15 years or more) newly diagnosed with pulmonary TB.
Data collection and analysis
Two review authors independently assessed studies for inclusion, and assessed the risk of bias and extracted data from the included trials. We used risk ratios (RRs) for dichotomous data and mean differences (MDs) for continuous data with 95% confidence intervals (CIs). We attempted to assess the effect of treatment for time‐to‐event measures with hazard ratios and their 95% CIs. We used the Cochrane 'Risk of bias' assessment tool to determine the risk of bias in included trials. We used the fixed‐effect model when there was little heterogeneity and the random‐effects model with moderate heterogeneity. We used an I² statistic value of 75% or greater to denote significant heterogeneity, in which case we did not perform a meta‐analysis. We assessed the quality of evidence using the Grading of Recommendations Assessment, Development and Evaluation (GRADE) approach.
Main results
We included 13 randomized controlled trials (RCTs) in the review, which enrolled 5824 participants. Trials were published between 1987 and 2015 and included participants in treatment with newly diagnosed pulmonary TB in countries with high TB prevalence. Only two trials reported the HIV status of included participants.
Overall there is little or no difference detected between FDCs and single‐drug formulations for most outcomes reported. We did not detect a difference in treatment failure between FDCs compared with single‐drug formulations (RR 1.28, 95% CI 0.82 to 2.00; 3606 participants, seven trials, moderate quality evidence). Relapse may be more frequent in people treated with FDCs compared to single‐drug formulations, although the confidence interval (CI) includes no difference (RR 1.28, 95% CI 1.00 to 1.64; 3621 participants, 10 trials, low quality evidence). We did not detect any difference in death between fixed‐dose and single‐drug formulation groups (RR 0.96, 95% CI 0.67 to 1.39; 4800 participants, 11 trials, moderate quality evidence).
When we compared FDCs with single‐drug formulations we found little or no difference for sputum smear or culture conversion at the end of treatment (RR 0.99, 95% CI 0.96 to 1.02; 2319 participants, seven trials, high quality evidence), for serious adverse events (RR 1.45, 95% CI 0.90 to 2.33; 3388 participants, six trials, moderate quality evidence), and for adverse events that led to discontinuation of therapy (RR 0.96, 95% CI 0.56 to 1.66; 5530 participants, 13 trials, low quality evidence).
We conducted a sensitivity analysis excluding studies at high risk of bias and this did not alter the review findings.
Authors' conclusions
Fixed‐dose combinations and single‐drug formulations probably have similar effects for treating people with newly diagnosed pulmonary TB.
PICOs
Plain language summary
Fixed‐dose combinations for treating pulmonary tuberculosis
What are fixed‐dose combinations and how might they improve care of people with tuberculosis
Tuberculosis (TB) is an important health problem, especially in developing countries. The treatment for pulmonary TB in new patients includes four oral medicines taken for six months, sometimes as fixed‐dose combinations (FDCs) that are combined in one tablet, or taken separately as single‐drug formulations. The World Health Organization recommends prescribers use fixed‐dose combinations to reduce the number of tablets that people take. On the supply side, this might reduce prescribing errors and improve drug supply efficiency; on the patient's side, FDCS simplify treatment and improve adherence.
We conducted a review to assess the efficacy, safety, and acceptability of FDCs compared with single‐drug formulations for treating people with newly diagnosed pulmonary TB.
What the research says
We searched for relevant trials up to 20 November 2015, and included 13 randomized controlled trials that enrolled 5824 people. Trials were published between 1987 and 2015 and included participants in treatment with newly diagnosed pulmonary TB in countries with high TB prevalence. Only two trials reported the HIV status of included participants.
There is probably little or no difference in FDCs compared to single‐drug formulations for treatment failure (moderate quality evidence); relapse may be more frequent (low quality evidence); and the number of deaths were similar (moderate quality evidence).
There is little or no difference in sputum smear or culture conversion (high quality evidence), and no difference was shown for serious adverse events (moderate quality evidence) or adverse events that led to discontinuation of therapy (low quality evidence).
Authors’ conclusions
We concluded that fixed‐dose combinations have similar efficacy to single‐drug formulations for treating people with newly diagnosed pulmonary TB.
Authors' conclusions
Summary of findings
| Fixed‐dose combinations compared to single‐drug formulations for treating newly diagnosed pulmonary tuberculosis (TB) | |||||
| Participant or population: treating pulmonary TB | |||||
| Outcomes | Illustrative comparative risks* (95% CI) | Relative effect | Number of participants | Quality of the evidence | |
| Assumed risk single‐drug formulations | Corresponding risk FDCs | ||||
| Treatment failure | 19 per 1000 | 24 per 1000 | RR 1.28 | 3606 | ⊕⊕⊕⊝ |
| Relapse | 55 per 1000 | 71 per 1000 | RR 1.28 | 3621 | ⊕⊕⊝⊝ |
| Death | 25 per 1000 | 24 per 1000 | RR 0.96 | 4800 | ⊕⊕⊕⊝ |
| Sputum smear or culture conversion at end of treatment | 892 per 1000 | 883 per 1000 | RR 0.99 | 2319 | ⊕⊕⊕⊕ |
| Serious adverse events | 16 per 1000 | 23 per 1000 | RR 1.45 | 3388 | ⊕⊕⊕⊝ |
| Adverse events leading to discontinuation of therapy | 40 per 1000 | 38 per 1000 | RR 0.96 | 5530 | ⊕⊕⊝⊝ |
| Combined endpoint of treatment failure, relapse, or death** | — | — | — | (0 RCTs) | — |
| *The risk in the intervention group (and its 95% CI) is based on the assumed risk in the comparison group and the relative effect of the intervention (and its 95% CI). | |||||
| GRADE Working Group grades of evidence | |||||
| 1 We did not downgrade the quality of the evidence due to limitations in design and execution. Analysis of studies at low risk of bias does not change the effect estimate. | |||||
Background
Description of the condition
Tuberculosis (TB) is a global pandemic and the disease caused approximately nine million new cases and 1.5 million deaths in 2014. It is a major public health problem and is one of the infectious diseases with the highest incidence in the world. It is caused by bacterial species of the Mycobacterium tuberculosis complex (a genetically closely‐related group of Mycobacterium species). TB most commonly affects the lungs (pulmonary TB), although it can also affect other organs and systems (extrapulmonary TB). It is transmitted from person to person by droplets from the throat and lungs of people with active respiratory TB. The most common symptom of pulmonary TB is a persistent and productive cough, sometimes with haemoptysis (expulsion of sputum with blood). It is often accompanied by general symptoms such as fever, night sweats, and weight loss. The symptoms for extrapulmonary TB depend on the site of disease, and are usually accompanied by intermittent fever and weight loss. Anyone can contract TB, but people with prolonged and close household exposure to a person with active pulmonary TB are at greatest risk. The probability of developing TB is much higher among people infected with human immunodeficiency virus (HIV). TB is also more common among men than women, and affects mostly adults in the economically productive age groups. Accurate and early diagnosis, in addition to rapid and appropriate treatment, are the most important actions in TB care and control (ISTC 2014; NICE 2006; WHO 2015).
Treatment of tuberculosis
Effective treatment that ensures a rapid and lasting cure is the main component in TB control. M. tuberculosis is a slow‐growing bacillus and treatment requires multiple drugs over a prolonged time period. The ultimate objective is to cure the disease and prevent drug resistance developing. The recommended oral drugs for first‐line anti‐TB treatment are isoniazid (H), rifampicin (R), pyrazinamide (Z), and ethambutol (E). The standard short‐course TB treatment for new patients with pulmonary TB consists of six months of rifampicin‐based regimen (2HRZE/4HR), given daily or three times per week. There are some considerations to take into account in TB treatment. Pulmonary and extrapulmonary disease should be treated with the same regimen, but in some cases of extrapulmonary TB (such as TB meningitis and bone or joint TB) the recommended therapy is longer than the standard TB regimen. Ideally, drug regimens for all patients should depend on the results of drug susceptibility testing to guide the therapy (ISTC 2014; NICE 2011; WHO 2010; WHO 2014).
The recommended doses for treatment of children with TB differ compared to treatment of adults. Correct treatment prescription for children with TB remains a challenge. Current guidance of the World Health Organization (WHO) for the treatment of children with TB is based on the last scientific evidence and recommends the use of fixed‐dose combinations (FDCs) (WHO 2009; WHO 2014). Nevertheless, currently available FDCs on the market for TB treatment do not correspond with the appropriate doses for children, making treatment very difficult or unfeasible.
Assessment and promotion of treatment adherence is critical for the achievement of favourable patient outcomes, and directly observed treatment (DOT) and training for a treatment supporter (parent or responsible adult for supervised treatment) are recommended strategies when addressing this issue (ISTC 2014; WHO 2010; WHO 2014).
Description of the intervention
FDCs are pills that contain more than one active ingredient. Anti‐TB drugs may contain two, three, or four active ingredients in one tablet. Pharmacokinetic studies of anti‐TB drugs show that absorption, plasma concentrations, and others pharmacokinetic parameters are similar for FDCs and single‐drug formulations (Agrawal 2002; Zwolska 1998). FDCs appear on the WHO Model List of Essential Medicines (WHO 2011). Both the WHO, WHO 2010, and the International Standards for Tuberculosis Care, ISTC 2014, recommend the use of FDCs for standard TB treatment regimens. The national TB programmes of most high‐burden TB countries have adopted FDCs as standard TB treatment regimens (Wells 2011).
How the intervention might work
The increase in drug resistance amongst species of the M. tuberculosis complex has become a critical issue in global TB control. With the use of single‐drug formulations the treatment adherence could be lower, the patient could choose to stop using one or more drugs (perceived by them as problematic in terms of side effects) while continuing use of the other drugs, or some patients may interrupt treatment completely. This may lead to the selection of drug‐resistant M. tuberculosis strains.
The main reasons for the use of FDCs are the improvement in treatment adherence and reduced rates of drug resistance (Figure 1). By using FDCs the number of pills to be taken by the patient is considerably reduced (ISTC 2014), making it possible to increase patient satisfaction and decrease medication errors, burden, and cost for patients. Prescription mistakes may be lowered and the efficiency in the drug supply system may be increased due to fewer drug orders and shipments (Blomberg 2001; CDC 2003; Rieder 2002). The major advantages of using FDCs to treat people with TB are simplified treatment and drug management and decreased probability of monotherapy (Blomberg 2001). Moreover, FDCs tend to improve adherence in various settings (Connor 2004).

Logic diagram of relationship between the use of fixed‐dose combinations (FDCs) and expected improvement of reported outcomes.
There are some disadvantages to the use of FDCs. It may be difficult to identify the relationship between an adverse drug reaction and one of the components of FDCs if any toxicity issues occur. In addition, FDCs may impede further dose adjustments. Another disadvantage of FDCs is poor rifampicin bioavailability if strict manufacturing procedures are not followed or poor quality materials are used (Blomberg 2001).
Why it is important to do this review
The effectiveness of FDCs has been tested in randomized controlled clinical trials, but small sample sizes and differences in treatment doses or schedule have limited the applicability of their results. This Cochrane review on the effectiveness of FDCs versus single‐drug formulations for the treatment of pulmonary TB will help to evaluate the benefits and disadvantages of FDCs based on the existing scientific evidence.
Objectives
To compare the efficacy, safety, and acceptability of anti‐tuberculosis regimens given as fixed‐dose combinations compared to single‐drug formulations for treating people with newly diagnosed pulmonary tuberculosis.
Methods
Criteria for considering studies for this review
Types of studies
Randomized controlled trials (RCTs).
Types of participants
Male and female adolescents and adults (aged 15 years or older), newly diagnosed with pulmonary TB, confirmed by sputum smear or culture, or both, or according to the World Health Organization (WHO) definition for a case of tuberculosis (TB): participants in which a health worker has diagnosed TB and has decided to treat with a full course of TB treatment (WHO 2010).
We excluded children, people with extrapulmonary TB, and those previously treated for TB. We excluded children due to difficulties in childhood TB treatment with the available fixed‐dose combinations (FDCs) (WHO 2009; WHO 2014).
We excluded studies that included both adults and children, unless subgroup data for adults were available from the study report.
Types of interventions
Intervention
FDC chemotherapy.
Control
Multiple single‐drug formulation chemotherapy.
For all included trials, the intervention and control groups had to use the same components and dose schedule. We included trials in which TB treatment was administered for a minimum of two months, but did not exceed nine months.
Types of outcome measures
Primary outcomes
-
A combined endpoint of treatment failure, relapse, or death.
-
Treatment failure.
-
Relapse.
-
Death.
We reported death due to any cause.
Secondary outcomes
-
Sputum smear or culture conversion.
-
Time to sputum smear or culture conversion.
-
Time to relapse.
-
Treatment adherence (as defined by the trial authors).
-
Acquisition of drug resistance (as defined by the trial authors).
-
Patient satisfaction characterized as:
-
general satisfaction;
-
no problems swallowing;
-
acceptable taste.
-
-
Adverse events characterized as:
-
serious (death, hospitalizations);
-
those leading to discontinuation of therapy;
-
other adverse events.
-
For sputum smear or culture conversion we took culture conversion data instead of sputum smear data when both were available. We assessed dichotomous outcomes at two to three months, at the end of treatment (EOT), and at follow‐up when data were available. For treatment adherence and acquisition of drug resistance, we used the definitions suggested by the trial authors (see Table 1).
| Trial1 | Outcomes2 | Definitions | Notes |
| Treatment failure | “sputum smear still or again positive after 4 and/or 6 months of treatment” | Treatment efficacy based on bacteriological response rate (sputum smear conversion rate) on 2 smears | |
| Relapse | “patient cured at end of treatment (EOT) and sputum smear again positive at months 9 or 12” | ||
| Treatment failure | “two positive cultures with or without radiological deterioration at EOT (treatment failure) or during the follow‐up (relapse) and consequently resulting in a new course of treatment” | Treatment efficacy based on bacteriological criteria (2 negative cultures) | |
| Relapse | |||
| Treatment adherence | Not defined | Determined by testing urine for isoniazid metabolites by biochemical methods | |
| Acquisition of drug resistance | Determined by drug sensitivity test for isoniazid, rifampicin and streptomycin | ||
| Treatment adherence | Not defined | Asking patients for missed doses, by pill counts and by testing urine for isoniazid metabolites | |
| Treatment failure | “One culture of at least 20 colonies` growth or 2 cultures of 10 or more colonies growth at EOT not identified as a reinfection” | Treatment efficacy based on bacteriological results: 2 sputum smears and cultures. One case of relapse was reported based only in radiologic deterioration | |
| Relapse | “One culture of at least 20 colonies` growth or 2 cultures of 10 or more colonies growth in the follow‐phase not identified as reinfection” | ||
| Acquisition of drug resistance | Not defined | Determined by drug sensitivity test for isoniazid, rifampicin, streptomycin and ethambutol | |
| Relapse | Not defined | Efficacy based on bacteriological results (sputum smear and culture) | |
| Treatment adherence | Not defined | Assessed by delay in drug collection and surprise pill counting | |
| Treatment failure | Not defined | Treatment efficacy based on clinical, bacteriological (3 sputum smears and cultures) and radiographic criteria | |
| Relapse | Efficacy based on bacteriological results (3 sputum smears and cultures) | ||
| Treatment adherence | Assessed by “cases lost to follow‐up and cases who changed to another regimen during treatment” | ||
| Treatment failure | "Smear positive at 5 months or later"3 | Efficacy based on bacteriological results (sputum smear) | |
| Relapse |
| Efficacy based on bacteriological results (1 smear sputum and culture) and information from interviews and verbal autopsies | |
| Treatment failure | Not defined | Treatment efficacy based on bacteriological results (sputum smear and culture) | |
| Relapse | “Bacteriological relapse after chemotherapy was defined as a positive culture with a growth of 10 or more colonies in 2 different months during any 3‐month period up to 30 months, and during any 6‐month period up to 60 months” | Efficacy based on bacteriological results (sputum smear and culture). One case of relapse was reported based on radiological deterioration | |
| Acquisition of drug resistance | Not defined | Determined by drug sensitivity test for isoniazid, rifampicin, and streptomycin | |
| Relapse | Not defined | Efficacy based on bacteriological results (sputum smear) | |
| Relapse | Not defined | Efficacy based on bacteriological results (sputum smear and culture) | |
| Treatment adherence | Not defined | There were 3 kinds of treatment management (whole‐course hospitalization; hospitalization only during intensive phase and outpatient treatment), combined with 3 supervision model respectively (supervision by medical staff; supervision by no‐medical staff who had been trained by the medical staff [relatives, colleagues] and supervision by medical staff in the intensive phase but non‐medical staff in the continuation phase). Treatment and supervision were established according to participants economic status |
Abbreviations: EOT: end of treatment; TB: tuberculosis.
1Munteanu 2004 did not report the outcomes included in this table and Semenova 2003 was not included in quantitative analysis.
2Outcomes reported in each clinical trial.
3Treatment failure was defined in the preliminary publication (Gravendeel 2003).
Search methods for identification of studies
We searched for all relevant trials regardless of language or publication status (published, unpublished, in press, and ongoing).
Electronic searches
We searched the following databases: the Cochrane Infectious Disease Group Specialized Register; the Cochrane Central Register of Controlled Trials (CENTRAL, published in the Cochrane Library, Issue 11 2015); MEDLINE (1966 to 20 November 2015); EMBASE (1980 to 20 November 2015); and LILACS (1982 to 20 November 2015), using the search terms detailed in Appendix 1. We also searched the metaRegister of Controlled Trials (mRCT) (20 November 2015) and the search portal of the World Health Organization International Clinical Trials Registry Platform (WHO ICTRP) (www.who.int/trialsearch) (20 November 2015), to identify ongoing trials, using “tuberculosis” and “fixed dose OR combination” as search terms.
Searching other resources
We contacted trial authors in the field to identify additional studies that may have met the inclusion criteria. We checked projects of relevant organizations, including the WHO, the Tuberculosis Trials Consortium (TBTC), the International Union Against Tuberculosis and Lung Disease, and the WHO Global TB Programme to identify any unpublished and ongoing trials.
We also checked the reference lists of all relevant studies identified by the above methods.
Data collection and analysis
Selection of studies
Two review authors (CRG and AVR) independently screened the titles and abstracts of all citations retrieved by the search to identify potentially eligible studies. We obtained the full‐text articles of potentially eligible studies and independently evaluated these studies for inclusion in the review, based on the inclusion and exclusion criteria. When we found multiple publications for the same study, we ensured that we counted these as the same study. In case of disagreements, we consulted a third review author (DRC) to resolve them. We documented the reasons for exclusion of studies.
Data extraction and management
Two review authors (CRG and AVR) independently extracted data from the included trials using a standardized data extraction sheet. For all included trials, we extracted information regarding the number of randomized participants and the number of participants whose outcomes were measured. We extracted the number of events and the number of participants assessed in each treatment arm for dichotomous outcomes. For continuous outcomes, we extracted the arithmetic means and standard deviations, together with the number of participants in each group. We resolved discrepancies regarding the extracted data with another two review authors (MRF and DRC) when necessary. When we required additional details, we contacted the trial authors by email.
For all included trials we extracted the following information when available.
-
Trial details: publication details, study design, methodological criteria, country and trial setting (hospital or clinic).
-
Participant characteristics: age, gender, inclusion and exclusion criteria, sputum smear status if available, mycobacterial culture data, baseline drug susceptibility testing, and HIV status.
-
TB treatment details: types of regimen, dosage, frequency (daily or intermittent), mode of administration (self‐administered or supervised treatment), duration of follow‐up, withdrawal, and loss to follow‐up.
-
Outcome details (see the 'Types of outcome measures' section).
Assessment of risk of bias in included studies
Two review authors (CRG and AVR) independently assessed the risk of bias in the included trials using a standardized assessment form. In case of disagreement, we consulted a third review author (DRC). We assessed the following six components in each included trial: sequence generation; allocation concealment; blinding (study participants, investigators, and outcome assessors); incomplete outcome data; selective outcome reporting; and other sources of bias. For each of these components, we assigned a judgment regarding the risk of bias of either 'low', 'high', or 'unclear' (if insufficient detail was reported, or insufficient information was provided and the risk of bias was unknown) (Higgins 2011). We recorded the results in the standard 'Risk of bias' table in Review Manager (RevMan) (RevMan 2014), and summarized the findings in a 'Risk of bias' table and 'Risk of bias' graph.
Measures of treatment effect
We analysed the effect of treatment for dichotomous outcomes using the risk ratio (RR) and 95% confidence interval (CI). For continuous data, we planned to measure the effect of treatment with differences in means and their 95% CIs. We planned to assess the effect of treatment for time‐to‐event measures with hazard ratios (HRs) and their 95% CIs.
Dealing with missing data
For the main analysis, we did not take missing data into account and presented the data as "available data" according to data given in the original trials for all outcomes (see Data and analyses: Comparison 1 'Fixed‐dose combinations versus single‐drug formulations as available data'). The same approach was taken for the sensitivity analysis that considered the 'Risk of bias' assessment of included trials (see Data and analyses: Comparison 2 'Fixed‐dose combinations versus single‐drug formulations as available data: sensitivity analysis by risk of bias').
We performed a sensitivity analysis using an intention‐to‐treat (ITT) approach for the primary and secondary dichotomous outcomes relating to treatment efficacy (treatment failure, relapse, and sputum smear or culture conversion at 2 months or end of treatment). See Data and analyses: Comparison 3 'Fixed‐dose combinations versus single‐drug formulations: sensitivity analysis by intention‐to‐treat (ITT)'. The ITT sensitivity analyses were performed under the hypothesis that all participants lost during follow‐up presented negative events for the considered outcomes. We didn't perform a similar sensitivity analysis for death, because any hypothesis regarding participants lost to follow‐up seemed unreasonable.
Assessment of heterogeneity
We assessed heterogeneity among trials by visual inspection of forest plots, application of the Chi² test with a 10% level of statistical significance, and consideration of the I² statistic. We used an I² statistic value of 50% to denote moderate heterogeneity and 75% or greater to denote substantial heterogeneity.
Assessment of reporting biases
We assessed the likelihood of small study effects, such as publication bias, by visual examination of the funnel plot for asymmetry when there where at least 10 included trials.
Data synthesis
We calculated a pooled estimate of treatment using a fixed‐effects model when minimal heterogeneity was present and a random‐effects model when moderate heterogeneity was present. We did not attempt to perform a meta‐analysis if the I² statistic value was greater than 75%.
For the main analysis, we presented an "available case analysis" according to data presented in the original trials for all outcomes (see Data and analyses: Comparison 1 'Fixed‐dose combinations versus single‐drug formulations as available data').
We pooled trial data for continuous or dichotomous outcomes with the Mantel‐Haenzel method. If HRs had been available for time‐to‐event data, we would have pooled them with the inverse‐variance method.
We performed statistical analyses using RevMan (RevMan 2014) and presented the results with 95% CIs.
We assessed the quality of the evidence using the Grading of Recommendations Assessment, Evaluation and Development (GRADE) approach. We summarized the quality of evidence for the main outcomes and the RCT data in 'Summary of findings' tables. We constructed the 'Summary of findings' tables using GRADEpro Guideline Development Tool (GDT) software (available from www.gradepro.org).
Subgroup analysis and investigation of heterogeneity
We explored potential sources of heterogeneity by analysing the following subgroups.
-
FDCs administered only during the intensive phase versus FDCs administered for the whole treatment.
-
Daily regimen for the whole treatment versus daily regimen during the intensive phase followed by intermittent regimen during the continuation phase.
-
Supervised treatment versus self‐administered treatment during the intensive phase.
-
Trials with four drugs as FDCs versus trials with three or two drugs as FDCs during the intensive phase.
-
HIV‐positive participants versus HIV‐negative participants.
-
Clinically diagnosed participants versus laboratory diagnosed participants.
For the subgroup analysis we presented an 'available case analysis'.
Sensitivity analysis
We performed the following sensitivity analyses.
-
We conducted a sensitivity analysis to explore the impact of the 'Risk of bias' assessment on the main analysis. We analysed separately the two trials at low risk of selection bias (Bartacek 2009; Lienhardt 2011) (see Data and analyses: Comparison 2 'Fixed‐dose combinations versus single‐drug formulations as available data: sensitivity analysis by risk of bias').
-
We performed a sensitivity analysis to explore the impact of missing data on the main analysis, for primary and secondary dichotomous outcomes related to treatment efficacy. We conducted this analysis as an ITT analysis. We kept participants in the intervention groups to which they were randomized, regardless of the intervention to which they ended the follow‐up, and included all randomized participants in the analysis. We imputed missing data for patients lost to follow‐up under the hypothesis that all of them presented negative events (see Data and analyses: Comparison 3 'Fixed‐dose combinations versus single‐drug formulations: sensitivity analysis by intention‐to‐treat).
Results
Description of studies
See the 'Characteristics of included studies' and 'Characteristics of excluded studies' sections.
Results of the search
We retrieved 619 records, of which we selected 50 as potentially relevant after we screened the title and abstract. After we excluded four further articles, we assessed the full text of 46 articles and 14 trials met the inclusion criteria. We included 13 trials in the meta‐analysis. We illustrated the selection process in a flow diagram (see Figure 2).

Flow diagram of the trial selection process.
Among the potentially relevant records, we retrieved one unpublished trial that met the inclusion criteria (ISRCTN95204603). We also retrieved four studies that were not yet classified (see the 'Characteristics of studies awaiting classification' section).
Included studies
Included studies
In the qualitative synthesis, we included 14 RCTs, published between 1987 and 2015, that compared the use of fixed‐dose combinations (FDCs) versus single‐drug formulations to treat participants with newly diagnosed pulmonary tuberculosis (TB). We included 13 trials in the meta‐analysis. All but one trial, Suryanto 2008, described the follow‐up duration, and ranged from four months to five years after initiation of treatment. We have described details of the 14 trials in the 'Characteristics of included studies' section.
Participants
We included 14 trials in the qualitative analysis which included 6211 randomized participants. The meta‐analysis included 13 RCTs with 5824 randomized participants, with a range of 40 to 1585 participants per trial (see Table 2). All participants were 15 years of age or older. The proportion of male participants ranged between 27.8% and 88.6% across the included trials.
| Trial | Number of participants | Treatment regimens |
| 1159 | 2HRZE/4HR | |
| 250 | 2HRZ/4HR | |
| 701 | 2HRZ/4HR | |
| 1585 | 2HRZE/4HR1 | |
| 40 | 2HRZE/4HR | |
| 229 | 2HRZ/4HR1 | |
| 105 | 2HRZE/4HRE | |
| 434 | 2HRZE/3HR | |
| 310 | 3 different regimes were given2 | |
| 161 | 2HRZE/4HRE | |
| 293 | 2HRZE/4HRE | |
| 209 | 2HRZ/4HR | |
| 348 | 2HRZ/4HR |
Abbreviations: H: isoniazid; R: rifampicin; Z: pyrazinamide; E: ethambutol; S: streptomycin.
1In Lienhardt 2011 and RCTAI 1989 the treatment regimen was 8 weeks for intensive phase and 18 weeks for continuation phase.
2Intensive phase: Regimen 1: 2SHRZ, Regimen 2: 1SHRZ or Regimen 3: 2HRZ and continuation phase: H and R to complete 6 months of treatment (4HR or 5HR).
All trials included participants with pulmonary TB whose status had been confirmed by microbiological diagnosis (sputum smear or culture, or both). Only two included trials described the HIV status of the participants (Bartacek 2009; Lienhardt 2011).
Location and setting
Most included trials were conducted in high TB‐burden countries, or low‐ and middle‐income countries, or both (see the 'Characteristics of included studies' section).
The RCTs were conducted in different continents and countries. Eight trials were conducted in Asia (RCTAI 1989; Su 2002; Suryanto 2008; Teo 1999; Wu 2015; Zaka‐Ur‐Rehman 2008; Zhang 1996; Zhu 1998), two in Europe (Munteanu 2004; Semenova 2003), one in Africa (Chaulet 1995), and one in the USA (Geiter 1987). Two trials involved several countries (Bartacek 2009; Lienhardt 2011). All trials but two (Bartacek 2009 and Su 2002) gave details of the trial setting: hospital (six trials), clinics (four trials), hospital and health centre (one trial), and a different setting in each included country (one trial). We have provided the details of the country where each trial was conducted in "Characteristics of included studies".
Interventions
All but three included trials, Lienhardt 2011, RCTAI 1989, and Semenova 2003, used a six‐month treatment regimen. Lienhardt 2011 and RCTAI 1989 used a 26‐week regimen, and Semenova 2003 employed a four‐month regimen (see Table 2).
Although all included RCTs compared FDCs versus single‐drug formulations for treatment of pulmonary TB in newly diagnosed participants and used the same drugs and a comparable dose schedule in the intervention and control group, there were some differences in treatment administration between trials.
We included trials which gave drugs for a minimum of two months, but did not exceed nine months. We included one trial, Teo 1999, where 33% of the participants received drugs for the intensive phase for only a month, and for two months in the case of the remaining trial population (N = 209).
All but four included trials, Lienhardt 2011, Munteanu 2004, Semenova 2003, and Teo 1999, compared FDCs versus single‐drug formulations during the whole treatment. The four remaining trials, Lienhardt 2011, Munteanu 2004, Semenova 2003, and Teo 1999, compared FDCs versus single‐drug formulations exclusively during the intensive phase. In Lienhardt 2011 and Munteanu 2004 all participants received FDCs during the continuation phase. Semenova 2003 did not report the continuation phase, and in Teo 1999 all participants received single‐drug formulations during the continuation phase. No trial compared FDCs versus single‐drug formulations exclusively during the continuation phase.
In Table 3, we describe the doses administered during the intensive phase in all trials for both treatment groups (FDCs and single‐drug formulations). Table 3 also shows a simulation of doses received by participants during the intensive phase according to body weight.
| Trial | Regimen treatment | Directly observed therapy | Dosing | Dose simulation during intensive phase | Comment | |||
| 45 kg participant | 60 kg participant | |||||||
| Fixed‐dose | Single‐dose | Fixed‐dose | Single‐dose | |||||
| 2HRZE/4HR | Mode of drugs administration: not reported | By weight categories | Unclear | Unclear | Unclear | Unclear | The trial authors state: "The mean daily doses of INH, PZA and EMB administered during the initiation phase in the 4‐FDC group were significantly lower than those administered in the ST group; RMP doses were similar in both groups". | |
| 2HRZ/4HR | At the beginning of intensive phase | By weight categories | H: 250 mg R: 600 mg Z: 1500 mg | H: 300 mg R: 450 mg Z: 1500 mg | H: 300 mg R: 720 mg Z: 1800 mg | H: 300 mg R: 600 mg Z: 2000 mg | During directly observed treatment (DOT), "health personal" supervised treatment. Time with DOT is unclear. | |
| 2HRZ/4HR | No | By weight categories only for FDCs | H: 225 mg R: 450 mg Z: 1200 mg | Not reported | H: 300 mg R: 600 mg Z: 1600 mg | Not reported | Self‐administered treatment was done during the whole treatment. Dose used for single‐drug formulations: not reported. | |
| 2HRZE/4HR1 | During 6 days a week | By weight categories | H: 225 mg R: 450 mg Z: 1200 mg E: 825 mg | H: 250 mg R: 450 mg Z: 1200 mg E: 800 mg | H: 300 mg R: 600 mg Z: 1600 mg E: 1100 mg | H: 300 mg R: 600 mg Z: 1600 mg E: 1200 mg | The trial authors state: "In the majority of the trial centers, treatment was fully supervised for a minimum of 6 days a week". Every treatment dose was taken under the supervision of the medical staff. | |
| 2HRZE/4HR | During the intensive phase | Not reported | Not reported | Not reported | Not reported | Not reported | The supervision mechanism during DOT is unclear, and only mention "strictly supervised". Self‐administered treatment was done during the continuation phase. | |
| 2HRZ/4HR2 | No | By weight categories | H: 320 mg R: 480 mg Z: 1000 mg | Unclear | H: 400 mg R: 600 mg Z: 1250 mg | Unclear | Self‐administered treatment during the whole treatment. | |
| 4HRZE | Mode of drugs administration: not reported | By weight categories | Mairin‐P: 4 tablets + H: 225 mg | H: 450 mg R: 450 mg Z: 900 mg E: 1125 mg | Mairin‐P: 5 tablets + H: 300 mg | H: 600 mg R: 600 mg Z: 1200 mg E: 1500 mg | Streptomycin was added in 2 of the 4 randomized groups3. | |
| 2HRZE/4HRE | No | By weight categories | H: 200 mg R: 480 mg Z: 1000 mg E: not reported | H: 300 mg R: 450 mg Z: 1500 mg E: 1200 mg | H: 250 mg R: 600 mg Z: 1250 mg E: not reported | H: 300 mg R: 600 mg Z: 1500 mg E: 1200 mg | Self‐administered treatment during the whole treatment. | |
| 2HRZE/3HR | Once a weekly | By weight categories | Average dose H: 225 mg R: 450 mg Z: 1200 mg E: 825 mg | Average dose H: 300 mg R: 450 mg Z: 1500 mg E: 750 mg | Average dose H: 225 mg R: 450 mg Z: 1200 mg E: 825 mg | Average dose H: 300 mg R: 450 mg Z: 1500 mg E: 750 mg | The study authors state: "The loose drug regimen contained higher dosages of H and Z and lower dosage for E compared to the FDCs". Drugs "were given under supervision at health facilities" during DOT. Self‐administered treatment was done the remaining days. | |
| Three different regimes were given4 | During the whole treatment | By weight categories | H: 250 mg R: 600 mg Z: 1500 mg S: 750 mg | H: 300 mg R: 600 mg Z: 1500 mg S: 750 mg | H: 300 mg R: 720 mg Z: 1800 mg S: 750 mg | H: 300 mg R: 600 mg Z: 2000 mg S: 750 mg | The supervision mechanism during DOT is not clear. And only mention: DOT was given "at the community health clinic". | |
| 2HRZE/4HRE | Treatment was given as TDO 5 days per week and self‐administered during weekends | By weight categories | H: 320 mg R: 480 mg Z: 1000 mg | H: 300 mg R: 450 mg Z: 1125 mg E: 900 mg | H: 400 mg R: 600 mg Z: 1250 mg | H: 300 mg R: 600 mg Z: 1500 mg E: 1200 mg | DOT was supervised by "health workers". The ethambutol dose in FDCs groups was not reported. | |
| 2HRZE/4HRE | During the intensive phase | By weight categories | 5H: 300 mg R: 480 mg Z: 1400 mg E: 1000 mg | H: 300 mg R: 450 mg Z: 1500 mg E: 1200 mg | 5H: 375 mg R: 600 mg Z: 1750 mg E: 1250 mg | H: 400 mg R: 600 mg Z: 2000 mg E: 1600 mg | The supervision mechanism during DOT is unclear and only mention: "directly observed therapy was followed for each patient on a daily basis". | |
| 2HRZ/4HR | During the intensive phase | By weight categories | H: 320 mg R: 400 mg Z: 1000 mg | H: 300 mg R: 450 mg Z: 1500 mg | H: 400 mg R: 600 mg Z: 1250 mg | H: 300 mg R: 600 mg Z: 1500 mg | The trial authors state: "All drugs were taken under close supervision of a health care provider". | |
| 2HRZ/4HR | Only for a part of participants6 | By weight categories | H: 320 mg R: 480 mg Z: 1000 mg | H: 300 mg R: 450 mg Z: 1500 mg | H: 320 mg R: 480 mg Z: 1000 mg | H: 300 mg R: 600 mg Z: 1500 mg | There were 3 kinds of treatment management combined with 3 supervision models. | |
Abbreviations: kg: kilograms of body weight; H: isoniazid; R: rifampicin; Z: pyrazinamide; E: ethambutol; FDCs: fixed‐dose combinations; SDF: single‐dose formulations; mg: milligrams; DOT: directly‐observed treatment.
1In Lienhardt 2011 the treatment regimen was 8 weeks for intensive phase and 18 weeks for continuation phase.
2In RCTAI 1989 the treatment regimen was 8 weeks for intensive phase and 18 weeks for continuation phase.
3 Data and dosage simulation done only for the groups 1 and 3. (In Semenova 2003 there were another two regimens for the intensive phase: 2 and 4).
4Data extracted and dose simulation done only for the regimen 1: 2SHRZ. (In Teo 1999 there were another two regimens for the intensive phase: 1SHRZ and 2HRZ).
5In the FDCs group, data and dosage similation presented for the regimen A. (In Zaka‐Ur‐Rehman 2008 there was another FDCs regimen: regimen B).
6In Zhu 1998 there were 3 modes of treatment supervision.
In Bartacek 2009 and Suryanto 2008, there were some differences in doses between the intervention and control groups. In Bartacek 2009, "the mean daily dosage of H, Z and E in FDCs group was lower than in single‐drug formulations group". Moreover, FDCs were administered on the basis of body weight according to international recommendations (the World Health Organization (WHO) and the International Union Against Tuberculosis and Lung Disease; Blomberg 2001), and single‐drug formulations were administered according to the national treatment standards of each included country. In Suryanto 2008, compared with FDCs (given according to WHO recommendations; WHO 2002), single‐formulation regimens contained higher doses of isoniazid and pyrazinamide and lower doses of ethambutol. However, the dose was adjusted to body weight in both groups (intervention and control) (see Table 3).
Nine included trials used daily medication during the intensive and continuation phase (Bartacek 2009; Chaulet 1995; Geiter 1987; RCTAI 1989; Su 2002; Wu 2015; Zaka‐Ur‐Rehman 2008; Zhang 1996; Zhu 1998). Four included trials used daily medication during the intensive phase, and intermittent medication during the continuation phase (Lienhardt 2011; Munteanu 2004; Suryanto 2008; Teo 1999). One trial (Semenova 2003) reported daily medication for the intervention groups and did not report the frequency of treatment in control groups. None of the clinical trials used treatment twice a week.
Seven trials used directly observed treatment (DOT); five during the whole treatment (Lienhardt 2011; Munteanu 2004; Teo 1999; Wu 2015; Zhang 1996) and two only during the intensive phase (Chaulet 1995; Zaka‐Ur‐Rehman 2008). In Chaulet 1995 and Zaka‐Ur‐Rehman 2008, treatment was self‐administered during the continuation phase. Four trials used self‐administered treatment during the whole therapy (Geiter 1987; RCTAI 1989; Su 2002; Suryanto 2008). Two trials did not report the mode of treatment administration (Bartacek 2009; Semenova 2003). In Zhu 1998, there were three kinds of treatment management combined with three supervision models, respectively.
During the intensive phase, five trials used four drugs in FDC (Bartacek 2009; Lienhardt 2011; Semenova 2003; Suryanto 2008; Zaka‐Ur‐Rehman 2008), eight trials used three drugs in FDC (Chaulet 1995; Geiter 1987; RCTAI 1989; Su 2002; Teo 1999; Zhang 1996; Zhu 1998), and one trial used two drugs in FDC and two additional single drugs (Munteanu 2004). We have detailed each FDC used by each included trial in the 'Characteristics of included studies' section.
Semenova 2003 compared daily treatment with four FDCs versus four single‐drug formulations during the intensive phase. It is unclear whether treatment was supervised or self‐administered, and when follow‐up concluded. The trial gave data precisely up to the end of the intensive phase (four months after initiation of treatment).
Outcomes
We have described below the outcomes for the 13 trials we included in the quantitative analyses.
A combined endpoint of treatment failure, relapse, or death
No included trials examined the combined outcome.
Treatment failure
Seven included trials assessed this outcome (Bartacek 2009; Chaulet 1995; Lienhardt 2011; Su 2002; Suryanto 2008; Teo 1999; Wu 2015). All but one trial, Lienhardt 2011, reported treatment failure based only on bacteriological confirmation in all participants. Lienhardt 2011 also reported failure based on “clinical or radiographic deterioration in absence of bacteriological confirmation” in only one participant. See Table 1 for each included trials' suggested definition of treatment failure.
Relapse
This outcome was available in nine included trials (Bartacek 2009; Chaulet 1995; Lienhardt 2011; RCTAI 1989; Su 2002; Suryanto 2008; Teo 1999; Zaka‐Ur‐Rehman 2008; Zhang 1996). All but two included trials, RCTAI 1989 and Suryanto 2008, reported relapse based only on bacteriological confirmation in all participants. These two RCTs reported relapse confirmed by bacteriological results but also based on other methods, such as information from interviews and verbal autopsies in 19 participants (Suryanto 2008), or X‐ray in one participant (RCTAI 1989). See Table 1 for each included trials' definition of relapse.
Death
Eleven trials assessed this outcome (Bartacek 2009; Geiter 1987; Lienhardt 2011; RCTAI 1989; Su 2002; Suryanto 2008; Teo 1999; Wu 2015; Zaka‐Ur‐Rehman 2008; Zhang 1996; Zhu 1998). We included all causes of death.
The included trials were published between 1987 and 2015, which made it impossible to present the same definitions of treatment failure and relapse across all trials. For these two outcomes, we used the trial authors' proposed definitions and collected data based on bacteriological confirmation (sputum smear or culture results) (see Table 1).
Sputum smear or culture conversion
For this outcome, all included trials reported data at two months and only seven trials reported data at six months (Bartacek 2009; RCTAI 1989; Su 2002; Suryanto 2008; Wu 2015; Zhang 1996; Zhu 1998).
Time to sputum smear or culture conversion
Only Zaka‐Ur‐Rehman 2008 reported on this outcome.
Time to relapse
Only Teo 1999 reported on this outcome.
Treatment adherence
Five included trials reported on this outcome (Chaulet 1995; Geiter 1987; RCTAI 1989; Su 2002; Zhu 1998) at the end of treatment (EOT) and three trials also reported on it during the first eight weeks of treatment (Chaulet 1995; Geiter 1987; RCTAI 1989). Each trials used different adherence assessment methods.
-
Chaulet 1995 determined adherence by testing urine for isoniazid metabolites and considered participants with at least one negative urine test as non‐adherent.
-
Geiter 1987 assessed appointment‐keeping behaviour, by asking participants about missed doses, by pill counts, and by testing urine for isoniazid metabolites. Geiter 1987 considered participants who missed more than 14 days of any study drug without medical advice, or participants that had four consecutively missed appointments as non‐adherent.
-
RCTAI 1989 determined adherence by delay in drug collection and surprise pill count (surprise visit once a month). The delay was measured in drug‐days, expressed as a percentage of total treatment days and classified as either: none, 1% to 10% and greater than 10%. For this Cochrane review, we considered participants with no drug‐days lost as adherent.
-
Su 2002 determined adherence by “cases lost to follow‐up and cases changed to another regimen during treatment".
-
In Zhu 1998, the supervision process was unclear (by testing urine or by indirect methods).
See Table 1 for details on treatment adherence in each trial.
Acquisition of drug resistance
Three trials reported on this outcome (Chaulet 1995; Lienhardt 2011; Teo 1999). See Table 1 for details on acquisition of drug resistance in each trial.
Patient satisfaction
General satisfaction
Only Chaulet 1995 reported on this outcome, and assessed it by semi‐directed interviews with targeted questions posed by non‐medical staff at the end of the eighth week of treatment.
Problems swallowing, convenient number of tablets, and acceptable taste
Only Bartacek 2009 reported on this outcome, and noted it at two months.
Adverse events
Serious (death, hospitalizations)
Six trials reported serious adverse events (Bartacek 2009; Lienhardt 2011; Munteanu 2004; RCTAI 1989; Wu 2015; Zaka‐Ur‐Rehman 2008).
Adverse events leading to discontinuation of therapy
All trials reported this outcome.
Other adverse events
All included trials but four, RCTAI 1989, Su 2002, Suryanto 2008, and Wu 2015, reported other adverse events. The most frequent adverse events in this category were gastrointestinal and skin disorders (Bartacek 2009; Chaulet 1995; Lienhardt 2011; Teo 1999; Zaka‐Ur‐Rehman 2008). Other adverse events mentioned were joint and nerve disorders (Chaulet 1995); rheumatic and hepatic disorders (Lienhardt 2011); vestibular reactions (Teo 1999); and jaundice, numbness, and joint pain (Zaka‐Ur‐Rehman 2008). In Zhu 1998, the other most frequent adverse event was liver damage combined with either jaundice or gastrointestinal disorders. Geiter 1987 and Zhang 1996 gave no details of the type of other adverse events reported. In Munteanu 2004, no participant experienced further adverse events.
Outcomes not reported in this Cochrane review
See the 'Characteristics of included studies' section for the outcomes assessed in each clinical trial that we did not report in this Cochrane review.
Excluded studies
We have stated the reasons for exclusion of studies in the 'Characteristics of excluded studies' section.
Risk of bias in included studies
We rated only one trial as free from risk of bias in all assessed domains (Bartacek 2009), and another one as at low risk of bias (Lienhardt 2011). Overall, we rated the risk of bias as suboptimal in the remaining included trials. We have listed the 'Risk of bias' details for all included trials in the 'Risk of bias' tables in the 'Characteristics of included studies' section. For a summary of the 'Risk of bias' assessments see Figure 3 and Figure 4.

'Risk of bias' summary: review authors' judgements about each 'Risk of bias' item for each included trial.

'Risk of bias' graph: review authors' judgements about each 'Risk of bias' item presented as percentages across all included trials.
Allocation
We judged only two trials as free from selection bias (Bartacek 2009; Lienhardt 2011). We considered four trials at low risk of bias for random sequence generation, but not for allocation concealment (Semenova 2003; Wu 2015; Zaka‐Ur‐Rehman 2008; Zhang 1996)
Suryanto 2008 was at high risk of bias for both random sequence generation and allocation concealment, because it performed randomization by the judgment of the clinician through alternate allocation of eligible participants to each regimen to obtain equal numbers for both groups.
The remaining trials were at unclear risk of bias for selection bias.
Blinding
We considered all trials to be free of performance and detection bias. Four trials were described as open trials (Bartacek 2009; Geiter 1987; Lienhardt 2011; Wu 2015), and blinding was not stated in the remaining trials.
For open trials and for those that did not describe the blinding methods, we concluded that outcomes were unlikely to be influenced by the lack of blinding because most outcomes were objective and measurable.
Incomplete outcome data
We considered seven trials to be at low risk of bias (Bartacek 2009; Lienhardt 2011; Munteanu 2004; Su 2002; Teo 1999; Zaka‐Ur‐Rehman 2008; Zhang 1996). In Bartacek 2009, Lienhardt 2011, Su 2002, and Teo 1999, the missing outcome data were balanced in numbers across intervention groups and the reasons for missing data were similar. In Munteanu 2004, the trial authors used appropriate methods for imputing missing data. In Zaka‐Ur‐Rehman 2008, there were no missing outcome data. There were few missing data in Zhang 1996 and reasons for loss were given.
We judged six trials at high risk of bias (Chaulet 1995; Geiter 1987; Semenova 2003; Suryanto 2008; Wu 2015; Zhu 1998).
Some of these trials did not fully report the reasons for participants' withdrawal or were likely to be related to lack of efficacy, or adverse events, or the number of withdrawals was unbalanced between the intervention and control group.
We considered RCTAI 1989 as unclear regarding attrition bias.
Selective reporting
We judged two trials to be free from risk of reporting bias because the published reports included most of the expected outcomes (Bartacek 2009; Su 2002).
We rated three trials at high risk of bias (Lienhardt 2011; Semenova 2003; Suryanto 2008). In Lienhardt 2011, most of the primary and secondary outcomes differed from those stated in the available protocol. In Semenova 2003 and Suryanto 2008, the published reports failed to include key results expected to be reported in clinical trials in this field.
We considered selective reporting to be unclear in nine trials (Chaulet 1995; Geiter 1987; Munteanu 2004; RCTAI 1989; Teo 1999; Wu 2015; Zaka‐Ur‐Rehman 2008; Zhang 1996; Zhu 1998).
Other potential sources of bias
We judged all but two included trials free from other potential sources of bias (Geiter 1987; Semenova 2003).
We rated Geiter 1987 at high risk of bias because this trial was designed with an amended protocol of a former study, and followed an unbalanced randomization scheme. We considered Semenova 2003 to be at unclear risk as it provided insufficient information to enable us to assess whether an important risk of bias existed.
Effects of interventions
See: Summary of findings for the main comparison 'Summary of findings' table 1
See 'Summary of findings' table 1 and 'Summary of findings' table 2 (summary of findings Table for the main comparison; Table 4 ).
| Fixed‐dose combinations (FDCs) compared to single‐drug formulations for treating newly diagnosed pulmonary tuberculosis (TB) | |||||
| Participant or population: treating pulmonary TB | |||||
| Outcomes | Illustrative comparative risks* (95% CI) | Relative effect | Number of participants | Quality of the evidence | |
| Assumed risk single‐drug formulations | Corresponding risk FDCs | ||||
| Combined endpoint of treatment failure, relapse, or death** | — | — | — | (0 RCTs) | — |
| Treatment failure | 22 per 1000 | 25 per 1000 | RR 1.17 | 2507 | ⊕⊕⊕⊝ |
| Relapse | 79 per 1000 | 88 per 1000 | RR 1.12 | 2293 | ⊕⊕⊕⊝ |
| Death | 9 per 1000 | 12 per 1000 | RR 1.35 | 2470 | ⊕⊕⊕⊝ |
| Sputum smear or culture conversion at end of treatment | 827 per 1000 | 802 per 1000 | RR 0.97 | 1159 | ⊕⊕⊕⊕ |
| Serious adverse events | 17 per 1000 | 25 per 1000 | RR 1.44 | 2703 | ⊕⊕⊕⊝ |
| Adverse events leading to discontinuation of therapy | 18 per 1000 | 30 per 1000 | RR 1.71 | 2703 | ⊕⊕⊕⊝ |
| *The risk in the intervention group (and its 95% CI) is based on the assumed risk in the comparison group and the relative effect of the intervention (and its 95% CI). | |||||
| GRADE Working Group grades of evidence | |||||
1We did not downgrade the quality due to inconsistency. I² statistic = 0%.
2We did not downgrade the quality for risk of bias. There were no limitations in the design and execution of the trials.
3Downgraded by 1 for imprecision. The optimal information size, considering an absolute > 0.5% non‐inferiority margin as clinically meaningful, is not reached. In addition, 1 side of the 95% CI does not exclude potential harm associated to FDCs.
4We did not downgrade quality for indirectness. Differences in dosages probably do not affect the comparability of groups.
5We did not downgrade quality due to inconsistency. Large heterogeneity (I² statistic = 72%) can be explained by the limited number of events and the effect of chance.
6Downgraded by 1 for imprecision. The optimal information size, considering an absolute > 0.1% non‐inferiority margin as clinically meaningful, is not reached. In addition, the number of events is very limited.
7We did not downgrade the quality due to inconsistency. There was only a single included trial.
8We did not downgrade the quality due to imprecision. Although the optimal information size considering an absolute > 0.5% non‐inferiority margin as clinically meaningful is not reached, the total sample size and number of events are very large.
We included 13 RCTs in quantitative analyses, which included 5824 randomized participants. All trials compared FDCs versus single‐drug formulations for the treatment of pulmonary TB in newly diagnosed participants.
The trials and the meta‐analyses were underpowered to allow us to confidently detect or exclude clinically important changes on the primary dichotomous outcomes related to treatment efficacy (treatment failure and relapse), the sputum smear or culture conversion at EOT, death, and adverse events (see Table 5).
| Outcomes | Assumed risk | Clinically important reduction | Optimal sample size 1,2 | |
| Single‐drug formulations | Absolute | Relative | ||
| Treatment failure | 2.2 % | 0.5% | 25% | 6092 |
| Relapse | 2.3 % | 0.5% | 25% | 4718 |
| Death3 | 0.9 % | 0.1% | 4.5% | 737,340 |
| Sputum/culture conversion at end of treatment | 88.7% | 0.5% | 0.6% | 95,044 |
| Serious adverse events | 1.5 % | 0.1% | 6.7% | 12,356 |
| Adverse events leading to discontinuation of therapy | 4.1 % | 0.5% | 24.4% | 325,024 |
1We based all calculations are based on: 1‐sided tests, with a ratio of 1:1, power of 0.9, and confidence level of 0.05.
2We performed all calculations using: http://www.sealedenvelope.com/power/binary‐noninferior/.
3 If there is truly no difference between the standard and experimental treatment, then 737,340 participants are required to be 90% sure that the upper limit of a 1‐sided 95% confidence interval (CI) (or equivalently a 90% 2‐sided CI) will exclude a difference in favour of the standard group of more than 0.1%.
A combined endpoint of treatment failure, relapse, or death
We did not identify any trials that examined the combined outcome.
Treatment failure
The proportion of participants that experienced treatment failure was similar with FDCs and single‐drug formulations (3606 participants, seven trials, Analysis 1.1).
Relapse
Overall, there is a trend towards a higher number of relapses with the use of FDCs although the confidence interval (CI) included no difference (RR 1.28, 95% CI 1.00 to 1.64; I² statistic = 0; 3621 participants, 10 trials, Analysis 1.2). In the analysis of trials at high or unclear risk of bias, we found a statistically significant increase in relapse with FDCs (RR 2.84, 95% CI 1.34 to 6.00; I² statistic = 0; 1328 participants, eight trials, Analysis 2.2). Inclusion of only the trials at low risk of bias showed no difference between FDCs or single‐drug formulations (2293 participants, two trials, Analysis 2.2).
Death
There was no significant difference between the two groups for all causes of death (4800 participants, 11 trials, Analysis 1.3).
Sputum smear or culture conversion
Data were available to assess sputum smear or culture conversion at two and six months. There was no significant difference between treatment with FDCs or single‐drug formulations in sputum smear or culture conversion either at two months (4836 participants, 13 trials, Analysis 1.4), or at six months (2319 participants, seven trials, Analysis 1.5).
Time to sputum smear or culture conversion
Only one trial reported data for this outcome (Zaka‐Ur‐Rehman 2008), but data were insufficient to estimate hazard ratios (HRs) and we could not assess any treatment effect. The mean number of days for sputum conversion was 34.85 days (standard deviation (SD) 17.39) for FDCs with 194 participants, and 37.97 days (SD 18.35) for single‐drug formulations with 99 participants.
Time to relapse
Only one trial reported data for this outcome (Teo 1999), but data were insufficient to estimate HRs, and we could not assess any treatment effect. The mean number of months to relapse was 15 months (SD 16.722) for FDCs with 12 participants, and 18 months (SD 20.232) for single‐drug formulations with three participants.
Treatment adherence
Data were available to evaluate treatment adherence at eight weeks and at the EOT. There was no significant difference in treatment adherence between the two interventions either at eight weeks (881 participants, three trials, Analysis 1.6) or at the EOT (1229 participants, five trials, Analysis 1.7).
Acquisition of drug resistance
There was no significant difference in the probability of acquiring drug resistance (491 participants, three trials, Analysis 1.8).
Patient satisfaction
General satisfaction
One trial, Chaulet 1995, recorded general satisfaction and did not show any differences (222 participants, Analysis 1.9).
Problems swallowing
One trial, Bartacek 2009, reported problems swallowing and there was no significant difference between treatments (1023 participants, Analysis 1.9).
Convenient number of tablets
Only Bartacek 2009 reported this outcome. Participants treated with FDCs found the number of tablets more convenient compared with participants treated with single‐drug formulations (RR 1.50, 95% CI 1.37 to 1.64; 1045 participants, one trial, Analysis 1.9).
Acceptable taste
Bartacek 2009 reported on this outcome. Participants treated with FDCs recognized that the tablets tasted better compared to participants who were treated with single‐drug formulations (RR 1.39, 95% CI 1.27 to 1.51; 1044 participants, one trial, Analysis 1.9).
Adverse events
Serious adverse events (death, hospitalizations)
There was no statistically significant difference in the number of serious adverse events in the meta‐analysis of the six trials that reported this outcome (3388 participants, six trials, Analysis 1.10).
Adverse events leading to discontinuation of therapy
There was no difference between the treatment groups regarding the adverse events that led to discontinuation of treatment (5530 participants, 13 trials, Analysis 1.11).
Other adverse events
There was a trend of fewer other adverse events with treatment with FDCs, which just reaches standard levels of statistical significance (RR 0.85, 95% CI 0.72 to 1.00; I² statistic = 38%; 4639 participants, nine trials, Analysis 1.12).
Subgroup analysis
We were able to perform four subgroup analyses based on the available data.
-
FDCs administered only during the intensive phase versus FDCs administered for the whole treatment.
-
Daily regimen for the whole treatment versus daily regimen during in the intensive phase followed by intermittent regimen in the continuation phase.
-
Supervised treatment versus self‐administered treatment during the intensive phase.
-
Trials with four drugs as FDCs versus trials with three or two drugs as FDCs during the intensive phase.
There were subgroup differences on relapse in three subgroup analyses.
-
FDCs administered only in the intensive phase versus FDCs for the whole treatment: relapses were more frequent in participants treated with FDCs when combined tablets were administered only in the intensive phase (RR 3.94, 95% CI 1.13 to 13.78; 251 participants, one trial, Analysis 4.2).
-
Daily medication for the whole treatment versus daily medication in the intensive phase followed by intermittent treatment in the continuation phase: relapses were more frequent in participants treated daily with FDCs during the intensive phase and intermittently during the continuation phase (RR 1.72, 95% CI 1.07 to 2.75; 1771 participants, three trials, Analysis 5.2).
-
Four drugs as FDCs versus trials with three or two drugs as FDCs in the intensive phase: relapses were more frequent with FDCs in participants treated with three or two drugs as FDCs in the intensive phase (RR 2.55, 95% CI 1.07 to 6.06; 848 participants, five trials, Analysis 7.2).
These differences are due almost exclusively to one trial, Teo 1999, which used a FDCs with three active oral ingredients (H, R and Z) in the intensive phase for the intervention group and single‐drug formulations for all participants in the continuation phase. In addition, there was a daily treatment during the intensive phase which was followed by intermittent treatment in the continuation phase. This trial had a higher number of relapses in the intervention arm, possibly due to the change from FDCs given daily during the intensive phase to single‐drug formulations given three times a week during the continuation phase.
Overall, we did not observe any statistically significant subgroup differences in the remaining outcomes for the rest of the performed analyses.
There were no available data for subgroup analyses of HIV‐positive versus HIV‐negative participants or for clinically diagnosed versus laboratory diagnosed participants. Only two trials reported the HIV status of participants and neither of them stratified their results according to this status (Bartacek 2009; Lienhardt 2011). All included trials reported pulmonary TB diagnosed by bacteriological results, and in no case by clinical diagnosis.
Sensitivity analysis
Risk of bias
We performed a sensitivity analysis by risk of bias of included trials. We pooled results from Bartacek 2009 and Lienhardt 2011, the two trials at low risk of selection bias.
Relapse: the analysis restricted to the trials at low risk of bias showed no difference between treatment with FDCs or single‐drug formulations (2293 participants, two trials, Analysis 2.2).
Adverse events leading to discontinuation of therapy: the risk of experiencing this outcome was higher among those who received FDCs than among those who received single‐drug formulations in the analysis of trials at low risk of selection bias (RR 1.71, 95% CI 1.04 to 2.81; I² statistic = 0%; 2703 participants, two trials, Analysis 2.8).
For the remaining outcomes, the analyses reached similar results to those of the main comparison (see Data and analyses: Comparison 2 'Fixed‐dose combinations versus single‐drug formulations as available data: sensitivity analysis by risk of bias'.
ITT analysis
We also performed a sensitivity analysis under an ITT analysis. We performed this analysis for the following outcomes: a) failure; b) relapse; and c) sputum smear or culture conversion (at two months of starting treatment and at EOT). There was no significant difference in relapse between the two interventions (4716 participants, 10 trials, Analysis 3.2). For the rest of the outcomes, this analysis showed similar results to those of the main analysis (see Data and analyses: Comparison 3 'Fixed‐dose combinations versus single‐drug formulations: sensitivity analysis by intention‐to‐treat').
Assessment of reporting biases
The funnel plot for sputum smear or culture conversion at two months in the comparison of treatment with FDCs versus single‐drug formulations showed no inherent risk of publication bias in the trials included in the meta‐analyses, although these analyses included few trials (Figure 5). The funnel plot for death showed a similar result (figure not shown).

Funnel plot of comparison: 1 Fixed‐dose combinations versus single‐drug formulations as available data, outcome: 1.4 Sputum smear or culture conversion at two months of starting treatment.
Discussion
Summary of main results
This Cochrane review included 13 RCTs with a total of 5824 participants, and overall did not find any difference between fixed‐dose combinations (FDCs) and single‐drug formulations for the treatment of pulmonary tuberculosis (TB) in newly diagnosed people. We have presented a summary of the evidence in 'Summary of findings' table 1 (summary of findings Table for the main comparison) (there is an additional 'Summary of findings' table using data from the sensitivity analysis in the Additional tables section, Table 4).
We did not detect any difference in treatment failure and death between people treated with FDCs or single‐drug formulations (moderate quality evidence). Relapse may slightly more frequent in people treated with FDCs compared to single‐drug formulations (low quality evidence).
FDCs and single‐drug formulations have similar effects on sputum smear or culture conversion at the end of treatment (EOT) (high quality evidence) and on serious adverse events (moderate quality evidence). There were no differences in adverse events leading to discontinuation of therapy (low quality evidence) between people treated with FDCs or single‐drug formulations.
The analyses for these outcomes were underpowered to detect clinically important differences (Table 5).
Overall completeness and applicability of evidence
All included trials except Geiter 1987 were conducted in high TB‐burden countries and low‐ and middle‐income countries. All included trials compared the use of FDCs with single‐drug formulations in adults, and administered a standard first‐line treatment regimen for people newly diagnosed with pulmonary TB (Table 2). Overall, the doses of anti‐TB drugs used were equivalent to the currently recommended doses for pulmonary TB patients (WHO 2010). Although not all the included trials used uniform definitions of outcomes and comparable follow‐up time, we consider these review findings to be widely applicable.
In TB treatment, the dose administered of each drug is crucial. Ideally in clinical trials, FDCs and single‐drug formulations should be compared using equal doses to assess the real effect of the administered dose. Although the included trials administered similar doses in both treatment arms, doses generally were unequal. Only Lienhardt 2011 gave equal doses to both treatment arms. Imbalances between treatment arms were more pronounced in some trials with higher doses of some drugs in the single‐drug formulations arm: higher doses of isoniazid and pyrazinamide (Su 2002; Suryanto 2008); higher doses of pyrazinamide and ethambutol (Zaka‐Ur‐Rehman 2008); and higher doses of pyrazinamide (Zhang 1996; Zhu 1998) (see Table 3). This may explain the favourable results with single‐drug formulations in some included trials.
There is a lack of data regarding some important outcomes such as acceptability (outcome concerning patients) and acquisition of drug resistance (clinically and bacteriologically relevant outcomes). We analysed general satisfaction, which only Chaulet 1995 recorded, and no problems swallowing and acceptable taste, which Bartacek 2009 recorded. There rest of the included trials had limited data about acceptability. Only three trials reported acquisition of drug resistance (Chaulet 1995; Lienhardt 2011; Teo 1999; see the 'Characteristics of included studies' section).
TB therapy in real clinical practice may differ from the procedures in clinical trials. Firstly, clinical trials implement interventions that are more similar to directly observed treatments (DOT) than to self‐administered treatments. In clinical practice, self‐administered treatments are more frequent and also, with this mode of administration, participants may interrupt the treatment or take fewer pills than those needed or prescribed, which can lead to drug resistance of the bacteria. In this case, feasibility of administration (potentially better for single‐drug formulations in terms of smaller pills, but better for FDCs in terms of fewer pills to take) and ensuring dosing of all drugs together (better for FDC pills) would be important issues to prevent treatment discontinuation and acquisition of resistance. Additionally, participants included in clinical trials are selected, whereas those participating in clinical practice are not. This means that participants with TB in clinical practice often present with co‐morbid conditions, such as human immunodeficiency virus (HIV) and other diseases that could increase the number of tablets taken daily, which may be a key factor in treatment withdrawal/defaulting. The included trials reported a low percentage of HIV participants, which possibly makes the results less applicable to this population.
The applicability of the evidence from this Cochrane review to a specific country depends on the strength of its healthcare system. Issues in TB treatment in developed countries or urban settings differ from those in resource‐limited countries or rural settings. Factors such as ease of administration, need for directly observed treatment (DOT), and costs of therapy differ in importance depending on the country or setting. Even the implementation of the intervention will differ between settings; for example, methods for DOT may include weekly drug delivery with treatment intake under the supervision of relatives, or daily drug delivery with treatment intake under supervision of a medical staff member. Moreover, differences can occur depending on the way drugs are dispensed to participants: by giving participants appointments at the clinic or hospital, visiting them at home, or applying mixed approaches.
Achievement of high TB cure rates is the most important goal of intervention in TB control. This systematic review provides moderate quality evidence that FDCs present similar efficacy to separate formulations. Nevertheless, FDCs have important features that should be expected to greatly influence the improvement of TB outcomes in the medium and long term and, of course, its control. The recommendation for use of FDCs should also be supported by the characteristics of FDCs. FDCs contain similar doses of individual drugs which can lead to non‐inferior efficacy and similar safety. With FDCs the number of daily tablets can be reduced, and drug management and storage by the patient should be easy; thus making it possible to increase patient satisfaction and decrease medication errors, burden, and cost for patients. Treatment simplifications can reduce the risk of monotherapy and improve treatment compliance. FDC use could improve sputum and culture conversion rate and lower the failure rate, relapse rate, treatment resistance, and morbidity and mortality rates (Figure 1).
Two advantages of FDCs are feasibility and ease of administration, which favour treatment compliance and increase patients’ quality of life, especially the quality of life of patients that may need additional therapy for concomitant diseases such as HIV. However, single‐drug formulations allow a better dose adjustment to the body weight and avoid the issue of complete interruption of therapy when drug‐specific adverse effects occur (Figure 1).
Quality of the evidence
We assessed the quality of the evidence using the GRADE approach and presented the results in 'Summary of findings' table 1 (summary of findings Table for the main comparison) and 'Summary of findings' table 2 (Table 4).
The quality of evidence for the efficacy and safety of FDCs is high to low, depending on reported outcomes, due to two main concerns.
-
Imprecision of results: the quality of the evidence was moderate for treatment failure, death, and serious adverse events, and low for relapse and adverse events leading to discontinuation of therapy. We downgraded the quality of the evidence for these outcomes because the meta‐analysis remained significantly underpowered to confidently prove or exclude clinically important effects.
-
Risk of bias of included studies: the quality of the evidence was low for relapse and adverse events leading to discontinuation of therapy. We downgraded these two outcomes for the difference in results of pooled estimate of effect when we excluded trials at high risk of bias.
The quality of evidence was high for sputum smear or culture conversion at the EOT, which we did not downgrade because the analysis with trials at low risk of bias did not change the effect estimate and the difference in drug doses probably does not affect the comparability of intervention and control group. In addition, there was no statistical heterogeneity among trials that reported this outcome. Moreover, although the optimal information size was not reached (considering an absolute non‐inferiority margin of greater than 0.5% as clinically meaningful), the total sample size and number of events for this outcomes are very large.
Potential biases in the review process
We minimized the biases in the review process by performance of an exhaustive search strategy, which included the most important bibliographic databases of clinical trials, without time or language limitations. The Information Specialist of the Cochrane Infectious Diseases Group, Vittoria Lutje, performed the search and we checked the reference lists of relevant studies, which decreased the probability that we missed important studies. We were able to obtain all the published papers of the trials and all available data.
Two review authors independently performed study selection and 'Risk of bias' assessments of included trials. We consulted a third review author to resolve any disagreements. Two review authors independently performed data extraction. We excluded one RCT that met the inclusion criteria from the quantitative analysis because disaggregate results were unavailable.
The assessment of reporting biases did not show a small study effect.
Although we tried to minimize all forms of potential biases in this Cochrane review, we cannot completely exclude the possibility of bias.
Agreements and disagreements with other studies or reviews
We found two other systematic reviews that compared the use of FDCs and single‐drug formulations in the treatment of pulmonary TB (Albanna 2013; Zhang 2015).
Albanna 2013 included 15 RCTs, and coincided with this Cochrane review regarding 10 trials. Zhang 2015 included 22 studies, and coincided only regarding six trials.
This Cochrane review, Albanna 2013, and Zhang 2015 present almost the same results for relapse. Albanna 2013 found a trend towards higher risk for “treatment failure or disease relapse” (as a combined outcome) with the use of FDCs (risk ratio (RR) 1.28, 95% confidence interval (CI), 0.99 to 1.7). Zhang 2015 found a trend towards higher risk of relapse (as a single outcome) with the use of FDCs (RR 1.72, 95% CI, 0.98 to 3.02). We also found a similar result of relapse (also as a single outcome) with FDCs (RR 1.28, 95% CI 1.00 to 1.64; Analysis 1.2). None of these cases reached statistical significance.
For the remaining coinciding outcomes (acquisition of drug resistance, sputum conversion at two months, overall adverse events, and treatment adherence) neither this Cochrane review nor Albanna 2013 found any difference between treatment with FDCs or single‐drug formulations.
Overall, in Zhang 2015 there were no differences between FDCs and single‐drug formulations in the reported outcomes: sputum smear rate (at two months and at the EOT) and adverse events.
Despite the similar results obtained, this Cochrane review presents some methodological differences compared with Albanna 2013 and Zhang 2015.
-
Included studies: we had different inclusion criteria in this Cochrane review. Albanna 2013 included randomized clinical trials and cohort studies (the latter should include 50 subjects or over) with participants diagnosed with active TB (new patients and patients already treated) with bacteriological confirmation (and treated with FDCs or single‐drug formulations). Zhang 2015 included RCTs and controlled clinical trials that compared anti‐TB treatment given as FDCs with non‐FDC regimens (single drugs or plate‐type‐combined drugs) in the initial treatment of smear‐positive pulmonary TB. Neither Albanna 2013 nor Zhang 2015 accounted for the comparability of treatment regimens between intervention and control groups (same regimens in both groups). We included only RCTs that compared FDCs and single‐drug formulations with the same drugs in both treatment arms for new participants with pulmonary TB.
-
Treatment failure and relapse, types of outcomes measured: Albanna 2013 presented treatment failure and relapse as a combined outcome. It is known that treatment failure and relapse are not the same thing; consequently, two different variables were analysed jointly. Also, the trial authors provided definitions of these two variables, which already differ from each other, that differed widely. Zhang 2015 presented the relapse rate as a single outcome. Treatment failure was not reported. We presented both outcomes (treatment failure and relapse) as single outcomes.
-
Data synthesis: Albanna 2013 calculated a pooled estimate of treatment using a fixed‐effect model and Zhang 2015 used a fixed‐effect model when P was greater than 0.05 with the Q‐test, or a random‐effects model otherwise. We calculated a pooled estimate of treatment using a fixed‐effect model when minimal heterogeneity was present (I² statistic value of less than 50%) and a random‐effects model when moderate heterogeneity was present (I² statistic value of greater than 50%). We did not perform a meta‐analysis with a substantial I² statistic value (greater than 75%).
-
Linking overall quality of the evidence with the effect estimates: Albanna 2013 adopted the PRISMA statement for the methods and results sections, but did not summarize the main findings, including the strength of evidence, for each main outcome. Zhang 2015 stated that “quality evaluation was performed on the incorporated studies according to the `Risk of bias´ Assessment Tool in the System Assessor Handbook 5.1.0 of Cochrane Collaboration update in March 2011”. Nevertheless, the authors did not report results of this assessment. Additionally, Zhang 2015 had some errors or inconsistencies, which made some results difficult to understand. For example:
-
treatment regimens in the experimental group in several trials are not well described, because the drug delivered does not correspond to the treatment strategy for the same trial, according to the trial authors (in their Table 1);
-
text related to their Figure 2 is not about sputum smear rate at EOT;
-
Lienhardt 2011 is mentioned twice in the references section.
-
We assessed the risk of bias of the included trials using the 'Risk of bias' assessment tool and in accordance with the Cochrane Handbook for Systematic Reviews of Interventions (Higgins 2011), recorded the results in a standard table in RevMan (RevMan 2014), and summarized the findings in a 'Risk of bias' table (Figure 3) and a 'Risk of bias' graph (Figure 4). We summarized the quality of the evidence for the main outcomes, and reported the RCT data in 'Summary of findings' tables (summary of findings Table for the main comparison; Summary of findings table 2).
Logic diagram of relationship between the use of fixed‐dose combinations (FDCs) and expected improvement of reported outcomes.
Flow diagram of the trial selection process.
'Risk of bias' summary: review authors' judgements about each 'Risk of bias' item for each included trial.
'Risk of bias' graph: review authors' judgements about each 'Risk of bias' item presented as percentages across all included trials.
Funnel plot of comparison: 1 Fixed‐dose combinations versus single‐drug formulations as available data, outcome: 1.4 Sputum smear or culture conversion at two months of starting treatment.

Comparison 1 Fixed‐dose combinations versus single‐drug formulations as available data, Outcome 1 Treatment failure.

Comparison 1 Fixed‐dose combinations versus single‐drug formulations as available data, Outcome 2 Relapse.
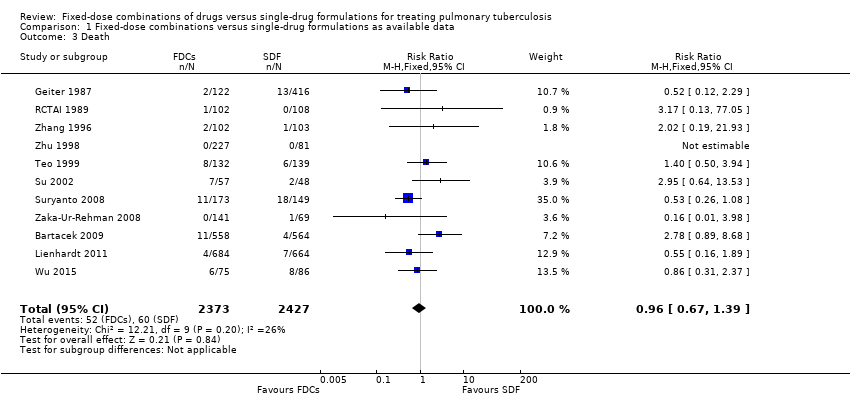
Comparison 1 Fixed‐dose combinations versus single‐drug formulations as available data, Outcome 3 Death.
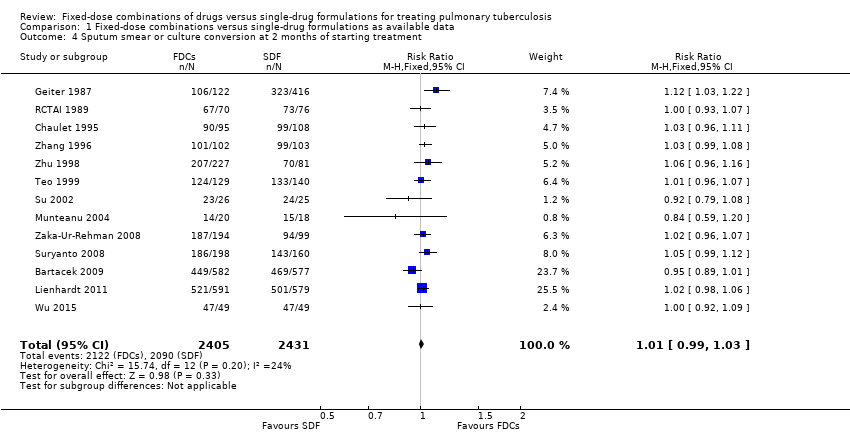
Comparison 1 Fixed‐dose combinations versus single‐drug formulations as available data, Outcome 4 Sputum smear or culture conversion at 2 months of starting treatment.
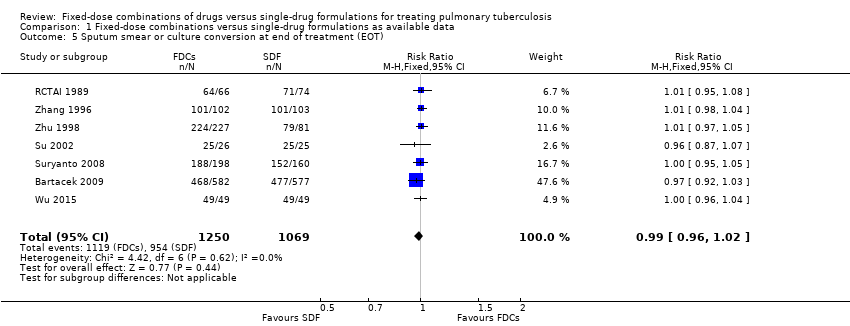
Comparison 1 Fixed‐dose combinations versus single‐drug formulations as available data, Outcome 5 Sputum smear or culture conversion at end of treatment (EOT).

Comparison 1 Fixed‐dose combinations versus single‐drug formulations as available data, Outcome 6 Treatment adherence at 8 weeks of starting treatment.

Comparison 1 Fixed‐dose combinations versus single‐drug formulations as available data, Outcome 7 Treatment adherence at EOT.

Comparison 1 Fixed‐dose combinations versus single‐drug formulations as available data, Outcome 8 Acquisition of drug resistance.

Comparison 1 Fixed‐dose combinations versus single‐drug formulations as available data, Outcome 9 Patient satisfaction.

Comparison 1 Fixed‐dose combinations versus single‐drug formulations as available data, Outcome 10 Serious adverse events.

Comparison 1 Fixed‐dose combinations versus single‐drug formulations as available data, Outcome 11 Adverse events leading to discontinuation of therapy.

Comparison 1 Fixed‐dose combinations versus single‐drug formulations as available data, Outcome 12 Other adverse events.

Comparison 2 Fixed‐dose combinations versus single‐drug formulations as available data: sensitivity analysis by risk of bias, Outcome 1 Treatment failure.

Comparison 2 Fixed‐dose combinations versus single‐drug formulations as available data: sensitivity analysis by risk of bias, Outcome 2 Relapse.
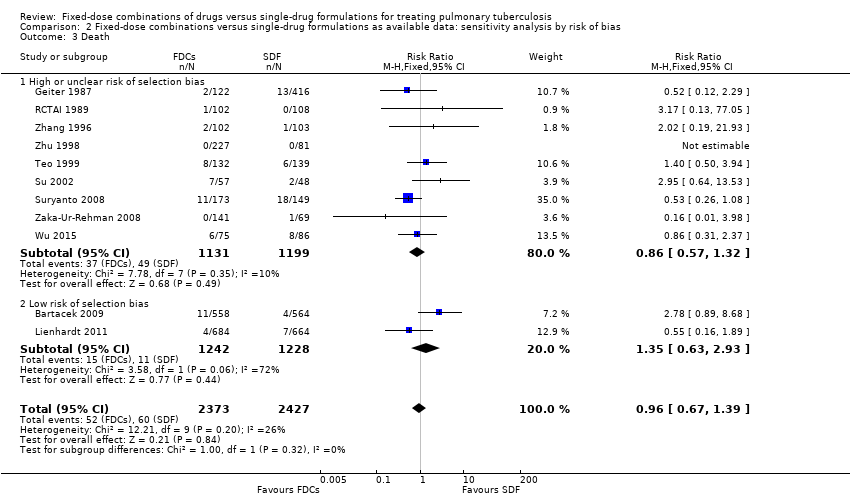
Comparison 2 Fixed‐dose combinations versus single‐drug formulations as available data: sensitivity analysis by risk of bias, Outcome 3 Death.
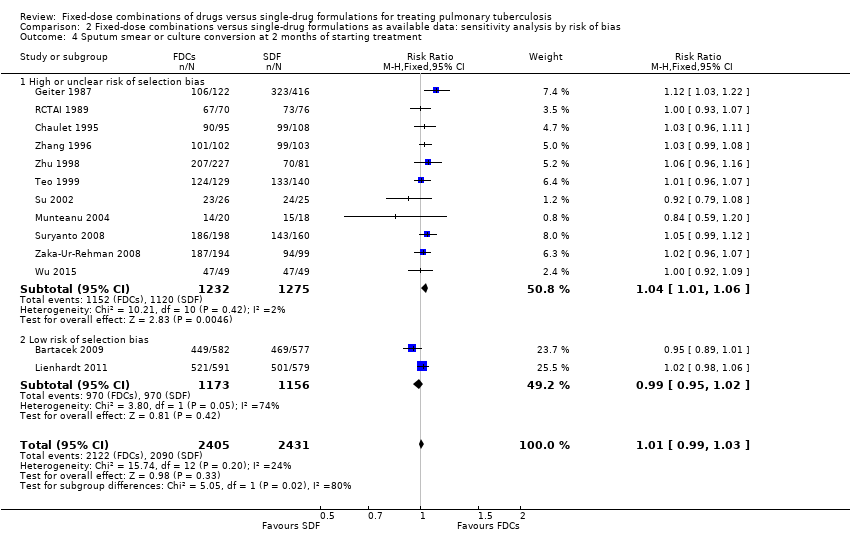
Comparison 2 Fixed‐dose combinations versus single‐drug formulations as available data: sensitivity analysis by risk of bias, Outcome 4 Sputum smear or culture conversion at 2 months of starting treatment.

Comparison 2 Fixed‐dose combinations versus single‐drug formulations as available data: sensitivity analysis by risk of bias, Outcome 5 Sputum smear or culture conversion at EOT.
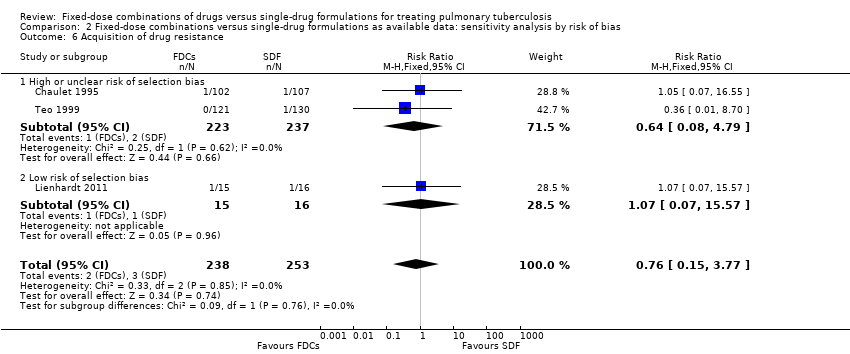
Comparison 2 Fixed‐dose combinations versus single‐drug formulations as available data: sensitivity analysis by risk of bias, Outcome 6 Acquisition of drug resistance.

Comparison 2 Fixed‐dose combinations versus single‐drug formulations as available data: sensitivity analysis by risk of bias, Outcome 7 Serious adverse events.

Comparison 2 Fixed‐dose combinations versus single‐drug formulations as available data: sensitivity analysis by risk of bias, Outcome 8 Adverse events leading to discontinuation of therapy.
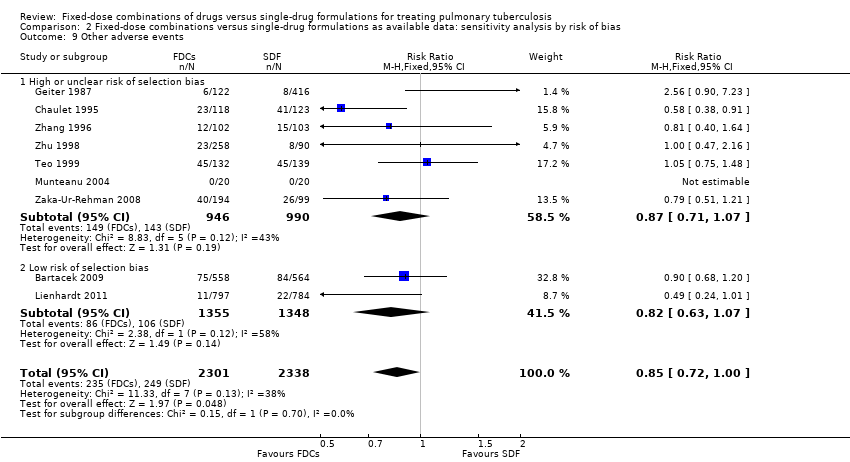
Comparison 2 Fixed‐dose combinations versus single‐drug formulations as available data: sensitivity analysis by risk of bias, Outcome 9 Other adverse events.

Comparison 3 Fixed‐dose combinations versus single‐drug formulations: sensitivity analysis by intention‐to‐treat (ITT), Outcome 1 Treatment failure (ITT analysis and all losses to follow‐up judged as failure).
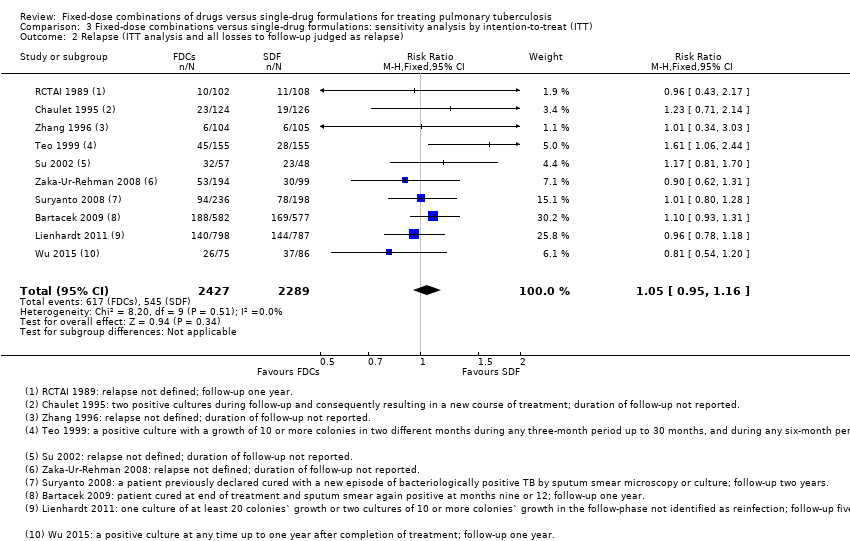
Comparison 3 Fixed‐dose combinations versus single‐drug formulations: sensitivity analysis by intention‐to‐treat (ITT), Outcome 2 Relapse (ITT analysis and all losses to follow‐up judged as relapse).

Comparison 3 Fixed‐dose combinations versus single‐drug formulations: sensitivity analysis by intention‐to‐treat (ITT), Outcome 3 Sputum smear or culture conversion at 2 months of starting treatment (ITT analysis and all losses to follow‐up judged as conversion failure).
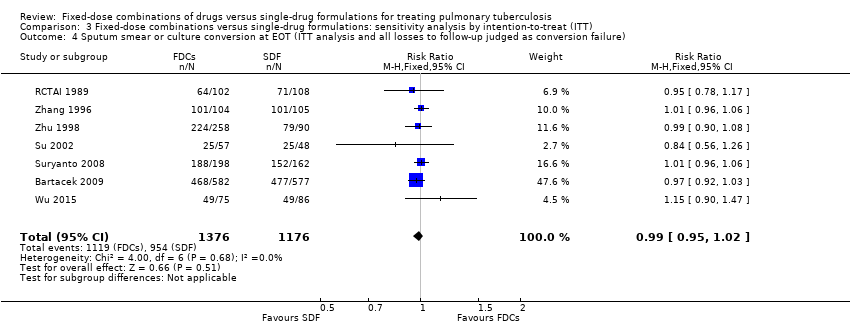
Comparison 3 Fixed‐dose combinations versus single‐drug formulations: sensitivity analysis by intention‐to‐treat (ITT), Outcome 4 Sputum smear or culture conversion at EOT (ITT analysis and all losses to follow‐up judged as conversion failure).
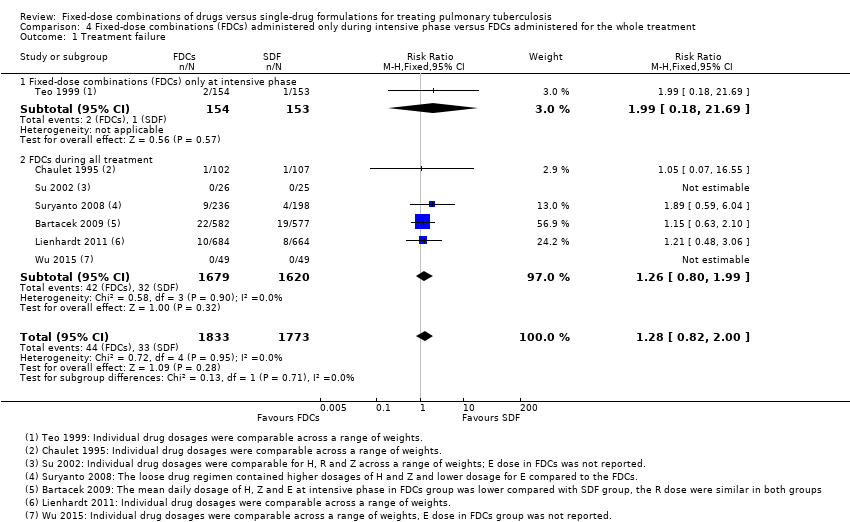
Comparison 4 Fixed‐dose combinations (FDCs) administered only during intensive phase versus FDCs administered for the whole treatment, Outcome 1 Treatment failure.

Comparison 4 Fixed‐dose combinations (FDCs) administered only during intensive phase versus FDCs administered for the whole treatment, Outcome 2 Relapse.
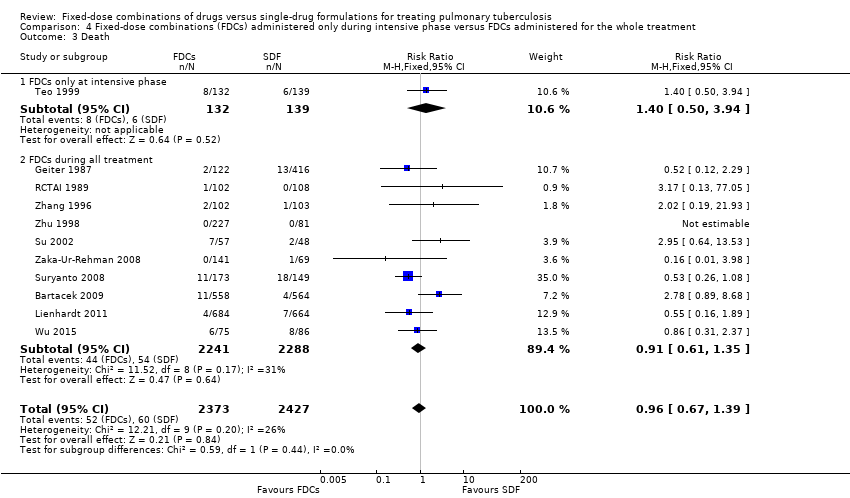
Comparison 4 Fixed‐dose combinations (FDCs) administered only during intensive phase versus FDCs administered for the whole treatment, Outcome 3 Death.
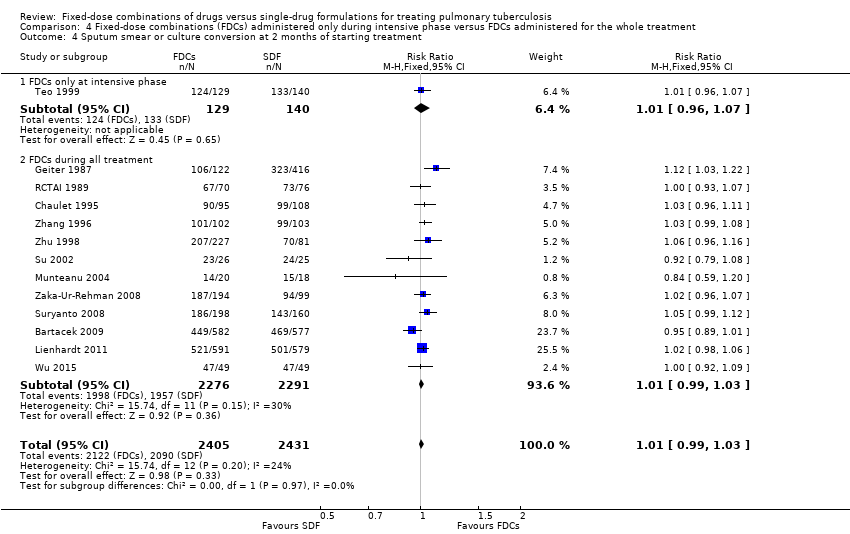
Comparison 4 Fixed‐dose combinations (FDCs) administered only during intensive phase versus FDCs administered for the whole treatment, Outcome 4 Sputum smear or culture conversion at 2 months of starting treatment.
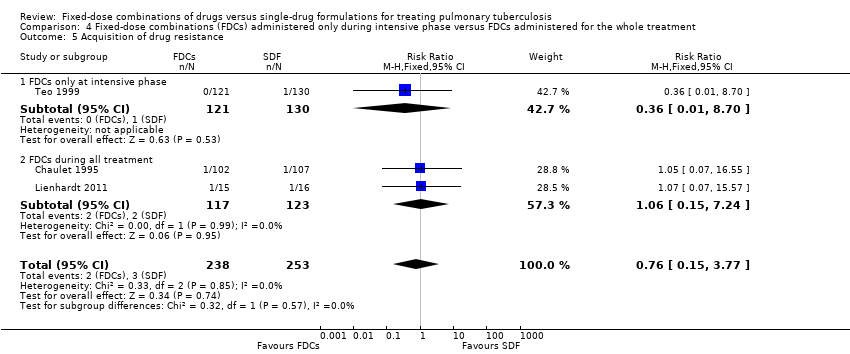
Comparison 4 Fixed‐dose combinations (FDCs) administered only during intensive phase versus FDCs administered for the whole treatment, Outcome 5 Acquisition of drug resistance.
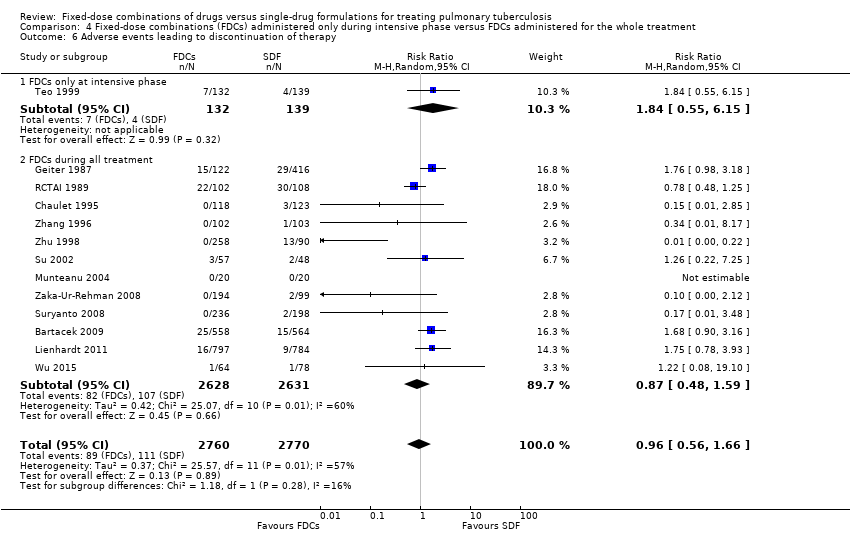
Comparison 4 Fixed‐dose combinations (FDCs) administered only during intensive phase versus FDCs administered for the whole treatment, Outcome 6 Adverse events leading to discontinuation of therapy.

Comparison 4 Fixed‐dose combinations (FDCs) administered only during intensive phase versus FDCs administered for the whole treatment, Outcome 7 Other adverse events.

Comparison 5 Daily regimen for the whole treatment versus daily regimen during the intensive phase followed by intermittent regimen during the continuation phase, Outcome 1 Treatment failure.

Comparison 5 Daily regimen for the whole treatment versus daily regimen during the intensive phase followed by intermittent regimen during the continuation phase, Outcome 2 Relapse.

Comparison 5 Daily regimen for the whole treatment versus daily regimen during the intensive phase followed by intermittent regimen during the continuation phase, Outcome 3 Death.

Comparison 5 Daily regimen for the whole treatment versus daily regimen during the intensive phase followed by intermittent regimen during the continuation phase, Outcome 4 Sputum smear or culture conversion at 2 months of starting treatment.

Comparison 5 Daily regimen for the whole treatment versus daily regimen during the intensive phase followed by intermittent regimen during the continuation phase, Outcome 5 Sputum smear or culture conversion at EOT.

Comparison 5 Daily regimen for the whole treatment versus daily regimen during the intensive phase followed by intermittent regimen during the continuation phase, Outcome 6 Acquisition of drug resistance.

Comparison 5 Daily regimen for the whole treatment versus daily regimen during the intensive phase followed by intermittent regimen during the continuation phase, Outcome 7 Serious adverse events.

Comparison 5 Daily regimen for the whole treatment versus daily regimen during the intensive phase followed by intermittent regimen during the continuation phase, Outcome 8 Adverse events leading to discontinuation of therapy.

Comparison 5 Daily regimen for the whole treatment versus daily regimen during the intensive phase followed by intermittent regimen during the continuation phase, Outcome 9 Other adverse events.

Comparison 6 Supervised treatment versus self‐administered treatment during the intensive phase, Outcome 1 Treatment failure.

Comparison 6 Supervised treatment versus self‐administered treatment during the intensive phase, Outcome 2 Relapse.

Comparison 6 Supervised treatment versus self‐administered treatment during the intensive phase, Outcome 3 Death.

Comparison 6 Supervised treatment versus self‐administered treatment during the intensive phase, Outcome 4 Sputum smear or culture conversion at 2 months of starting treatment.
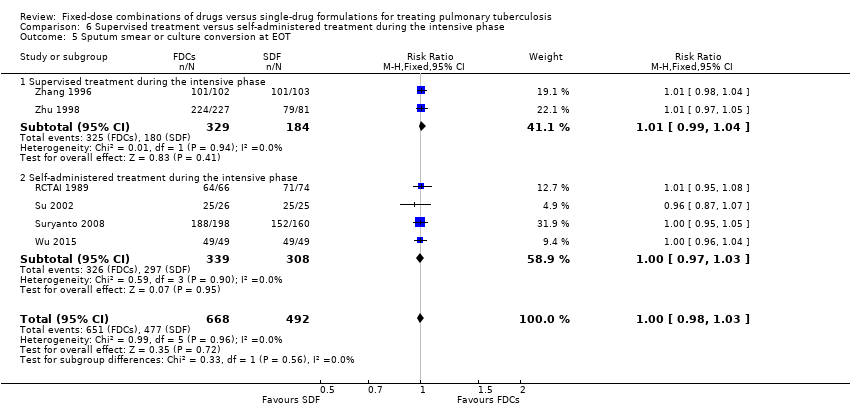
Comparison 6 Supervised treatment versus self‐administered treatment during the intensive phase, Outcome 5 Sputum smear or culture conversion at EOT.

Comparison 6 Supervised treatment versus self‐administered treatment during the intensive phase, Outcome 6 Treatment adherence at 8 weeks of starting treatment.

Comparison 6 Supervised treatment versus self‐administered treatment during the intensive phase, Outcome 7 Treatment adherence at EOT.
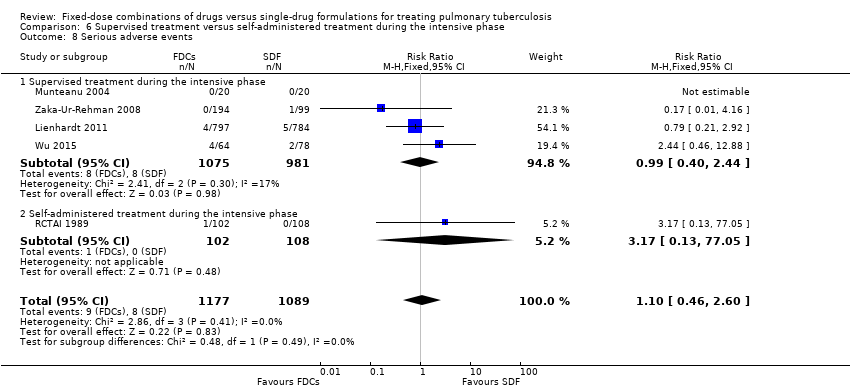
Comparison 6 Supervised treatment versus self‐administered treatment during the intensive phase, Outcome 8 Serious adverse events.

Comparison 6 Supervised treatment versus self‐administered treatment during the intensive phase, Outcome 9 Adverse events leading to discontinuation of therapy.
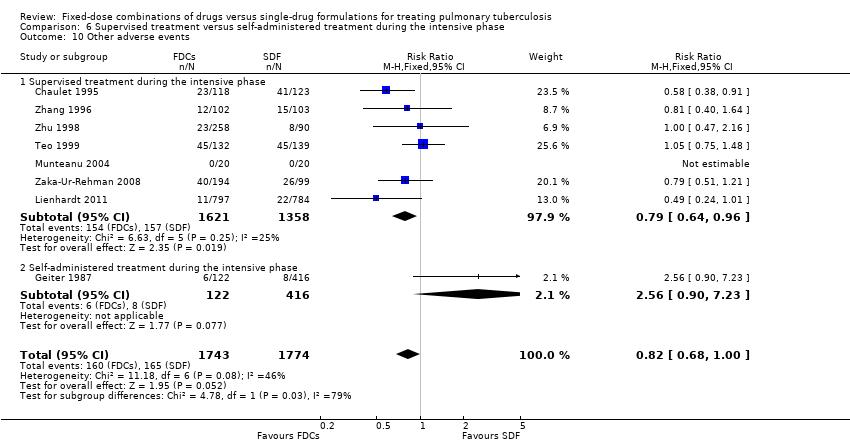
Comparison 6 Supervised treatment versus self‐administered treatment during the intensive phase, Outcome 10 Other adverse events.

Comparison 7 Trials with four drugs as fixed‐dose combinations (FDCs) versus trials with three or two drugs as FDCs during the intensive phase, Outcome 1 Treatment failure.

Comparison 7 Trials with four drugs as fixed‐dose combinations (FDCs) versus trials with three or two drugs as FDCs during the intensive phase, Outcome 2 Relapse.

Comparison 7 Trials with four drugs as fixed‐dose combinations (FDCs) versus trials with three or two drugs as FDCs during the intensive phase, Outcome 3 Death.

Comparison 7 Trials with four drugs as fixed‐dose combinations (FDCs) versus trials with three or two drugs as FDCs during the intensive phase, Outcome 4 Adverse events leading to discontinuation of therapy.

Comparison 7 Trials with four drugs as fixed‐dose combinations (FDCs) versus trials with three or two drugs as FDCs during the intensive phase, Outcome 5 Sputum smear or culture conversion at EOT.
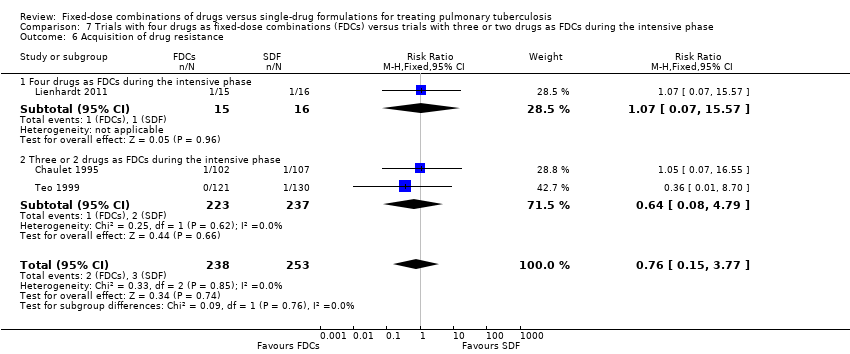
Comparison 7 Trials with four drugs as fixed‐dose combinations (FDCs) versus trials with three or two drugs as FDCs during the intensive phase, Outcome 6 Acquisition of drug resistance.

Comparison 7 Trials with four drugs as fixed‐dose combinations (FDCs) versus trials with three or two drugs as FDCs during the intensive phase, Outcome 7 Serious adverse events.

Comparison 7 Trials with four drugs as fixed‐dose combinations (FDCs) versus trials with three or two drugs as FDCs during the intensive phase, Outcome 8 Sputum smear or culture conversion at 2 months of starting treatment.
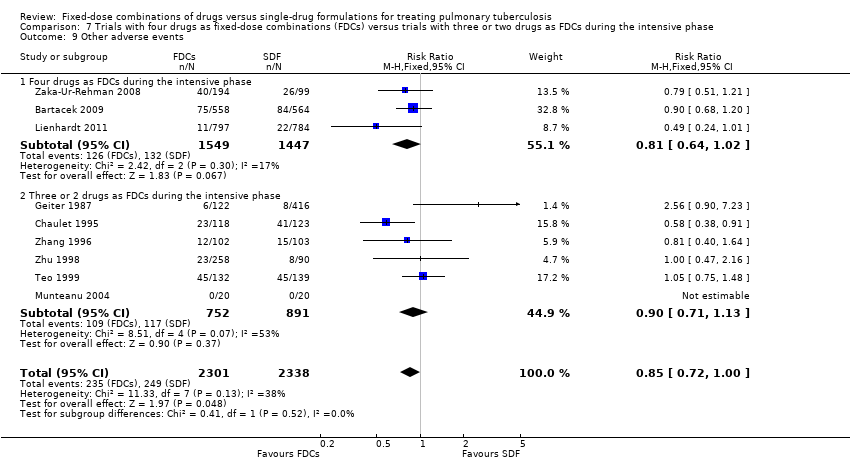
Comparison 7 Trials with four drugs as fixed‐dose combinations (FDCs) versus trials with three or two drugs as FDCs during the intensive phase, Outcome 9 Other adverse events.
| Fixed‐dose combinations compared to single‐drug formulations for treating newly diagnosed pulmonary tuberculosis (TB) | |||||
| Participant or population: treating pulmonary TB | |||||
| Outcomes | Illustrative comparative risks* (95% CI) | Relative effect | Number of participants | Quality of the evidence | |
| Assumed risk single‐drug formulations | Corresponding risk FDCs | ||||
| Treatment failure | 19 per 1000 | 24 per 1000 | RR 1.28 | 3606 | ⊕⊕⊕⊝ |
| Relapse | 55 per 1000 | 71 per 1000 | RR 1.28 | 3621 | ⊕⊕⊝⊝ |
| Death | 25 per 1000 | 24 per 1000 | RR 0.96 | 4800 | ⊕⊕⊕⊝ |
| Sputum smear or culture conversion at end of treatment | 892 per 1000 | 883 per 1000 | RR 0.99 | 2319 | ⊕⊕⊕⊕ |
| Serious adverse events | 16 per 1000 | 23 per 1000 | RR 1.45 | 3388 | ⊕⊕⊕⊝ |
| Adverse events leading to discontinuation of therapy | 40 per 1000 | 38 per 1000 | RR 0.96 | 5530 | ⊕⊕⊝⊝ |
| Combined endpoint of treatment failure, relapse, or death** | — | — | — | (0 RCTs) | — |
| *The risk in the intervention group (and its 95% CI) is based on the assumed risk in the comparison group and the relative effect of the intervention (and its 95% CI). | |||||
| GRADE Working Group grades of evidence | |||||
| 1 We did not downgrade the quality of the evidence due to limitations in design and execution. Analysis of studies at low risk of bias does not change the effect estimate. | |||||
| Trial1 | Outcomes2 | Definitions | Notes |
| Treatment failure | “sputum smear still or again positive after 4 and/or 6 months of treatment” | Treatment efficacy based on bacteriological response rate (sputum smear conversion rate) on 2 smears | |
| Relapse | “patient cured at end of treatment (EOT) and sputum smear again positive at months 9 or 12” | ||
| Treatment failure | “two positive cultures with or without radiological deterioration at EOT (treatment failure) or during the follow‐up (relapse) and consequently resulting in a new course of treatment” | Treatment efficacy based on bacteriological criteria (2 negative cultures) | |
| Relapse | |||
| Treatment adherence | Not defined | Determined by testing urine for isoniazid metabolites by biochemical methods | |
| Acquisition of drug resistance | Determined by drug sensitivity test for isoniazid, rifampicin and streptomycin | ||
| Treatment adherence | Not defined | Asking patients for missed doses, by pill counts and by testing urine for isoniazid metabolites | |
| Treatment failure | “One culture of at least 20 colonies` growth or 2 cultures of 10 or more colonies growth at EOT not identified as a reinfection” | Treatment efficacy based on bacteriological results: 2 sputum smears and cultures. One case of relapse was reported based only in radiologic deterioration | |
| Relapse | “One culture of at least 20 colonies` growth or 2 cultures of 10 or more colonies growth in the follow‐phase not identified as reinfection” | ||
| Acquisition of drug resistance | Not defined | Determined by drug sensitivity test for isoniazid, rifampicin, streptomycin and ethambutol | |
| Relapse | Not defined | Efficacy based on bacteriological results (sputum smear and culture) | |
| Treatment adherence | Not defined | Assessed by delay in drug collection and surprise pill counting | |
| Treatment failure | Not defined | Treatment efficacy based on clinical, bacteriological (3 sputum smears and cultures) and radiographic criteria | |
| Relapse | Efficacy based on bacteriological results (3 sputum smears and cultures) | ||
| Treatment adherence | Assessed by “cases lost to follow‐up and cases who changed to another regimen during treatment” | ||
| Treatment failure | "Smear positive at 5 months or later"3 | Efficacy based on bacteriological results (sputum smear) | |
| Relapse |
| Efficacy based on bacteriological results (1 smear sputum and culture) and information from interviews and verbal autopsies | |
| Treatment failure | Not defined | Treatment efficacy based on bacteriological results (sputum smear and culture) | |
| Relapse | “Bacteriological relapse after chemotherapy was defined as a positive culture with a growth of 10 or more colonies in 2 different months during any 3‐month period up to 30 months, and during any 6‐month period up to 60 months” | Efficacy based on bacteriological results (sputum smear and culture). One case of relapse was reported based on radiological deterioration | |
| Acquisition of drug resistance | Not defined | Determined by drug sensitivity test for isoniazid, rifampicin, and streptomycin | |
| Relapse | Not defined | Efficacy based on bacteriological results (sputum smear) | |
| Relapse | Not defined | Efficacy based on bacteriological results (sputum smear and culture) | |
| Treatment adherence | Not defined | There were 3 kinds of treatment management (whole‐course hospitalization; hospitalization only during intensive phase and outpatient treatment), combined with 3 supervision model respectively (supervision by medical staff; supervision by no‐medical staff who had been trained by the medical staff [relatives, colleagues] and supervision by medical staff in the intensive phase but non‐medical staff in the continuation phase). Treatment and supervision were established according to participants economic status | |
| Abbreviations: EOT: end of treatment; TB: tuberculosis. 1Munteanu 2004 did not report the outcomes included in this table and Semenova 2003 was not included in quantitative analysis. | |||
| Trial | Number of participants | Treatment regimens |
| 1159 | 2HRZE/4HR | |
| 250 | 2HRZ/4HR | |
| 701 | 2HRZ/4HR | |
| 1585 | 2HRZE/4HR1 | |
| 40 | 2HRZE/4HR | |
| 229 | 2HRZ/4HR1 | |
| 105 | 2HRZE/4HRE | |
| 434 | 2HRZE/3HR | |
| 310 | 3 different regimes were given2 | |
| 161 | 2HRZE/4HRE | |
| 293 | 2HRZE/4HRE | |
| 209 | 2HRZ/4HR | |
| 348 | 2HRZ/4HR | |
| Abbreviations: H: isoniazid; R: rifampicin; Z: pyrazinamide; E: ethambutol; S: streptomycin. | ||
| Trial | Regimen treatment | Directly observed therapy | Dosing | Dose simulation during intensive phase | Comment | |||
| 45 kg participant | 60 kg participant | |||||||
| Fixed‐dose | Single‐dose | Fixed‐dose | Single‐dose | |||||
| 2HRZE/4HR | Mode of drugs administration: not reported | By weight categories | Unclear | Unclear | Unclear | Unclear | The trial authors state: "The mean daily doses of INH, PZA and EMB administered during the initiation phase in the 4‐FDC group were significantly lower than those administered in the ST group; RMP doses were similar in both groups". | |
| 2HRZ/4HR | At the beginning of intensive phase | By weight categories | H: 250 mg R: 600 mg Z: 1500 mg | H: 300 mg R: 450 mg Z: 1500 mg | H: 300 mg R: 720 mg Z: 1800 mg | H: 300 mg R: 600 mg Z: 2000 mg | During directly observed treatment (DOT), "health personal" supervised treatment. Time with DOT is unclear. | |
| 2HRZ/4HR | No | By weight categories only for FDCs | H: 225 mg R: 450 mg Z: 1200 mg | Not reported | H: 300 mg R: 600 mg Z: 1600 mg | Not reported | Self‐administered treatment was done during the whole treatment. Dose used for single‐drug formulations: not reported. | |
| 2HRZE/4HR1 | During 6 days a week | By weight categories | H: 225 mg R: 450 mg Z: 1200 mg E: 825 mg | H: 250 mg R: 450 mg Z: 1200 mg E: 800 mg | H: 300 mg R: 600 mg Z: 1600 mg E: 1100 mg | H: 300 mg R: 600 mg Z: 1600 mg E: 1200 mg | The trial authors state: "In the majority of the trial centers, treatment was fully supervised for a minimum of 6 days a week". Every treatment dose was taken under the supervision of the medical staff. | |
| 2HRZE/4HR | During the intensive phase | Not reported | Not reported | Not reported | Not reported | Not reported | The supervision mechanism during DOT is unclear, and only mention "strictly supervised". Self‐administered treatment was done during the continuation phase. | |
| 2HRZ/4HR2 | No | By weight categories | H: 320 mg R: 480 mg Z: 1000 mg | Unclear | H: 400 mg R: 600 mg Z: 1250 mg | Unclear | Self‐administered treatment during the whole treatment. | |
| 4HRZE | Mode of drugs administration: not reported | By weight categories | Mairin‐P: 4 tablets + H: 225 mg | H: 450 mg R: 450 mg Z: 900 mg E: 1125 mg | Mairin‐P: 5 tablets + H: 300 mg | H: 600 mg R: 600 mg Z: 1200 mg E: 1500 mg | Streptomycin was added in 2 of the 4 randomized groups3. | |
| 2HRZE/4HRE | No | By weight categories | H: 200 mg R: 480 mg Z: 1000 mg E: not reported | H: 300 mg R: 450 mg Z: 1500 mg E: 1200 mg | H: 250 mg R: 600 mg Z: 1250 mg E: not reported | H: 300 mg R: 600 mg Z: 1500 mg E: 1200 mg | Self‐administered treatment during the whole treatment. | |
| 2HRZE/3HR | Once a weekly | By weight categories | Average dose H: 225 mg R: 450 mg Z: 1200 mg E: 825 mg | Average dose H: 300 mg R: 450 mg Z: 1500 mg E: 750 mg | Average dose H: 225 mg R: 450 mg Z: 1200 mg E: 825 mg | Average dose H: 300 mg R: 450 mg Z: 1500 mg E: 750 mg | The study authors state: "The loose drug regimen contained higher dosages of H and Z and lower dosage for E compared to the FDCs". Drugs "were given under supervision at health facilities" during DOT. Self‐administered treatment was done the remaining days. | |
| Three different regimes were given4 | During the whole treatment | By weight categories | H: 250 mg R: 600 mg Z: 1500 mg S: 750 mg | H: 300 mg R: 600 mg Z: 1500 mg S: 750 mg | H: 300 mg R: 720 mg Z: 1800 mg S: 750 mg | H: 300 mg R: 600 mg Z: 2000 mg S: 750 mg | The supervision mechanism during DOT is not clear. And only mention: DOT was given "at the community health clinic". | |
| 2HRZE/4HRE | Treatment was given as TDO 5 days per week and self‐administered during weekends | By weight categories | H: 320 mg R: 480 mg Z: 1000 mg | H: 300 mg R: 450 mg Z: 1125 mg E: 900 mg | H: 400 mg R: 600 mg Z: 1250 mg | H: 300 mg R: 600 mg Z: 1500 mg E: 1200 mg | DOT was supervised by "health workers". The ethambutol dose in FDCs groups was not reported. | |
| 2HRZE/4HRE | During the intensive phase | By weight categories | 5H: 300 mg R: 480 mg Z: 1400 mg E: 1000 mg | H: 300 mg R: 450 mg Z: 1500 mg E: 1200 mg | 5H: 375 mg R: 600 mg Z: 1750 mg E: 1250 mg | H: 400 mg R: 600 mg Z: 2000 mg E: 1600 mg | The supervision mechanism during DOT is unclear and only mention: "directly observed therapy was followed for each patient on a daily basis". | |
| 2HRZ/4HR | During the intensive phase | By weight categories | H: 320 mg R: 400 mg Z: 1000 mg | H: 300 mg R: 450 mg Z: 1500 mg | H: 400 mg R: 600 mg Z: 1250 mg | H: 300 mg R: 600 mg Z: 1500 mg | The trial authors state: "All drugs were taken under close supervision of a health care provider". | |
| 2HRZ/4HR | Only for a part of participants6 | By weight categories | H: 320 mg R: 480 mg Z: 1000 mg | H: 300 mg R: 450 mg Z: 1500 mg | H: 320 mg R: 480 mg Z: 1000 mg | H: 300 mg R: 600 mg Z: 1500 mg | There were 3 kinds of treatment management combined with 3 supervision models. | |
| Abbreviations: kg: kilograms of body weight; H: isoniazid; R: rifampicin; Z: pyrazinamide; E: ethambutol; FDCs: fixed‐dose combinations; SDF: single‐dose formulations; mg: milligrams; DOT: directly‐observed treatment. 1In Lienhardt 2011 the treatment regimen was 8 weeks for intensive phase and 18 weeks for continuation phase. | ||||||||
| Fixed‐dose combinations (FDCs) compared to single‐drug formulations for treating newly diagnosed pulmonary tuberculosis (TB) | |||||
| Participant or population: treating pulmonary TB | |||||
| Outcomes | Illustrative comparative risks* (95% CI) | Relative effect | Number of participants | Quality of the evidence | |
| Assumed risk single‐drug formulations | Corresponding risk FDCs | ||||
| Combined endpoint of treatment failure, relapse, or death** | — | — | — | (0 RCTs) | — |
| Treatment failure | 22 per 1000 | 25 per 1000 | RR 1.17 | 2507 | ⊕⊕⊕⊝ |
| Relapse | 79 per 1000 | 88 per 1000 | RR 1.12 | 2293 | ⊕⊕⊕⊝ |
| Death | 9 per 1000 | 12 per 1000 | RR 1.35 | 2470 | ⊕⊕⊕⊝ |
| Sputum smear or culture conversion at end of treatment | 827 per 1000 | 802 per 1000 | RR 0.97 | 1159 | ⊕⊕⊕⊕ |
| Serious adverse events | 17 per 1000 | 25 per 1000 | RR 1.44 | 2703 | ⊕⊕⊕⊝ |
| Adverse events leading to discontinuation of therapy | 18 per 1000 | 30 per 1000 | RR 1.71 | 2703 | ⊕⊕⊕⊝ |
| *The risk in the intervention group (and its 95% CI) is based on the assumed risk in the comparison group and the relative effect of the intervention (and its 95% CI). | |||||
| GRADE Working Group grades of evidence | |||||
| 1We did not downgrade the quality due to inconsistency. I² statistic = 0%. | |||||
| Outcomes | Assumed risk | Clinically important reduction | Optimal sample size 1,2 | |
| Single‐drug formulations | Absolute | Relative | ||
| Treatment failure | 2.2 % | 0.5% | 25% | 6092 |
| Relapse | 2.3 % | 0.5% | 25% | 4718 |
| Death3 | 0.9 % | 0.1% | 4.5% | 737,340 |
| Sputum/culture conversion at end of treatment | 88.7% | 0.5% | 0.6% | 95,044 |
| Serious adverse events | 1.5 % | 0.1% | 6.7% | 12,356 |
| Adverse events leading to discontinuation of therapy | 4.1 % | 0.5% | 24.4% | 325,024 |
| 1We based all calculations are based on: 1‐sided tests, with a ratio of 1:1, power of 0.9, and confidence level of 0.05. | ||||
| Outcome or subgroup title | No. of studies | No. of participants | Statistical method | Effect size |
| 1 Treatment failure Show forest plot | 7 | 3606 | Risk Ratio (M‐H, Fixed, 95% CI) | 1.28 [0.82, 2.00] |
| 2 Relapse Show forest plot | 10 | 3621 | Risk Ratio (M‐H, Fixed, 95% CI) | 1.28 [1.00, 1.64] |
| 3 Death Show forest plot | 11 | 4800 | Risk Ratio (M‐H, Fixed, 95% CI) | 0.96 [0.67, 1.39] |
| 4 Sputum smear or culture conversion at 2 months of starting treatment Show forest plot | 13 | 4836 | Risk Ratio (M‐H, Fixed, 95% CI) | 1.01 [0.99, 1.03] |
| 5 Sputum smear or culture conversion at end of treatment (EOT) Show forest plot | 7 | 2319 | Risk Ratio (M‐H, Fixed, 95% CI) | 0.99 [0.96, 1.02] |
| 6 Treatment adherence at 8 weeks of starting treatment Show forest plot | 3 | 881 | Risk Ratio (M‐H, Random, 95% CI) | 1.04 [0.96, 1.12] |
| 7 Treatment adherence at EOT Show forest plot | 5 | 1229 | Risk Ratio (M‐H, Fixed, 95% CI) | 1.01 [0.97, 1.06] |
| 8 Acquisition of drug resistance Show forest plot | 3 | 491 | Risk Ratio (M‐H, Fixed, 95% CI) | 0.76 [0.15, 3.77] |
| 9 Patient satisfaction Show forest plot | 2 | Risk Ratio (M‐H, Fixed, 95% CI) | Subtotals only | |
| 9.1 General satisfaction | 1 | 222 | Risk Ratio (M‐H, Fixed, 95% CI) | 1.04 [0.97, 1.12] |
| 9.2 No problems on swallowing | 1 | 1023 | Risk Ratio (M‐H, Fixed, 95% CI) | 1.03 [1.00, 1.06] |
| 9.3 Convenient number of tablets | 1 | 1045 | Risk Ratio (M‐H, Fixed, 95% CI) | 1.50 [1.37, 1.64] |
| 9.4 Acceptable taste | 1 | 1044 | Risk Ratio (M‐H, Fixed, 95% CI) | 1.39 [1.27, 1.51] |
| 10 Serious adverse events Show forest plot | 6 | 3388 | Risk Ratio (M‐H, Fixed, 95% CI) | 1.45 [0.90, 2.33] |
| 11 Adverse events leading to discontinuation of therapy Show forest plot | 13 | 5530 | Risk Ratio (M‐H, Random, 95% CI) | 0.96 [0.56, 1.66] |
| 12 Other adverse events Show forest plot | 9 | 4639 | Risk Ratio (M‐H, Fixed, 95% CI) | 0.85 [0.72, 1.00] |
| Outcome or subgroup title | No. of studies | No. of participants | Statistical method | Effect size |
| 1 Treatment failure Show forest plot | 7 | 3606 | Risk Ratio (M‐H, Fixed, 95% CI) | 1.28 [0.82, 2.00] |
| 1.1 High or unclear risk of selection bias | 5 | 1099 | Risk Ratio (M‐H, Fixed, 95% CI) | 1.77 [0.67, 4.69] |
| 1.2 Low risk of selection bias | 2 | 2507 | Risk Ratio (M‐H, Fixed, 95% CI) | 1.17 [0.70, 1.93] |
| 2 Relapse Show forest plot | 10 | 3621 | Risk Ratio (M‐H, Fixed, 95% CI) | 1.28 [1.00, 1.64] |
| 2.1 High or unclear risk of selection bias | 8 | 1328 | Risk Ratio (M‐H, Fixed, 95% CI) | 2.84 [1.34, 6.00] |
| 2.2 Low risk of selection bias | 2 | 2293 | Risk Ratio (M‐H, Fixed, 95% CI) | 1.12 [0.86, 1.46] |
| 3 Death Show forest plot | 11 | 4800 | Risk Ratio (M‐H, Fixed, 95% CI) | 0.96 [0.67, 1.39] |
| 3.1 High or unclear risk of selection bias | 9 | 2330 | Risk Ratio (M‐H, Fixed, 95% CI) | 0.86 [0.57, 1.32] |
| 3.2 Low risk of selection bias | 2 | 2470 | Risk Ratio (M‐H, Fixed, 95% CI) | 1.35 [0.63, 2.93] |
| 4 Sputum smear or culture conversion at 2 months of starting treatment Show forest plot | 13 | 4836 | Risk Ratio (M‐H, Fixed, 95% CI) | 1.01 [0.99, 1.03] |
| 4.1 High or unclear risk of selection bias | 11 | 2507 | Risk Ratio (M‐H, Fixed, 95% CI) | 1.04 [1.01, 1.06] |
| 4.2 Low risk of selection bias | 2 | 2329 | Risk Ratio (M‐H, Fixed, 95% CI) | 0.99 [0.95, 1.02] |
| 5 Sputum smear or culture conversion at EOT Show forest plot | 7 | 2319 | Risk Ratio (M‐H, Fixed, 95% CI) | 0.99 [0.96, 1.02] |
| 5.1 High or unclear risk of selection bias | 6 | 1160 | Risk Ratio (M‐H, Fixed, 95% CI) | 1.00 [0.98, 1.03] |
| 5.2 Low risk of selection bias | 1 | 1159 | Risk Ratio (M‐H, Fixed, 95% CI) | 0.97 [0.92, 1.03] |
| 6 Acquisition of drug resistance Show forest plot | 3 | 491 | Risk Ratio (M‐H, Fixed, 95% CI) | 0.76 [0.15, 3.77] |
| 6.1 High or unclear risk of selection bias | 2 | 460 | Risk Ratio (M‐H, Fixed, 95% CI) | 0.64 [0.08, 4.79] |
| 6.2 Low risk of selection bias | 1 | 31 | Risk Ratio (M‐H, Fixed, 95% CI) | 1.07 [0.07, 15.57] |
| 7 Serious adverse events Show forest plot | 6 | 3388 | Risk Ratio (M‐H, Fixed, 95% CI) | 1.45 [0.90, 2.33] |
| 7.1 High or unclear risk of selection bias | 4 | 685 | Risk Ratio (M‐H, Fixed, 95% CI) | 1.47 [0.46, 4.71] |
| 7.2 Low risk of selection bias | 2 | 2703 | Risk Ratio (M‐H, Fixed, 95% CI) | 1.44 [0.86, 2.44] |
| 8 Adverse events leading to discontinuation of therapy Show forest plot | 13 | 5530 | Risk Ratio (M‐H, Random, 95% CI) | 0.96 [0.56, 1.66] |
| 8.1 High or unclear risk of selection bias | 11 | 2827 | Risk Ratio (M‐H, Random, 95% CI) | 0.67 [0.31, 1.43] |
| 8.2 Low risk of selection bias | 2 | 2703 | Risk Ratio (M‐H, Random, 95% CI) | 1.71 [1.04, 2.81] |
| 9 Other adverse events Show forest plot | 9 | 4639 | Risk Ratio (M‐H, Fixed, 95% CI) | 0.85 [0.72, 1.00] |
| 9.1 High or unclear risk of selection bias | 7 | 1936 | Risk Ratio (M‐H, Fixed, 95% CI) | 0.87 [0.71, 1.07] |
| 9.2 Low risk of selection bias | 2 | 2703 | Risk Ratio (M‐H, Fixed, 95% CI) | 0.82 [0.63, 1.07] |
| Outcome or subgroup title | No. of studies | No. of participants | Statistical method | Effect size |
| 1 Treatment failure (ITT analysis and all losses to follow‐up judged as failure) Show forest plot | 7 | 4004 | Risk Ratio (M‐H, Fixed, 95% CI) | 1.03 [0.93, 1.14] |
| 2 Relapse (ITT analysis and all losses to follow‐up judged as relapse) Show forest plot | 10 | 4716 | Risk Ratio (M‐H, Fixed, 95% CI) | 1.05 [0.95, 1.16] |
| 3 Sputum smear or culture conversion at 2 months of starting treatment (ITT analysis and all losses to follow‐up judged as conversion failure) Show forest plot | 13 | 5731 | Risk Ratio (M‐H, Fixed, 95% CI) | 1.00 [0.97, 1.03] |
| 4 Sputum smear or culture conversion at EOT (ITT analysis and all losses to follow‐up judged as conversion failure) Show forest plot | 7 | 2552 | Risk Ratio (M‐H, Fixed, 95% CI) | 0.99 [0.95, 1.02] |
| Outcome or subgroup title | No. of studies | No. of participants | Statistical method | Effect size |
| 1 Treatment failure Show forest plot | 7 | 3606 | Risk Ratio (M‐H, Fixed, 95% CI) | 1.28 [0.82, 2.00] |
| 1.1 Fixed‐dose combinations (FDCs) only at intensive phase | 1 | 307 | Risk Ratio (M‐H, Fixed, 95% CI) | 1.99 [0.18, 21.69] |
| 1.2 FDCs during all treatment | 6 | 3299 | Risk Ratio (M‐H, Fixed, 95% CI) | 1.26 [0.80, 1.99] |
| 2 Relapse Show forest plot | 10 | 3621 | Risk Ratio (M‐H, Fixed, 95% CI) | 1.28 [1.00, 1.64] |
| 2.1 FDCs only at intensive phase | 1 | 251 | Risk Ratio (M‐H, Fixed, 95% CI) | 3.94 [1.13, 13.78] |
| 2.2 FDCs during all treatment | 9 | 3370 | Risk Ratio (M‐H, Fixed, 95% CI) | 1.20 [0.93, 1.55] |
| 3 Death Show forest plot | 11 | 4800 | Risk Ratio (M‐H, Fixed, 95% CI) | 0.96 [0.67, 1.39] |
| 3.1 FDCs only at intensive phase | 1 | 271 | Risk Ratio (M‐H, Fixed, 95% CI) | 1.40 [0.50, 3.94] |
| 3.2 FDCs during all treatment | 10 | 4529 | Risk Ratio (M‐H, Fixed, 95% CI) | 0.91 [0.61, 1.35] |
| 4 Sputum smear or culture conversion at 2 months of starting treatment Show forest plot | 13 | 4836 | Risk Ratio (M‐H, Fixed, 95% CI) | 1.01 [0.99, 1.03] |
| 4.1 FDCs only at intensive phase | 1 | 269 | Risk Ratio (M‐H, Fixed, 95% CI) | 1.01 [0.96, 1.07] |
| 4.2 FDCs during all treatment | 12 | 4567 | Risk Ratio (M‐H, Fixed, 95% CI) | 1.01 [0.99, 1.03] |
| 5 Acquisition of drug resistance Show forest plot | 3 | 491 | Risk Ratio (M‐H, Fixed, 95% CI) | 0.76 [0.15, 3.77] |
| 5.1 FDCs only at intensive phase | 1 | 251 | Risk Ratio (M‐H, Fixed, 95% CI) | 0.36 [0.01, 8.70] |
| 5.2 FDCs during all treatment | 2 | 240 | Risk Ratio (M‐H, Fixed, 95% CI) | 1.06 [0.15, 7.24] |
| 6 Adverse events leading to discontinuation of therapy Show forest plot | 13 | 5530 | Risk Ratio (M‐H, Random, 95% CI) | 0.96 [0.56, 1.66] |
| 6.1 FDCs only at intensive phase | 1 | 271 | Risk Ratio (M‐H, Random, 95% CI) | 1.84 [0.55, 6.15] |
| 6.2 FDCs during all treatment | 12 | 5259 | Risk Ratio (M‐H, Random, 95% CI) | 0.87 [0.48, 1.59] |
| 7 Other adverse events Show forest plot | 9 | 4639 | Risk Ratio (M‐H, Fixed, 95% CI) | 0.85 [0.72, 1.00] |
| 7.1 FDCs only at intensive phase | 1 | 271 | Risk Ratio (M‐H, Fixed, 95% CI) | 1.05 [0.75, 1.48] |
| 7.2 FDCs during all treatment | 8 | 4368 | Risk Ratio (M‐H, Fixed, 95% CI) | 0.81 [0.67, 0.97] |
| Outcome or subgroup title | No. of studies | No. of participants | Statistical method | Effect size |
| 1 Treatment failure Show forest plot | 7 | 3606 | Risk Ratio (M‐H, Fixed, 95% CI) | 1.28 [0.82, 2.00] |
| 1.1 Daily medication for the whole treatment | 4 | 1517 | Risk Ratio (M‐H, Fixed, 95% CI) | 1.14 [0.63, 2.06] |
| 1.2 Daily medication at intensive phase followed by intermittent treatment at continuation phase | 3 | 2089 | Risk Ratio (M‐H, Fixed, 95% CI) | 1.49 [0.75, 2.96] |
| 2 Relapse Show forest plot | 10 | 3621 | Risk Ratio (M‐H, Fixed, 95% CI) | 1.28 [1.00, 1.64] |
| 2.1 Daily medication for the whole treatment | 7 | 1850 | Risk Ratio (M‐H, Fixed, 95% CI) | 1.12 [0.83, 1.50] |
| 2.2 Daily medication at intensive phase followed by intermittent treatment at continuation phase | 3 | 1771 | Risk Ratio (M‐H, Fixed, 95% CI) | 1.72 [1.07, 2.75] |
| 3 Death Show forest plot | 11 | 4800 | Risk Ratio (M‐H, Fixed, 95% CI) | 0.96 [0.67, 1.39] |
| 3.1 Daily medication for the whole treatment | 8 | 2859 | Risk Ratio (M‐H, Fixed, 95% CI) | 1.34 [0.79, 2.29] |
| 3.2 Daily medication at intensive phase followed by intermittent treatment at continuation phase | 3 | 1941 | Risk Ratio (M‐H, Fixed, 95% CI) | 0.69 [0.41, 1.16] |
| 4 Sputum smear or culture conversion at 2 months of starting treatment Show forest plot | 13 | 4836 | Risk Ratio (M‐H, Fixed, 95% CI) | 1.01 [0.99, 1.03] |
| 4.1 Daily medication for the whole treatment | 9 | 3001 | Risk Ratio (M‐H, Fixed, 95% CI) | 1.00 [0.98, 1.03] |
| 4.2 Daily medication at intensive phase followed by intermittent treatment at continuation phase | 4 | 1835 | Risk Ratio (M‐H, Fixed, 95% CI) | 1.02 [0.99, 1.05] |
| 5 Sputum smear or culture conversion at EOT Show forest plot | 7 | 2319 | Risk Ratio (M‐H, Fixed, 95% CI) | 0.99 [0.96, 1.02] |
| 5.1 Daily medication for the whole treatment | 6 | 1961 | Risk Ratio (M‐H, Fixed, 95% CI) | 0.99 [0.96, 1.02] |
| 5.2 Daily medication at intensive phase followed by intermittent treatment at continuation phase | 1 | 358 | Risk Ratio (M‐H, Fixed, 95% CI) | 1.00 [0.95, 1.05] |
| 6 Acquisition of drug resistance Show forest plot | 3 | 491 | Risk Ratio (M‐H, Fixed, 95% CI) | 0.76 [0.15, 3.77] |
| 6.1 Daily medication for the whole treatment | 1 | 209 | Risk Ratio (M‐H, Fixed, 95% CI) | 1.05 [0.07, 16.55] |
| 6.2 Daily medication at intensive phase followed by intermittent treatment at continuation phase | 2 | 282 | Risk Ratio (M‐H, Fixed, 95% CI) | 0.64 [0.09, 4.69] |
| 7 Serious adverse events Show forest plot | 6 | 3388 | Risk Ratio (M‐H, Fixed, 95% CI) | 1.45 [0.90, 2.33] |
| 7.1 Daily medication for the whole treatment | 4 | 1767 | Risk Ratio (M‐H, Fixed, 95% CI) | 1.60 [0.95, 2.68] |
| 7.2 Daily medication at intensive phase followed by intermittent treatment at continuation phase | 2 | 1621 | Risk Ratio (M‐H, Fixed, 95% CI) | 0.79 [0.21, 2.92] |
| 8 Adverse events leading to discontinuation of therapy Show forest plot | 13 | 5530 | Risk Ratio (M‐H, Random, 95% CI) | 0.96 [0.56, 1.66] |
| 8.1 Daily medication for the whole treatment | 9 | 3204 | Risk Ratio (M‐H, Random, 95% CI) | 0.78 [0.39, 1.59] |
| 8.2 Daily medication at intensive phase followed by intermittent treatment at continuation phase | 4 | 2326 | Risk Ratio (M‐H, Random, 95% CI) | 1.55 [0.74, 3.25] |
| 9 Other adverse events Show forest plot | 9 | 4639 | Risk Ratio (M‐H, Fixed, 95% CI) | 0.85 [0.72, 1.00] |
| 9.1 Daily medication for the whole treatment | 6 | 2747 | Risk Ratio (M‐H, Fixed, 95% CI) | 0.84 [0.70, 1.02] |
| 9.2 Daily medication at intensive phase followed by intermittent treatment at continuation phase | 3 | 1892 | Risk Ratio (M‐H, Fixed, 95% CI) | 0.86 [0.64, 1.18] |
| Outcome or subgroup title | No. of studies | No. of participants | Statistical method | Effect size |
| 1 Treatment failure Show forest plot | 6 | 2447 | Risk Ratio (M‐H, Fixed, 95% CI) | 1.46 [0.75, 2.84] |
| 1.1 Supervised treatment during the intensive phase | 4 | 1962 | Risk Ratio (M‐H, Fixed, 95% CI) | 1.27 [0.56, 2.89] |
| 1.2 Self‐administered treatment during the intensive phase | 2 | 485 | Risk Ratio (M‐H, Fixed, 95% CI) | 1.89 [0.59, 6.04] |
| 2 Relapse Show forest plot | 9 | 2676 | Risk Ratio (M‐H, Fixed, 95% CI) | 1.69 [1.09, 2.63] |
| 2.1 Supervised treatment during the intensive phase | 6 | 2318 | Risk Ratio (M‐H, Fixed, 95% CI) | 1.52 [0.94, 2.45] |
| 2.2 Self‐administered treatment during the intensive phase | 3 | 358 | Risk Ratio (M‐H, Fixed, 95% CI) | 2.93 [0.89, 9.59] |
| 3 Death Show forest plot | 10 | 3678 | Risk Ratio (M‐H, Fixed, 95% CI) | 0.82 [0.55, 1.22] |
| 3.1 Supervised treatment during the intensive phase | 6 | 2503 | Risk Ratio (M‐H, Fixed, 95% CI) | 0.89 [0.50, 1.58] |
| 3.2 Self‐administered treatment during the intensive phase | 4 | 1175 | Risk Ratio (M‐H, Fixed, 95% CI) | 0.76 [0.44, 1.32] |
| 4 Sputum smear or culture conversion at 2 months of starting treatment Show forest plot | 12 | 3677 | Risk Ratio (M‐H, Fixed, 95% CI) | 1.03 [1.01, 1.05] |
| 4.1 Supervised treatment during the intensive phase | 8 | 2584 | Risk Ratio (M‐H, Fixed, 95% CI) | 1.02 [0.99, 1.05] |
| 4.2 Self‐administered treatment during the intensive phase | 4 | 1093 | Risk Ratio (M‐H, Fixed, 95% CI) | 1.06 [1.01, 1.11] |
| 5 Sputum smear or culture conversion at EOT Show forest plot | 6 | 1160 | Risk Ratio (M‐H, Fixed, 95% CI) | 1.00 [0.98, 1.03] |
| 5.1 Supervised treatment during the intensive phase | 2 | 513 | Risk Ratio (M‐H, Fixed, 95% CI) | 1.01 [0.99, 1.04] |
| 5.2 Self‐administered treatment during the intensive phase | 4 | 647 | Risk Ratio (M‐H, Fixed, 95% CI) | 1.00 [0.97, 1.03] |
| 6 Treatment adherence at 8 weeks of starting treatment Show forest plot | 3 | 881 | Risk Ratio (M‐H, Random, 95% CI) | 1.04 [0.96, 1.12] |
| 6.1 Supervised treatment during the intensive phase | 1 | 142 | Risk Ratio (M‐H, Random, 95% CI) | 1.01 [0.97, 1.06] |
| 6.2 Self‐administered treatment during the intensive phase | 2 | 739 | Risk Ratio (M‐H, Random, 95% CI) | 1.09 [0.90, 1.31] |
| 7 Treatment adherence at EOT Show forest plot | 5 | 1229 | Risk Ratio (M‐H, Fixed, 95% CI) | 1.01 [0.97, 1.06] |
| 7.1 Supervised treatment during the intensive phase | 1 | 96 | Risk Ratio (M‐H, Fixed, 95% CI) | 1.04 [0.97, 1.11] |
| 7.2 Self‐administered treatment during the intensive phase | 4 | 1133 | Risk Ratio (M‐H, Fixed, 95% CI) | 1.01 [0.96, 1.06] |
| 8 Serious adverse events Show forest plot | 5 | 2266 | Risk Ratio (M‐H, Fixed, 95% CI) | 1.10 [0.46, 2.60] |
| 8.1 Supervised treatment during the intensive phase | 4 | 2056 | Risk Ratio (M‐H, Fixed, 95% CI) | 0.99 [0.40, 2.44] |
| 8.2 Self‐administered treatment during the intensive phase | 1 | 210 | Risk Ratio (M‐H, Fixed, 95% CI) | 3.17 [0.13, 77.05] |
| 9 Adverse events leading to discontinuation of therapy Show forest plot | 12 | 4408 | Risk Ratio (M‐H, Random, 95% CI) | 0.82 [0.43, 1.57] |
| 9.1 Supervised treatment during the intensive phase | 8 | 3121 | Risk Ratio (M‐H, Random, 95% CI) | 0.44 [0.11, 1.71] |
| 9.2 Self‐administered treatment during the intensive phase | 4 | 1287 | Risk Ratio (M‐H, Random, 95% CI) | 1.06 [0.55, 2.04] |
| 10 Other adverse events Show forest plot | 8 | 3517 | Risk Ratio (M‐H, Fixed, 95% CI) | 0.82 [0.68, 1.00] |
| 10.1 Supervised treatment during the intensive phase | 7 | 2979 | Risk Ratio (M‐H, Fixed, 95% CI) | 0.79 [0.64, 0.96] |
| 10.2 Self‐administered treatment during the intensive phase | 1 | 538 | Risk Ratio (M‐H, Fixed, 95% CI) | 2.56 [0.90, 7.23] |
| Outcome or subgroup title | No. of studies | No. of participants | Statistical method | Effect size |
| 1 Treatment failure Show forest plot | 7 | 3606 | Risk Ratio (M‐H, Fixed, 95% CI) | 1.28 [0.82, 2.00] |
| 1.1 Four drugs as FDCs during the intensive phase | 3 | 2941 | Risk Ratio (M‐H, Fixed, 95% CI) | 1.27 [0.80, 2.01] |
| 1.2 Three or 2 drugs as FDCs during the intensive phase | 4 | 665 | Risk Ratio (M‐H, Fixed, 95% CI) | 1.52 [0.26, 9.08] |
| 2 Relapse Show forest plot | 9 | 3523 | Risk Ratio (M‐H, Fixed, 95% CI) | 1.28 [1.00, 1.64] |
| 2.1 Four drugs as FDCs during the intensive phase | 4 | 2675 | Risk Ratio (M‐H, Fixed, 95% CI) | 1.18 [0.91, 1.54] |
| 2.2 Three or 2 drugs as FDCs during the intensive phase | 5 | 848 | Risk Ratio (M‐H, Fixed, 95% CI) | 2.55 [1.07, 6.06] |
| 3 Death Show forest plot | 11 | 4800 | Risk Ratio (M‐H, Fixed, 95% CI) | 0.96 [0.67, 1.39] |
| 3.1 Four drugs as FDCs during the intensive phase | 4 | 3002 | Risk Ratio (M‐H, Fixed, 95% CI) | 0.79 [0.48, 1.30] |
| 3.2 Three or 2 drugs as FDCs during the intensive phase | 7 | 1798 | Risk Ratio (M‐H, Fixed, 95% CI) | 1.21 [0.70, 2.10] |
| 4 Adverse events leading to discontinuation of therapy Show forest plot | 13 | 5530 | Risk Ratio (M‐H, Random, 95% CI) | 0.96 [0.56, 1.66] |
| 4.1 Four drugs as FDCs during the intensive phase | 4 | 3430 | Risk Ratio (M‐H, Random, 95% CI) | 1.21 [0.53, 2.78] |
| 4.2 Three or 2 drugs as FDCs during the intensive phase | 9 | 2100 | Risk Ratio (M‐H, Random, 95% CI) | 0.81 [0.37, 1.77] |
| 5 Sputum smear or culture conversion at EOT Show forest plot | 7 | 2319 | Risk Ratio (M‐H, Fixed, 95% CI) | 0.99 [0.96, 1.02] |
| 5.1 Four drugs as FDCs during the intensive phase | 2 | 1517 | Risk Ratio (M‐H, Fixed, 95% CI) | 0.98 [0.94, 1.02] |
| 5.2 Three or 2 drugs as FDCs during the intensive phase | 5 | 802 | Risk Ratio (M‐H, Fixed, 95% CI) | 1.01 [0.98, 1.03] |
| 6 Acquisition of drug resistance Show forest plot | 3 | 491 | Risk Ratio (M‐H, Fixed, 95% CI) | 0.76 [0.15, 3.77] |
| 6.1 Four drugs as FDCs during the intensive phase | 1 | 31 | Risk Ratio (M‐H, Fixed, 95% CI) | 1.07 [0.07, 15.57] |
| 6.2 Three or 2 drugs as FDCs during the intensive phase | 2 | 460 | Risk Ratio (M‐H, Fixed, 95% CI) | 0.64 [0.08, 4.79] |
| 7 Serious adverse events Show forest plot | 6 | 3388 | Risk Ratio (M‐H, Fixed, 95% CI) | 1.45 [0.90, 2.33] |
| 7.1 Four drugs as FDCs during the intensive phase | 3 | 2996 | Risk Ratio (M‐H, Fixed, 95% CI) | 1.34 [0.81, 2.23] |
| 7.2 Three or 2 drugs as FDCs during the intensive phase | 3 | 392 | Risk Ratio (M‐H, Fixed, 95% CI) | 2.59 [0.59, 11.34] |
| 8 Sputum smear or culture conversion at 2 months of starting treatment Show forest plot | 13 | 4836 | Risk Ratio (M‐H, Fixed, 95% CI) | 1.01 [0.99, 1.03] |
| 8.1 Four drugs as FDCs during the intensive phase | 4 | 2980 | Risk Ratio (M‐H, Fixed, 95% CI) | 1.00 [0.97, 1.03] |
| 8.2 Three or 2 drugs as FDCs during the intensive phase | 9 | 1856 | Risk Ratio (M‐H, Fixed, 95% CI) | 1.04 [1.01, 1.07] |
| 9 Other adverse events Show forest plot | 9 | 4639 | Risk Ratio (M‐H, Fixed, 95% CI) | 0.85 [0.72, 1.00] |
| 9.1 Four drugs as FDCs during the intensive phase | 3 | 2996 | Risk Ratio (M‐H, Fixed, 95% CI) | 0.81 [0.64, 1.02] |
| 9.2 Three or 2 drugs as FDCs during the intensive phase | 6 | 1643 | Risk Ratio (M‐H, Fixed, 95% CI) | 0.90 [0.71, 1.13] |