Fixed‐dose combinations of drugs versus single‐drug formulations for treating pulmonary tuberculosis
Information
- DOI:
- https://doi.org/10.1002/14651858.CD009913.pub2Copy DOI

- Database:
-
- Cochrane Database of Systematic Reviews
- Version published:
-
- 17 May 2016see what's new
- Type:
-
- Intervention
- Stage:
-
- Review
- Cochrane Editorial Group:
-
Cochrane Infectious Diseases Group
- Classified:
-
- No update planned
Other
This is not a current research question.Assessed: 23 April 2019
- No update planned
- Copyright:
-
- Copyright © 2016 The Authors. Cochrane Database of Systematic Reviews published by John Wiley & Sons, Ltd. on behalf of The Cochrane Collaboration.
- This is an open access article under the terms of the Creative Commons Attribution‐Non‐Commercial Licence, which permits use, distribution and reproduction in any medium, provided the original work is properly cited and is not used for commercial purposes.
Article metrics
Altmetric:
Cited by:
Authors
Contributions of authors
-
CRG, DRC, and XB conceived and designed the idea for this Cochrane review. All review authors contributed to the protocol development. CRG wrote the protocol (Gallardo 2012).
-
CRG, MR, and AVR extracted data from the included trials.
-
CRG, AVR, and DRC assessed risk of bias in the included trials.
-
CRG and MR entered data into RevMan (RevMan 2014).
-
MR and CRG performed and interpreted the analyses.
-
DRC drafted the 'Summary of findings' tables.
-
All review authors drafted the final review version and critically reviewed the content.
-
CRG wrote the final review version.
-
All review authors approved the final review version.
Sources of support
Internal sources
-
Cochrane Infectious Disease Group, UK.
-
Liverpool School of Tropical Medicine, UK.
External sources
-
Department for International Development (DFID), UK.
Grant: 5242
Declarations of interest
CRG has no known conflicts of interest.
DRC has no known conflicts of interest.
AVR has no known conflicts of interest.
MR has no known conflicts of interest.
LP has no known conflicts of interest.
JC has no known conflicts of interest.
XB has no known conflicts of interest.
Acknowledgements
CRG is a PhD candidate at the Paediatrics, Obstetrics and Gynaecology, and Preventive Medicine Department, Universitat Autònoma de Barcelona, Spain. The editorial base of the Cochrane Infectious Diseases Group is funded by UK aid from the UK Government for the benefit of developing countries (Grant: 5242). The views expressed in this Cochrane review do not necessarily reflect UK government policy.
Version history
| Published | Title | Stage | Authors | Version |
| 2016 May 17 | Fixed‐dose combinations of drugs versus single‐drug formulations for treating pulmonary tuberculosis | Review | Carmen R Gallardo, David Rigau Comas, Angélica Valderrama Rodríguez, Marta Roqué i Figuls, Lucy Anne Parker, Joan Caylà, Xavier Bonfill Cosp | |
| 2012 Jul 11 | Fixed‐dose combinations of drugs versus single drug formulations for treating pulmonary tuberculosis | Protocol | Carmen R Gallardo, David Rigau Comas, Angélica Valderrama Rodríguez, Marta Roqué i Figuls, Lucy Anne Parker, Joan Caylà, Xavier Bonfill Cosp | |
Differences between protocol and review
We updated references in the Background section and added the latest World Health Organization (WHO) report (WHO 2015) and the last version of the International Standard of Tuberculosis Care (ISTC) (ISTC 2014). Both documents were published after the Cochrane protocol, Gallardo 2012, was published.
In the Methods section, we redefined some aspects.
-
Types of intervention: for this review we considered that all drugs should be used ideally for a minimum of two months, but should not exceed nine months. We clarified the inclusion of studies with at least 60% of participants treated with each drug for a minimum of two months, although the rest of the participants had been treated only for one month with at least one of the drugs used.
-
Types of outcome measures: for primary outcomes (especially treatment failure and relapse) we considered the definitions suggested by trial authors instead of the WHO's definitions, due to different definitions given in each trial. Differences in definitions can be justified by the wide range in the publication years of included studies (1987 to 2015). We clarified the definitions as suggested by the trial authors (Table 1). For sputum smear or culture conversion, we took culture data instead of sputum smear data when both were available. We added 'patient satisfaction' as a secondary outcome and we also clarified that data for death included all reported causes of death (see Types of outcome measures).
-
Assessment of heterogeneity: we clearly redacted this section to better explain the methodology we used.
-
Data synthesis: we did the main analysis with 'available data', according to data given in the included trials.
-
We performed a sensitivity analysis as an intention‐to‐treat analysis and we assumed all losses to follow‐up as a negative outcome for the primary dichotomous outcomes relating to treatment efficacy (treatment failure and relapse). Losses were not taken into account for the analysis of sputum smear or culture conversion.
We added data of baseline drug susceptibility to the 'Characteristics of included studies' section, when available.
In addition, we performed the analyses using RevMan (RevMan 2014). We also assessed the quality of the evidence using the GRADE approach.
Keywords
MeSH
Medical Subject Headings (MeSH) Keywords
Medical Subject Headings Check Words
Adolescent; Adult; Female; Humans; Male; Middle Aged;
PICOs

Logic diagram of relationship between the use of fixed‐dose combinations (FDCs) and expected improvement of reported outcomes.

Flow diagram of the trial selection process.

'Risk of bias' summary: review authors' judgements about each 'Risk of bias' item for each included trial.

'Risk of bias' graph: review authors' judgements about each 'Risk of bias' item presented as percentages across all included trials.

Funnel plot of comparison: 1 Fixed‐dose combinations versus single‐drug formulations as available data, outcome: 1.4 Sputum smear or culture conversion at two months of starting treatment.

Comparison 1 Fixed‐dose combinations versus single‐drug formulations as available data, Outcome 1 Treatment failure.

Comparison 1 Fixed‐dose combinations versus single‐drug formulations as available data, Outcome 2 Relapse.
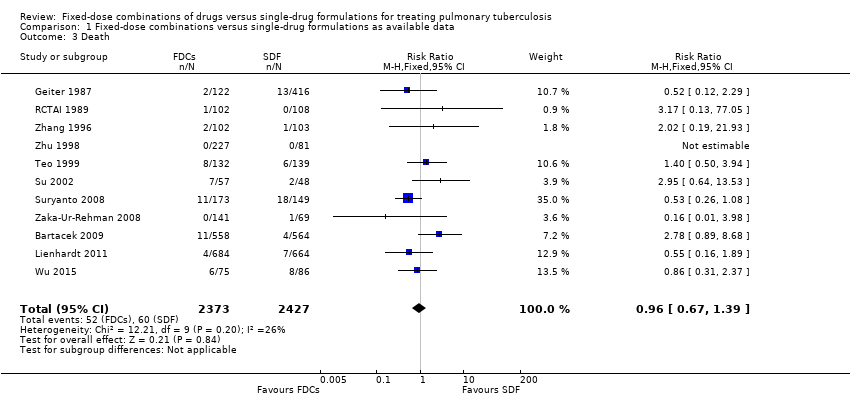
Comparison 1 Fixed‐dose combinations versus single‐drug formulations as available data, Outcome 3 Death.
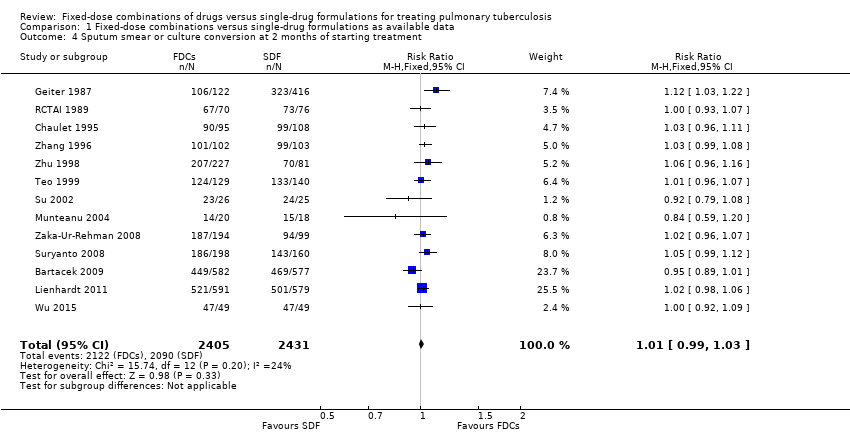
Comparison 1 Fixed‐dose combinations versus single‐drug formulations as available data, Outcome 4 Sputum smear or culture conversion at 2 months of starting treatment.
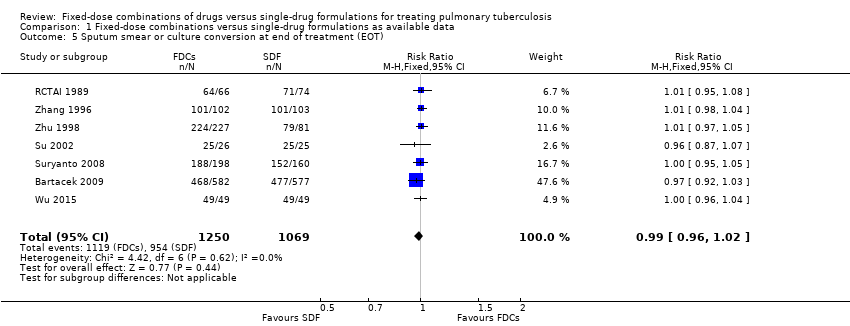
Comparison 1 Fixed‐dose combinations versus single‐drug formulations as available data, Outcome 5 Sputum smear or culture conversion at end of treatment (EOT).

Comparison 1 Fixed‐dose combinations versus single‐drug formulations as available data, Outcome 6 Treatment adherence at 8 weeks of starting treatment.

Comparison 1 Fixed‐dose combinations versus single‐drug formulations as available data, Outcome 7 Treatment adherence at EOT.

Comparison 1 Fixed‐dose combinations versus single‐drug formulations as available data, Outcome 8 Acquisition of drug resistance.

Comparison 1 Fixed‐dose combinations versus single‐drug formulations as available data, Outcome 9 Patient satisfaction.

Comparison 1 Fixed‐dose combinations versus single‐drug formulations as available data, Outcome 10 Serious adverse events.

Comparison 1 Fixed‐dose combinations versus single‐drug formulations as available data, Outcome 11 Adverse events leading to discontinuation of therapy.

Comparison 1 Fixed‐dose combinations versus single‐drug formulations as available data, Outcome 12 Other adverse events.

Comparison 2 Fixed‐dose combinations versus single‐drug formulations as available data: sensitivity analysis by risk of bias, Outcome 1 Treatment failure.

Comparison 2 Fixed‐dose combinations versus single‐drug formulations as available data: sensitivity analysis by risk of bias, Outcome 2 Relapse.
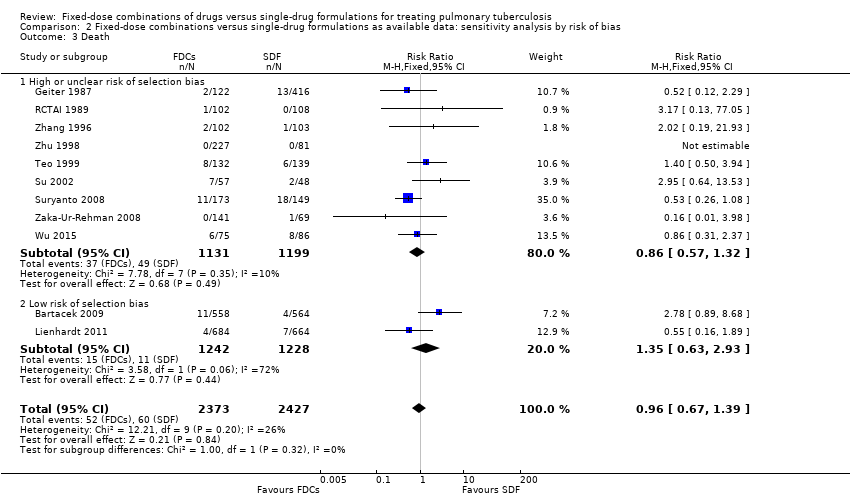
Comparison 2 Fixed‐dose combinations versus single‐drug formulations as available data: sensitivity analysis by risk of bias, Outcome 3 Death.
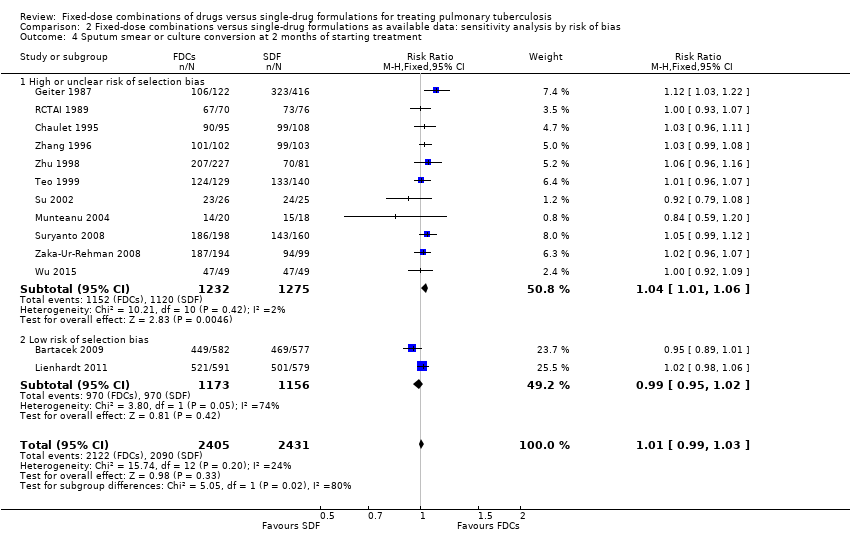
Comparison 2 Fixed‐dose combinations versus single‐drug formulations as available data: sensitivity analysis by risk of bias, Outcome 4 Sputum smear or culture conversion at 2 months of starting treatment.

Comparison 2 Fixed‐dose combinations versus single‐drug formulations as available data: sensitivity analysis by risk of bias, Outcome 5 Sputum smear or culture conversion at EOT.
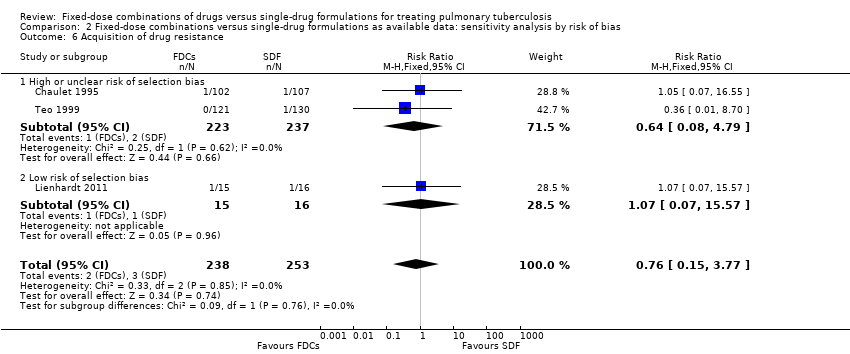
Comparison 2 Fixed‐dose combinations versus single‐drug formulations as available data: sensitivity analysis by risk of bias, Outcome 6 Acquisition of drug resistance.

Comparison 2 Fixed‐dose combinations versus single‐drug formulations as available data: sensitivity analysis by risk of bias, Outcome 7 Serious adverse events.

Comparison 2 Fixed‐dose combinations versus single‐drug formulations as available data: sensitivity analysis by risk of bias, Outcome 8 Adverse events leading to discontinuation of therapy.
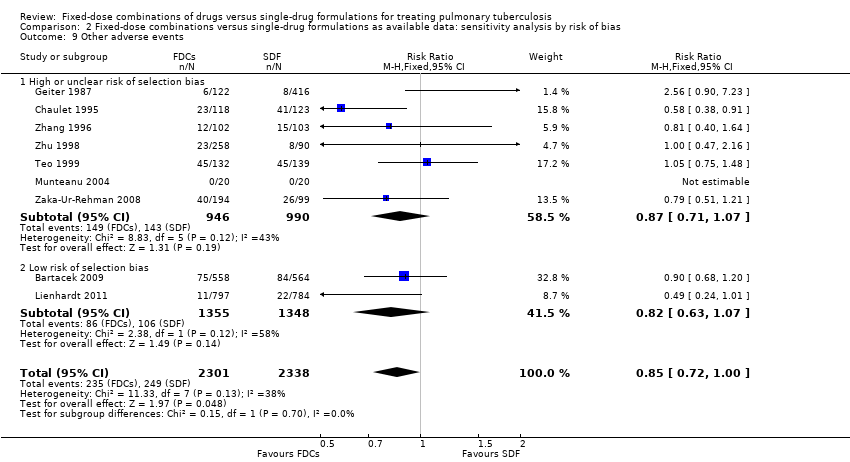
Comparison 2 Fixed‐dose combinations versus single‐drug formulations as available data: sensitivity analysis by risk of bias, Outcome 9 Other adverse events.

Comparison 3 Fixed‐dose combinations versus single‐drug formulations: sensitivity analysis by intention‐to‐treat (ITT), Outcome 1 Treatment failure (ITT analysis and all losses to follow‐up judged as failure).
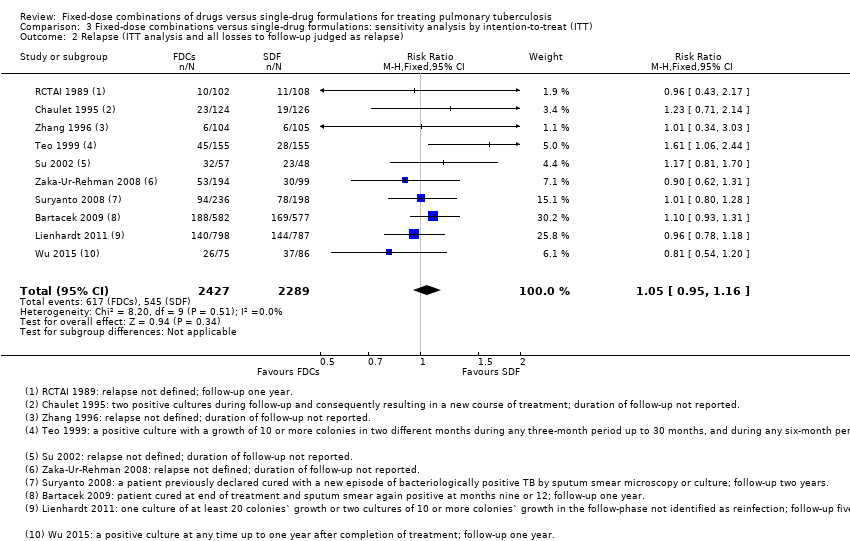
Comparison 3 Fixed‐dose combinations versus single‐drug formulations: sensitivity analysis by intention‐to‐treat (ITT), Outcome 2 Relapse (ITT analysis and all losses to follow‐up judged as relapse).

Comparison 3 Fixed‐dose combinations versus single‐drug formulations: sensitivity analysis by intention‐to‐treat (ITT), Outcome 3 Sputum smear or culture conversion at 2 months of starting treatment (ITT analysis and all losses to follow‐up judged as conversion failure).
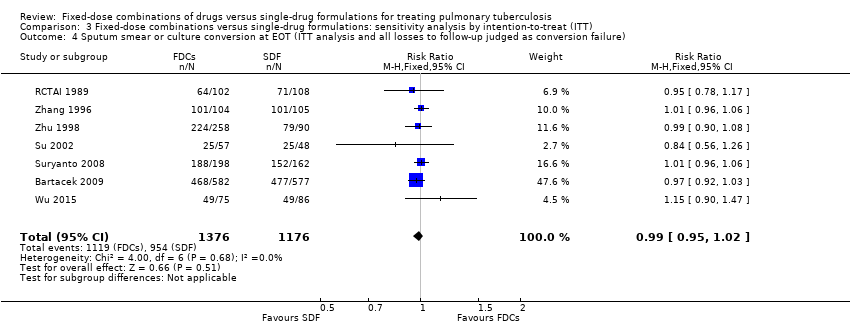
Comparison 3 Fixed‐dose combinations versus single‐drug formulations: sensitivity analysis by intention‐to‐treat (ITT), Outcome 4 Sputum smear or culture conversion at EOT (ITT analysis and all losses to follow‐up judged as conversion failure).
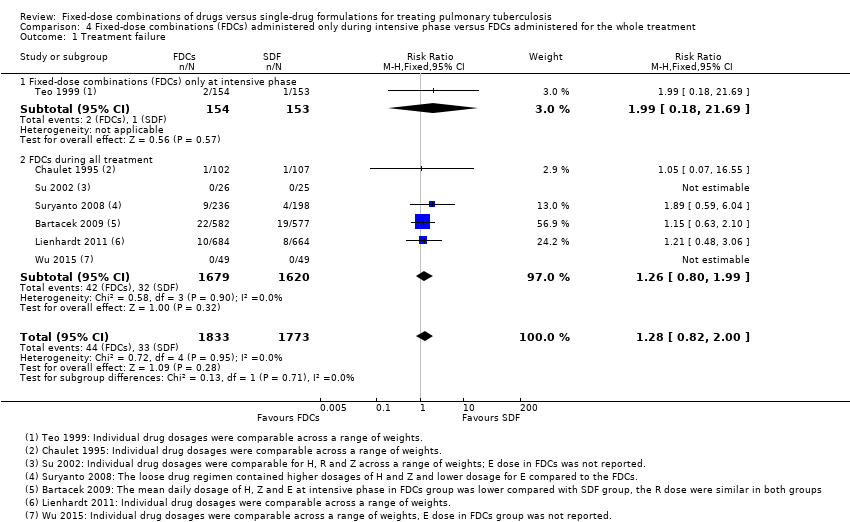
Comparison 4 Fixed‐dose combinations (FDCs) administered only during intensive phase versus FDCs administered for the whole treatment, Outcome 1 Treatment failure.

Comparison 4 Fixed‐dose combinations (FDCs) administered only during intensive phase versus FDCs administered for the whole treatment, Outcome 2 Relapse.
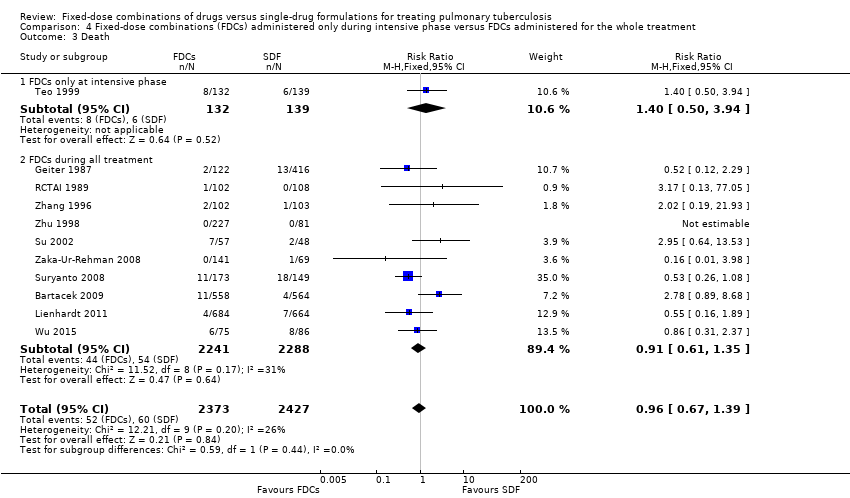
Comparison 4 Fixed‐dose combinations (FDCs) administered only during intensive phase versus FDCs administered for the whole treatment, Outcome 3 Death.
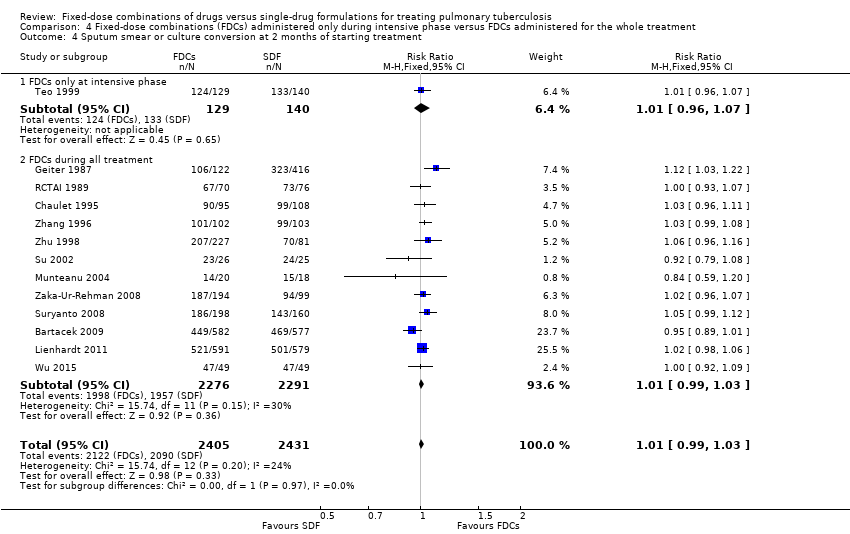
Comparison 4 Fixed‐dose combinations (FDCs) administered only during intensive phase versus FDCs administered for the whole treatment, Outcome 4 Sputum smear or culture conversion at 2 months of starting treatment.
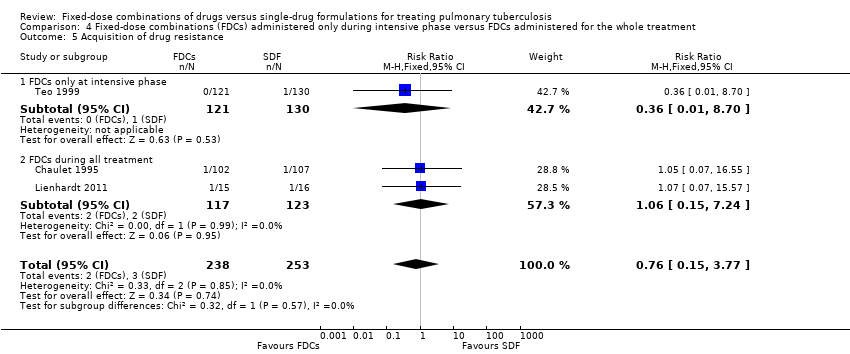
Comparison 4 Fixed‐dose combinations (FDCs) administered only during intensive phase versus FDCs administered for the whole treatment, Outcome 5 Acquisition of drug resistance.
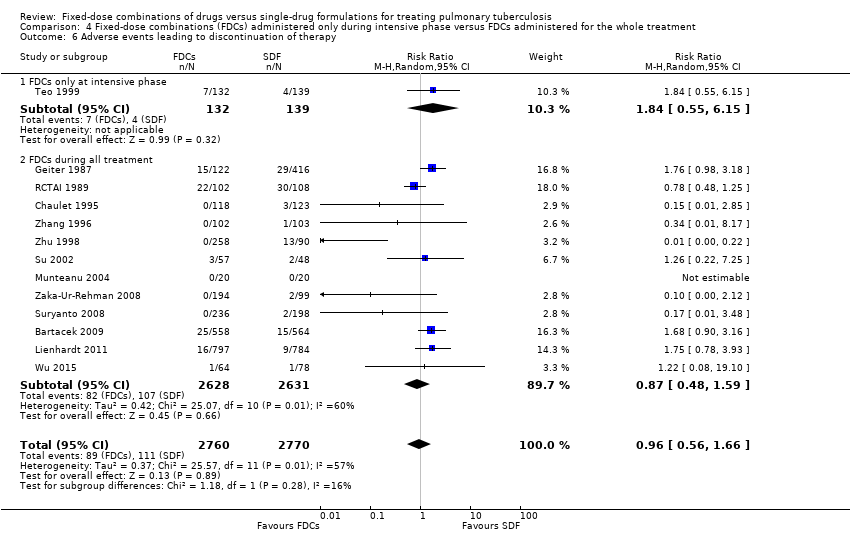
Comparison 4 Fixed‐dose combinations (FDCs) administered only during intensive phase versus FDCs administered for the whole treatment, Outcome 6 Adverse events leading to discontinuation of therapy.

Comparison 4 Fixed‐dose combinations (FDCs) administered only during intensive phase versus FDCs administered for the whole treatment, Outcome 7 Other adverse events.

Comparison 5 Daily regimen for the whole treatment versus daily regimen during the intensive phase followed by intermittent regimen during the continuation phase, Outcome 1 Treatment failure.

Comparison 5 Daily regimen for the whole treatment versus daily regimen during the intensive phase followed by intermittent regimen during the continuation phase, Outcome 2 Relapse.

Comparison 5 Daily regimen for the whole treatment versus daily regimen during the intensive phase followed by intermittent regimen during the continuation phase, Outcome 3 Death.

Comparison 5 Daily regimen for the whole treatment versus daily regimen during the intensive phase followed by intermittent regimen during the continuation phase, Outcome 4 Sputum smear or culture conversion at 2 months of starting treatment.

Comparison 5 Daily regimen for the whole treatment versus daily regimen during the intensive phase followed by intermittent regimen during the continuation phase, Outcome 5 Sputum smear or culture conversion at EOT.

Comparison 5 Daily regimen for the whole treatment versus daily regimen during the intensive phase followed by intermittent regimen during the continuation phase, Outcome 6 Acquisition of drug resistance.

Comparison 5 Daily regimen for the whole treatment versus daily regimen during the intensive phase followed by intermittent regimen during the continuation phase, Outcome 7 Serious adverse events.

Comparison 5 Daily regimen for the whole treatment versus daily regimen during the intensive phase followed by intermittent regimen during the continuation phase, Outcome 8 Adverse events leading to discontinuation of therapy.

Comparison 5 Daily regimen for the whole treatment versus daily regimen during the intensive phase followed by intermittent regimen during the continuation phase, Outcome 9 Other adverse events.

Comparison 6 Supervised treatment versus self‐administered treatment during the intensive phase, Outcome 1 Treatment failure.

Comparison 6 Supervised treatment versus self‐administered treatment during the intensive phase, Outcome 2 Relapse.

Comparison 6 Supervised treatment versus self‐administered treatment during the intensive phase, Outcome 3 Death.

Comparison 6 Supervised treatment versus self‐administered treatment during the intensive phase, Outcome 4 Sputum smear or culture conversion at 2 months of starting treatment.
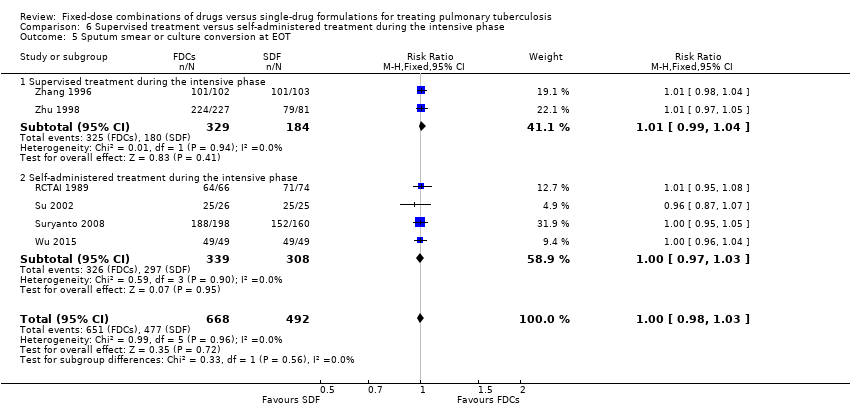
Comparison 6 Supervised treatment versus self‐administered treatment during the intensive phase, Outcome 5 Sputum smear or culture conversion at EOT.

Comparison 6 Supervised treatment versus self‐administered treatment during the intensive phase, Outcome 6 Treatment adherence at 8 weeks of starting treatment.

Comparison 6 Supervised treatment versus self‐administered treatment during the intensive phase, Outcome 7 Treatment adherence at EOT.
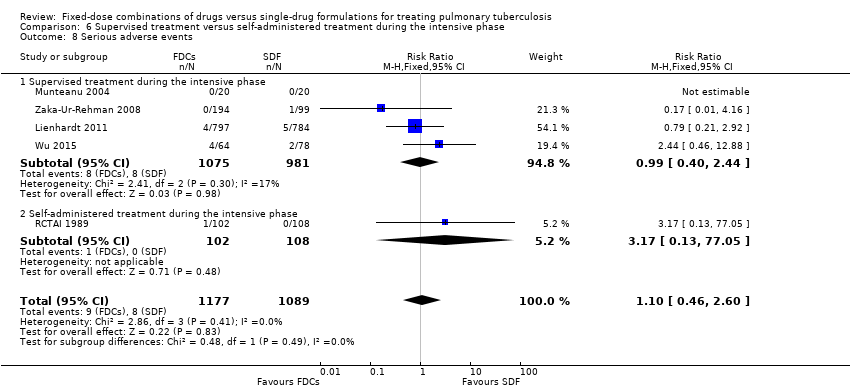
Comparison 6 Supervised treatment versus self‐administered treatment during the intensive phase, Outcome 8 Serious adverse events.

Comparison 6 Supervised treatment versus self‐administered treatment during the intensive phase, Outcome 9 Adverse events leading to discontinuation of therapy.
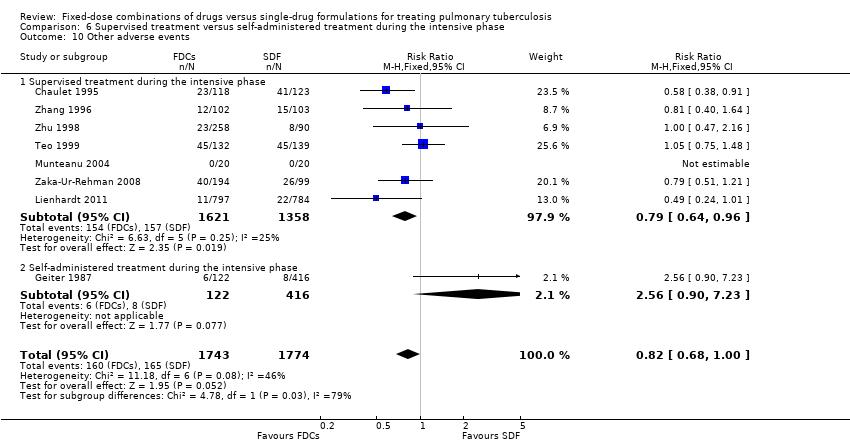
Comparison 6 Supervised treatment versus self‐administered treatment during the intensive phase, Outcome 10 Other adverse events.

Comparison 7 Trials with four drugs as fixed‐dose combinations (FDCs) versus trials with three or two drugs as FDCs during the intensive phase, Outcome 1 Treatment failure.

Comparison 7 Trials with four drugs as fixed‐dose combinations (FDCs) versus trials with three or two drugs as FDCs during the intensive phase, Outcome 2 Relapse.

Comparison 7 Trials with four drugs as fixed‐dose combinations (FDCs) versus trials with three or two drugs as FDCs during the intensive phase, Outcome 3 Death.

Comparison 7 Trials with four drugs as fixed‐dose combinations (FDCs) versus trials with three or two drugs as FDCs during the intensive phase, Outcome 4 Adverse events leading to discontinuation of therapy.

Comparison 7 Trials with four drugs as fixed‐dose combinations (FDCs) versus trials with three or two drugs as FDCs during the intensive phase, Outcome 5 Sputum smear or culture conversion at EOT.
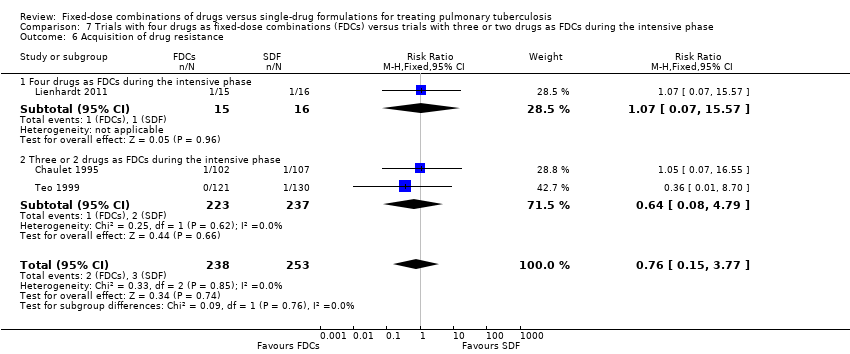
Comparison 7 Trials with four drugs as fixed‐dose combinations (FDCs) versus trials with three or two drugs as FDCs during the intensive phase, Outcome 6 Acquisition of drug resistance.

Comparison 7 Trials with four drugs as fixed‐dose combinations (FDCs) versus trials with three or two drugs as FDCs during the intensive phase, Outcome 7 Serious adverse events.

Comparison 7 Trials with four drugs as fixed‐dose combinations (FDCs) versus trials with three or two drugs as FDCs during the intensive phase, Outcome 8 Sputum smear or culture conversion at 2 months of starting treatment.
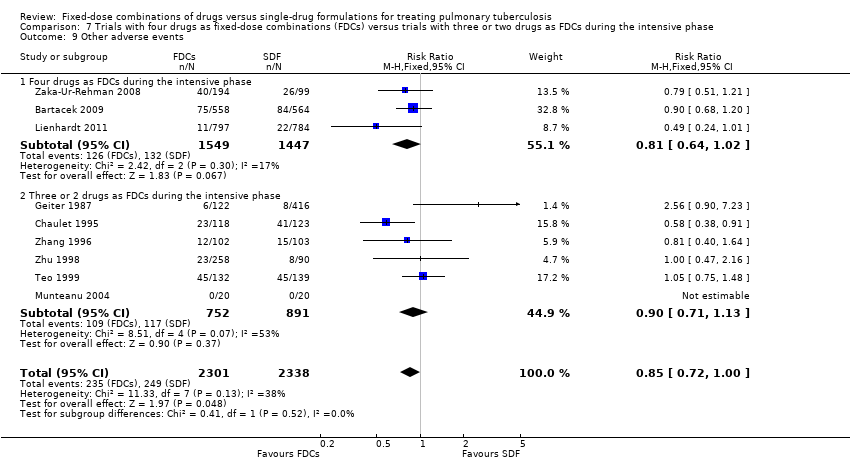
Comparison 7 Trials with four drugs as fixed‐dose combinations (FDCs) versus trials with three or two drugs as FDCs during the intensive phase, Outcome 9 Other adverse events.
| Fixed‐dose combinations compared to single‐drug formulations for treating newly diagnosed pulmonary tuberculosis (TB) | |||||
| Participant or population: treating pulmonary TB | |||||
| Outcomes | Illustrative comparative risks* (95% CI) | Relative effect | Number of participants | Quality of the evidence | |
| Assumed risk single‐drug formulations | Corresponding risk FDCs | ||||
| Treatment failure | 19 per 1000 | 24 per 1000 | RR 1.28 | 3606 | ⊕⊕⊕⊝ |
| Relapse | 55 per 1000 | 71 per 1000 | RR 1.28 | 3621 | ⊕⊕⊝⊝ |
| Death | 25 per 1000 | 24 per 1000 | RR 0.96 | 4800 | ⊕⊕⊕⊝ |
| Sputum smear or culture conversion at end of treatment | 892 per 1000 | 883 per 1000 | RR 0.99 | 2319 | ⊕⊕⊕⊕ |
| Serious adverse events | 16 per 1000 | 23 per 1000 | RR 1.45 | 3388 | ⊕⊕⊕⊝ |
| Adverse events leading to discontinuation of therapy | 40 per 1000 | 38 per 1000 | RR 0.96 | 5530 | ⊕⊕⊝⊝ |
| Combined endpoint of treatment failure, relapse, or death** | — | — | — | (0 RCTs) | — |
| *The risk in the intervention group (and its 95% CI) is based on the assumed risk in the comparison group and the relative effect of the intervention (and its 95% CI). | |||||
| GRADE Working Group grades of evidence | |||||
| 1 We did not downgrade the quality of the evidence due to limitations in design and execution. Analysis of studies at low risk of bias does not change the effect estimate. | |||||
| Trial1 | Outcomes2 | Definitions | Notes |
| Treatment failure | “sputum smear still or again positive after 4 and/or 6 months of treatment” | Treatment efficacy based on bacteriological response rate (sputum smear conversion rate) on 2 smears | |
| Relapse | “patient cured at end of treatment (EOT) and sputum smear again positive at months 9 or 12” | ||
| Treatment failure | “two positive cultures with or without radiological deterioration at EOT (treatment failure) or during the follow‐up (relapse) and consequently resulting in a new course of treatment” | Treatment efficacy based on bacteriological criteria (2 negative cultures) | |
| Relapse | |||
| Treatment adherence | Not defined | Determined by testing urine for isoniazid metabolites by biochemical methods | |
| Acquisition of drug resistance | Determined by drug sensitivity test for isoniazid, rifampicin and streptomycin | ||
| Treatment adherence | Not defined | Asking patients for missed doses, by pill counts and by testing urine for isoniazid metabolites | |
| Treatment failure | “One culture of at least 20 colonies` growth or 2 cultures of 10 or more colonies growth at EOT not identified as a reinfection” | Treatment efficacy based on bacteriological results: 2 sputum smears and cultures. One case of relapse was reported based only in radiologic deterioration | |
| Relapse | “One culture of at least 20 colonies` growth or 2 cultures of 10 or more colonies growth in the follow‐phase not identified as reinfection” | ||
| Acquisition of drug resistance | Not defined | Determined by drug sensitivity test for isoniazid, rifampicin, streptomycin and ethambutol | |
| Relapse | Not defined | Efficacy based on bacteriological results (sputum smear and culture) | |
| Treatment adherence | Not defined | Assessed by delay in drug collection and surprise pill counting | |
| Treatment failure | Not defined | Treatment efficacy based on clinical, bacteriological (3 sputum smears and cultures) and radiographic criteria | |
| Relapse | Efficacy based on bacteriological results (3 sputum smears and cultures) | ||
| Treatment adherence | Assessed by “cases lost to follow‐up and cases who changed to another regimen during treatment” | ||
| Treatment failure | "Smear positive at 5 months or later"3 | Efficacy based on bacteriological results (sputum smear) | |
| Relapse |
| Efficacy based on bacteriological results (1 smear sputum and culture) and information from interviews and verbal autopsies | |
| Treatment failure | Not defined | Treatment efficacy based on bacteriological results (sputum smear and culture) | |
| Relapse | “Bacteriological relapse after chemotherapy was defined as a positive culture with a growth of 10 or more colonies in 2 different months during any 3‐month period up to 30 months, and during any 6‐month period up to 60 months” | Efficacy based on bacteriological results (sputum smear and culture). One case of relapse was reported based on radiological deterioration | |
| Acquisition of drug resistance | Not defined | Determined by drug sensitivity test for isoniazid, rifampicin, and streptomycin | |
| Relapse | Not defined | Efficacy based on bacteriological results (sputum smear) | |
| Relapse | Not defined | Efficacy based on bacteriological results (sputum smear and culture) | |
| Treatment adherence | Not defined | There were 3 kinds of treatment management (whole‐course hospitalization; hospitalization only during intensive phase and outpatient treatment), combined with 3 supervision model respectively (supervision by medical staff; supervision by no‐medical staff who had been trained by the medical staff [relatives, colleagues] and supervision by medical staff in the intensive phase but non‐medical staff in the continuation phase). Treatment and supervision were established according to participants economic status | |
| Abbreviations: EOT: end of treatment; TB: tuberculosis. 1Munteanu 2004 did not report the outcomes included in this table and Semenova 2003 was not included in quantitative analysis. | |||
| Trial | Number of participants | Treatment regimens |
| 1159 | 2HRZE/4HR | |
| 250 | 2HRZ/4HR | |
| 701 | 2HRZ/4HR | |
| 1585 | 2HRZE/4HR1 | |
| 40 | 2HRZE/4HR | |
| 229 | 2HRZ/4HR1 | |
| 105 | 2HRZE/4HRE | |
| 434 | 2HRZE/3HR | |
| 310 | 3 different regimes were given2 | |
| 161 | 2HRZE/4HRE | |
| 293 | 2HRZE/4HRE | |
| 209 | 2HRZ/4HR | |
| 348 | 2HRZ/4HR | |
| Abbreviations: H: isoniazid; R: rifampicin; Z: pyrazinamide; E: ethambutol; S: streptomycin. | ||
| Trial | Regimen treatment | Directly observed therapy | Dosing | Dose simulation during intensive phase | Comment | |||
| 45 kg participant | 60 kg participant | |||||||
| Fixed‐dose | Single‐dose | Fixed‐dose | Single‐dose | |||||
| 2HRZE/4HR | Mode of drugs administration: not reported | By weight categories | Unclear | Unclear | Unclear | Unclear | The trial authors state: "The mean daily doses of INH, PZA and EMB administered during the initiation phase in the 4‐FDC group were significantly lower than those administered in the ST group; RMP doses were similar in both groups". | |
| 2HRZ/4HR | At the beginning of intensive phase | By weight categories | H: 250 mg R: 600 mg Z: 1500 mg | H: 300 mg R: 450 mg Z: 1500 mg | H: 300 mg R: 720 mg Z: 1800 mg | H: 300 mg R: 600 mg Z: 2000 mg | During directly observed treatment (DOT), "health personal" supervised treatment. Time with DOT is unclear. | |
| 2HRZ/4HR | No | By weight categories only for FDCs | H: 225 mg R: 450 mg Z: 1200 mg | Not reported | H: 300 mg R: 600 mg Z: 1600 mg | Not reported | Self‐administered treatment was done during the whole treatment. Dose used for single‐drug formulations: not reported. | |
| 2HRZE/4HR1 | During 6 days a week | By weight categories | H: 225 mg R: 450 mg Z: 1200 mg E: 825 mg | H: 250 mg R: 450 mg Z: 1200 mg E: 800 mg | H: 300 mg R: 600 mg Z: 1600 mg E: 1100 mg | H: 300 mg R: 600 mg Z: 1600 mg E: 1200 mg | The trial authors state: "In the majority of the trial centers, treatment was fully supervised for a minimum of 6 days a week". Every treatment dose was taken under the supervision of the medical staff. | |
| 2HRZE/4HR | During the intensive phase | Not reported | Not reported | Not reported | Not reported | Not reported | The supervision mechanism during DOT is unclear, and only mention "strictly supervised". Self‐administered treatment was done during the continuation phase. | |
| 2HRZ/4HR2 | No | By weight categories | H: 320 mg R: 480 mg Z: 1000 mg | Unclear | H: 400 mg R: 600 mg Z: 1250 mg | Unclear | Self‐administered treatment during the whole treatment. | |
| 4HRZE | Mode of drugs administration: not reported | By weight categories | Mairin‐P: 4 tablets + H: 225 mg | H: 450 mg R: 450 mg Z: 900 mg E: 1125 mg | Mairin‐P: 5 tablets + H: 300 mg | H: 600 mg R: 600 mg Z: 1200 mg E: 1500 mg | Streptomycin was added in 2 of the 4 randomized groups3. | |
| 2HRZE/4HRE | No | By weight categories | H: 200 mg R: 480 mg Z: 1000 mg E: not reported | H: 300 mg R: 450 mg Z: 1500 mg E: 1200 mg | H: 250 mg R: 600 mg Z: 1250 mg E: not reported | H: 300 mg R: 600 mg Z: 1500 mg E: 1200 mg | Self‐administered treatment during the whole treatment. | |
| 2HRZE/3HR | Once a weekly | By weight categories | Average dose H: 225 mg R: 450 mg Z: 1200 mg E: 825 mg | Average dose H: 300 mg R: 450 mg Z: 1500 mg E: 750 mg | Average dose H: 225 mg R: 450 mg Z: 1200 mg E: 825 mg | Average dose H: 300 mg R: 450 mg Z: 1500 mg E: 750 mg | The study authors state: "The loose drug regimen contained higher dosages of H and Z and lower dosage for E compared to the FDCs". Drugs "were given under supervision at health facilities" during DOT. Self‐administered treatment was done the remaining days. | |
| Three different regimes were given4 | During the whole treatment | By weight categories | H: 250 mg R: 600 mg Z: 1500 mg S: 750 mg | H: 300 mg R: 600 mg Z: 1500 mg S: 750 mg | H: 300 mg R: 720 mg Z: 1800 mg S: 750 mg | H: 300 mg R: 600 mg Z: 2000 mg S: 750 mg | The supervision mechanism during DOT is not clear. And only mention: DOT was given "at the community health clinic". | |
| 2HRZE/4HRE | Treatment was given as TDO 5 days per week and self‐administered during weekends | By weight categories | H: 320 mg R: 480 mg Z: 1000 mg | H: 300 mg R: 450 mg Z: 1125 mg E: 900 mg | H: 400 mg R: 600 mg Z: 1250 mg | H: 300 mg R: 600 mg Z: 1500 mg E: 1200 mg | DOT was supervised by "health workers". The ethambutol dose in FDCs groups was not reported. | |
| 2HRZE/4HRE | During the intensive phase | By weight categories | 5H: 300 mg R: 480 mg Z: 1400 mg E: 1000 mg | H: 300 mg R: 450 mg Z: 1500 mg E: 1200 mg | 5H: 375 mg R: 600 mg Z: 1750 mg E: 1250 mg | H: 400 mg R: 600 mg Z: 2000 mg E: 1600 mg | The supervision mechanism during DOT is unclear and only mention: "directly observed therapy was followed for each patient on a daily basis". | |
| 2HRZ/4HR | During the intensive phase | By weight categories | H: 320 mg R: 400 mg Z: 1000 mg | H: 300 mg R: 450 mg Z: 1500 mg | H: 400 mg R: 600 mg Z: 1250 mg | H: 300 mg R: 600 mg Z: 1500 mg | The trial authors state: "All drugs were taken under close supervision of a health care provider". | |
| 2HRZ/4HR | Only for a part of participants6 | By weight categories | H: 320 mg R: 480 mg Z: 1000 mg | H: 300 mg R: 450 mg Z: 1500 mg | H: 320 mg R: 480 mg Z: 1000 mg | H: 300 mg R: 600 mg Z: 1500 mg | There were 3 kinds of treatment management combined with 3 supervision models. | |
| Abbreviations: kg: kilograms of body weight; H: isoniazid; R: rifampicin; Z: pyrazinamide; E: ethambutol; FDCs: fixed‐dose combinations; SDF: single‐dose formulations; mg: milligrams; DOT: directly‐observed treatment. 1In Lienhardt 2011 the treatment regimen was 8 weeks for intensive phase and 18 weeks for continuation phase. | ||||||||
| Fixed‐dose combinations (FDCs) compared to single‐drug formulations for treating newly diagnosed pulmonary tuberculosis (TB) | |||||
| Participant or population: treating pulmonary TB | |||||
| Outcomes | Illustrative comparative risks* (95% CI) | Relative effect | Number of participants | Quality of the evidence | |
| Assumed risk single‐drug formulations | Corresponding risk FDCs | ||||
| Combined endpoint of treatment failure, relapse, or death** | — | — | — | (0 RCTs) | — |
| Treatment failure | 22 per 1000 | 25 per 1000 | RR 1.17 | 2507 | ⊕⊕⊕⊝ |
| Relapse | 79 per 1000 | 88 per 1000 | RR 1.12 | 2293 | ⊕⊕⊕⊝ |
| Death | 9 per 1000 | 12 per 1000 | RR 1.35 | 2470 | ⊕⊕⊕⊝ |
| Sputum smear or culture conversion at end of treatment | 827 per 1000 | 802 per 1000 | RR 0.97 | 1159 | ⊕⊕⊕⊕ |
| Serious adverse events | 17 per 1000 | 25 per 1000 | RR 1.44 | 2703 | ⊕⊕⊕⊝ |
| Adverse events leading to discontinuation of therapy | 18 per 1000 | 30 per 1000 | RR 1.71 | 2703 | ⊕⊕⊕⊝ |
| *The risk in the intervention group (and its 95% CI) is based on the assumed risk in the comparison group and the relative effect of the intervention (and its 95% CI). | |||||
| GRADE Working Group grades of evidence | |||||
| 1We did not downgrade the quality due to inconsistency. I² statistic = 0%. | |||||
| Outcomes | Assumed risk | Clinically important reduction | Optimal sample size 1,2 | |
| Single‐drug formulations | Absolute | Relative | ||
| Treatment failure | 2.2 % | 0.5% | 25% | 6092 |
| Relapse | 2.3 % | 0.5% | 25% | 4718 |
| Death3 | 0.9 % | 0.1% | 4.5% | 737,340 |
| Sputum/culture conversion at end of treatment | 88.7% | 0.5% | 0.6% | 95,044 |
| Serious adverse events | 1.5 % | 0.1% | 6.7% | 12,356 |
| Adverse events leading to discontinuation of therapy | 4.1 % | 0.5% | 24.4% | 325,024 |
| 1We based all calculations are based on: 1‐sided tests, with a ratio of 1:1, power of 0.9, and confidence level of 0.05. | ||||
| Outcome or subgroup title | No. of studies | No. of participants | Statistical method | Effect size |
| 1 Treatment failure Show forest plot | 7 | 3606 | Risk Ratio (M‐H, Fixed, 95% CI) | 1.28 [0.82, 2.00] |
| 2 Relapse Show forest plot | 10 | 3621 | Risk Ratio (M‐H, Fixed, 95% CI) | 1.28 [1.00, 1.64] |
| 3 Death Show forest plot | 11 | 4800 | Risk Ratio (M‐H, Fixed, 95% CI) | 0.96 [0.67, 1.39] |
| 4 Sputum smear or culture conversion at 2 months of starting treatment Show forest plot | 13 | 4836 | Risk Ratio (M‐H, Fixed, 95% CI) | 1.01 [0.99, 1.03] |
| 5 Sputum smear or culture conversion at end of treatment (EOT) Show forest plot | 7 | 2319 | Risk Ratio (M‐H, Fixed, 95% CI) | 0.99 [0.96, 1.02] |
| 6 Treatment adherence at 8 weeks of starting treatment Show forest plot | 3 | 881 | Risk Ratio (M‐H, Random, 95% CI) | 1.04 [0.96, 1.12] |
| 7 Treatment adherence at EOT Show forest plot | 5 | 1229 | Risk Ratio (M‐H, Fixed, 95% CI) | 1.01 [0.97, 1.06] |
| 8 Acquisition of drug resistance Show forest plot | 3 | 491 | Risk Ratio (M‐H, Fixed, 95% CI) | 0.76 [0.15, 3.77] |
| 9 Patient satisfaction Show forest plot | 2 | Risk Ratio (M‐H, Fixed, 95% CI) | Subtotals only | |
| 9.1 General satisfaction | 1 | 222 | Risk Ratio (M‐H, Fixed, 95% CI) | 1.04 [0.97, 1.12] |
| 9.2 No problems on swallowing | 1 | 1023 | Risk Ratio (M‐H, Fixed, 95% CI) | 1.03 [1.00, 1.06] |
| 9.3 Convenient number of tablets | 1 | 1045 | Risk Ratio (M‐H, Fixed, 95% CI) | 1.50 [1.37, 1.64] |
| 9.4 Acceptable taste | 1 | 1044 | Risk Ratio (M‐H, Fixed, 95% CI) | 1.39 [1.27, 1.51] |
| 10 Serious adverse events Show forest plot | 6 | 3388 | Risk Ratio (M‐H, Fixed, 95% CI) | 1.45 [0.90, 2.33] |
| 11 Adverse events leading to discontinuation of therapy Show forest plot | 13 | 5530 | Risk Ratio (M‐H, Random, 95% CI) | 0.96 [0.56, 1.66] |
| 12 Other adverse events Show forest plot | 9 | 4639 | Risk Ratio (M‐H, Fixed, 95% CI) | 0.85 [0.72, 1.00] |
| Outcome or subgroup title | No. of studies | No. of participants | Statistical method | Effect size |
| 1 Treatment failure Show forest plot | 7 | 3606 | Risk Ratio (M‐H, Fixed, 95% CI) | 1.28 [0.82, 2.00] |
| 1.1 High or unclear risk of selection bias | 5 | 1099 | Risk Ratio (M‐H, Fixed, 95% CI) | 1.77 [0.67, 4.69] |
| 1.2 Low risk of selection bias | 2 | 2507 | Risk Ratio (M‐H, Fixed, 95% CI) | 1.17 [0.70, 1.93] |
| 2 Relapse Show forest plot | 10 | 3621 | Risk Ratio (M‐H, Fixed, 95% CI) | 1.28 [1.00, 1.64] |
| 2.1 High or unclear risk of selection bias | 8 | 1328 | Risk Ratio (M‐H, Fixed, 95% CI) | 2.84 [1.34, 6.00] |
| 2.2 Low risk of selection bias | 2 | 2293 | Risk Ratio (M‐H, Fixed, 95% CI) | 1.12 [0.86, 1.46] |
| 3 Death Show forest plot | 11 | 4800 | Risk Ratio (M‐H, Fixed, 95% CI) | 0.96 [0.67, 1.39] |
| 3.1 High or unclear risk of selection bias | 9 | 2330 | Risk Ratio (M‐H, Fixed, 95% CI) | 0.86 [0.57, 1.32] |
| 3.2 Low risk of selection bias | 2 | 2470 | Risk Ratio (M‐H, Fixed, 95% CI) | 1.35 [0.63, 2.93] |
| 4 Sputum smear or culture conversion at 2 months of starting treatment Show forest plot | 13 | 4836 | Risk Ratio (M‐H, Fixed, 95% CI) | 1.01 [0.99, 1.03] |
| 4.1 High or unclear risk of selection bias | 11 | 2507 | Risk Ratio (M‐H, Fixed, 95% CI) | 1.04 [1.01, 1.06] |
| 4.2 Low risk of selection bias | 2 | 2329 | Risk Ratio (M‐H, Fixed, 95% CI) | 0.99 [0.95, 1.02] |
| 5 Sputum smear or culture conversion at EOT Show forest plot | 7 | 2319 | Risk Ratio (M‐H, Fixed, 95% CI) | 0.99 [0.96, 1.02] |
| 5.1 High or unclear risk of selection bias | 6 | 1160 | Risk Ratio (M‐H, Fixed, 95% CI) | 1.00 [0.98, 1.03] |
| 5.2 Low risk of selection bias | 1 | 1159 | Risk Ratio (M‐H, Fixed, 95% CI) | 0.97 [0.92, 1.03] |
| 6 Acquisition of drug resistance Show forest plot | 3 | 491 | Risk Ratio (M‐H, Fixed, 95% CI) | 0.76 [0.15, 3.77] |
| 6.1 High or unclear risk of selection bias | 2 | 460 | Risk Ratio (M‐H, Fixed, 95% CI) | 0.64 [0.08, 4.79] |
| 6.2 Low risk of selection bias | 1 | 31 | Risk Ratio (M‐H, Fixed, 95% CI) | 1.07 [0.07, 15.57] |
| 7 Serious adverse events Show forest plot | 6 | 3388 | Risk Ratio (M‐H, Fixed, 95% CI) | 1.45 [0.90, 2.33] |
| 7.1 High or unclear risk of selection bias | 4 | 685 | Risk Ratio (M‐H, Fixed, 95% CI) | 1.47 [0.46, 4.71] |
| 7.2 Low risk of selection bias | 2 | 2703 | Risk Ratio (M‐H, Fixed, 95% CI) | 1.44 [0.86, 2.44] |
| 8 Adverse events leading to discontinuation of therapy Show forest plot | 13 | 5530 | Risk Ratio (M‐H, Random, 95% CI) | 0.96 [0.56, 1.66] |
| 8.1 High or unclear risk of selection bias | 11 | 2827 | Risk Ratio (M‐H, Random, 95% CI) | 0.67 [0.31, 1.43] |
| 8.2 Low risk of selection bias | 2 | 2703 | Risk Ratio (M‐H, Random, 95% CI) | 1.71 [1.04, 2.81] |
| 9 Other adverse events Show forest plot | 9 | 4639 | Risk Ratio (M‐H, Fixed, 95% CI) | 0.85 [0.72, 1.00] |
| 9.1 High or unclear risk of selection bias | 7 | 1936 | Risk Ratio (M‐H, Fixed, 95% CI) | 0.87 [0.71, 1.07] |
| 9.2 Low risk of selection bias | 2 | 2703 | Risk Ratio (M‐H, Fixed, 95% CI) | 0.82 [0.63, 1.07] |
| Outcome or subgroup title | No. of studies | No. of participants | Statistical method | Effect size |
| 1 Treatment failure (ITT analysis and all losses to follow‐up judged as failure) Show forest plot | 7 | 4004 | Risk Ratio (M‐H, Fixed, 95% CI) | 1.03 [0.93, 1.14] |
| 2 Relapse (ITT analysis and all losses to follow‐up judged as relapse) Show forest plot | 10 | 4716 | Risk Ratio (M‐H, Fixed, 95% CI) | 1.05 [0.95, 1.16] |
| 3 Sputum smear or culture conversion at 2 months of starting treatment (ITT analysis and all losses to follow‐up judged as conversion failure) Show forest plot | 13 | 5731 | Risk Ratio (M‐H, Fixed, 95% CI) | 1.00 [0.97, 1.03] |
| 4 Sputum smear or culture conversion at EOT (ITT analysis and all losses to follow‐up judged as conversion failure) Show forest plot | 7 | 2552 | Risk Ratio (M‐H, Fixed, 95% CI) | 0.99 [0.95, 1.02] |
| Outcome or subgroup title | No. of studies | No. of participants | Statistical method | Effect size |
| 1 Treatment failure Show forest plot | 7 | 3606 | Risk Ratio (M‐H, Fixed, 95% CI) | 1.28 [0.82, 2.00] |
| 1.1 Fixed‐dose combinations (FDCs) only at intensive phase | 1 | 307 | Risk Ratio (M‐H, Fixed, 95% CI) | 1.99 [0.18, 21.69] |
| 1.2 FDCs during all treatment | 6 | 3299 | Risk Ratio (M‐H, Fixed, 95% CI) | 1.26 [0.80, 1.99] |
| 2 Relapse Show forest plot | 10 | 3621 | Risk Ratio (M‐H, Fixed, 95% CI) | 1.28 [1.00, 1.64] |
| 2.1 FDCs only at intensive phase | 1 | 251 | Risk Ratio (M‐H, Fixed, 95% CI) | 3.94 [1.13, 13.78] |
| 2.2 FDCs during all treatment | 9 | 3370 | Risk Ratio (M‐H, Fixed, 95% CI) | 1.20 [0.93, 1.55] |
| 3 Death Show forest plot | 11 | 4800 | Risk Ratio (M‐H, Fixed, 95% CI) | 0.96 [0.67, 1.39] |
| 3.1 FDCs only at intensive phase | 1 | 271 | Risk Ratio (M‐H, Fixed, 95% CI) | 1.40 [0.50, 3.94] |
| 3.2 FDCs during all treatment | 10 | 4529 | Risk Ratio (M‐H, Fixed, 95% CI) | 0.91 [0.61, 1.35] |
| 4 Sputum smear or culture conversion at 2 months of starting treatment Show forest plot | 13 | 4836 | Risk Ratio (M‐H, Fixed, 95% CI) | 1.01 [0.99, 1.03] |
| 4.1 FDCs only at intensive phase | 1 | 269 | Risk Ratio (M‐H, Fixed, 95% CI) | 1.01 [0.96, 1.07] |
| 4.2 FDCs during all treatment | 12 | 4567 | Risk Ratio (M‐H, Fixed, 95% CI) | 1.01 [0.99, 1.03] |
| 5 Acquisition of drug resistance Show forest plot | 3 | 491 | Risk Ratio (M‐H, Fixed, 95% CI) | 0.76 [0.15, 3.77] |
| 5.1 FDCs only at intensive phase | 1 | 251 | Risk Ratio (M‐H, Fixed, 95% CI) | 0.36 [0.01, 8.70] |
| 5.2 FDCs during all treatment | 2 | 240 | Risk Ratio (M‐H, Fixed, 95% CI) | 1.06 [0.15, 7.24] |
| 6 Adverse events leading to discontinuation of therapy Show forest plot | 13 | 5530 | Risk Ratio (M‐H, Random, 95% CI) | 0.96 [0.56, 1.66] |
| 6.1 FDCs only at intensive phase | 1 | 271 | Risk Ratio (M‐H, Random, 95% CI) | 1.84 [0.55, 6.15] |
| 6.2 FDCs during all treatment | 12 | 5259 | Risk Ratio (M‐H, Random, 95% CI) | 0.87 [0.48, 1.59] |
| 7 Other adverse events Show forest plot | 9 | 4639 | Risk Ratio (M‐H, Fixed, 95% CI) | 0.85 [0.72, 1.00] |
| 7.1 FDCs only at intensive phase | 1 | 271 | Risk Ratio (M‐H, Fixed, 95% CI) | 1.05 [0.75, 1.48] |
| 7.2 FDCs during all treatment | 8 | 4368 | Risk Ratio (M‐H, Fixed, 95% CI) | 0.81 [0.67, 0.97] |
| Outcome or subgroup title | No. of studies | No. of participants | Statistical method | Effect size |
| 1 Treatment failure Show forest plot | 7 | 3606 | Risk Ratio (M‐H, Fixed, 95% CI) | 1.28 [0.82, 2.00] |
| 1.1 Daily medication for the whole treatment | 4 | 1517 | Risk Ratio (M‐H, Fixed, 95% CI) | 1.14 [0.63, 2.06] |
| 1.2 Daily medication at intensive phase followed by intermittent treatment at continuation phase | 3 | 2089 | Risk Ratio (M‐H, Fixed, 95% CI) | 1.49 [0.75, 2.96] |
| 2 Relapse Show forest plot | 10 | 3621 | Risk Ratio (M‐H, Fixed, 95% CI) | 1.28 [1.00, 1.64] |
| 2.1 Daily medication for the whole treatment | 7 | 1850 | Risk Ratio (M‐H, Fixed, 95% CI) | 1.12 [0.83, 1.50] |
| 2.2 Daily medication at intensive phase followed by intermittent treatment at continuation phase | 3 | 1771 | Risk Ratio (M‐H, Fixed, 95% CI) | 1.72 [1.07, 2.75] |
| 3 Death Show forest plot | 11 | 4800 | Risk Ratio (M‐H, Fixed, 95% CI) | 0.96 [0.67, 1.39] |
| 3.1 Daily medication for the whole treatment | 8 | 2859 | Risk Ratio (M‐H, Fixed, 95% CI) | 1.34 [0.79, 2.29] |
| 3.2 Daily medication at intensive phase followed by intermittent treatment at continuation phase | 3 | 1941 | Risk Ratio (M‐H, Fixed, 95% CI) | 0.69 [0.41, 1.16] |
| 4 Sputum smear or culture conversion at 2 months of starting treatment Show forest plot | 13 | 4836 | Risk Ratio (M‐H, Fixed, 95% CI) | 1.01 [0.99, 1.03] |
| 4.1 Daily medication for the whole treatment | 9 | 3001 | Risk Ratio (M‐H, Fixed, 95% CI) | 1.00 [0.98, 1.03] |
| 4.2 Daily medication at intensive phase followed by intermittent treatment at continuation phase | 4 | 1835 | Risk Ratio (M‐H, Fixed, 95% CI) | 1.02 [0.99, 1.05] |
| 5 Sputum smear or culture conversion at EOT Show forest plot | 7 | 2319 | Risk Ratio (M‐H, Fixed, 95% CI) | 0.99 [0.96, 1.02] |
| 5.1 Daily medication for the whole treatment | 6 | 1961 | Risk Ratio (M‐H, Fixed, 95% CI) | 0.99 [0.96, 1.02] |
| 5.2 Daily medication at intensive phase followed by intermittent treatment at continuation phase | 1 | 358 | Risk Ratio (M‐H, Fixed, 95% CI) | 1.00 [0.95, 1.05] |
| 6 Acquisition of drug resistance Show forest plot | 3 | 491 | Risk Ratio (M‐H, Fixed, 95% CI) | 0.76 [0.15, 3.77] |
| 6.1 Daily medication for the whole treatment | 1 | 209 | Risk Ratio (M‐H, Fixed, 95% CI) | 1.05 [0.07, 16.55] |
| 6.2 Daily medication at intensive phase followed by intermittent treatment at continuation phase | 2 | 282 | Risk Ratio (M‐H, Fixed, 95% CI) | 0.64 [0.09, 4.69] |
| 7 Serious adverse events Show forest plot | 6 | 3388 | Risk Ratio (M‐H, Fixed, 95% CI) | 1.45 [0.90, 2.33] |
| 7.1 Daily medication for the whole treatment | 4 | 1767 | Risk Ratio (M‐H, Fixed, 95% CI) | 1.60 [0.95, 2.68] |
| 7.2 Daily medication at intensive phase followed by intermittent treatment at continuation phase | 2 | 1621 | Risk Ratio (M‐H, Fixed, 95% CI) | 0.79 [0.21, 2.92] |
| 8 Adverse events leading to discontinuation of therapy Show forest plot | 13 | 5530 | Risk Ratio (M‐H, Random, 95% CI) | 0.96 [0.56, 1.66] |
| 8.1 Daily medication for the whole treatment | 9 | 3204 | Risk Ratio (M‐H, Random, 95% CI) | 0.78 [0.39, 1.59] |
| 8.2 Daily medication at intensive phase followed by intermittent treatment at continuation phase | 4 | 2326 | Risk Ratio (M‐H, Random, 95% CI) | 1.55 [0.74, 3.25] |
| 9 Other adverse events Show forest plot | 9 | 4639 | Risk Ratio (M‐H, Fixed, 95% CI) | 0.85 [0.72, 1.00] |
| 9.1 Daily medication for the whole treatment | 6 | 2747 | Risk Ratio (M‐H, Fixed, 95% CI) | 0.84 [0.70, 1.02] |
| 9.2 Daily medication at intensive phase followed by intermittent treatment at continuation phase | 3 | 1892 | Risk Ratio (M‐H, Fixed, 95% CI) | 0.86 [0.64, 1.18] |
| Outcome or subgroup title | No. of studies | No. of participants | Statistical method | Effect size |
| 1 Treatment failure Show forest plot | 6 | 2447 | Risk Ratio (M‐H, Fixed, 95% CI) | 1.46 [0.75, 2.84] |
| 1.1 Supervised treatment during the intensive phase | 4 | 1962 | Risk Ratio (M‐H, Fixed, 95% CI) | 1.27 [0.56, 2.89] |
| 1.2 Self‐administered treatment during the intensive phase | 2 | 485 | Risk Ratio (M‐H, Fixed, 95% CI) | 1.89 [0.59, 6.04] |
| 2 Relapse Show forest plot | 9 | 2676 | Risk Ratio (M‐H, Fixed, 95% CI) | 1.69 [1.09, 2.63] |
| 2.1 Supervised treatment during the intensive phase | 6 | 2318 | Risk Ratio (M‐H, Fixed, 95% CI) | 1.52 [0.94, 2.45] |
| 2.2 Self‐administered treatment during the intensive phase | 3 | 358 | Risk Ratio (M‐H, Fixed, 95% CI) | 2.93 [0.89, 9.59] |
| 3 Death Show forest plot | 10 | 3678 | Risk Ratio (M‐H, Fixed, 95% CI) | 0.82 [0.55, 1.22] |
| 3.1 Supervised treatment during the intensive phase | 6 | 2503 | Risk Ratio (M‐H, Fixed, 95% CI) | 0.89 [0.50, 1.58] |
| 3.2 Self‐administered treatment during the intensive phase | 4 | 1175 | Risk Ratio (M‐H, Fixed, 95% CI) | 0.76 [0.44, 1.32] |
| 4 Sputum smear or culture conversion at 2 months of starting treatment Show forest plot | 12 | 3677 | Risk Ratio (M‐H, Fixed, 95% CI) | 1.03 [1.01, 1.05] |
| 4.1 Supervised treatment during the intensive phase | 8 | 2584 | Risk Ratio (M‐H, Fixed, 95% CI) | 1.02 [0.99, 1.05] |
| 4.2 Self‐administered treatment during the intensive phase | 4 | 1093 | Risk Ratio (M‐H, Fixed, 95% CI) | 1.06 [1.01, 1.11] |
| 5 Sputum smear or culture conversion at EOT Show forest plot | 6 | 1160 | Risk Ratio (M‐H, Fixed, 95% CI) | 1.00 [0.98, 1.03] |
| 5.1 Supervised treatment during the intensive phase | 2 | 513 | Risk Ratio (M‐H, Fixed, 95% CI) | 1.01 [0.99, 1.04] |
| 5.2 Self‐administered treatment during the intensive phase | 4 | 647 | Risk Ratio (M‐H, Fixed, 95% CI) | 1.00 [0.97, 1.03] |
| 6 Treatment adherence at 8 weeks of starting treatment Show forest plot | 3 | 881 | Risk Ratio (M‐H, Random, 95% CI) | 1.04 [0.96, 1.12] |
| 6.1 Supervised treatment during the intensive phase | 1 | 142 | Risk Ratio (M‐H, Random, 95% CI) | 1.01 [0.97, 1.06] |
| 6.2 Self‐administered treatment during the intensive phase | 2 | 739 | Risk Ratio (M‐H, Random, 95% CI) | 1.09 [0.90, 1.31] |
| 7 Treatment adherence at EOT Show forest plot | 5 | 1229 | Risk Ratio (M‐H, Fixed, 95% CI) | 1.01 [0.97, 1.06] |
| 7.1 Supervised treatment during the intensive phase | 1 | 96 | Risk Ratio (M‐H, Fixed, 95% CI) | 1.04 [0.97, 1.11] |
| 7.2 Self‐administered treatment during the intensive phase | 4 | 1133 | Risk Ratio (M‐H, Fixed, 95% CI) | 1.01 [0.96, 1.06] |
| 8 Serious adverse events Show forest plot | 5 | 2266 | Risk Ratio (M‐H, Fixed, 95% CI) | 1.10 [0.46, 2.60] |
| 8.1 Supervised treatment during the intensive phase | 4 | 2056 | Risk Ratio (M‐H, Fixed, 95% CI) | 0.99 [0.40, 2.44] |
| 8.2 Self‐administered treatment during the intensive phase | 1 | 210 | Risk Ratio (M‐H, Fixed, 95% CI) | 3.17 [0.13, 77.05] |
| 9 Adverse events leading to discontinuation of therapy Show forest plot | 12 | 4408 | Risk Ratio (M‐H, Random, 95% CI) | 0.82 [0.43, 1.57] |
| 9.1 Supervised treatment during the intensive phase | 8 | 3121 | Risk Ratio (M‐H, Random, 95% CI) | 0.44 [0.11, 1.71] |
| 9.2 Self‐administered treatment during the intensive phase | 4 | 1287 | Risk Ratio (M‐H, Random, 95% CI) | 1.06 [0.55, 2.04] |
| 10 Other adverse events Show forest plot | 8 | 3517 | Risk Ratio (M‐H, Fixed, 95% CI) | 0.82 [0.68, 1.00] |
| 10.1 Supervised treatment during the intensive phase | 7 | 2979 | Risk Ratio (M‐H, Fixed, 95% CI) | 0.79 [0.64, 0.96] |
| 10.2 Self‐administered treatment during the intensive phase | 1 | 538 | Risk Ratio (M‐H, Fixed, 95% CI) | 2.56 [0.90, 7.23] |
| Outcome or subgroup title | No. of studies | No. of participants | Statistical method | Effect size |
| 1 Treatment failure Show forest plot | 7 | 3606 | Risk Ratio (M‐H, Fixed, 95% CI) | 1.28 [0.82, 2.00] |
| 1.1 Four drugs as FDCs during the intensive phase | 3 | 2941 | Risk Ratio (M‐H, Fixed, 95% CI) | 1.27 [0.80, 2.01] |
| 1.2 Three or 2 drugs as FDCs during the intensive phase | 4 | 665 | Risk Ratio (M‐H, Fixed, 95% CI) | 1.52 [0.26, 9.08] |
| 2 Relapse Show forest plot | 9 | 3523 | Risk Ratio (M‐H, Fixed, 95% CI) | 1.28 [1.00, 1.64] |
| 2.1 Four drugs as FDCs during the intensive phase | 4 | 2675 | Risk Ratio (M‐H, Fixed, 95% CI) | 1.18 [0.91, 1.54] |
| 2.2 Three or 2 drugs as FDCs during the intensive phase | 5 | 848 | Risk Ratio (M‐H, Fixed, 95% CI) | 2.55 [1.07, 6.06] |
| 3 Death Show forest plot | 11 | 4800 | Risk Ratio (M‐H, Fixed, 95% CI) | 0.96 [0.67, 1.39] |
| 3.1 Four drugs as FDCs during the intensive phase | 4 | 3002 | Risk Ratio (M‐H, Fixed, 95% CI) | 0.79 [0.48, 1.30] |
| 3.2 Three or 2 drugs as FDCs during the intensive phase | 7 | 1798 | Risk Ratio (M‐H, Fixed, 95% CI) | 1.21 [0.70, 2.10] |
| 4 Adverse events leading to discontinuation of therapy Show forest plot | 13 | 5530 | Risk Ratio (M‐H, Random, 95% CI) | 0.96 [0.56, 1.66] |
| 4.1 Four drugs as FDCs during the intensive phase | 4 | 3430 | Risk Ratio (M‐H, Random, 95% CI) | 1.21 [0.53, 2.78] |
| 4.2 Three or 2 drugs as FDCs during the intensive phase | 9 | 2100 | Risk Ratio (M‐H, Random, 95% CI) | 0.81 [0.37, 1.77] |
| 5 Sputum smear or culture conversion at EOT Show forest plot | 7 | 2319 | Risk Ratio (M‐H, Fixed, 95% CI) | 0.99 [0.96, 1.02] |
| 5.1 Four drugs as FDCs during the intensive phase | 2 | 1517 | Risk Ratio (M‐H, Fixed, 95% CI) | 0.98 [0.94, 1.02] |
| 5.2 Three or 2 drugs as FDCs during the intensive phase | 5 | 802 | Risk Ratio (M‐H, Fixed, 95% CI) | 1.01 [0.98, 1.03] |
| 6 Acquisition of drug resistance Show forest plot | 3 | 491 | Risk Ratio (M‐H, Fixed, 95% CI) | 0.76 [0.15, 3.77] |
| 6.1 Four drugs as FDCs during the intensive phase | 1 | 31 | Risk Ratio (M‐H, Fixed, 95% CI) | 1.07 [0.07, 15.57] |
| 6.2 Three or 2 drugs as FDCs during the intensive phase | 2 | 460 | Risk Ratio (M‐H, Fixed, 95% CI) | 0.64 [0.08, 4.79] |
| 7 Serious adverse events Show forest plot | 6 | 3388 | Risk Ratio (M‐H, Fixed, 95% CI) | 1.45 [0.90, 2.33] |
| 7.1 Four drugs as FDCs during the intensive phase | 3 | 2996 | Risk Ratio (M‐H, Fixed, 95% CI) | 1.34 [0.81, 2.23] |
| 7.2 Three or 2 drugs as FDCs during the intensive phase | 3 | 392 | Risk Ratio (M‐H, Fixed, 95% CI) | 2.59 [0.59, 11.34] |
| 8 Sputum smear or culture conversion at 2 months of starting treatment Show forest plot | 13 | 4836 | Risk Ratio (M‐H, Fixed, 95% CI) | 1.01 [0.99, 1.03] |
| 8.1 Four drugs as FDCs during the intensive phase | 4 | 2980 | Risk Ratio (M‐H, Fixed, 95% CI) | 1.00 [0.97, 1.03] |
| 8.2 Three or 2 drugs as FDCs during the intensive phase | 9 | 1856 | Risk Ratio (M‐H, Fixed, 95% CI) | 1.04 [1.01, 1.07] |
| 9 Other adverse events Show forest plot | 9 | 4639 | Risk Ratio (M‐H, Fixed, 95% CI) | 0.85 [0.72, 1.00] |
| 9.1 Four drugs as FDCs during the intensive phase | 3 | 2996 | Risk Ratio (M‐H, Fixed, 95% CI) | 0.81 [0.64, 1.02] |
| 9.2 Three or 2 drugs as FDCs during the intensive phase | 6 | 1643 | Risk Ratio (M‐H, Fixed, 95% CI) | 0.90 [0.71, 1.13] |