Fixed‐dose combinations of drugs versus single‐drug formulations for treating pulmonary tuberculosis
References
References to studies included in this review
References to studies excluded from this review
References to studies awaiting assessment
Additional references
References to other published versions of this review
Characteristics of studies
Characteristics of included studies [ordered by study ID]
Jump to:
| Methods | Design: open, multicentre, multinational RCT Generation of allocation: generated by computer by an independent central randomization institute Allocation concealment: sealed, serially numbered, opaque randomization envelopes Blinding: none Duration: not mentioned | |
| Participants | Number of participants: 1159 randomized Completeness of follow‐up: 60.7% of participants (per‐protocol population) Baseline drug susceptibility test: results not reported | |
| Interventions | Six months treatment regimen (2HRZE/4HR) Intervention: 4 fixed‐dose combinations (FDCs)
Doses used: "on the basis of body weight according to the international recommendations (WHO and International Union Against Tuberculosis and Lung Disease [The Union])" (Blomberg 2001) Control
Doses used: the trial authors stated: "according to the national treatment standards of each respective country" Drugs were taken daily and according to the body weight for the total of participants, for whole treatment Mode of drugs administration: it was not reported whether the treatment was self‐administered or supervised | |
| Outcomes | Outcomes used in this review
| |
| Notes | Locations: Egypt, Indian, Pakistan, the Philippines, and Thailand Setting: not described Source of funding: not mentioned Comments: follow‐up duration was 12 months after initiation of treatment. Sputum smear conversion rate was measured at 2, 4, 6, 9, and 12 months after initiation of treatment. Adverse events were assessed at each visit. Participant satisfaction with tablets was noted at 2 months | |
| Risk of bias | ||
| Bias | Authors' judgement | Support for judgement |
| Random sequence generation (selection bias) | Low risk | Using a computer random number generator. |
| Allocation concealment (selection bias) | Low risk | Central randomization institute which provided sequentially numbered, opaque, sealed envelopes. |
| Blinding of participants and personnel (performance bias) | Low risk | No blinding, but outcomes were unlikely to be influenced by lack of blinding (objective and measurable outcomes). |
| Blinding of outcome assessment (detection bias) | Low risk | No blinding of outcome assessment, but outcome measurement is unlikely to be influenced by lack of blinding (objective and measurable outcomes). |
| Incomplete outcome data (attrition bias) | Low risk | Missing outcome data balanced in numbers across intervention groups, with similar reasons for missing data. |
| Selective reporting (reporting bias) | Low risk | Most of expected outcomes are included in the published report. |
| Other bias | Low risk | The study appears to be free of other sources of bias. |
| Methods | Design: RCT Generation of allocation: not stated Allocation concealment: not stated Blinding: not stated Duration: not mentioned | |
| Participants | Number of participants: 250 randomized Males: 74% (of 196 participants initially sensitive to isoniazid) Inclusion criteria: new pulmonary TB participants (aged 15 or more) confirmed by chest x‐ray and sputum smear. They should lived in Algiers and accepted medical monitoring for 2 years Exclusion criteria: not reported Completeness of follow‐up: 86% (ITT population) Baseline drug susceptibility test: initially drug resistant participants 8.4% (16/190 tested); (FDCs H:2, S:4, H&S:4 and single‐drug formulations H:2, S:2, H&S:4) HIV status of participants: not reported | |
| Interventions | Six months treatment regimen (2HRZ/4HR) Intensive phase (8 weeks) Intervention
Doses used: 4 tablets for participants weighing less than 44 kg, 5 tablets for participants weighing 44 to 50 kg and 6 tablets for participants weighing ≥ 50 kg Control
Doses used: isoniazid 300 mg; rifampicin 450 mg for participants weighing < 50 kg and 600 mg for ≥ 50 kg; and pyrazinamide 1500 mg for participants weighing < 50 kg and 2000 mg for ≥ 50 kg Continuation phase (20 weeks)
Treatment was administered daily for the whole course, as directly observed treatment (DOT) with participants kept at hospital under supervision of health personnel at the beginning of intensive phase and as outpatients and self‐administered the rest of the time | |
| Outcomes | Outcomes used in this review
| |
| Notes | Three publications for the same clinical trial (Agounitestane 1990; Bellabas 1989; Chaulet 1995). Most outcomes were assessed according to the data provided in Chaulet 1995, the most recent publication. Preliminary results had been previously published (Agounitestane 1990; Bellabas 1989) Location: Algeria Setting: The Matiben Chest Clinic at the West Algiers University Teaching Hospital and 3 other outpatient clinics in Algiers Source of funding: National Institute of Higher Medical Sciences in Algiers and the Ministry of Health Comments follow‐up duration was 2 years after initiation of treatment. Sputum smears and culture were examined at 8, 24, and 28 weeks, and every 6 months (follow‐up) after initiation of treatment. Adverse events were assessed at each visit and at 2 months. For the treatment adherence time to follow‐up was not reported. Patient satisfaction with formulations was noted at 2 months | |
| Risk of bias | ||
| Bias | Authors' judgement | Support for judgement |
| Random sequence generation (selection bias) | Unclear risk | Insufficient information about random sequence generation process to permit judgement of ‘low risk’ or ‘high risk’. |
| Allocation concealment (selection bias) | Unclear risk | Insufficient information to permit judgment of ‘low risk’ or ‘high risk’. |
| Blinding of participants and personnel (performance bias) | Low risk | Due to difficulties in blinding participants and personnel to the intervention, when the study did not specify blinding methods we considered it as an open design. In addition, outcomes were unlikely to be influenced by lack of blinding (objective and measurable outcomes). |
| Blinding of outcome assessment (detection bias) | Low risk | No blinding of outcome assessment, but outcome measurement is unlikely to be influenced by lack of blinding (objective and measurable outcomes). |
| Incomplete outcome data (attrition bias) | High risk | Reasons for missing outcome data were not reported. |
| Selective reporting (reporting bias) | Unclear risk | Insufficient information to permit judgement of ‘low risk’ or ‘high risk’. |
| Other bias | Low risk | The trial appears to be free of other sources of bias. |
| Methods | Design: open multicentre RCT Generation of allocation sequence: not stated Allocation concealment: not stated Blinding: none Duration: 4 years and 5 months (from October 1981 to March 1986) | |
| Participants | Number of participants: 701 randomized Males: 27.8% (protocol population) Inclusion criteria: adults, newly diagnosed with pulmonary TB due to Mycobacterium tuberculosis and freely consenting to participate in the trial Exclusion criteria: not reported Completeness of follow‐up: 87.2% (of 538 "eligible patients") Baseline drug susceptibility test: initially drug resistant participants 4.6% (32/701 randomized); FDCs: 13 and single‐drug formulations: 19. Also 56 participants with "likelihood of initial isoniazid resistance" of "eligible patients": FDCs: 28 and single‐drug formulations: 28 HIV status of participants: not reported | |
| Interventions | Six months treatment regimen (2HRZ/4HR) Intervention
Doses used: 3 tablets for participants weighing < 50 kg, 4 tablets for participants weighing 50 to 70 kg and 5 tablets for participants weighing > 70 kg during the intensive phase. Doses given during continuation phase were not reported Control
Doses used: not reported For whole treatment, drugs were taken daily and self‐administered as outpatients in both groups | |
| Outcomes | Outcomes used in this review
| |
| Notes | Location: USA Setting: TB clinics Source of funding: not mentioned Comments: follow‐up duration was 2 years after completion of treatment. Time of assessment of reported outcomes: "during the first 8 weeks of therapy" | |
| Risk of bias | ||
| Bias | Authors' judgement | Support for judgement |
| Random sequence generation (selection bias) | Unclear risk | Insufficient information about random sequence generation process to permit a judgement of ‘low risk’ or ‘high risk’. |
| Allocation concealment (selection bias) | Unclear risk | Insufficient information to permit judgment of ‘low risk’ or ‘high risk’. |
| Blinding of participants and personnel (performance bias) | Low risk | No blinding, but outcomes were unlikely to be influenced by lack of blinding (objective and measurable outcomes). |
| Blinding of outcome assessment (detection bias) | Low risk | No blinding, but outcomes were unlikely to be influenced by lack of blinding (objective and measurable outcomes). |
| Incomplete outcome data (attrition bias) | High risk | The reason for missing outcome data is likely to be related to true outcome, with either imbalance in numbers for missing data across intervention and control groups. |
| Selective reporting (reporting bias) | Unclear risk | Insufficient information to permit judgement of ‘low risk’ or ‘high risk’. |
| Other bias | High risk | The trial was designed with the amended protocol of a former study and followed an unbalanced randomization scheme (60% of participants were randomized to the FDCs regimen and 20% to each of the 2 original treatment arms). |
| Methods | Design: parallel‐group, open‐label, non inferiority, multicentre RCT Generation of allocation sequence: using a computer random number generator Allocation concealment: by sealed opaque envelopes with a serial number and details of treatment regimen Blinding: none Duration: 5 years (from 2003 to 2008) | |
| Participants | Number of participants: 1585 randomized Males: 66.6% (per‐protocol population) Mean age: 34 years (SD: 13.5) (protocol population) Inclusion criteria: newly diagnosed pulmonary TB adults (aged 18 years or more) with 2 sputum specimens positive for acid‐fast bacilli on direct‐smear microscopy, had received either no previous anti‐TB chemotherapy or < 4 weeks of chemotherapy for the current disease episode, had a firm home address that is readily accessible for visiting for the total duration of the trial (including follow‐up period), and had provided written informed consent form to participate in the study Exclusion criteria: had tuberculous meningitis or other extrapulmonary disease, insulin‐dependent diabetes, chronic liver or kidney disease, blood disorders, peripheral neuritis; were know to be pregnant or were breast feeding; had a history of psychiatric illness or alcoholism; or had any contraindication to any medications used in the study. Participants with no positive culture result at entry or rifampicin resistance before treatment were excluded postrandomization Completeness of follow‐up: 85% (participants included at modified intention‐to‐treat (ITT) analysis at 18 months) Baseline drug susceptibility test: initially isoniazid‐resistant isolates participants 11.2% (127/1132 with initial result), FDCs: 65 and single‐drug formulations: 62 HIV status of participants: reported (HIV positive N = 77) | |
| Interventions | 26‐week treatment regimen (8HRZE/18HR) Intensive phase (8 weeks of daily treatment) Intervention
Doses used: 2 tablets for participants weighing 30 to 37 kg, 3 tablets for participants weighing 38 to 54 kg, 4 tablets for participants weighing 55 to 70 kg, and 5 tablets for patients weighing > 70 kg Control:
Doses used For participants weighing 30 to 37 kg H: 1.5; R: 2; Z: 2, and E: 1.5 tablets Participants weighing 38 to 54 kg H: 2.5; R: 3; Z: 3, and E: 2 tablets Participants weighing 55 to 70 kg H: 3; R: 4; Z: 4, and E: 3 tablets Participants weighing > 70 kg H: 3.5; R: 5; Z: 5, and E: 3.5 tablets Continuation phase (18 weeks of 3 times weekly treatment):
Doses used: 2 tablets for participants weighing 30 to 37 kg, 3 tablets for participants weighing 38 to 54 kg, 4 tablets for participants weighing 55 to 70 kg, and 5 tablets for participants weighing >70 kg The trial authors stated: "Patients were required to attend the treatment facility daily during the initial phase (first 8 weeks) and then 3 times weekly during the continuation phase. Every treatment dose was to be taken under supervision of a member of the medical staff as DOT". | |
| Outcomes | Outcomes used in this review
Outcomes reported and not used in this review
| |
| Notes | Two publications for the same clinical trial (Lienhardt 2011; Nunn 2014). All outcomes were assessed according to the data provided in Lienhardt 2011. In Nunn 2014 the assessment was done at 30 months after initiation of treatment and is the most recent publication, but the results confirm those found in Lienhardt 2011 and the trial authors suggest that the follow‐up should be limited to 18 months after initiation of treatment in this kind of clinical trials Locations: Algeria, Bolivia, Colombia, Guinea, Mozambique, Nepal, Perú, Tanzania, and Vietnam Setting: "clinical trial sites" (different in each country) Source of funding: United States Agency for International Development Comments: follow‐up duration was 30 months after initiation of treatment. Participants were seen at the end of the second, third, fifth, and sixth month during treatment and then at 8, 10, 12, 15, 18, 24, and 30 months in the follow‐up phase. Adverse events was assess in each visit. Sputum sample was collected at each visit | |
| Risk of bias | ||
| Bias | Authors' judgement | Support for judgement |
| Random sequence generation (selection bias) | Low risk | Random allocations were computer generated. |
| Allocation concealment (selection bias) | Low risk | Sequentially numbered, opaque sealed envelopes were used. |
| Blinding of participants and personnel (performance bias) | Low risk | No blinding, but the outcome is unlikely to be influenced by lack of blinding (objective and measurable outcomes). |
| Blinding of outcome assessment (detection bias) | Low risk | No blinding of outcome assessment, but the outcome measurement is unlikely to be influenced by lack of blinding (objective and measurable outcomes). |
| Incomplete outcome data (attrition bias) | Low risk | Missing outcome data balanced in numbers across intervention groups, with similar reasons for missing data across groups. |
| Selective reporting (reporting bias) | High risk | Most primary and secondary outcomes were changed compared to the available protocol. |
| Other bias | Low risk | The trial appears to be free of other sources of bias. |
| Methods | Design: RCT Generation of allocation sequence: not stated Allocation concealment: not stated Blinding: not stated Duration: 1 year and 1 month (from August 2001 to September 2002) | |
| Participants | Number of participants: 40 randomized Males: 63.2% (per‐protocol population) Age range: 20 to 50 years Inclusion criteria: newly diagnosed pulmonary TB adults (aged 16 years or older) confirmed by sputum smear and culture; and freely consented to participate in the trial Exclusion criteria: presence of hepatic, renal, or hematological disorders that impose an individualization of dosage; presence of any type of ocular retro bulbar neuritis that may contraindicate ethambutol; pregnancy; presence of severe neuropsychiatric disorders, alcoholism, or other conditions that endanger the participant's life (cancer, HIV‐positive) and mean the participant is unlikely to complete the study; contacts of participants with TB with demonstrated resistant organisms; recurrences Completeness of follow‐up: 95% (ITT population) Baseline drug susceptibility test : initially drug resistant participants 0% (0/38 tested) HIV status of participants: not reported | |
| Interventions | 6 months treatment regimen (2HRZE/4HR) Intervention
Control
Doses used: not reported. Treatment was administered as DOT in both groups, daily and admitted to the hospital during the intensive phase and 3 times per week as outpatients during the continuation phase | |
| Outcomes | Outcomes used in this review
Outcomes reported and not used in this review
| |
| Notes | Location: Romania Setting: hospital Source of funding: not mentioned Comments: the follow‐up duration was 1 year after initiation of treatment. Time for assessment of reported outcomes was not informed | |
| Risk of bias | ||
| Bias | Authors' judgement | Support for judgement |
| Random sequence generation (selection bias) | Unclear risk | There was insufficient information about the random sequence generation process. |
| Allocation concealment (selection bias) | Unclear risk | There was insufficient information to permit a judgement of ‘low risk’ or ‘high risk’. |
| Blinding of participants and personnel (performance bias) | Low risk | Due to difficulties in blinding the participants and personnel to the intervention, when the study did not provide specification of blinding methods, we considered it an open design. In addition, the outcomes were unlikely to be influenced by lack of blinding (objective and measurable outcomes). |
| Blinding of outcome assessment (detection bias) | Low risk | No blinding of outcome assessment, but the outcome measurement is unlikely to be influenced by lack of blinding (objective and measurable outcomes). |
| Incomplete outcome data (attrition bias) | Low risk | We imputed missing data using appropriate methods. |
| Selective reporting (reporting bias) | Unclear risk | There was insufficient information to permit a judgement of ‘low risk’ or ‘high risk’. |
| Other bias | Low risk | The trial appears to be free of other sources of bias. |
| Methods | Design: RCT Generation of allocation: not stated Allocation concealment: serially numbered envelopes Blinding: not stated Duration: 1 year (from August 1986 to August 1987) | |
| Participants | Number of participants: 229 randomized Completeness of follow‐up: 91.7% of participants (ITT population) Baseline drug susceptibility test: initially drug resistant participants 16.2% (34/210 tested) (H: 26, R: 5, H&R: 3; FDCs: 19, and single‐drug formulations: 15) | |
| Interventions | 26‐week treatment regimen (8HRZ/18HR) Intervention
Doses used Intensive phase: 3 tablets for participants weighing 30 to 39.9 kg, 4 tablets for participants weighing 40 to 49.9 kg, and 5 tablets for participants weighing 50 to 60 kg Continuation phase: 3 tablets for participants weighing 30 to 39.9 kg, 3 tablets for participants weighing 40 to 49.9 kg and 4 tablets for participants weighing 50 to 60 kg Control:
Doses used (mg/kg): Intensive phase For participants weighing 30 to 39.9 kg H: 7.5 to 10; R: 11.2 to 15; Z: 18.8 to 25 Participants weighing 40 to 49.9 kg H: 6 to 7.5; R: 9 to 11.2; Z: 20 to 25 Participants weighing 50 to 60 kg H: 6.6 to 8; R: 10 to 12; Z: 20.8 to 25 Continuation phase For participants weighing 30 to 39.9 kg H: 7.5 to 10; R: 11.2 to 15 participants weighing 40 to 49.9 kg H: 6 to 7.5; R: 9 to 11.2 participants weighing 50 to 60 kg H: 6.6 to 8; R: 10 to 12 Treatment was daily and self‐administered for the whole therapy | |
| Outcomes | Outcomes used in this review
Outcomes reported and not used in this review
| |
| Notes | Locations: India Setting: "four centres" (2 hospital and 2 ambulatory centres) Source of funding: "Tata Pharma Indian Limited made available a free supply of Rifater, Rifinah, Ryrazinamide and Rifampicine" Comments: follow‐up duration was 26 weeks after completion of treatment. Culture conversion rate and participant compliance were measured at 8 and 26 weeks after treatment initiation. Compliance was assessed by delay in drug collection and surprise pill counting. Participants were expected to collect their drugs every fortnight during the intensive phase and every month during the continuation phase. Time of assessment for the other outcomes was not reported | |
| Risk of bias | ||
| Bias | Authors' judgement | Support for judgement |
| Random sequence generation (selection bias) | Unclear risk | There was insufficient information about the random sequence generation process to permit a judgement of ‘low risk’ or ‘high risk’. |
| Allocation concealment (selection bias) | Unclear risk | There was insufficient information to permit a judgement of ‘low risk’ or ‘high risk’. |
| Blinding of participants and personnel (performance bias) | Low risk | Due to difficulties in blinding the participants and personnel to the intervention, when the study did not provide specification of blinding methods we was considered it an open design. In addition, the outcomes were unlikely to be influenced by lack of blinding (objective and measurable outcomes). |
| Blinding of outcome assessment (detection bias) | Low risk | No blinding of outcome assessment, but outcome measurement is unlikely to be influenced by lack of blinding (objective and measurable outcomes). |
| Incomplete outcome data (attrition bias) | Unclear risk | There was insufficient reporting of attrition/exclusions to permit a judgement of ‘low risk’ or ‘high risk’ (reasons for missing data provided but not disaggregated). |
| Selective reporting (reporting bias) | Unclear risk | Insufficient information to permit judgement of ‘low risk’ or ‘high risk’. |
| Other bias | Low risk | The trial appears to be free of other sources of bias. |
| Methods | Design: RCT Generation of allocation sequence: "by the method of random numbers" Allocation concealment: not stated Blinding: not stated Duration: 2 years and 1 month (from October 1999 to November 2001) | |
| Participants | Number of participants: 387 randomized Males: 58.9% (ITT population) Inclusion criteria: newly diagnosed pulmonary TB adults, aged from 16 to 50 years Exclusion criteria: not reported Completeness of follow‐up: not reported Baseline drug susceptibility test: initially drug resistant participants 4.9% (19/387 randomized) HIV status of participants: not reported | |
| Interventions | Four months treatment regimen (4HRZE) Participants were randomly placed into 4 groups (groups 1 and 3 were intervention groups; and 2 and 4 control groups):
The mode of treatment administration was not reported for all participants, neither the frequency of treatment in control groups. The treatment was reported only for initial 4 months (intensive phase). The first and second groups were considered "patients with advanced pulmonary TB" and the third and fourth groups "patients with pulmonary TB of limited localised spread" | |
| Outcomes |
We did not use all reported outcomes in this Cochrane review because losses were not imputed according to the intervention or control groups | |
| Notes | Location: Russia Setting: clinic Souce of funding: not mentioned Comments: follow‐up duration was 4 months after initiation of treatment, the time for assessment of the reported outcomes | |
| Risk of bias | ||
| Bias | Authors' judgement | Support for judgement |
| Random sequence generation (selection bias) | Low risk | Random numbers method. |
| Allocation concealment (selection bias) | Unclear risk | There was insufficient information to permit a judgement of ‘low risk’ or ‘high risk'. |
| Blinding of participants and personnel (performance bias) | Low risk | Due to difficulties in blinding the participants and personnel to the intervention, when the study did not provide specification of blinding methods we considered it an open design. In addition, outcomes were unlikely to be influenced by a lack of blinding (objective and measurable outcomes). |
| Blinding of outcome assessment (detection bias) | Low risk | No blinding of outcome assessment, but outcome measurement was not likely to be influenced by lack of blinding (objective and measurable outcomes). |
| Incomplete outcome data (attrition bias) | High risk | The reason for missing outcome data is likely to be related to the true outcome. |
| Selective reporting (reporting bias) | High risk | The trial report fails to include results for a key outcome that would be expected to have been reported. |
| Other bias | Unclear risk | There was insufficient information to assess whether there was an important risk of bias. |
| Methods | Design: RCT Generation of allocation sequence: not stated Allocation concealment: not stated Blinding: not stated Duration: not mentioned | |
| Participants | Number of participants: 105 randomized Males: 88.6% (ITT population) Inclusion criteria: participants aged 18 years or more with active pulmonary TB, confirmed by sputum smear or culture or both, and with no history of previous TB treatment Exclusion criteria: not reported Completeness of follow‐up: 48.6% (ITT population) Baseline drug susceptibility test: initially drug resistant participants 23.5% (12/51 included in analysis); FDCs: 4 resistant to Z and single‐drug formulations: 2 resistant to E and 6 to Z HIV status of participants: not reported | |
| Interventions | Six months treatment regimen (2HRZE/4HRE) Intervention
Doses used Rifater: 3 tablets for participants weighing 30 to 39 kg, 4 tablets for participants weighing 40 to 49 kg, and 5 tablets for participants weighing ≥ 50 kg Rifinah: 3 tablets of Rifinah 150 for participants weighing < 50 kg, or 2 tablets of Rifinah 300 for participants weighing ≥50 kg The ethambutol dose was not reported Control
Doses used Isoniazid 300 mg, rifampicin 450 mg, pyrazinamide 1500 mg, and etambuthol 1200 mg for participants weighing < 50 kg during the first 2 months, followed by isoniazid 300 mg, rifampicin 450 mg, and etambuthol 800 mg for 4 months. The dosages for participants weighing ≥ 50 kg followed the same dosing schedule, except that rifampicin 600 mg was administered. For whole treatment, drugs were taken daily and self‐administered as outpatients | |
| Outcomes | Outcomes used in this review
Outcomes reported and not used in this review
| |
| Notes | Location: Taiwan Setting: hospital (outpatient clinic at chest department) Source of funding: not mentioned Comments: follow‐up duration was 12 months after completion of treatment. Sputum specimens were examined monthly during therapy and after 3, 6, and 12 months of completion of treatment. Adverse events were assessed monthly. Relapse was assessed after 3, 6, and 12 months of completion of treatment or any time relapse was suspected. Patient compliance was evaluated by losses and regimen changes during treatment | |
| Risk of bias | ||
| Bias | Authors' judgement | Support for judgement |
| Random sequence generation (selection bias) | Unclear risk | There was insufficient information about random sequence generation process to permit a judgement of ‘low risk’ or ‘high risk’. |
| Allocation concealment (selection bias) | Unclear risk | There was insufficient information to permit a judgement of ‘low risk’ or ‘high risk’. |
| Blinding of participants and personnel (performance bias) | Low risk | Due to difficulties in blinding the interventions for participants and personnel, when the study did not provide specification of blinding methods, we considered it an open design. In addition, the outcomes were unlikely to be influenced by lack of blinding (objective and measurable outcomes). |
| Blinding of outcome assessment (detection bias) | Low risk | No blinding of outcome assessment, but outcome measurement is unlikely to be influenced by lack of blinding (objective and measurable outcomes). |
| Incomplete outcome data (attrition bias) | Low risk | Missing outcome data balanced in numbers across intervention groups, with similar reasons for missing data across groups. |
| Selective reporting (reporting bias) | Low risk | The trial authors included most of the expected outcomes in the published report. |
| Other bias | Low risk | The trial appears to be free of other sources of bias. |
| Methods | Design: RCT Generation of allocation: not stated Allocation concealment: "alternate allocation of eligible patients to each regimen to obtain equal number for both groups" Blinding: not stated Duration: 2 years for Gravendeel 2003 (from 1999 to 2001) and 2 months for Suryanto 2008 (from December 2004 to January 2005) | |
| Participants | Number of participants: 434 randomized Males: 59.7% (ITT population) Mean age: 37.1 years (ITT population) Inclusion criteria: new smear‐positive TB participants with body weight between 33 and 50 kg and written informed consent form to participate in the trial Exclusion criteria: not reported Completeness of follow‐up: 63.1% (ITT population) Baseline drug susceptibility test: drug sensitivity test not performed (either at the beginning or during follow‐up) HIV status of participants: not reported | |
| Interventions | Five months treatment regimen (2HRZE/3HR) Intervention
Doses used Intensive phase: the average adult dose contained isoniazid 225 mg, rifampicin 450 mg, pyrazinamide 1200 mg, and ethambutol 825 mg Continuation phase: the averaged adult dose contained isoniazid 450 mg and rifampicin 450 mg Control:
Doses used Intensive phase: the average adult dose contained isoniazid 300 mg, rifampicin 450 mg, pyrazinamide 1500 mg, and ethambutol 750 mg Continuation phase: the average adult dose contained isoniazid 600 mg and rifampicin 450 mg Both FDCs and single‐drug formulations were given under direct supervision at health centres, once weekly during the intensive phase and fortnightly during the continuation phase. The remaining days, drugs were self‐administered at home. For all participants, the dose were adjusted to the body weight | |
| Outcomes | Outcomes used in this review
Outcomes reported and not used in this Cochrane review
| |
| Notes | Two publications for the same clinical trial (Gravendeel 2003; Suryanto 2008). All outcomes but 1 (sputum smear conversion) were recorded with data found in Suryanto 2008, because it was the most recent document. Sputum smear conversion (at 2 and 6 months) was available only in the preliminary report (Gravendeel 2003) Location: Republic of Indonesia Setting: "health centres" Source of funding: Royal Netherlands Tuberculosis Association Comments: follow‐up duration was not reported. Sputum smear conversion was examined at the beginning and at 2, 5, and 6 months from treatment initiation. Cured participants were followed up during 2004 to 2005 for relapse. The assessment for the other outcomes was not reported | |
| Risk of bias | ||
| Bias | Authors' judgement | Support for judgement |
| Random sequence generation (selection bias) | High risk | Judgement of personal or clinicians. |
| Allocation concealment (selection bias) | High risk | Alternate allocation of eligible participants. |
| Blinding of participants and personnel (performance bias) | Low risk | Due to difficulties in blinding the interventions for participants and personnel, when the study did not provide specification of blinding methods we considered it an open design. In addition, outcomes were unlikely to be influenced by lack of blinding (objective and measurable outcomes). |
| Blinding of outcome assessment (detection bias) | Low risk | No blinding of outcome assessment, but outcome measurement is unlikely to be influenced by lack of blinding (objective and measurable outcomes). |
| Incomplete outcome data (attrition bias) | High risk | Potentially inappropriate application of simple imputation. |
| Selective reporting (reporting bias) | High risk | The trial report fails to include results for a key outcome that would be expected to have been reported for such a trial. |
| Other bias | Low risk | The trial appears to be free of other sources of bias. |
| Methods | Design: RCT Generation of allocation: not stated Allocation concealment: not stated Blinding: not stated Duration: 3 years and 10 months (from October 1983 to August 1987) | |
| Participants | Number of participants: 310 randomized Males: 66% (of 179 participants with drug‐susceptible bacilli on admission) Inclusion criteria: participants aged 15 years or more who had been newly diagnosed for pulmonary TB, with sputum smear positive for acid‐fast bacilli and yielded M. tuberculosis on culture Exclusion criteria: not reported Completeness of follow‐up: 81% (ITT population) Baseline drug susceptibility test: initially drug resistant participants 5.5% (17/307 treated) HIV status of participants: not reported | |
| Interventions | Six months treatment regimen Intervention and control groups: Intensive phase:
The 3 regimens were given daily as FDCs or as separate formulations. Rifater (isoniazid 50 mg, rifampicin 120 mg, pyrazinamide 300 mg per tablet) was used as a FDC Doses used: Rifater
Regimens given as single‐drug formulations:
Streptomycin: 750 mg for the regimen 1 and 2 regardless of body weight Continuation phase: isoniazid and rifampin given 3 times a week as single‐drug formulation for both treatment groups (intervention and control) Doses used: Isoniazid:
Rifampicin: 2 capsules (600 mg) for all participants Treatment was given as DOT for the whole treatment | |
| Outcomes | Outcomes used in this review
Outcomes reported and not used in this review
| |
| Notes | Two publications of the same clinical trial (STS/BMRC 1991; Teo 1999). All outcomes were assessed according to the data provided in Teo 1999, because it is the most recent publication; except sputum conversion at 2 months and adverse events as these outcomes were available only in the preliminary report (STS/BMRC 1991). Location: Singapore Setting: medical clinic Source of funding: not mentioned Comments: follow‐up duration was 5 years after initiation of treatment. A clinician performed a clinical evaluation on admission and monthly up to 18 months, then once every 3 months up to 30 months, and once every 6 months up to 5 years from the date of admission to the study. Five sputum smears were examined bacteriologically (smear and culture) before treatment; thereafter 1 specimen was examined monthly during the first 6 months, then 2 specimens were examined once every month up to 18 months and at each follow‐up visit up to 60 months | |
| Risk of bias | ||
| Bias | Authors' judgement | Support for judgement |
| Random sequence generation (selection bias) | Unclear risk | There was insufficient information about random sequence generation process to permit a judgement of ‘low risk’ or ‘high risk’. |
| Allocation concealment (selection bias) | Unclear risk | There was insufficient information to permit a judgement of ‘low risk’ or ‘high risk'. |
| Blinding of participants and personnel (performance bias) | Low risk | Due to difficulties in blinding participants and personnel to the intervention, when the trial did not specify blinding methods we considered it an open design. In addition, outcomes were unlikely to be influenced by lack of blinding (objective and measurable outcomes). |
| Blinding of outcome assessment (detection bias) | Low risk | No blinding of outcome assessment, but outcome measurement is unlikely to be influenced by lack of blinding (objective and measurable outcomes). |
| Incomplete outcome data (attrition bias) | Low risk | The missing outcome data balanced in numbers across intervention groups with similar reasons for missing data. |
| Selective reporting (reporting bias) | Unclear risk | There was insufficient information to permit a judgement of 'low risk' or 'high risk'. |
| Other bias | Low risk | The trial appears to be free of other sources of bias. |
| Methods | Design: open RCT Generation of allocation: used a random number table Allocation concealment: unclear Blinding: none Duration: 1 year, from October 2008 to November 2009 | |
| Participants | Number of participants: 161 randomized Males: 67.7% of ITT population Inclusion criteria: participants aged 18 years and older with suspected pulmonary TB (at least 2 sputum specimens positive for acid‐fast bacilli on direct smear microscopy or 1 positive specimen and a chest X‐ray or chest computed tomography (CT) scan consistent with pulmonary TB), as determined by a clinician Exclusion criteria: participants with a history of receiving anti‐TB treatment, had a life expectancy of < 6 months, had abnormal baseline liver function (alanine aminotransferase or aspartate aminotransferase values > 3 times the upper limit of normal or total bilirubin values > 2 mg/dL, or both), or had received immunosuppressive treatment Completeness of follow‐up: 60.9% (ITT population) Baseline drug susceptibility test: initially drug resistant participants 3.1% (5/161 randomized participants) HIV status of participants: not reported | |
| Interventions | Six months treatment regimen (2HRZE/4HRE) Intervention
Doses used: Rifater: 3 tablets for participants weighing 30 to 39 kg, 4 tablets for participants weighing 40 to 49 kg, and 5 tablets for participants weighing ≥ 50 kg Rifinah: 3 tablets of Rifinah 150 for participants weighing < 50 kg or 2 tablets of Rifinah 300 for participants weighing ≥ 50 kg The ethambutol dose was not reported Control:
Doses used: not reported. For whole treatment, drugs were taken daily. Treatment was given as directly‐observed treatments during work‐week and self‐administered during weekends. The trial authors state: "a trained supervisor observed the participant during medication administration 5 days/week, whereas weekend doses were self‐administered. However, treatment intake was still checked by the supervisor by unplanned visits to participants’ homes and by pill counting" | |
| Outcomes | Outcomes used in this review
Outcomes reported and not used in this review
| |
| Notes | Location: Taiwan Setting: hospital Source of funding: by a grant (EDAHP99037) from E‐DA hospital/I‐Shou University, Kaohsiung, Taiwan Comments: follow‐up duration was 1 year after treatment completion. Sputum was collected from the participants at 2 and 4 months of treatment and at the end of treatment. Adverse effects were assessed at each visit during the first and second weeks of the first month of treatment and were then assessed monthly over the next 4 months. Relapse was assessed at the end of follow‐up | |
| Risk of bias | ||
| Bias | Authors' judgement | Support for judgement |
| Random sequence generation (selection bias) | Low risk | Using a random number table. |
| Allocation concealment (selection bias) | Unclear risk | There was insufficient information to permit a judgment of ‘low risk’ or ‘high risk’. |
| Blinding of participants and personnel (performance bias) | Low risk | No blinding, but the outcomes were unlikely to be influenced by a lack of blinding (objective and measurable outcomes). |
| Blinding of outcome assessment (detection bias) | Low risk | No blinding of outcome assessment, but the outcome measurement is unlikely to be influenced by lack of blinding (objective and measurable outcomes). |
| Incomplete outcome data (attrition bias) | High risk | All missing data were not reported. |
| Selective reporting (reporting bias) | Unclear risk | There was insufficient information to permit a judgement of ‘low risk’ or ‘high risk’. |
| Other bias | Low risk | The trial appears to be free of other sources of bias. |
| Methods | Design: RCT Generation of allocation sequence: unclear Allocation concealment: unclear Blinding: not stated Duration: not mentioned | |
| Participants | Number of participants: 293 randomized Males: 63.8% (ITT population) Inclusion criteria: participants aged between 15 to 55 years with sputum positive pulmonary TB, who gave consent to participate Exclusion criteria: participants with renal, hepatic, diabetic, and cardiac problems, and pregnancy Completeness of follow‐up: 70% (ITT population) Baseline drug susceptibility test: results not reported HIV status of participants: not reported | |
| Interventions | Six months treatment regimen (2HRZE/4HRE): participants were randomly selected into 3 groups (A, B, and C) Intervention (groups A and B): 1. Group A (N = 97) Intensive phase: 4FDCs (isoniazid 75 mg, rifampicin 120 mg, pyrazinamide 350 mg, and ethambutol 250 mg per tablet) Doses used: 4 tablets for participants weighing < 50 kg and 5 tablets for participants weighing > 50 kg Continuation phase: 3FDCs (isoniazid 100 mg, rifampicin 150 mg, and ethambutol 300 mg per tablet) Doses used: 3 tablets for participants weighing < 50 kg and 4 tablets for participants weighing > 50 kg 2. Group B (N = 97) Intensive phase: 4FDCs (isoniazid 60 mg, rifampicin 120 mg, pyrazinamide 300 mg, and ethambutol 225 mg per tablet) Doses used: 4 tablets for participants weighing < 50 kg and 5 tablets for participants weighing > 50 kg Continuation phase: 3FDCs (isoniazid 75 mg, rifampicin 150 mg, and ethambutol 300 mg per tablet) Doses used: 3 tablets for participants weighing < 50 kg and 4 tablets for participants weighing > 50 kg Control group:
Intensive phase Isoniazid 100 mg, rifampicin (150 mg and 450 mg capsules), pyrazinamide 500 mg, and ethambutol 400 mg Doses used: Participants weighing < 50 kg: isoniazid 3 tablets, rifampicin (450 mg) 1 capsule, pyrazinamide 3 tablets, and ethambutol 3 tablets Participants weighing > 50 kg: isoniazid 4 tablets, rifampicin 1 capsule 450 mg, + 1 capsule 150 mg, pirazinamide 4 tablets and ethambutol 4 tablets Continuation phase Isoniazid 100 mg, rifampicin (150 mg and 450 mg capsules) and ethambutol 400 mg Doses used: Participants weighing < 50 kg: isoniazid 3 tablets, rifampicin (450 mg) 1 capsule and ethambutol 3 tablets Participants weighing > 50 kg: isoniazid 4 tablets, rifampicin 1 capsule 450 mg + 1 capsule 150 mg, and ethambutol 4 tablets In all groups, treatment was administered daily, by DOT at the hospital for 2 months (during the intensive phase) and self‐administered at home for 4 months (during the continuation phase) | |
| Outcomes | Outcomes used in this review
Outcomes reported and not used in this review
| |
| Notes | Location: Pakistan Setting: hospital Source of funding: not mentioned Comments: follow‐up duration was 6 months after treatment completion. Time for assessment of reported outcomes was not clearly informed. During the intensive phase participants were admitted to the hospital and during the continuation phase they self‐administered the treatment at home and returned to the hospital once a month for check‐up | |
| Risk of bias | ||
| Bias | Authors' judgement | Support for judgement |
| Random sequence generation (selection bias) | Low risk | Drawing of lots. |
| Allocation concealment (selection bias) | High risk | Assignment envelopes were used without appropriate safeguards ("sealed envelopes with group name in a bag from which the patient chose an envelope"). |
| Blinding of participants and personnel (performance bias) | Low risk | Due to difficulties in blinding the participants and personnel to the intervention, when the study did not specify the blinding methods, we considered it an open design. In addition, the outcomes were unlikely to be influenced by a lack of blinding (objective and measurable outcomes). |
| Blinding of outcome assessment (detection bias) | Low risk | No blinding of outcome assessment, but outcome measurement was unlikely to be influenced by lack of blinding (objective and measurable outcomes). |
| Incomplete outcome data (attrition bias) | Low risk | No missing outcome data. |
| Selective reporting (reporting bias) | Unclear risk | There was insufficient information to permit a judgement of ‘low risk’ or ‘high risk’. |
| Other bias | Low risk | The trial appears to be free of other sources of bias. |
| Methods | Desing: RCT Generation of allocation: referring to a random number table Allocation concealment: not stated Blinding: not stated Duration: not mentioned | |
| Participants | Number of participants: 209 randomized Males: 64.4% (per‐protocol population) Inclusion criteria: newly diagnosed uncomplicated pulmonary TB adults (aged 15 or more) with sputum positive by both smear and culture Exclusion criteria: participants with extrapulmonary or miliary TB, severe impairment of hepatic or renal function, malignancy, a history of eye disease or hematologic problems, or gout; if they were pregnant, if they had taken corticosteroids or other immunosuppressive drugs; or if they had any other conditions that would introduce risk during chemotherapy Completeness of follow‐up: 98% (ITT population) Baseline drug susceptibility test: initially drug resistant participants 7.7% (13/169 tested). FDCs: 2 S, 2 H, 2 S+H, 1 S+H+R and single‐drug formulations: 1 S, 2 H, 1 R, 1 S+H, 1 S+E+R HIV status of participants: not reported | |
| Interventions | Six months treatment regimen (2HRZ/4HR): Intervention
Doses used Intensive phase: 3 tablets for participants weighing 30 to 39 kg, 4 tablets for participants weighing 40 to 49 kg, 5 tablets for participants weighing ≥ 50 kg Continuation phase: 3 tablets of Rifinah contained isoniazid 100 mg for participants weighing < 50 kg and 2 tablets of Rifinah contained isoniazid 150 mg for participants weighing ≥ 50 kg Control:
Doses used Intensive phase: participants weighing < 50 kg: 3 isoniazid 100 mg tablets, 3 rifampicin 150 mg tablets, and 6 pirazinamide 250 mg tablets Continuation phase: participants weighing < 50 kg: 3 isoniazid 100 mg tablets and 3 rifampicin 150 mg tablets; participants weighing ≥ 50 kg followed the same dosing schedule for intensive, with exception that 4 rifampicin 150 mg rather than 3 All drugs were administered daily by DOT under "supervision of a health care provider" and participants were kept at hospital for both treatment groups | |
| Outcomes | Outcomes used in this review
Outcomes reported and not used in this review
| |
| Notes | Location: urban districts and rural areas of Biijing, China Setting: hospital Source of funding: Hoechst Marion Roussel, Singapore Comments: follow‐up duration was 2 years after completion of treatment. During the 6 months of treatment, sputum smears were examined each month and cultures were examined at 2, 4, and 6 months. participants who had completed treatment and who had sputum conversion from positive to negative were followed with sputum smear at 3, 6, 9, 12, 15, and 24 months. Sputum cultures were tested at 6, 12, 18, and 24 months | |
| Risk of bias | ||
| Bias | Authors' judgement | Support for judgement |
| Random sequence generation (selection bias) | Low risk | Referred to a random number table. |
| Allocation concealment (selection bias) | Unclear risk | There was insufficient information to permit a judgement of ‘low risk’ or ‘high risk’. |
| Blinding of participants and personnel (performance bias) | Low risk | Due to difficulties in blinding the participants and personnel, when the study did not specify blinding methods we considered it an open design. In addition, the outcomes were unlikely to be influenced by a lack of blinding (objective and measurable outcomes). |
| Blinding of outcome assessment (detection bias) | Low risk | There was no blinding of outcome assessment, but outcome measurement was unlikely to be influenced by a lack of blinding (objective and measurable outcomes). |
| Incomplete outcome data (attrition bias) | Low risk | There were few missing data from both treatment groups and the reasons of losses were reported. |
| Selective reporting (reporting bias) | Unclear risk | There was insufficient information to permit a judgement of 'low risk' or 'high risk'. |
| Other bias | Low risk | The trial appears to be free of other sources of bias. |
| Methods | Design: RCT Generation of allocation: not stated Allocation concealment: not stated (with ratio of 2:1 in treatment and control groups) Blinding: not stated Duration: not mentioned | |
| Participants | Number of participants: 348 randomized Completeness of follow‐up: 88.5% (ITT population) Baseline drug susceptibility test: initially drug resistant participants 14% (43/308 included in analysis). FDCs: 5 S, 13 H, 7 R, 6 H+R, 1 S+E, 3 S+H and single‐drug formulations: 1 S, 2 H, 2 R, 3 H+R HIV status of participants: not reported | |
| Interventions | Six months treatment regimen (2HRZ/4HR) Intervention
Doses used:
Control
Doses used
In both cases (FDCs and single‐drug formulations), drugs were administered daily, except pyracinamide during the intensive phase as separated formulation given 3 times a day. There were 3 kinds of treatment management (whole‐course hospitalization; outpatients treatment during the entire treatment course and hospitalization only during intensive phase), combined with 3 supervision models respectively (supervision by medical staff; supervision by non‐medical staff who had been trained by the medical staff (relatives, colleagues) and supervision by medical staff in the intensive phase but non‐medical staff in the continuation phase). Treatment and supervision was established according to participants economic status | |
| Outcomes | Outcomes used in this review
Outcomes reported and not used in this review
| |
| Notes | Location: China Trial setting: hospital Source of funding: not mentioned Comments: follow‐up duration was to the EOT. Sputum smear and culture were examined each month during the 6 months of treatment. X‐ray was taken at 2 months and at EOT. Blood and urine tests were done every month, as for hepatic and renal function | |
| Risk of bias | ||
| Bias | Authors' judgement | Support for judgement |
| Random sequence generation (selection bias) | Unclear risk | There was insufficient information about random sequence generation process to permit a judgment of ‘low risk’ or ‘high risk’. |
| Allocation concealment (selection bias) | Unclear risk | There was insufficient information to permit a judgement of ‘low risk’ or ‘high risk'. |
| Blinding of participants and personnel (performance bias) | Low risk | Due to difficulties in blinding the interventions for participants and personnel, when the trial did not provide specification of blinding methods, we considered it to be an open design. In addition, we judged that the outcomes were unlikely to have been influenced by lack of blinding (objective and measurable outcomes). |
| Blinding of outcome assessment (detection bias) | Low risk | No blinding of outcome assessment, but the outcome measurement was unlikely to have been influenced by lack of blinding (objective and measurable outcomes). |
| Incomplete outcome data (attrition bias) | High risk | Potentially inappropriate application of simple imputation. |
| Selective reporting (reporting bias) | Unclear risk | Insufficient information to permit judgement of ‘low risk’ or ‘high risk’. |
| Other bias | Low risk | The trial appears to be free of other sources of bias. |
Abbreviations: RCT: randomized controlled trial; TB: tuberculosis; AFB: acid‐fast bacilli; kg: kilograms of body weight; HIV: human immunodeficiency virus; FDCs: fixed‐dose combinations; H: isoniazid; R: rifampicin; Z: pyrazinamide; E: ethambutol; mg: milligrams; WHO: World Health Organization; ITT: intention‐to‐treat; S: streptomycin; DOT: directly observed treatment; USA: United States of America; SD: standard deviation; EOT: end of treatment.
Characteristics of excluded studies [ordered by study ID]
Jump to:
| Study | Reason for exclusion |
| Controlled clinical trial that compared FDCs versus single‐drug formulations for pulmonary TB, but with 2 different treatment regimens in intervention and control groups. | |
| RCT that compared FDCs versus single‐drug formulations for pulmonary TB, but with 2 different treatment regimens in intervention and control groups. | |
| RCT that compared 2 FDCs: Chinese fixed‐dose compounds (2FEISU/4FEINING regimen) with 2RIFANAH/4RIFINAH regimen for new smear positive pulmonary TB participants, presented as an abstract for the 9th Congress of the Asian Pacific Society of Respirology 10–13 December 2004, Hong Kong. Complete data were unavailable. | |
| RCT that compared FDCs versus single‐drug formulations for pulmonary TB, but with 2 different treatment regimens in intervention and control groups. | |
| RCT that compared 2 different regimens of treatment for pulmonary TB administered as single‐drug formulations. | |
| Descriptive study of use of 4FDCs tablets for pulmonary TB. | |
| RCT that compared FDCs versus single‐drug formulations for pulmonary TB, but with 2 different treatment regimens in intervention and control groups. | |
| RCT that compared 2 different regimens for pulmonary TB. | |
| RCT that compared FDCs versus single‐drug formulations for pulmonary TB, and was presented as a poster in the 12th Congress of the Asian Pacific Society of Respirology. Completed data were unavailable. | |
| RCT that compared FDCs versus single‐drug formulations for pulmonary TB, but also included TB participants that were already treated. | |
| RCT that met the inclusion criteria of this Cochrane review according to published protocol, but is not yet published. Data were unavailable. | |
| Controlled clinical trial that compared FDCs versus single‐drug formulations for pulmonary TB, but had 2 different treatment regimens in intervention and control groups. | |
| Descriptive study of methodological issue of unpublished RCTs (registration: ClinicalTrial.gov database: NCT00216385). Compared 4FDCs tablets versus 3FDCs + Gatifloxacin for pulmonary TB. | |
| RCT that compared different treatment regimens (2Rifater/4Rifinah versus 2Rifater+E/6H+Thiacetazone) for untreated, sputum positive pulmonary TB. | |
| RCT that compared FDCs versus single‐drug formulations for pulmonary TB, and was presented as a poster in the 12th Congress of the Asian Pacific Society of Respirology. Completed data were unavailable. | |
| Study compared FDCs versus single‐drug formulations for pulmonary TB. It is unclear whether or not this is a clinical trial, as there is no mention of allocation or randomization. | |
| RCT that compared FDCs versus single‐drug formulations, but with 2 different treatment regimens in intervention and control groups. |
Abbreviations: FDCs: fixed‐dose combinations; TB: tuberculosis; RCT: randomized controlled trial.
Characteristics of studies awaiting assessment [ordered by study ID]
Jump to:
| Methods | Randomized controlled trial (RCT) |
| Participants | Unknown |
| Interventions | Fixed‐dose combinations (FDCs) versus "Plate‐type combined drug" |
| Outcomes | Unknown |
| Notes | We identified this study through other sources, not through database searches. We did not find the Chinese article. |
| Methods | RCT |
| Participants | Unknown |
| Interventions | FDCs versus "Plate‐type combined drug" |
| Outcomes | Unknown |
| Notes | We identified this study through other sources, not through database searches. We did not find the Chinese article. |
| Methods | RCT |
| Participants | Unknown |
| Interventions | FDCs versus single‐drug formulations |
| Outcomes | Unknown |
| Notes | We identified this study through other sources, not through database searches. We did not find the Chinese article. |
| Methods | RCT |
| Participants | Unknown |
| Interventions | FDCs versus single‐drug formulations |
| Outcomes | Unknown |
| Notes | We identified this study through other sources, not through database searches. We did not find the Chinese article. |
Abbreviations: RCT: randomized controlled trial; FDCs: fixed‐dose combinations.
Data and analyses
| Outcome or subgroup title | No. of studies | No. of participants | Statistical method | Effect size |
| 1 Treatment failure Show forest plot | 7 | 3606 | Risk Ratio (M‐H, Fixed, 95% CI) | 1.28 [0.82, 2.00] |
| Analysis 1.1  Comparison 1 Fixed‐dose combinations versus single‐drug formulations as available data, Outcome 1 Treatment failure. | ||||
| 2 Relapse Show forest plot | 10 | 3621 | Risk Ratio (M‐H, Fixed, 95% CI) | 1.28 [1.00, 1.64] |
| Analysis 1.2  Comparison 1 Fixed‐dose combinations versus single‐drug formulations as available data, Outcome 2 Relapse. | ||||
| 3 Death Show forest plot | 11 | 4800 | Risk Ratio (M‐H, Fixed, 95% CI) | 0.96 [0.67, 1.39] |
| Analysis 1.3 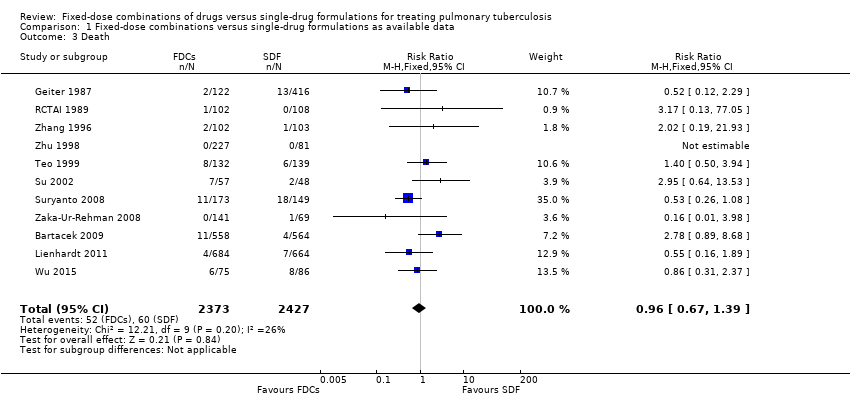 Comparison 1 Fixed‐dose combinations versus single‐drug formulations as available data, Outcome 3 Death. | ||||
| 4 Sputum smear or culture conversion at 2 months of starting treatment Show forest plot | 13 | 4836 | Risk Ratio (M‐H, Fixed, 95% CI) | 1.01 [0.99, 1.03] |
| Analysis 1.4 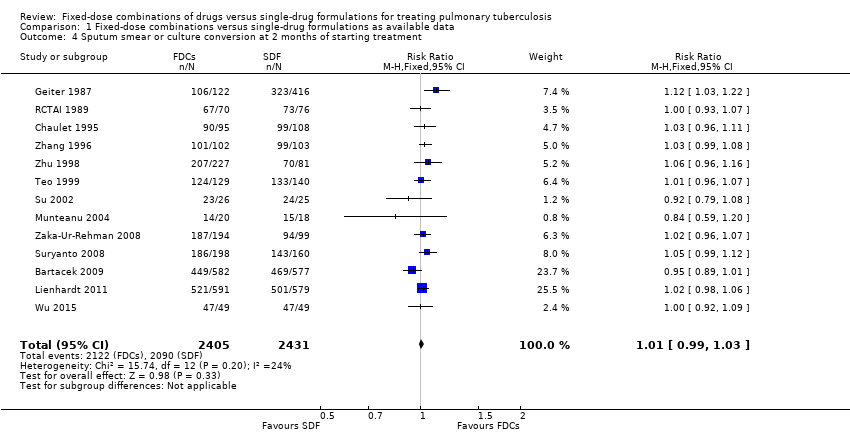 Comparison 1 Fixed‐dose combinations versus single‐drug formulations as available data, Outcome 4 Sputum smear or culture conversion at 2 months of starting treatment. | ||||
| 5 Sputum smear or culture conversion at end of treatment (EOT) Show forest plot | 7 | 2319 | Risk Ratio (M‐H, Fixed, 95% CI) | 0.99 [0.96, 1.02] |
| Analysis 1.5 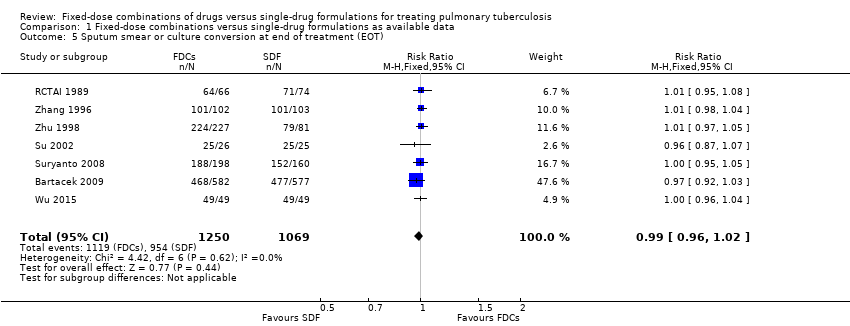 Comparison 1 Fixed‐dose combinations versus single‐drug formulations as available data, Outcome 5 Sputum smear or culture conversion at end of treatment (EOT). | ||||
| 6 Treatment adherence at 8 weeks of starting treatment Show forest plot | 3 | 881 | Risk Ratio (M‐H, Random, 95% CI) | 1.04 [0.96, 1.12] |
| Analysis 1.6  Comparison 1 Fixed‐dose combinations versus single‐drug formulations as available data, Outcome 6 Treatment adherence at 8 weeks of starting treatment. | ||||
| 7 Treatment adherence at EOT Show forest plot | 5 | 1229 | Risk Ratio (M‐H, Fixed, 95% CI) | 1.01 [0.97, 1.06] |
| Analysis 1.7  Comparison 1 Fixed‐dose combinations versus single‐drug formulations as available data, Outcome 7 Treatment adherence at EOT. | ||||
| 8 Acquisition of drug resistance Show forest plot | 3 | 491 | Risk Ratio (M‐H, Fixed, 95% CI) | 0.76 [0.15, 3.77] |
| Analysis 1.8  Comparison 1 Fixed‐dose combinations versus single‐drug formulations as available data, Outcome 8 Acquisition of drug resistance. | ||||
| 9 Patient satisfaction Show forest plot | 2 | Risk Ratio (M‐H, Fixed, 95% CI) | Subtotals only | |
| Analysis 1.9  Comparison 1 Fixed‐dose combinations versus single‐drug formulations as available data, Outcome 9 Patient satisfaction. | ||||
| 9.1 General satisfaction | 1 | 222 | Risk Ratio (M‐H, Fixed, 95% CI) | 1.04 [0.97, 1.12] |
| 9.2 No problems on swallowing | 1 | 1023 | Risk Ratio (M‐H, Fixed, 95% CI) | 1.03 [1.00, 1.06] |
| 9.3 Convenient number of tablets | 1 | 1045 | Risk Ratio (M‐H, Fixed, 95% CI) | 1.50 [1.37, 1.64] |
| 9.4 Acceptable taste | 1 | 1044 | Risk Ratio (M‐H, Fixed, 95% CI) | 1.39 [1.27, 1.51] |
| 10 Serious adverse events Show forest plot | 6 | 3388 | Risk Ratio (M‐H, Fixed, 95% CI) | 1.45 [0.90, 2.33] |
| Analysis 1.10  Comparison 1 Fixed‐dose combinations versus single‐drug formulations as available data, Outcome 10 Serious adverse events. | ||||
| 11 Adverse events leading to discontinuation of therapy Show forest plot | 13 | 5530 | Risk Ratio (M‐H, Random, 95% CI) | 0.96 [0.56, 1.66] |
| Analysis 1.11  Comparison 1 Fixed‐dose combinations versus single‐drug formulations as available data, Outcome 11 Adverse events leading to discontinuation of therapy. | ||||
| 12 Other adverse events Show forest plot | 9 | 4639 | Risk Ratio (M‐H, Fixed, 95% CI) | 0.85 [0.72, 1.00] |
| Analysis 1.12  Comparison 1 Fixed‐dose combinations versus single‐drug formulations as available data, Outcome 12 Other adverse events. | ||||
| Outcome or subgroup title | No. of studies | No. of participants | Statistical method | Effect size |
| 1 Treatment failure Show forest plot | 7 | 3606 | Risk Ratio (M‐H, Fixed, 95% CI) | 1.28 [0.82, 2.00] |
| Analysis 2.1  Comparison 2 Fixed‐dose combinations versus single‐drug formulations as available data: sensitivity analysis by risk of bias, Outcome 1 Treatment failure. | ||||
| 1.1 High or unclear risk of selection bias | 5 | 1099 | Risk Ratio (M‐H, Fixed, 95% CI) | 1.77 [0.67, 4.69] |
| 1.2 Low risk of selection bias | 2 | 2507 | Risk Ratio (M‐H, Fixed, 95% CI) | 1.17 [0.70, 1.93] |
| 2 Relapse Show forest plot | 10 | 3621 | Risk Ratio (M‐H, Fixed, 95% CI) | 1.28 [1.00, 1.64] |
| Analysis 2.2  Comparison 2 Fixed‐dose combinations versus single‐drug formulations as available data: sensitivity analysis by risk of bias, Outcome 2 Relapse. | ||||
| 2.1 High or unclear risk of selection bias | 8 | 1328 | Risk Ratio (M‐H, Fixed, 95% CI) | 2.84 [1.34, 6.00] |
| 2.2 Low risk of selection bias | 2 | 2293 | Risk Ratio (M‐H, Fixed, 95% CI) | 1.12 [0.86, 1.46] |
| 3 Death Show forest plot | 11 | 4800 | Risk Ratio (M‐H, Fixed, 95% CI) | 0.96 [0.67, 1.39] |
| Analysis 2.3 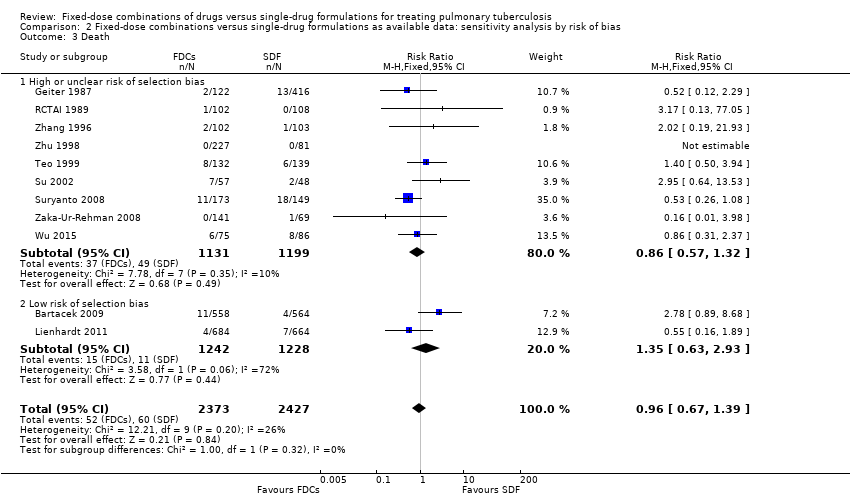 Comparison 2 Fixed‐dose combinations versus single‐drug formulations as available data: sensitivity analysis by risk of bias, Outcome 3 Death. | ||||
| 3.1 High or unclear risk of selection bias | 9 | 2330 | Risk Ratio (M‐H, Fixed, 95% CI) | 0.86 [0.57, 1.32] |
| 3.2 Low risk of selection bias | 2 | 2470 | Risk Ratio (M‐H, Fixed, 95% CI) | 1.35 [0.63, 2.93] |
| 4 Sputum smear or culture conversion at 2 months of starting treatment Show forest plot | 13 | 4836 | Risk Ratio (M‐H, Fixed, 95% CI) | 1.01 [0.99, 1.03] |
| Analysis 2.4 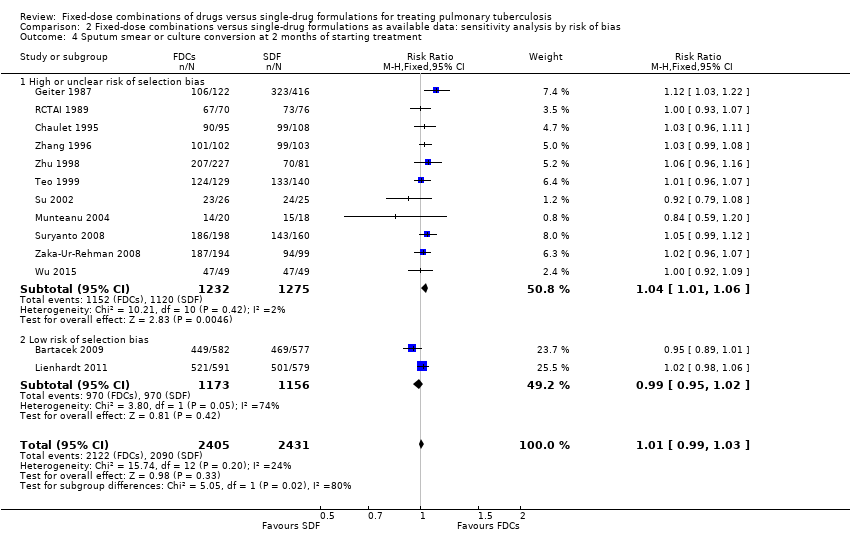 Comparison 2 Fixed‐dose combinations versus single‐drug formulations as available data: sensitivity analysis by risk of bias, Outcome 4 Sputum smear or culture conversion at 2 months of starting treatment. | ||||
| 4.1 High or unclear risk of selection bias | 11 | 2507 | Risk Ratio (M‐H, Fixed, 95% CI) | 1.04 [1.01, 1.06] |
| 4.2 Low risk of selection bias | 2 | 2329 | Risk Ratio (M‐H, Fixed, 95% CI) | 0.99 [0.95, 1.02] |
| 5 Sputum smear or culture conversion at EOT Show forest plot | 7 | 2319 | Risk Ratio (M‐H, Fixed, 95% CI) | 0.99 [0.96, 1.02] |
| Analysis 2.5  Comparison 2 Fixed‐dose combinations versus single‐drug formulations as available data: sensitivity analysis by risk of bias, Outcome 5 Sputum smear or culture conversion at EOT. | ||||
| 5.1 High or unclear risk of selection bias | 6 | 1160 | Risk Ratio (M‐H, Fixed, 95% CI) | 1.00 [0.98, 1.03] |
| 5.2 Low risk of selection bias | 1 | 1159 | Risk Ratio (M‐H, Fixed, 95% CI) | 0.97 [0.92, 1.03] |
| 6 Acquisition of drug resistance Show forest plot | 3 | 491 | Risk Ratio (M‐H, Fixed, 95% CI) | 0.76 [0.15, 3.77] |
| Analysis 2.6 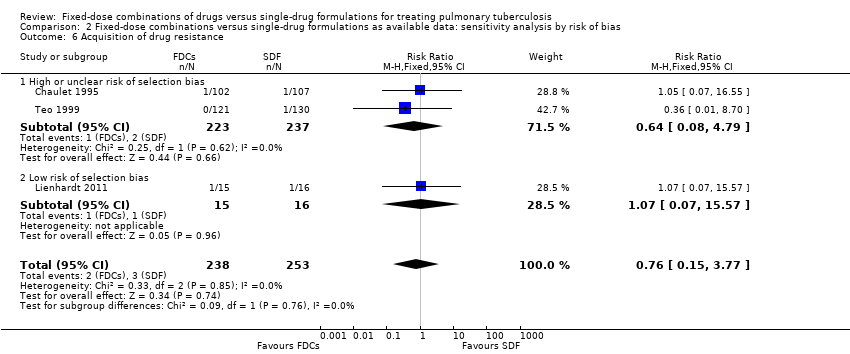 Comparison 2 Fixed‐dose combinations versus single‐drug formulations as available data: sensitivity analysis by risk of bias, Outcome 6 Acquisition of drug resistance. | ||||
| 6.1 High or unclear risk of selection bias | 2 | 460 | Risk Ratio (M‐H, Fixed, 95% CI) | 0.64 [0.08, 4.79] |
| 6.2 Low risk of selection bias | 1 | 31 | Risk Ratio (M‐H, Fixed, 95% CI) | 1.07 [0.07, 15.57] |
| 7 Serious adverse events Show forest plot | 6 | 3388 | Risk Ratio (M‐H, Fixed, 95% CI) | 1.45 [0.90, 2.33] |
| Analysis 2.7  Comparison 2 Fixed‐dose combinations versus single‐drug formulations as available data: sensitivity analysis by risk of bias, Outcome 7 Serious adverse events. | ||||
| 7.1 High or unclear risk of selection bias | 4 | 685 | Risk Ratio (M‐H, Fixed, 95% CI) | 1.47 [0.46, 4.71] |
| 7.2 Low risk of selection bias | 2 | 2703 | Risk Ratio (M‐H, Fixed, 95% CI) | 1.44 [0.86, 2.44] |
| 8 Adverse events leading to discontinuation of therapy Show forest plot | 13 | 5530 | Risk Ratio (M‐H, Random, 95% CI) | 0.96 [0.56, 1.66] |
| Analysis 2.8  Comparison 2 Fixed‐dose combinations versus single‐drug formulations as available data: sensitivity analysis by risk of bias, Outcome 8 Adverse events leading to discontinuation of therapy. | ||||
| 8.1 High or unclear risk of selection bias | 11 | 2827 | Risk Ratio (M‐H, Random, 95% CI) | 0.67 [0.31, 1.43] |
| 8.2 Low risk of selection bias | 2 | 2703 | Risk Ratio (M‐H, Random, 95% CI) | 1.71 [1.04, 2.81] |
| 9 Other adverse events Show forest plot | 9 | 4639 | Risk Ratio (M‐H, Fixed, 95% CI) | 0.85 [0.72, 1.00] |
| Analysis 2.9 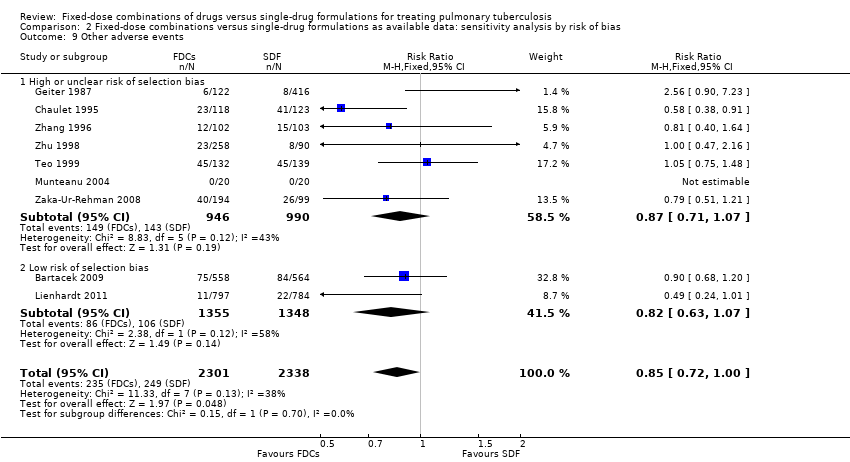 Comparison 2 Fixed‐dose combinations versus single‐drug formulations as available data: sensitivity analysis by risk of bias, Outcome 9 Other adverse events. | ||||
| 9.1 High or unclear risk of selection bias | 7 | 1936 | Risk Ratio (M‐H, Fixed, 95% CI) | 0.87 [0.71, 1.07] |
| 9.2 Low risk of selection bias | 2 | 2703 | Risk Ratio (M‐H, Fixed, 95% CI) | 0.82 [0.63, 1.07] |
| Outcome or subgroup title | No. of studies | No. of participants | Statistical method | Effect size |
| 1 Treatment failure (ITT analysis and all losses to follow‐up judged as failure) Show forest plot | 7 | 4004 | Risk Ratio (M‐H, Fixed, 95% CI) | 1.03 [0.93, 1.14] |
| Analysis 3.1  Comparison 3 Fixed‐dose combinations versus single‐drug formulations: sensitivity analysis by intention‐to‐treat (ITT), Outcome 1 Treatment failure (ITT analysis and all losses to follow‐up judged as failure). | ||||
| 2 Relapse (ITT analysis and all losses to follow‐up judged as relapse) Show forest plot | 10 | 4716 | Risk Ratio (M‐H, Fixed, 95% CI) | 1.05 [0.95, 1.16] |
| Analysis 3.2 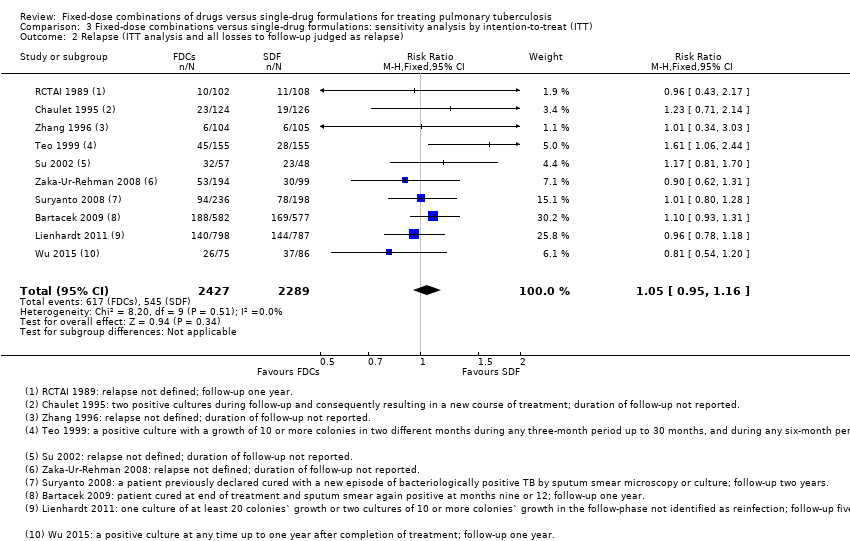 Comparison 3 Fixed‐dose combinations versus single‐drug formulations: sensitivity analysis by intention‐to‐treat (ITT), Outcome 2 Relapse (ITT analysis and all losses to follow‐up judged as relapse). | ||||
| 3 Sputum smear or culture conversion at 2 months of starting treatment (ITT analysis and all losses to follow‐up judged as conversion failure) Show forest plot | 13 | 5731 | Risk Ratio (M‐H, Fixed, 95% CI) | 1.00 [0.97, 1.03] |
| Analysis 3.3  Comparison 3 Fixed‐dose combinations versus single‐drug formulations: sensitivity analysis by intention‐to‐treat (ITT), Outcome 3 Sputum smear or culture conversion at 2 months of starting treatment (ITT analysis and all losses to follow‐up judged as conversion failure). | ||||
| 4 Sputum smear or culture conversion at EOT (ITT analysis and all losses to follow‐up judged as conversion failure) Show forest plot | 7 | 2552 | Risk Ratio (M‐H, Fixed, 95% CI) | 0.99 [0.95, 1.02] |
| Analysis 3.4 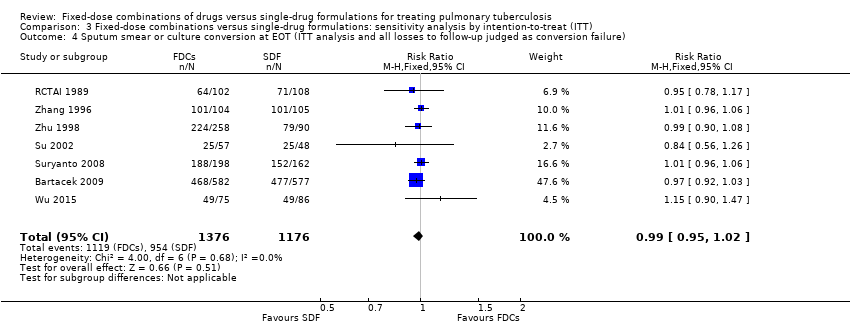 Comparison 3 Fixed‐dose combinations versus single‐drug formulations: sensitivity analysis by intention‐to‐treat (ITT), Outcome 4 Sputum smear or culture conversion at EOT (ITT analysis and all losses to follow‐up judged as conversion failure). | ||||
| Outcome or subgroup title | No. of studies | No. of participants | Statistical method | Effect size |
| 1 Treatment failure Show forest plot | 7 | 3606 | Risk Ratio (M‐H, Fixed, 95% CI) | 1.28 [0.82, 2.00] |
| Analysis 4.1 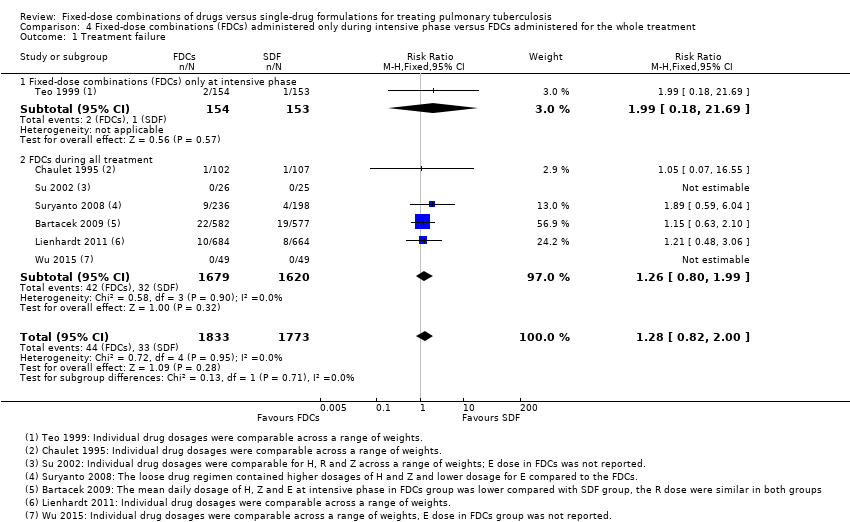 Comparison 4 Fixed‐dose combinations (FDCs) administered only during intensive phase versus FDCs administered for the whole treatment, Outcome 1 Treatment failure. | ||||
| 1.1 Fixed‐dose combinations (FDCs) only at intensive phase | 1 | 307 | Risk Ratio (M‐H, Fixed, 95% CI) | 1.99 [0.18, 21.69] |
| 1.2 FDCs during all treatment | 6 | 3299 | Risk Ratio (M‐H, Fixed, 95% CI) | 1.26 [0.80, 1.99] |
| 2 Relapse Show forest plot | 10 | 3621 | Risk Ratio (M‐H, Fixed, 95% CI) | 1.28 [1.00, 1.64] |
| Analysis 4.2  Comparison 4 Fixed‐dose combinations (FDCs) administered only during intensive phase versus FDCs administered for the whole treatment, Outcome 2 Relapse. | ||||
| 2.1 FDCs only at intensive phase | 1 | 251 | Risk Ratio (M‐H, Fixed, 95% CI) | 3.94 [1.13, 13.78] |
| 2.2 FDCs during all treatment | 9 | 3370 | Risk Ratio (M‐H, Fixed, 95% CI) | 1.20 [0.93, 1.55] |
| 3 Death Show forest plot | 11 | 4800 | Risk Ratio (M‐H, Fixed, 95% CI) | 0.96 [0.67, 1.39] |
| Analysis 4.3 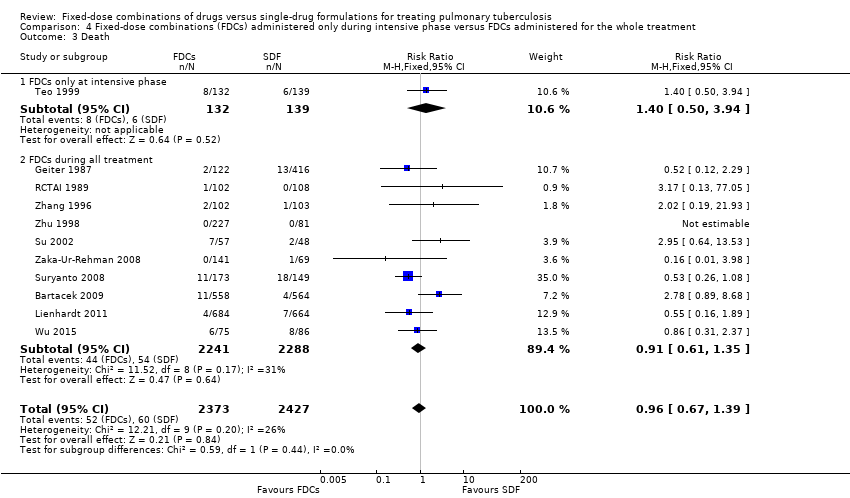 Comparison 4 Fixed‐dose combinations (FDCs) administered only during intensive phase versus FDCs administered for the whole treatment, Outcome 3 Death. | ||||
| 3.1 FDCs only at intensive phase | 1 | 271 | Risk Ratio (M‐H, Fixed, 95% CI) | 1.40 [0.50, 3.94] |
| 3.2 FDCs during all treatment | 10 | 4529 | Risk Ratio (M‐H, Fixed, 95% CI) | 0.91 [0.61, 1.35] |
| 4 Sputum smear or culture conversion at 2 months of starting treatment Show forest plot | 13 | 4836 | Risk Ratio (M‐H, Fixed, 95% CI) | 1.01 [0.99, 1.03] |
| Analysis 4.4 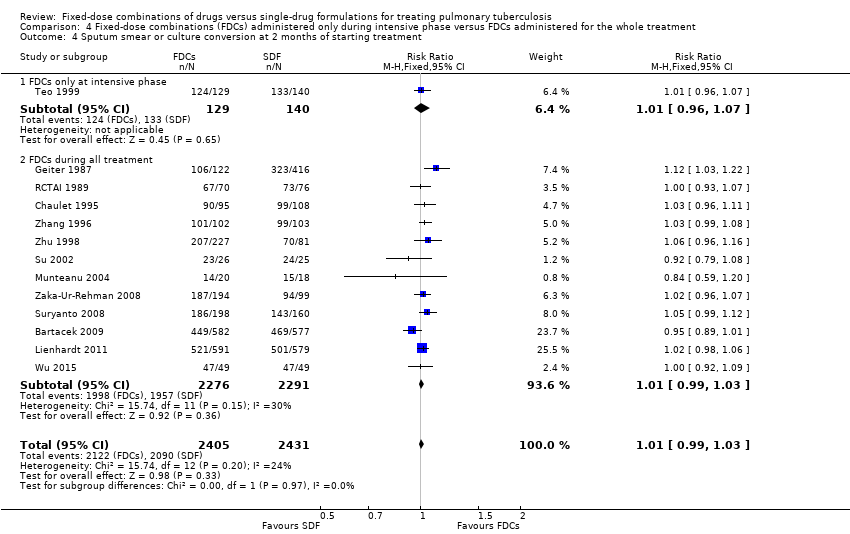 Comparison 4 Fixed‐dose combinations (FDCs) administered only during intensive phase versus FDCs administered for the whole treatment, Outcome 4 Sputum smear or culture conversion at 2 months of starting treatment. | ||||
| 4.1 FDCs only at intensive phase | 1 | 269 | Risk Ratio (M‐H, Fixed, 95% CI) | 1.01 [0.96, 1.07] |
| 4.2 FDCs during all treatment | 12 | 4567 | Risk Ratio (M‐H, Fixed, 95% CI) | 1.01 [0.99, 1.03] |
| 5 Acquisition of drug resistance Show forest plot | 3 | 491 | Risk Ratio (M‐H, Fixed, 95% CI) | 0.76 [0.15, 3.77] |
| Analysis 4.5 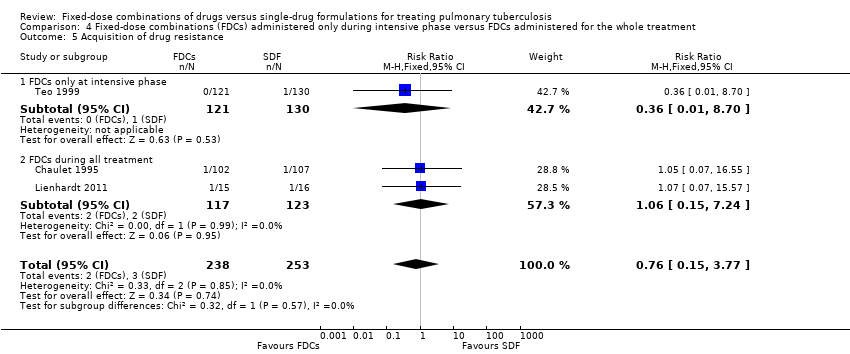 Comparison 4 Fixed‐dose combinations (FDCs) administered only during intensive phase versus FDCs administered for the whole treatment, Outcome 5 Acquisition of drug resistance. | ||||
| 5.1 FDCs only at intensive phase | 1 | 251 | Risk Ratio (M‐H, Fixed, 95% CI) | 0.36 [0.01, 8.70] |
| 5.2 FDCs during all treatment | 2 | 240 | Risk Ratio (M‐H, Fixed, 95% CI) | 1.06 [0.15, 7.24] |
| 6 Adverse events leading to discontinuation of therapy Show forest plot | 13 | 5530 | Risk Ratio (M‐H, Random, 95% CI) | 0.96 [0.56, 1.66] |
| Analysis 4.6 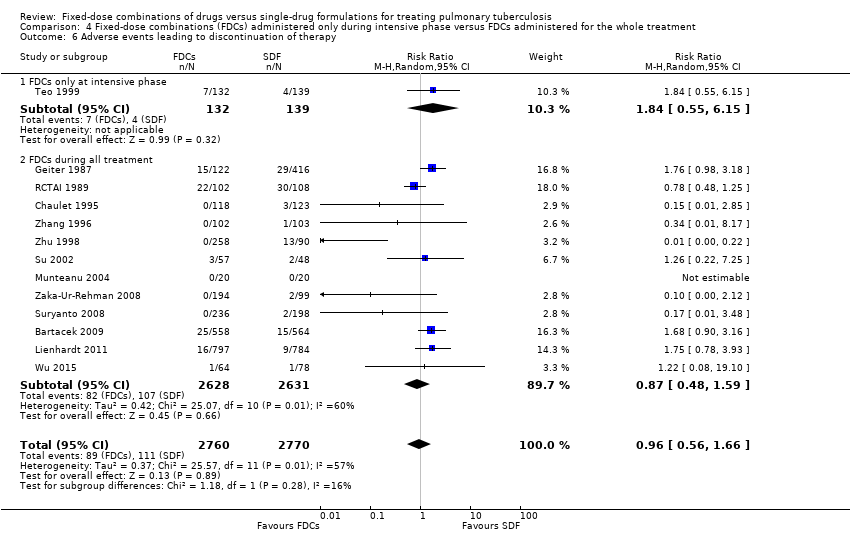 Comparison 4 Fixed‐dose combinations (FDCs) administered only during intensive phase versus FDCs administered for the whole treatment, Outcome 6 Adverse events leading to discontinuation of therapy. | ||||
| 6.1 FDCs only at intensive phase | 1 | 271 | Risk Ratio (M‐H, Random, 95% CI) | 1.84 [0.55, 6.15] |
| 6.2 FDCs during all treatment | 12 | 5259 | Risk Ratio (M‐H, Random, 95% CI) | 0.87 [0.48, 1.59] |
| 7 Other adverse events Show forest plot | 9 | 4639 | Risk Ratio (M‐H, Fixed, 95% CI) | 0.85 [0.72, 1.00] |
| Analysis 4.7  Comparison 4 Fixed‐dose combinations (FDCs) administered only during intensive phase versus FDCs administered for the whole treatment, Outcome 7 Other adverse events. | ||||
| 7.1 FDCs only at intensive phase | 1 | 271 | Risk Ratio (M‐H, Fixed, 95% CI) | 1.05 [0.75, 1.48] |
| 7.2 FDCs during all treatment | 8 | 4368 | Risk Ratio (M‐H, Fixed, 95% CI) | 0.81 [0.67, 0.97] |
| Outcome or subgroup title | No. of studies | No. of participants | Statistical method | Effect size |
| 1 Treatment failure Show forest plot | 7 | 3606 | Risk Ratio (M‐H, Fixed, 95% CI) | 1.28 [0.82, 2.00] |
| Analysis 5.1  Comparison 5 Daily regimen for the whole treatment versus daily regimen during the intensive phase followed by intermittent regimen during the continuation phase, Outcome 1 Treatment failure. | ||||
| 1.1 Daily medication for the whole treatment | 4 | 1517 | Risk Ratio (M‐H, Fixed, 95% CI) | 1.14 [0.63, 2.06] |
| 1.2 Daily medication at intensive phase followed by intermittent treatment at continuation phase | 3 | 2089 | Risk Ratio (M‐H, Fixed, 95% CI) | 1.49 [0.75, 2.96] |
| 2 Relapse Show forest plot | 10 | 3621 | Risk Ratio (M‐H, Fixed, 95% CI) | 1.28 [1.00, 1.64] |
| Analysis 5.2  Comparison 5 Daily regimen for the whole treatment versus daily regimen during the intensive phase followed by intermittent regimen during the continuation phase, Outcome 2 Relapse. | ||||
| 2.1 Daily medication for the whole treatment | 7 | 1850 | Risk Ratio (M‐H, Fixed, 95% CI) | 1.12 [0.83, 1.50] |
| 2.2 Daily medication at intensive phase followed by intermittent treatment at continuation phase | 3 | 1771 | Risk Ratio (M‐H, Fixed, 95% CI) | 1.72 [1.07, 2.75] |
| 3 Death Show forest plot | 11 | 4800 | Risk Ratio (M‐H, Fixed, 95% CI) | 0.96 [0.67, 1.39] |
| Analysis 5.3  Comparison 5 Daily regimen for the whole treatment versus daily regimen during the intensive phase followed by intermittent regimen during the continuation phase, Outcome 3 Death. | ||||
| 3.1 Daily medication for the whole treatment | 8 | 2859 | Risk Ratio (M‐H, Fixed, 95% CI) | 1.34 [0.79, 2.29] |
| 3.2 Daily medication at intensive phase followed by intermittent treatment at continuation phase | 3 | 1941 | Risk Ratio (M‐H, Fixed, 95% CI) | 0.69 [0.41, 1.16] |
| 4 Sputum smear or culture conversion at 2 months of starting treatment Show forest plot | 13 | 4836 | Risk Ratio (M‐H, Fixed, 95% CI) | 1.01 [0.99, 1.03] |
| Analysis 5.4  Comparison 5 Daily regimen for the whole treatment versus daily regimen during the intensive phase followed by intermittent regimen during the continuation phase, Outcome 4 Sputum smear or culture conversion at 2 months of starting treatment. | ||||
| 4.1 Daily medication for the whole treatment | 9 | 3001 | Risk Ratio (M‐H, Fixed, 95% CI) | 1.00 [0.98, 1.03] |
| 4.2 Daily medication at intensive phase followed by intermittent treatment at continuation phase | 4 | 1835 | Risk Ratio (M‐H, Fixed, 95% CI) | 1.02 [0.99, 1.05] |
| 5 Sputum smear or culture conversion at EOT Show forest plot | 7 | 2319 | Risk Ratio (M‐H, Fixed, 95% CI) | 0.99 [0.96, 1.02] |
| Analysis 5.5  Comparison 5 Daily regimen for the whole treatment versus daily regimen during the intensive phase followed by intermittent regimen during the continuation phase, Outcome 5 Sputum smear or culture conversion at EOT. | ||||
| 5.1 Daily medication for the whole treatment | 6 | 1961 | Risk Ratio (M‐H, Fixed, 95% CI) | 0.99 [0.96, 1.02] |
| 5.2 Daily medication at intensive phase followed by intermittent treatment at continuation phase | 1 | 358 | Risk Ratio (M‐H, Fixed, 95% CI) | 1.00 [0.95, 1.05] |
| 6 Acquisition of drug resistance Show forest plot | 3 | 491 | Risk Ratio (M‐H, Fixed, 95% CI) | 0.76 [0.15, 3.77] |
| Analysis 5.6  Comparison 5 Daily regimen for the whole treatment versus daily regimen during the intensive phase followed by intermittent regimen during the continuation phase, Outcome 6 Acquisition of drug resistance. | ||||
| 6.1 Daily medication for the whole treatment | 1 | 209 | Risk Ratio (M‐H, Fixed, 95% CI) | 1.05 [0.07, 16.55] |
| 6.2 Daily medication at intensive phase followed by intermittent treatment at continuation phase | 2 | 282 | Risk Ratio (M‐H, Fixed, 95% CI) | 0.64 [0.09, 4.69] |
| 7 Serious adverse events Show forest plot | 6 | 3388 | Risk Ratio (M‐H, Fixed, 95% CI) | 1.45 [0.90, 2.33] |
| Analysis 5.7  Comparison 5 Daily regimen for the whole treatment versus daily regimen during the intensive phase followed by intermittent regimen during the continuation phase, Outcome 7 Serious adverse events. | ||||
| 7.1 Daily medication for the whole treatment | 4 | 1767 | Risk Ratio (M‐H, Fixed, 95% CI) | 1.60 [0.95, 2.68] |
| 7.2 Daily medication at intensive phase followed by intermittent treatment at continuation phase | 2 | 1621 | Risk Ratio (M‐H, Fixed, 95% CI) | 0.79 [0.21, 2.92] |
| 8 Adverse events leading to discontinuation of therapy Show forest plot | 13 | 5530 | Risk Ratio (M‐H, Random, 95% CI) | 0.96 [0.56, 1.66] |
| Analysis 5.8  Comparison 5 Daily regimen for the whole treatment versus daily regimen during the intensive phase followed by intermittent regimen during the continuation phase, Outcome 8 Adverse events leading to discontinuation of therapy. | ||||
| 8.1 Daily medication for the whole treatment | 9 | 3204 | Risk Ratio (M‐H, Random, 95% CI) | 0.78 [0.39, 1.59] |
| 8.2 Daily medication at intensive phase followed by intermittent treatment at continuation phase | 4 | 2326 | Risk Ratio (M‐H, Random, 95% CI) | 1.55 [0.74, 3.25] |
| 9 Other adverse events Show forest plot | 9 | 4639 | Risk Ratio (M‐H, Fixed, 95% CI) | 0.85 [0.72, 1.00] |
| Analysis 5.9  Comparison 5 Daily regimen for the whole treatment versus daily regimen during the intensive phase followed by intermittent regimen during the continuation phase, Outcome 9 Other adverse events. | ||||
| 9.1 Daily medication for the whole treatment | 6 | 2747 | Risk Ratio (M‐H, Fixed, 95% CI) | 0.84 [0.70, 1.02] |
| 9.2 Daily medication at intensive phase followed by intermittent treatment at continuation phase | 3 | 1892 | Risk Ratio (M‐H, Fixed, 95% CI) | 0.86 [0.64, 1.18] |
| Outcome or subgroup title | No. of studies | No. of participants | Statistical method | Effect size |
| 1 Treatment failure Show forest plot | 6 | 2447 | Risk Ratio (M‐H, Fixed, 95% CI) | 1.46 [0.75, 2.84] |
| Analysis 6.1  Comparison 6 Supervised treatment versus self‐administered treatment during the intensive phase, Outcome 1 Treatment failure. | ||||
| 1.1 Supervised treatment during the intensive phase | 4 | 1962 | Risk Ratio (M‐H, Fixed, 95% CI) | 1.27 [0.56, 2.89] |
| 1.2 Self‐administered treatment during the intensive phase | 2 | 485 | Risk Ratio (M‐H, Fixed, 95% CI) | 1.89 [0.59, 6.04] |
| 2 Relapse Show forest plot | 9 | 2676 | Risk Ratio (M‐H, Fixed, 95% CI) | 1.69 [1.09, 2.63] |
| Analysis 6.2  Comparison 6 Supervised treatment versus self‐administered treatment during the intensive phase, Outcome 2 Relapse. | ||||
| 2.1 Supervised treatment during the intensive phase | 6 | 2318 | Risk Ratio (M‐H, Fixed, 95% CI) | 1.52 [0.94, 2.45] |
| 2.2 Self‐administered treatment during the intensive phase | 3 | 358 | Risk Ratio (M‐H, Fixed, 95% CI) | 2.93 [0.89, 9.59] |
| 3 Death Show forest plot | 10 | 3678 | Risk Ratio (M‐H, Fixed, 95% CI) | 0.82 [0.55, 1.22] |
| Analysis 6.3  Comparison 6 Supervised treatment versus self‐administered treatment during the intensive phase, Outcome 3 Death. | ||||
| 3.1 Supervised treatment during the intensive phase | 6 | 2503 | Risk Ratio (M‐H, Fixed, 95% CI) | 0.89 [0.50, 1.58] |
| 3.2 Self‐administered treatment during the intensive phase | 4 | 1175 | Risk Ratio (M‐H, Fixed, 95% CI) | 0.76 [0.44, 1.32] |
| 4 Sputum smear or culture conversion at 2 months of starting treatment Show forest plot | 12 | 3677 | Risk Ratio (M‐H, Fixed, 95% CI) | 1.03 [1.01, 1.05] |
| Analysis 6.4  Comparison 6 Supervised treatment versus self‐administered treatment during the intensive phase, Outcome 4 Sputum smear or culture conversion at 2 months of starting treatment. | ||||
| 4.1 Supervised treatment during the intensive phase | 8 | 2584 | Risk Ratio (M‐H, Fixed, 95% CI) | 1.02 [0.99, 1.05] |
| 4.2 Self‐administered treatment during the intensive phase | 4 | 1093 | Risk Ratio (M‐H, Fixed, 95% CI) | 1.06 [1.01, 1.11] |
| 5 Sputum smear or culture conversion at EOT Show forest plot | 6 | 1160 | Risk Ratio (M‐H, Fixed, 95% CI) | 1.00 [0.98, 1.03] |
| Analysis 6.5 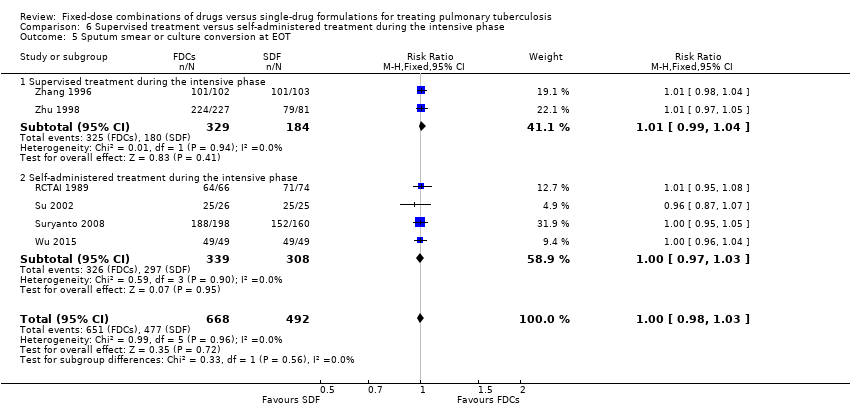 Comparison 6 Supervised treatment versus self‐administered treatment during the intensive phase, Outcome 5 Sputum smear or culture conversion at EOT. | ||||
| 5.1 Supervised treatment during the intensive phase | 2 | 513 | Risk Ratio (M‐H, Fixed, 95% CI) | 1.01 [0.99, 1.04] |
| 5.2 Self‐administered treatment during the intensive phase | 4 | 647 | Risk Ratio (M‐H, Fixed, 95% CI) | 1.00 [0.97, 1.03] |
| 6 Treatment adherence at 8 weeks of starting treatment Show forest plot | 3 | 881 | Risk Ratio (M‐H, Random, 95% CI) | 1.04 [0.96, 1.12] |
| Analysis 6.6  Comparison 6 Supervised treatment versus self‐administered treatment during the intensive phase, Outcome 6 Treatment adherence at 8 weeks of starting treatment. | ||||
| 6.1 Supervised treatment during the intensive phase | 1 | 142 | Risk Ratio (M‐H, Random, 95% CI) | 1.01 [0.97, 1.06] |
| 6.2 Self‐administered treatment during the intensive phase | 2 | 739 | Risk Ratio (M‐H, Random, 95% CI) | 1.09 [0.90, 1.31] |
| 7 Treatment adherence at EOT Show forest plot | 5 | 1229 | Risk Ratio (M‐H, Fixed, 95% CI) | 1.01 [0.97, 1.06] |
| Analysis 6.7  Comparison 6 Supervised treatment versus self‐administered treatment during the intensive phase, Outcome 7 Treatment adherence at EOT. | ||||
| 7.1 Supervised treatment during the intensive phase | 1 | 96 | Risk Ratio (M‐H, Fixed, 95% CI) | 1.04 [0.97, 1.11] |
| 7.2 Self‐administered treatment during the intensive phase | 4 | 1133 | Risk Ratio (M‐H, Fixed, 95% CI) | 1.01 [0.96, 1.06] |
| 8 Serious adverse events Show forest plot | 5 | 2266 | Risk Ratio (M‐H, Fixed, 95% CI) | 1.10 [0.46, 2.60] |
| Analysis 6.8 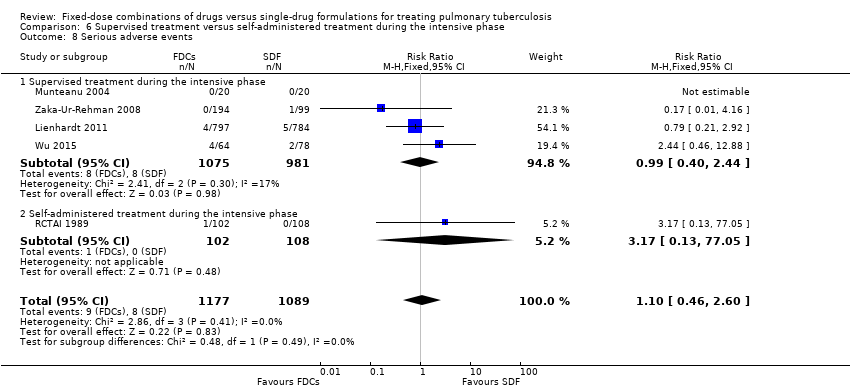 Comparison 6 Supervised treatment versus self‐administered treatment during the intensive phase, Outcome 8 Serious adverse events. | ||||
| 8.1 Supervised treatment during the intensive phase | 4 | 2056 | Risk Ratio (M‐H, Fixed, 95% CI) | 0.99 [0.40, 2.44] |
| 8.2 Self‐administered treatment during the intensive phase | 1 | 210 | Risk Ratio (M‐H, Fixed, 95% CI) | 3.17 [0.13, 77.05] |
| 9 Adverse events leading to discontinuation of therapy Show forest plot | 12 | 4408 | Risk Ratio (M‐H, Random, 95% CI) | 0.82 [0.43, 1.57] |
| Analysis 6.9  Comparison 6 Supervised treatment versus self‐administered treatment during the intensive phase, Outcome 9 Adverse events leading to discontinuation of therapy. | ||||
| 9.1 Supervised treatment during the intensive phase | 8 | 3121 | Risk Ratio (M‐H, Random, 95% CI) | 0.44 [0.11, 1.71] |
| 9.2 Self‐administered treatment during the intensive phase | 4 | 1287 | Risk Ratio (M‐H, Random, 95% CI) | 1.06 [0.55, 2.04] |
| 10 Other adverse events Show forest plot | 8 | 3517 | Risk Ratio (M‐H, Fixed, 95% CI) | 0.82 [0.68, 1.00] |
| Analysis 6.10 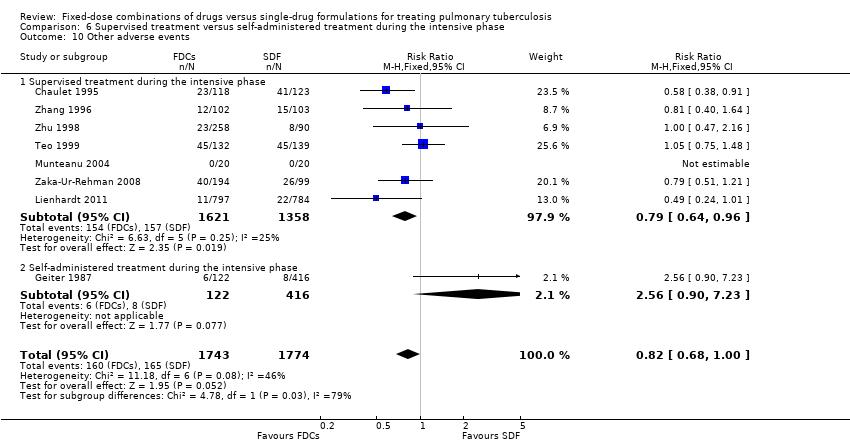 Comparison 6 Supervised treatment versus self‐administered treatment during the intensive phase, Outcome 10 Other adverse events. | ||||
| 10.1 Supervised treatment during the intensive phase | 7 | 2979 | Risk Ratio (M‐H, Fixed, 95% CI) | 0.79 [0.64, 0.96] |
| 10.2 Self‐administered treatment during the intensive phase | 1 | 538 | Risk Ratio (M‐H, Fixed, 95% CI) | 2.56 [0.90, 7.23] |
| Outcome or subgroup title | No. of studies | No. of participants | Statistical method | Effect size |
| 1 Treatment failure Show forest plot | 7 | 3606 | Risk Ratio (M‐H, Fixed, 95% CI) | 1.28 [0.82, 2.00] |
| Analysis 7.1  Comparison 7 Trials with four drugs as fixed‐dose combinations (FDCs) versus trials with three or two drugs as FDCs during the intensive phase, Outcome 1 Treatment failure. | ||||
| 1.1 Four drugs as FDCs during the intensive phase | 3 | 2941 | Risk Ratio (M‐H, Fixed, 95% CI) | 1.27 [0.80, 2.01] |
| 1.2 Three or 2 drugs as FDCs during the intensive phase | 4 | 665 | Risk Ratio (M‐H, Fixed, 95% CI) | 1.52 [0.26, 9.08] |
| 2 Relapse Show forest plot | 9 | 3523 | Risk Ratio (M‐H, Fixed, 95% CI) | 1.28 [1.00, 1.64] |
| Analysis 7.2  Comparison 7 Trials with four drugs as fixed‐dose combinations (FDCs) versus trials with three or two drugs as FDCs during the intensive phase, Outcome 2 Relapse. | ||||
| 2.1 Four drugs as FDCs during the intensive phase | 4 | 2675 | Risk Ratio (M‐H, Fixed, 95% CI) | 1.18 [0.91, 1.54] |
| 2.2 Three or 2 drugs as FDCs during the intensive phase | 5 | 848 | Risk Ratio (M‐H, Fixed, 95% CI) | 2.55 [1.07, 6.06] |
| 3 Death Show forest plot | 11 | 4800 | Risk Ratio (M‐H, Fixed, 95% CI) | 0.96 [0.67, 1.39] |
| Analysis 7.3  Comparison 7 Trials with four drugs as fixed‐dose combinations (FDCs) versus trials with three or two drugs as FDCs during the intensive phase, Outcome 3 Death. | ||||
| 3.1 Four drugs as FDCs during the intensive phase | 4 | 3002 | Risk Ratio (M‐H, Fixed, 95% CI) | 0.79 [0.48, 1.30] |
| 3.2 Three or 2 drugs as FDCs during the intensive phase | 7 | 1798 | Risk Ratio (M‐H, Fixed, 95% CI) | 1.21 [0.70, 2.10] |
| 4 Adverse events leading to discontinuation of therapy Show forest plot | 13 | 5530 | Risk Ratio (M‐H, Random, 95% CI) | 0.96 [0.56, 1.66] |
| Analysis 7.4  Comparison 7 Trials with four drugs as fixed‐dose combinations (FDCs) versus trials with three or two drugs as FDCs during the intensive phase, Outcome 4 Adverse events leading to discontinuation of therapy. | ||||
| 4.1 Four drugs as FDCs during the intensive phase | 4 | 3430 | Risk Ratio (M‐H, Random, 95% CI) | 1.21 [0.53, 2.78] |
| 4.2 Three or 2 drugs as FDCs during the intensive phase | 9 | 2100 | Risk Ratio (M‐H, Random, 95% CI) | 0.81 [0.37, 1.77] |
| 5 Sputum smear or culture conversion at EOT Show forest plot | 7 | 2319 | Risk Ratio (M‐H, Fixed, 95% CI) | 0.99 [0.96, 1.02] |
| Analysis 7.5  Comparison 7 Trials with four drugs as fixed‐dose combinations (FDCs) versus trials with three or two drugs as FDCs during the intensive phase, Outcome 5 Sputum smear or culture conversion at EOT. | ||||
| 5.1 Four drugs as FDCs during the intensive phase | 2 | 1517 | Risk Ratio (M‐H, Fixed, 95% CI) | 0.98 [0.94, 1.02] |
| 5.2 Three or 2 drugs as FDCs during the intensive phase | 5 | 802 | Risk Ratio (M‐H, Fixed, 95% CI) | 1.01 [0.98, 1.03] |
| 6 Acquisition of drug resistance Show forest plot | 3 | 491 | Risk Ratio (M‐H, Fixed, 95% CI) | 0.76 [0.15, 3.77] |
| Analysis 7.6 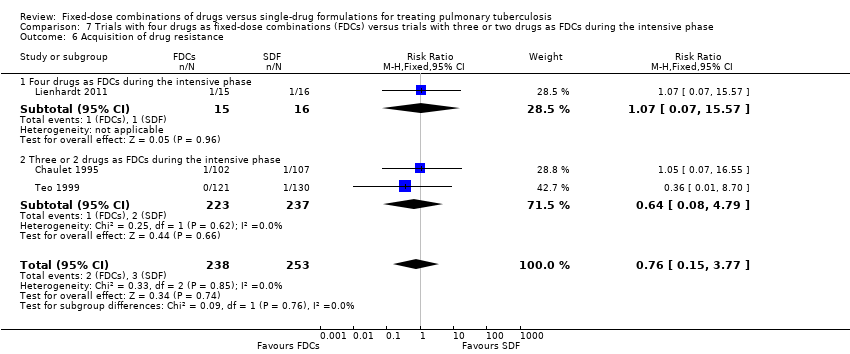 Comparison 7 Trials with four drugs as fixed‐dose combinations (FDCs) versus trials with three or two drugs as FDCs during the intensive phase, Outcome 6 Acquisition of drug resistance. | ||||
| 6.1 Four drugs as FDCs during the intensive phase | 1 | 31 | Risk Ratio (M‐H, Fixed, 95% CI) | 1.07 [0.07, 15.57] |
| 6.2 Three or 2 drugs as FDCs during the intensive phase | 2 | 460 | Risk Ratio (M‐H, Fixed, 95% CI) | 0.64 [0.08, 4.79] |
| 7 Serious adverse events Show forest plot | 6 | 3388 | Risk Ratio (M‐H, Fixed, 95% CI) | 1.45 [0.90, 2.33] |
| Analysis 7.7  Comparison 7 Trials with four drugs as fixed‐dose combinations (FDCs) versus trials with three or two drugs as FDCs during the intensive phase, Outcome 7 Serious adverse events. | ||||
| 7.1 Four drugs as FDCs during the intensive phase | 3 | 2996 | Risk Ratio (M‐H, Fixed, 95% CI) | 1.34 [0.81, 2.23] |
| 7.2 Three or 2 drugs as FDCs during the intensive phase | 3 | 392 | Risk Ratio (M‐H, Fixed, 95% CI) | 2.59 [0.59, 11.34] |
| 8 Sputum smear or culture conversion at 2 months of starting treatment Show forest plot | 13 | 4836 | Risk Ratio (M‐H, Fixed, 95% CI) | 1.01 [0.99, 1.03] |
| Analysis 7.8  Comparison 7 Trials with four drugs as fixed‐dose combinations (FDCs) versus trials with three or two drugs as FDCs during the intensive phase, Outcome 8 Sputum smear or culture conversion at 2 months of starting treatment. | ||||
| 8.1 Four drugs as FDCs during the intensive phase | 4 | 2980 | Risk Ratio (M‐H, Fixed, 95% CI) | 1.00 [0.97, 1.03] |
| 8.2 Three or 2 drugs as FDCs during the intensive phase | 9 | 1856 | Risk Ratio (M‐H, Fixed, 95% CI) | 1.04 [1.01, 1.07] |
| 9 Other adverse events Show forest plot | 9 | 4639 | Risk Ratio (M‐H, Fixed, 95% CI) | 0.85 [0.72, 1.00] |
| Analysis 7.9 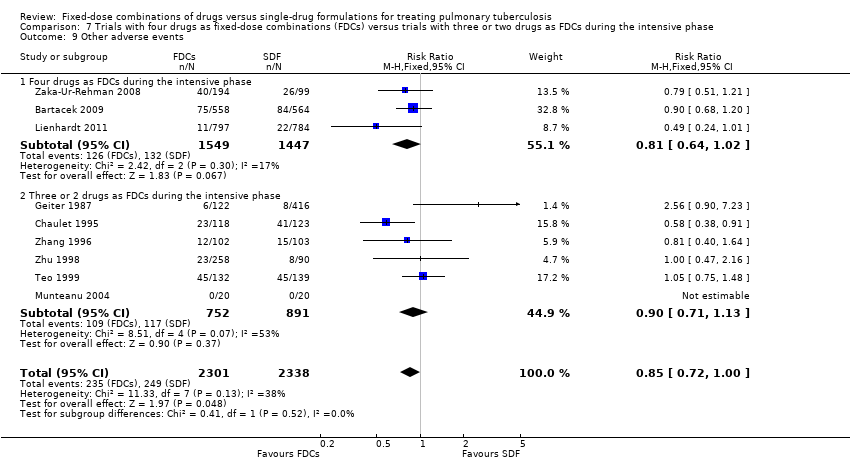 Comparison 7 Trials with four drugs as fixed‐dose combinations (FDCs) versus trials with three or two drugs as FDCs during the intensive phase, Outcome 9 Other adverse events. | ||||
| 9.1 Four drugs as FDCs during the intensive phase | 3 | 2996 | Risk Ratio (M‐H, Fixed, 95% CI) | 0.81 [0.64, 1.02] |
| 9.2 Three or 2 drugs as FDCs during the intensive phase | 6 | 1643 | Risk Ratio (M‐H, Fixed, 95% CI) | 0.90 [0.71, 1.13] |

Logic diagram of relationship between the use of fixed‐dose combinations (FDCs) and expected improvement of reported outcomes.

Flow diagram of the trial selection process.

'Risk of bias' summary: review authors' judgements about each 'Risk of bias' item for each included trial.

'Risk of bias' graph: review authors' judgements about each 'Risk of bias' item presented as percentages across all included trials.

Funnel plot of comparison: 1 Fixed‐dose combinations versus single‐drug formulations as available data, outcome: 1.4 Sputum smear or culture conversion at two months of starting treatment.
Comparison 1 Fixed‐dose combinations versus single‐drug formulations as available data, Outcome 1 Treatment failure.
Comparison 1 Fixed‐dose combinations versus single‐drug formulations as available data, Outcome 2 Relapse.
Comparison 1 Fixed‐dose combinations versus single‐drug formulations as available data, Outcome 3 Death.
Comparison 1 Fixed‐dose combinations versus single‐drug formulations as available data, Outcome 4 Sputum smear or culture conversion at 2 months of starting treatment.
Comparison 1 Fixed‐dose combinations versus single‐drug formulations as available data, Outcome 5 Sputum smear or culture conversion at end of treatment (EOT).
Comparison 1 Fixed‐dose combinations versus single‐drug formulations as available data, Outcome 6 Treatment adherence at 8 weeks of starting treatment.
Comparison 1 Fixed‐dose combinations versus single‐drug formulations as available data, Outcome 7 Treatment adherence at EOT.
Comparison 1 Fixed‐dose combinations versus single‐drug formulations as available data, Outcome 8 Acquisition of drug resistance.
Comparison 1 Fixed‐dose combinations versus single‐drug formulations as available data, Outcome 9 Patient satisfaction.
Comparison 1 Fixed‐dose combinations versus single‐drug formulations as available data, Outcome 10 Serious adverse events.
Comparison 1 Fixed‐dose combinations versus single‐drug formulations as available data, Outcome 11 Adverse events leading to discontinuation of therapy.
Comparison 1 Fixed‐dose combinations versus single‐drug formulations as available data, Outcome 12 Other adverse events.
Comparison 2 Fixed‐dose combinations versus single‐drug formulations as available data: sensitivity analysis by risk of bias, Outcome 1 Treatment failure.
Comparison 2 Fixed‐dose combinations versus single‐drug formulations as available data: sensitivity analysis by risk of bias, Outcome 2 Relapse.
Comparison 2 Fixed‐dose combinations versus single‐drug formulations as available data: sensitivity analysis by risk of bias, Outcome 3 Death.
Comparison 2 Fixed‐dose combinations versus single‐drug formulations as available data: sensitivity analysis by risk of bias, Outcome 4 Sputum smear or culture conversion at 2 months of starting treatment.
Comparison 2 Fixed‐dose combinations versus single‐drug formulations as available data: sensitivity analysis by risk of bias, Outcome 5 Sputum smear or culture conversion at EOT.
Comparison 2 Fixed‐dose combinations versus single‐drug formulations as available data: sensitivity analysis by risk of bias, Outcome 6 Acquisition of drug resistance.
Comparison 2 Fixed‐dose combinations versus single‐drug formulations as available data: sensitivity analysis by risk of bias, Outcome 7 Serious adverse events.
Comparison 2 Fixed‐dose combinations versus single‐drug formulations as available data: sensitivity analysis by risk of bias, Outcome 8 Adverse events leading to discontinuation of therapy.
Comparison 2 Fixed‐dose combinations versus single‐drug formulations as available data: sensitivity analysis by risk of bias, Outcome 9 Other adverse events.
Comparison 3 Fixed‐dose combinations versus single‐drug formulations: sensitivity analysis by intention‐to‐treat (ITT), Outcome 1 Treatment failure (ITT analysis and all losses to follow‐up judged as failure).
Comparison 3 Fixed‐dose combinations versus single‐drug formulations: sensitivity analysis by intention‐to‐treat (ITT), Outcome 2 Relapse (ITT analysis and all losses to follow‐up judged as relapse).
Comparison 3 Fixed‐dose combinations versus single‐drug formulations: sensitivity analysis by intention‐to‐treat (ITT), Outcome 3 Sputum smear or culture conversion at 2 months of starting treatment (ITT analysis and all losses to follow‐up judged as conversion failure).
Comparison 3 Fixed‐dose combinations versus single‐drug formulations: sensitivity analysis by intention‐to‐treat (ITT), Outcome 4 Sputum smear or culture conversion at EOT (ITT analysis and all losses to follow‐up judged as conversion failure).
Comparison 4 Fixed‐dose combinations (FDCs) administered only during intensive phase versus FDCs administered for the whole treatment, Outcome 1 Treatment failure.
Comparison 4 Fixed‐dose combinations (FDCs) administered only during intensive phase versus FDCs administered for the whole treatment, Outcome 2 Relapse.
Comparison 4 Fixed‐dose combinations (FDCs) administered only during intensive phase versus FDCs administered for the whole treatment, Outcome 3 Death.
Comparison 4 Fixed‐dose combinations (FDCs) administered only during intensive phase versus FDCs administered for the whole treatment, Outcome 4 Sputum smear or culture conversion at 2 months of starting treatment.
Comparison 4 Fixed‐dose combinations (FDCs) administered only during intensive phase versus FDCs administered for the whole treatment, Outcome 5 Acquisition of drug resistance.
Comparison 4 Fixed‐dose combinations (FDCs) administered only during intensive phase versus FDCs administered for the whole treatment, Outcome 6 Adverse events leading to discontinuation of therapy.
Comparison 4 Fixed‐dose combinations (FDCs) administered only during intensive phase versus FDCs administered for the whole treatment, Outcome 7 Other adverse events.
Comparison 5 Daily regimen for the whole treatment versus daily regimen during the intensive phase followed by intermittent regimen during the continuation phase, Outcome 1 Treatment failure.
Comparison 5 Daily regimen for the whole treatment versus daily regimen during the intensive phase followed by intermittent regimen during the continuation phase, Outcome 2 Relapse.
Comparison 5 Daily regimen for the whole treatment versus daily regimen during the intensive phase followed by intermittent regimen during the continuation phase, Outcome 3 Death.
Comparison 5 Daily regimen for the whole treatment versus daily regimen during the intensive phase followed by intermittent regimen during the continuation phase, Outcome 4 Sputum smear or culture conversion at 2 months of starting treatment.
Comparison 5 Daily regimen for the whole treatment versus daily regimen during the intensive phase followed by intermittent regimen during the continuation phase, Outcome 5 Sputum smear or culture conversion at EOT.
Comparison 5 Daily regimen for the whole treatment versus daily regimen during the intensive phase followed by intermittent regimen during the continuation phase, Outcome 6 Acquisition of drug resistance.
Comparison 5 Daily regimen for the whole treatment versus daily regimen during the intensive phase followed by intermittent regimen during the continuation phase, Outcome 7 Serious adverse events.
Comparison 5 Daily regimen for the whole treatment versus daily regimen during the intensive phase followed by intermittent regimen during the continuation phase, Outcome 8 Adverse events leading to discontinuation of therapy.
Comparison 5 Daily regimen for the whole treatment versus daily regimen during the intensive phase followed by intermittent regimen during the continuation phase, Outcome 9 Other adverse events.
Comparison 6 Supervised treatment versus self‐administered treatment during the intensive phase, Outcome 1 Treatment failure.
Comparison 6 Supervised treatment versus self‐administered treatment during the intensive phase, Outcome 2 Relapse.
Comparison 6 Supervised treatment versus self‐administered treatment during the intensive phase, Outcome 3 Death.
Comparison 6 Supervised treatment versus self‐administered treatment during the intensive phase, Outcome 4 Sputum smear or culture conversion at 2 months of starting treatment.
Comparison 6 Supervised treatment versus self‐administered treatment during the intensive phase, Outcome 5 Sputum smear or culture conversion at EOT.
Comparison 6 Supervised treatment versus self‐administered treatment during the intensive phase, Outcome 6 Treatment adherence at 8 weeks of starting treatment.
Comparison 6 Supervised treatment versus self‐administered treatment during the intensive phase, Outcome 7 Treatment adherence at EOT.
Comparison 6 Supervised treatment versus self‐administered treatment during the intensive phase, Outcome 8 Serious adverse events.
Comparison 6 Supervised treatment versus self‐administered treatment during the intensive phase, Outcome 9 Adverse events leading to discontinuation of therapy.
Comparison 6 Supervised treatment versus self‐administered treatment during the intensive phase, Outcome 10 Other adverse events.
Comparison 7 Trials with four drugs as fixed‐dose combinations (FDCs) versus trials with three or two drugs as FDCs during the intensive phase, Outcome 1 Treatment failure.
Comparison 7 Trials with four drugs as fixed‐dose combinations (FDCs) versus trials with three or two drugs as FDCs during the intensive phase, Outcome 2 Relapse.
Comparison 7 Trials with four drugs as fixed‐dose combinations (FDCs) versus trials with three or two drugs as FDCs during the intensive phase, Outcome 3 Death.
Comparison 7 Trials with four drugs as fixed‐dose combinations (FDCs) versus trials with three or two drugs as FDCs during the intensive phase, Outcome 4 Adverse events leading to discontinuation of therapy.
Comparison 7 Trials with four drugs as fixed‐dose combinations (FDCs) versus trials with three or two drugs as FDCs during the intensive phase, Outcome 5 Sputum smear or culture conversion at EOT.
Comparison 7 Trials with four drugs as fixed‐dose combinations (FDCs) versus trials with three or two drugs as FDCs during the intensive phase, Outcome 6 Acquisition of drug resistance.
Comparison 7 Trials with four drugs as fixed‐dose combinations (FDCs) versus trials with three or two drugs as FDCs during the intensive phase, Outcome 7 Serious adverse events.
Comparison 7 Trials with four drugs as fixed‐dose combinations (FDCs) versus trials with three or two drugs as FDCs during the intensive phase, Outcome 8 Sputum smear or culture conversion at 2 months of starting treatment.
Comparison 7 Trials with four drugs as fixed‐dose combinations (FDCs) versus trials with three or two drugs as FDCs during the intensive phase, Outcome 9 Other adverse events.
| Fixed‐dose combinations compared to single‐drug formulations for treating newly diagnosed pulmonary tuberculosis (TB) | |||||
| Participant or population: treating pulmonary TB | |||||
| Outcomes | Illustrative comparative risks* (95% CI) | Relative effect | Number of participants | Quality of the evidence | |
| Assumed risk single‐drug formulations | Corresponding risk FDCs | ||||
| Treatment failure | 19 per 1000 | 24 per 1000 | RR 1.28 | 3606 | ⊕⊕⊕⊝ |
| Relapse | 55 per 1000 | 71 per 1000 | RR 1.28 | 3621 | ⊕⊕⊝⊝ |
| Death | 25 per 1000 | 24 per 1000 | RR 0.96 | 4800 | ⊕⊕⊕⊝ |
| Sputum smear or culture conversion at end of treatment | 892 per 1000 | 883 per 1000 | RR 0.99 | 2319 | ⊕⊕⊕⊕ |
| Serious adverse events | 16 per 1000 | 23 per 1000 | RR 1.45 | 3388 | ⊕⊕⊕⊝ |
| Adverse events leading to discontinuation of therapy | 40 per 1000 | 38 per 1000 | RR 0.96 | 5530 | ⊕⊕⊝⊝ |
| Combined endpoint of treatment failure, relapse, or death** | — | — | — | (0 RCTs) | — |
| *The risk in the intervention group (and its 95% CI) is based on the assumed risk in the comparison group and the relative effect of the intervention (and its 95% CI). | |||||
| GRADE Working Group grades of evidence | |||||
| 1 We did not downgrade the quality of the evidence due to limitations in design and execution. Analysis of studies at low risk of bias does not change the effect estimate. | |||||
| Trial1 | Outcomes2 | Definitions | Notes |
| Treatment failure | “sputum smear still or again positive after 4 and/or 6 months of treatment” | Treatment efficacy based on bacteriological response rate (sputum smear conversion rate) on 2 smears | |
| Relapse | “patient cured at end of treatment (EOT) and sputum smear again positive at months 9 or 12” | ||
| Treatment failure | “two positive cultures with or without radiological deterioration at EOT (treatment failure) or during the follow‐up (relapse) and consequently resulting in a new course of treatment” | Treatment efficacy based on bacteriological criteria (2 negative cultures) | |
| Relapse | |||
| Treatment adherence | Not defined | Determined by testing urine for isoniazid metabolites by biochemical methods | |
| Acquisition of drug resistance | Determined by drug sensitivity test for isoniazid, rifampicin and streptomycin | ||
| Treatment adherence | Not defined | Asking patients for missed doses, by pill counts and by testing urine for isoniazid metabolites | |
| Treatment failure | “One culture of at least 20 colonies` growth or 2 cultures of 10 or more colonies growth at EOT not identified as a reinfection” | Treatment efficacy based on bacteriological results: 2 sputum smears and cultures. One case of relapse was reported based only in radiologic deterioration | |
| Relapse | “One culture of at least 20 colonies` growth or 2 cultures of 10 or more colonies growth in the follow‐phase not identified as reinfection” | ||
| Acquisition of drug resistance | Not defined | Determined by drug sensitivity test for isoniazid, rifampicin, streptomycin and ethambutol | |
| Relapse | Not defined | Efficacy based on bacteriological results (sputum smear and culture) | |
| Treatment adherence | Not defined | Assessed by delay in drug collection and surprise pill counting | |
| Treatment failure | Not defined | Treatment efficacy based on clinical, bacteriological (3 sputum smears and cultures) and radiographic criteria | |
| Relapse | Efficacy based on bacteriological results (3 sputum smears and cultures) | ||
| Treatment adherence | Assessed by “cases lost to follow‐up and cases who changed to another regimen during treatment” | ||
| Treatment failure | "Smear positive at 5 months or later"3 | Efficacy based on bacteriological results (sputum smear) | |
| Relapse |
| Efficacy based on bacteriological results (1 smear sputum and culture) and information from interviews and verbal autopsies | |
| Treatment failure | Not defined | Treatment efficacy based on bacteriological results (sputum smear and culture) | |
| Relapse | “Bacteriological relapse after chemotherapy was defined as a positive culture with a growth of 10 or more colonies in 2 different months during any 3‐month period up to 30 months, and during any 6‐month period up to 60 months” | Efficacy based on bacteriological results (sputum smear and culture). One case of relapse was reported based on radiological deterioration | |
| Acquisition of drug resistance | Not defined | Determined by drug sensitivity test for isoniazid, rifampicin, and streptomycin | |
| Relapse | Not defined | Efficacy based on bacteriological results (sputum smear) | |
| Relapse | Not defined | Efficacy based on bacteriological results (sputum smear and culture) | |
| Treatment adherence | Not defined | There were 3 kinds of treatment management (whole‐course hospitalization; hospitalization only during intensive phase and outpatient treatment), combined with 3 supervision model respectively (supervision by medical staff; supervision by no‐medical staff who had been trained by the medical staff [relatives, colleagues] and supervision by medical staff in the intensive phase but non‐medical staff in the continuation phase). Treatment and supervision were established according to participants economic status | |
| Abbreviations: EOT: end of treatment; TB: tuberculosis. 1Munteanu 2004 did not report the outcomes included in this table and Semenova 2003 was not included in quantitative analysis. | |||
| Trial | Number of participants | Treatment regimens |
| 1159 | 2HRZE/4HR | |
| 250 | 2HRZ/4HR | |
| 701 | 2HRZ/4HR | |
| 1585 | 2HRZE/4HR1 | |
| 40 | 2HRZE/4HR | |
| 229 | 2HRZ/4HR1 | |
| 105 | 2HRZE/4HRE | |
| 434 | 2HRZE/3HR | |
| 310 | 3 different regimes were given2 | |
| 161 | 2HRZE/4HRE | |
| 293 | 2HRZE/4HRE | |
| 209 | 2HRZ/4HR | |
| 348 | 2HRZ/4HR | |
| Abbreviations: H: isoniazid; R: rifampicin; Z: pyrazinamide; E: ethambutol; S: streptomycin. | ||
| Trial | Regimen treatment | Directly observed therapy | Dosing | Dose simulation during intensive phase | Comment | |||
| 45 kg participant | 60 kg participant | |||||||
| Fixed‐dose | Single‐dose | Fixed‐dose | Single‐dose | |||||
| 2HRZE/4HR | Mode of drugs administration: not reported | By weight categories | Unclear | Unclear | Unclear | Unclear | The trial authors state: "The mean daily doses of INH, PZA and EMB administered during the initiation phase in the 4‐FDC group were significantly lower than those administered in the ST group; RMP doses were similar in both groups". | |
| 2HRZ/4HR | At the beginning of intensive phase | By weight categories | H: 250 mg R: 600 mg Z: 1500 mg | H: 300 mg R: 450 mg Z: 1500 mg | H: 300 mg R: 720 mg Z: 1800 mg | H: 300 mg R: 600 mg Z: 2000 mg | During directly observed treatment (DOT), "health personal" supervised treatment. Time with DOT is unclear. | |
| 2HRZ/4HR | No | By weight categories only for FDCs | H: 225 mg R: 450 mg Z: 1200 mg | Not reported | H: 300 mg R: 600 mg Z: 1600 mg | Not reported | Self‐administered treatment was done during the whole treatment. Dose used for single‐drug formulations: not reported. | |
| 2HRZE/4HR1 | During 6 days a week | By weight categories | H: 225 mg R: 450 mg Z: 1200 mg E: 825 mg | H: 250 mg R: 450 mg Z: 1200 mg E: 800 mg | H: 300 mg R: 600 mg Z: 1600 mg E: 1100 mg | H: 300 mg R: 600 mg Z: 1600 mg E: 1200 mg | The trial authors state: "In the majority of the trial centers, treatment was fully supervised for a minimum of 6 days a week". Every treatment dose was taken under the supervision of the medical staff. | |
| 2HRZE/4HR | During the intensive phase | Not reported | Not reported | Not reported | Not reported | Not reported | The supervision mechanism during DOT is unclear, and only mention "strictly supervised". Self‐administered treatment was done during the continuation phase. | |
| 2HRZ/4HR2 | No | By weight categories | H: 320 mg R: 480 mg Z: 1000 mg | Unclear | H: 400 mg R: 600 mg Z: 1250 mg | Unclear | Self‐administered treatment during the whole treatment. | |
| 4HRZE | Mode of drugs administration: not reported | By weight categories | Mairin‐P: 4 tablets + H: 225 mg | H: 450 mg R: 450 mg Z: 900 mg E: 1125 mg | Mairin‐P: 5 tablets + H: 300 mg | H: 600 mg R: 600 mg Z: 1200 mg E: 1500 mg | Streptomycin was added in 2 of the 4 randomized groups3. | |
| 2HRZE/4HRE | No | By weight categories | H: 200 mg R: 480 mg Z: 1000 mg E: not reported | H: 300 mg R: 450 mg Z: 1500 mg E: 1200 mg | H: 250 mg R: 600 mg Z: 1250 mg E: not reported | H: 300 mg R: 600 mg Z: 1500 mg E: 1200 mg | Self‐administered treatment during the whole treatment. | |
| 2HRZE/3HR | Once a weekly | By weight categories | Average dose H: 225 mg R: 450 mg Z: 1200 mg E: 825 mg | Average dose H: 300 mg R: 450 mg Z: 1500 mg E: 750 mg | Average dose H: 225 mg R: 450 mg Z: 1200 mg E: 825 mg | Average dose H: 300 mg R: 450 mg Z: 1500 mg E: 750 mg | The study authors state: "The loose drug regimen contained higher dosages of H and Z and lower dosage for E compared to the FDCs". Drugs "were given under supervision at health facilities" during DOT. Self‐administered treatment was done the remaining days. | |
| Three different regimes were given4 | During the whole treatment | By weight categories | H: 250 mg R: 600 mg Z: 1500 mg S: 750 mg | H: 300 mg R: 600 mg Z: 1500 mg S: 750 mg | H: 300 mg R: 720 mg Z: 1800 mg S: 750 mg | H: 300 mg R: 600 mg Z: 2000 mg S: 750 mg | The supervision mechanism during DOT is not clear. And only mention: DOT was given "at the community health clinic". | |
| 2HRZE/4HRE | Treatment was given as TDO 5 days per week and self‐administered during weekends | By weight categories | H: 320 mg R: 480 mg Z: 1000 mg | H: 300 mg R: 450 mg Z: 1125 mg E: 900 mg | H: 400 mg R: 600 mg Z: 1250 mg | H: 300 mg R: 600 mg Z: 1500 mg E: 1200 mg | DOT was supervised by "health workers". The ethambutol dose in FDCs groups was not reported. | |
| 2HRZE/4HRE | During the intensive phase | By weight categories | 5H: 300 mg R: 480 mg Z: 1400 mg E: 1000 mg | H: 300 mg R: 450 mg Z: 1500 mg E: 1200 mg | 5H: 375 mg R: 600 mg Z: 1750 mg E: 1250 mg | H: 400 mg R: 600 mg Z: 2000 mg E: 1600 mg | The supervision mechanism during DOT is unclear and only mention: "directly observed therapy was followed for each patient on a daily basis". | |
| 2HRZ/4HR | During the intensive phase | By weight categories | H: 320 mg R: 400 mg Z: 1000 mg | H: 300 mg R: 450 mg Z: 1500 mg | H: 400 mg R: 600 mg Z: 1250 mg | H: 300 mg R: 600 mg Z: 1500 mg | The trial authors state: "All drugs were taken under close supervision of a health care provider". | |
| 2HRZ/4HR | Only for a part of participants6 | By weight categories | H: 320 mg R: 480 mg Z: 1000 mg | H: 300 mg R: 450 mg Z: 1500 mg | H: 320 mg R: 480 mg Z: 1000 mg | H: 300 mg R: 600 mg Z: 1500 mg | There were 3 kinds of treatment management combined with 3 supervision models. | |
| Abbreviations: kg: kilograms of body weight; H: isoniazid; R: rifampicin; Z: pyrazinamide; E: ethambutol; FDCs: fixed‐dose combinations; SDF: single‐dose formulations; mg: milligrams; DOT: directly‐observed treatment. 1In Lienhardt 2011 the treatment regimen was 8 weeks for intensive phase and 18 weeks for continuation phase. | ||||||||
| Fixed‐dose combinations (FDCs) compared to single‐drug formulations for treating newly diagnosed pulmonary tuberculosis (TB) | |||||
| Participant or population: treating pulmonary TB | |||||
| Outcomes | Illustrative comparative risks* (95% CI) | Relative effect | Number of participants | Quality of the evidence | |
| Assumed risk single‐drug formulations | Corresponding risk FDCs | ||||
| Combined endpoint of treatment failure, relapse, or death** | — | — | — | (0 RCTs) | — |
| Treatment failure | 22 per 1000 | 25 per 1000 | RR 1.17 | 2507 | ⊕⊕⊕⊝ |
| Relapse | 79 per 1000 | 88 per 1000 | RR 1.12 | 2293 | ⊕⊕⊕⊝ |
| Death | 9 per 1000 | 12 per 1000 | RR 1.35 | 2470 | ⊕⊕⊕⊝ |
| Sputum smear or culture conversion at end of treatment | 827 per 1000 | 802 per 1000 | RR 0.97 | 1159 | ⊕⊕⊕⊕ |
| Serious adverse events | 17 per 1000 | 25 per 1000 | RR 1.44 | 2703 | ⊕⊕⊕⊝ |
| Adverse events leading to discontinuation of therapy | 18 per 1000 | 30 per 1000 | RR 1.71 | 2703 | ⊕⊕⊕⊝ |
| *The risk in the intervention group (and its 95% CI) is based on the assumed risk in the comparison group and the relative effect of the intervention (and its 95% CI). | |||||
| GRADE Working Group grades of evidence | |||||
| 1We did not downgrade the quality due to inconsistency. I² statistic = 0%. | |||||
| Outcomes | Assumed risk | Clinically important reduction | Optimal sample size 1,2 | |
| Single‐drug formulations | Absolute | Relative | ||
| Treatment failure | 2.2 % | 0.5% | 25% | 6092 |
| Relapse | 2.3 % | 0.5% | 25% | 4718 |
| Death3 | 0.9 % | 0.1% | 4.5% | 737,340 |
| Sputum/culture conversion at end of treatment | 88.7% | 0.5% | 0.6% | 95,044 |
| Serious adverse events | 1.5 % | 0.1% | 6.7% | 12,356 |
| Adverse events leading to discontinuation of therapy | 4.1 % | 0.5% | 24.4% | 325,024 |
| 1We based all calculations are based on: 1‐sided tests, with a ratio of 1:1, power of 0.9, and confidence level of 0.05. | ||||
| Outcome or subgroup title | No. of studies | No. of participants | Statistical method | Effect size |
| 1 Treatment failure Show forest plot | 7 | 3606 | Risk Ratio (M‐H, Fixed, 95% CI) | 1.28 [0.82, 2.00] |
| 2 Relapse Show forest plot | 10 | 3621 | Risk Ratio (M‐H, Fixed, 95% CI) | 1.28 [1.00, 1.64] |
| 3 Death Show forest plot | 11 | 4800 | Risk Ratio (M‐H, Fixed, 95% CI) | 0.96 [0.67, 1.39] |
| 4 Sputum smear or culture conversion at 2 months of starting treatment Show forest plot | 13 | 4836 | Risk Ratio (M‐H, Fixed, 95% CI) | 1.01 [0.99, 1.03] |
| 5 Sputum smear or culture conversion at end of treatment (EOT) Show forest plot | 7 | 2319 | Risk Ratio (M‐H, Fixed, 95% CI) | 0.99 [0.96, 1.02] |
| 6 Treatment adherence at 8 weeks of starting treatment Show forest plot | 3 | 881 | Risk Ratio (M‐H, Random, 95% CI) | 1.04 [0.96, 1.12] |
| 7 Treatment adherence at EOT Show forest plot | 5 | 1229 | Risk Ratio (M‐H, Fixed, 95% CI) | 1.01 [0.97, 1.06] |
| 8 Acquisition of drug resistance Show forest plot | 3 | 491 | Risk Ratio (M‐H, Fixed, 95% CI) | 0.76 [0.15, 3.77] |
| 9 Patient satisfaction Show forest plot | 2 | Risk Ratio (M‐H, Fixed, 95% CI) | Subtotals only | |
| 9.1 General satisfaction | 1 | 222 | Risk Ratio (M‐H, Fixed, 95% CI) | 1.04 [0.97, 1.12] |
| 9.2 No problems on swallowing | 1 | 1023 | Risk Ratio (M‐H, Fixed, 95% CI) | 1.03 [1.00, 1.06] |
| 9.3 Convenient number of tablets | 1 | 1045 | Risk Ratio (M‐H, Fixed, 95% CI) | 1.50 [1.37, 1.64] |
| 9.4 Acceptable taste | 1 | 1044 | Risk Ratio (M‐H, Fixed, 95% CI) | 1.39 [1.27, 1.51] |
| 10 Serious adverse events Show forest plot | 6 | 3388 | Risk Ratio (M‐H, Fixed, 95% CI) | 1.45 [0.90, 2.33] |
| 11 Adverse events leading to discontinuation of therapy Show forest plot | 13 | 5530 | Risk Ratio (M‐H, Random, 95% CI) | 0.96 [0.56, 1.66] |
| 12 Other adverse events Show forest plot | 9 | 4639 | Risk Ratio (M‐H, Fixed, 95% CI) | 0.85 [0.72, 1.00] |
| Outcome or subgroup title | No. of studies | No. of participants | Statistical method | Effect size |
| 1 Treatment failure Show forest plot | 7 | 3606 | Risk Ratio (M‐H, Fixed, 95% CI) | 1.28 [0.82, 2.00] |
| 1.1 High or unclear risk of selection bias | 5 | 1099 | Risk Ratio (M‐H, Fixed, 95% CI) | 1.77 [0.67, 4.69] |
| 1.2 Low risk of selection bias | 2 | 2507 | Risk Ratio (M‐H, Fixed, 95% CI) | 1.17 [0.70, 1.93] |
| 2 Relapse Show forest plot | 10 | 3621 | Risk Ratio (M‐H, Fixed, 95% CI) | 1.28 [1.00, 1.64] |
| 2.1 High or unclear risk of selection bias | 8 | 1328 | Risk Ratio (M‐H, Fixed, 95% CI) | 2.84 [1.34, 6.00] |
| 2.2 Low risk of selection bias | 2 | 2293 | Risk Ratio (M‐H, Fixed, 95% CI) | 1.12 [0.86, 1.46] |
| 3 Death Show forest plot | 11 | 4800 | Risk Ratio (M‐H, Fixed, 95% CI) | 0.96 [0.67, 1.39] |
| 3.1 High or unclear risk of selection bias | 9 | 2330 | Risk Ratio (M‐H, Fixed, 95% CI) | 0.86 [0.57, 1.32] |
| 3.2 Low risk of selection bias | 2 | 2470 | Risk Ratio (M‐H, Fixed, 95% CI) | 1.35 [0.63, 2.93] |
| 4 Sputum smear or culture conversion at 2 months of starting treatment Show forest plot | 13 | 4836 | Risk Ratio (M‐H, Fixed, 95% CI) | 1.01 [0.99, 1.03] |
| 4.1 High or unclear risk of selection bias | 11 | 2507 | Risk Ratio (M‐H, Fixed, 95% CI) | 1.04 [1.01, 1.06] |
| 4.2 Low risk of selection bias | 2 | 2329 | Risk Ratio (M‐H, Fixed, 95% CI) | 0.99 [0.95, 1.02] |
| 5 Sputum smear or culture conversion at EOT Show forest plot | 7 | 2319 | Risk Ratio (M‐H, Fixed, 95% CI) | 0.99 [0.96, 1.02] |
| 5.1 High or unclear risk of selection bias | 6 | 1160 | Risk Ratio (M‐H, Fixed, 95% CI) | 1.00 [0.98, 1.03] |
| 5.2 Low risk of selection bias | 1 | 1159 | Risk Ratio (M‐H, Fixed, 95% CI) | 0.97 [0.92, 1.03] |
| 6 Acquisition of drug resistance Show forest plot | 3 | 491 | Risk Ratio (M‐H, Fixed, 95% CI) | 0.76 [0.15, 3.77] |
| 6.1 High or unclear risk of selection bias | 2 | 460 | Risk Ratio (M‐H, Fixed, 95% CI) | 0.64 [0.08, 4.79] |
| 6.2 Low risk of selection bias | 1 | 31 | Risk Ratio (M‐H, Fixed, 95% CI) | 1.07 [0.07, 15.57] |
| 7 Serious adverse events Show forest plot | 6 | 3388 | Risk Ratio (M‐H, Fixed, 95% CI) | 1.45 [0.90, 2.33] |
| 7.1 High or unclear risk of selection bias | 4 | 685 | Risk Ratio (M‐H, Fixed, 95% CI) | 1.47 [0.46, 4.71] |
| 7.2 Low risk of selection bias | 2 | 2703 | Risk Ratio (M‐H, Fixed, 95% CI) | 1.44 [0.86, 2.44] |
| 8 Adverse events leading to discontinuation of therapy Show forest plot | 13 | 5530 | Risk Ratio (M‐H, Random, 95% CI) | 0.96 [0.56, 1.66] |
| 8.1 High or unclear risk of selection bias | 11 | 2827 | Risk Ratio (M‐H, Random, 95% CI) | 0.67 [0.31, 1.43] |
| 8.2 Low risk of selection bias | 2 | 2703 | Risk Ratio (M‐H, Random, 95% CI) | 1.71 [1.04, 2.81] |
| 9 Other adverse events Show forest plot | 9 | 4639 | Risk Ratio (M‐H, Fixed, 95% CI) | 0.85 [0.72, 1.00] |
| 9.1 High or unclear risk of selection bias | 7 | 1936 | Risk Ratio (M‐H, Fixed, 95% CI) | 0.87 [0.71, 1.07] |
| 9.2 Low risk of selection bias | 2 | 2703 | Risk Ratio (M‐H, Fixed, 95% CI) | 0.82 [0.63, 1.07] |
| Outcome or subgroup title | No. of studies | No. of participants | Statistical method | Effect size |
| 1 Treatment failure (ITT analysis and all losses to follow‐up judged as failure) Show forest plot | 7 | 4004 | Risk Ratio (M‐H, Fixed, 95% CI) | 1.03 [0.93, 1.14] |
| 2 Relapse (ITT analysis and all losses to follow‐up judged as relapse) Show forest plot | 10 | 4716 | Risk Ratio (M‐H, Fixed, 95% CI) | 1.05 [0.95, 1.16] |
| 3 Sputum smear or culture conversion at 2 months of starting treatment (ITT analysis and all losses to follow‐up judged as conversion failure) Show forest plot | 13 | 5731 | Risk Ratio (M‐H, Fixed, 95% CI) | 1.00 [0.97, 1.03] |
| 4 Sputum smear or culture conversion at EOT (ITT analysis and all losses to follow‐up judged as conversion failure) Show forest plot | 7 | 2552 | Risk Ratio (M‐H, Fixed, 95% CI) | 0.99 [0.95, 1.02] |
| Outcome or subgroup title | No. of studies | No. of participants | Statistical method | Effect size |
| 1 Treatment failure Show forest plot | 7 | 3606 | Risk Ratio (M‐H, Fixed, 95% CI) | 1.28 [0.82, 2.00] |
| 1.1 Fixed‐dose combinations (FDCs) only at intensive phase | 1 | 307 | Risk Ratio (M‐H, Fixed, 95% CI) | 1.99 [0.18, 21.69] |
| 1.2 FDCs during all treatment | 6 | 3299 | Risk Ratio (M‐H, Fixed, 95% CI) | 1.26 [0.80, 1.99] |
| 2 Relapse Show forest plot | 10 | 3621 | Risk Ratio (M‐H, Fixed, 95% CI) | 1.28 [1.00, 1.64] |
| 2.1 FDCs only at intensive phase | 1 | 251 | Risk Ratio (M‐H, Fixed, 95% CI) | 3.94 [1.13, 13.78] |
| 2.2 FDCs during all treatment | 9 | 3370 | Risk Ratio (M‐H, Fixed, 95% CI) | 1.20 [0.93, 1.55] |
| 3 Death Show forest plot | 11 | 4800 | Risk Ratio (M‐H, Fixed, 95% CI) | 0.96 [0.67, 1.39] |
| 3.1 FDCs only at intensive phase | 1 | 271 | Risk Ratio (M‐H, Fixed, 95% CI) | 1.40 [0.50, 3.94] |
| 3.2 FDCs during all treatment | 10 | 4529 | Risk Ratio (M‐H, Fixed, 95% CI) | 0.91 [0.61, 1.35] |
| 4 Sputum smear or culture conversion at 2 months of starting treatment Show forest plot | 13 | 4836 | Risk Ratio (M‐H, Fixed, 95% CI) | 1.01 [0.99, 1.03] |
| 4.1 FDCs only at intensive phase | 1 | 269 | Risk Ratio (M‐H, Fixed, 95% CI) | 1.01 [0.96, 1.07] |
| 4.2 FDCs during all treatment | 12 | 4567 | Risk Ratio (M‐H, Fixed, 95% CI) | 1.01 [0.99, 1.03] |
| 5 Acquisition of drug resistance Show forest plot | 3 | 491 | Risk Ratio (M‐H, Fixed, 95% CI) | 0.76 [0.15, 3.77] |
| 5.1 FDCs only at intensive phase | 1 | 251 | Risk Ratio (M‐H, Fixed, 95% CI) | 0.36 [0.01, 8.70] |
| 5.2 FDCs during all treatment | 2 | 240 | Risk Ratio (M‐H, Fixed, 95% CI) | 1.06 [0.15, 7.24] |
| 6 Adverse events leading to discontinuation of therapy Show forest plot | 13 | 5530 | Risk Ratio (M‐H, Random, 95% CI) | 0.96 [0.56, 1.66] |
| 6.1 FDCs only at intensive phase | 1 | 271 | Risk Ratio (M‐H, Random, 95% CI) | 1.84 [0.55, 6.15] |
| 6.2 FDCs during all treatment | 12 | 5259 | Risk Ratio (M‐H, Random, 95% CI) | 0.87 [0.48, 1.59] |
| 7 Other adverse events Show forest plot | 9 | 4639 | Risk Ratio (M‐H, Fixed, 95% CI) | 0.85 [0.72, 1.00] |
| 7.1 FDCs only at intensive phase | 1 | 271 | Risk Ratio (M‐H, Fixed, 95% CI) | 1.05 [0.75, 1.48] |
| 7.2 FDCs during all treatment | 8 | 4368 | Risk Ratio (M‐H, Fixed, 95% CI) | 0.81 [0.67, 0.97] |
| Outcome or subgroup title | No. of studies | No. of participants | Statistical method | Effect size |
| 1 Treatment failure Show forest plot | 7 | 3606 | Risk Ratio (M‐H, Fixed, 95% CI) | 1.28 [0.82, 2.00] |
| 1.1 Daily medication for the whole treatment | 4 | 1517 | Risk Ratio (M‐H, Fixed, 95% CI) | 1.14 [0.63, 2.06] |
| 1.2 Daily medication at intensive phase followed by intermittent treatment at continuation phase | 3 | 2089 | Risk Ratio (M‐H, Fixed, 95% CI) | 1.49 [0.75, 2.96] |
| 2 Relapse Show forest plot | 10 | 3621 | Risk Ratio (M‐H, Fixed, 95% CI) | 1.28 [1.00, 1.64] |
| 2.1 Daily medication for the whole treatment | 7 | 1850 | Risk Ratio (M‐H, Fixed, 95% CI) | 1.12 [0.83, 1.50] |
| 2.2 Daily medication at intensive phase followed by intermittent treatment at continuation phase | 3 | 1771 | Risk Ratio (M‐H, Fixed, 95% CI) | 1.72 [1.07, 2.75] |
| 3 Death Show forest plot | 11 | 4800 | Risk Ratio (M‐H, Fixed, 95% CI) | 0.96 [0.67, 1.39] |
| 3.1 Daily medication for the whole treatment | 8 | 2859 | Risk Ratio (M‐H, Fixed, 95% CI) | 1.34 [0.79, 2.29] |
| 3.2 Daily medication at intensive phase followed by intermittent treatment at continuation phase | 3 | 1941 | Risk Ratio (M‐H, Fixed, 95% CI) | 0.69 [0.41, 1.16] |
| 4 Sputum smear or culture conversion at 2 months of starting treatment Show forest plot | 13 | 4836 | Risk Ratio (M‐H, Fixed, 95% CI) | 1.01 [0.99, 1.03] |
| 4.1 Daily medication for the whole treatment | 9 | 3001 | Risk Ratio (M‐H, Fixed, 95% CI) | 1.00 [0.98, 1.03] |
| 4.2 Daily medication at intensive phase followed by intermittent treatment at continuation phase | 4 | 1835 | Risk Ratio (M‐H, Fixed, 95% CI) | 1.02 [0.99, 1.05] |
| 5 Sputum smear or culture conversion at EOT Show forest plot | 7 | 2319 | Risk Ratio (M‐H, Fixed, 95% CI) | 0.99 [0.96, 1.02] |
| 5.1 Daily medication for the whole treatment | 6 | 1961 | Risk Ratio (M‐H, Fixed, 95% CI) | 0.99 [0.96, 1.02] |
| 5.2 Daily medication at intensive phase followed by intermittent treatment at continuation phase | 1 | 358 | Risk Ratio (M‐H, Fixed, 95% CI) | 1.00 [0.95, 1.05] |
| 6 Acquisition of drug resistance Show forest plot | 3 | 491 | Risk Ratio (M‐H, Fixed, 95% CI) | 0.76 [0.15, 3.77] |
| 6.1 Daily medication for the whole treatment | 1 | 209 | Risk Ratio (M‐H, Fixed, 95% CI) | 1.05 [0.07, 16.55] |
| 6.2 Daily medication at intensive phase followed by intermittent treatment at continuation phase | 2 | 282 | Risk Ratio (M‐H, Fixed, 95% CI) | 0.64 [0.09, 4.69] |
| 7 Serious adverse events Show forest plot | 6 | 3388 | Risk Ratio (M‐H, Fixed, 95% CI) | 1.45 [0.90, 2.33] |
| 7.1 Daily medication for the whole treatment | 4 | 1767 | Risk Ratio (M‐H, Fixed, 95% CI) | 1.60 [0.95, 2.68] |
| 7.2 Daily medication at intensive phase followed by intermittent treatment at continuation phase | 2 | 1621 | Risk Ratio (M‐H, Fixed, 95% CI) | 0.79 [0.21, 2.92] |
| 8 Adverse events leading to discontinuation of therapy Show forest plot | 13 | 5530 | Risk Ratio (M‐H, Random, 95% CI) | 0.96 [0.56, 1.66] |
| 8.1 Daily medication for the whole treatment | 9 | 3204 | Risk Ratio (M‐H, Random, 95% CI) | 0.78 [0.39, 1.59] |
| 8.2 Daily medication at intensive phase followed by intermittent treatment at continuation phase | 4 | 2326 | Risk Ratio (M‐H, Random, 95% CI) | 1.55 [0.74, 3.25] |
| 9 Other adverse events Show forest plot | 9 | 4639 | Risk Ratio (M‐H, Fixed, 95% CI) | 0.85 [0.72, 1.00] |
| 9.1 Daily medication for the whole treatment | 6 | 2747 | Risk Ratio (M‐H, Fixed, 95% CI) | 0.84 [0.70, 1.02] |
| 9.2 Daily medication at intensive phase followed by intermittent treatment at continuation phase | 3 | 1892 | Risk Ratio (M‐H, Fixed, 95% CI) | 0.86 [0.64, 1.18] |
| Outcome or subgroup title | No. of studies | No. of participants | Statistical method | Effect size |
| 1 Treatment failure Show forest plot | 6 | 2447 | Risk Ratio (M‐H, Fixed, 95% CI) | 1.46 [0.75, 2.84] |
| 1.1 Supervised treatment during the intensive phase | 4 | 1962 | Risk Ratio (M‐H, Fixed, 95% CI) | 1.27 [0.56, 2.89] |
| 1.2 Self‐administered treatment during the intensive phase | 2 | 485 | Risk Ratio (M‐H, Fixed, 95% CI) | 1.89 [0.59, 6.04] |
| 2 Relapse Show forest plot | 9 | 2676 | Risk Ratio (M‐H, Fixed, 95% CI) | 1.69 [1.09, 2.63] |
| 2.1 Supervised treatment during the intensive phase | 6 | 2318 | Risk Ratio (M‐H, Fixed, 95% CI) | 1.52 [0.94, 2.45] |
| 2.2 Self‐administered treatment during the intensive phase | 3 | 358 | Risk Ratio (M‐H, Fixed, 95% CI) | 2.93 [0.89, 9.59] |
| 3 Death Show forest plot | 10 | 3678 | Risk Ratio (M‐H, Fixed, 95% CI) | 0.82 [0.55, 1.22] |
| 3.1 Supervised treatment during the intensive phase | 6 | 2503 | Risk Ratio (M‐H, Fixed, 95% CI) | 0.89 [0.50, 1.58] |
| 3.2 Self‐administered treatment during the intensive phase | 4 | 1175 | Risk Ratio (M‐H, Fixed, 95% CI) | 0.76 [0.44, 1.32] |
| 4 Sputum smear or culture conversion at 2 months of starting treatment Show forest plot | 12 | 3677 | Risk Ratio (M‐H, Fixed, 95% CI) | 1.03 [1.01, 1.05] |
| 4.1 Supervised treatment during the intensive phase | 8 | 2584 | Risk Ratio (M‐H, Fixed, 95% CI) | 1.02 [0.99, 1.05] |
| 4.2 Self‐administered treatment during the intensive phase | 4 | 1093 | Risk Ratio (M‐H, Fixed, 95% CI) | 1.06 [1.01, 1.11] |
| 5 Sputum smear or culture conversion at EOT Show forest plot | 6 | 1160 | Risk Ratio (M‐H, Fixed, 95% CI) | 1.00 [0.98, 1.03] |
| 5.1 Supervised treatment during the intensive phase | 2 | 513 | Risk Ratio (M‐H, Fixed, 95% CI) | 1.01 [0.99, 1.04] |
| 5.2 Self‐administered treatment during the intensive phase | 4 | 647 | Risk Ratio (M‐H, Fixed, 95% CI) | 1.00 [0.97, 1.03] |
| 6 Treatment adherence at 8 weeks of starting treatment Show forest plot | 3 | 881 | Risk Ratio (M‐H, Random, 95% CI) | 1.04 [0.96, 1.12] |
| 6.1 Supervised treatment during the intensive phase | 1 | 142 | Risk Ratio (M‐H, Random, 95% CI) | 1.01 [0.97, 1.06] |
| 6.2 Self‐administered treatment during the intensive phase | 2 | 739 | Risk Ratio (M‐H, Random, 95% CI) | 1.09 [0.90, 1.31] |
| 7 Treatment adherence at EOT Show forest plot | 5 | 1229 | Risk Ratio (M‐H, Fixed, 95% CI) | 1.01 [0.97, 1.06] |
| 7.1 Supervised treatment during the intensive phase | 1 | 96 | Risk Ratio (M‐H, Fixed, 95% CI) | 1.04 [0.97, 1.11] |
| 7.2 Self‐administered treatment during the intensive phase | 4 | 1133 | Risk Ratio (M‐H, Fixed, 95% CI) | 1.01 [0.96, 1.06] |
| 8 Serious adverse events Show forest plot | 5 | 2266 | Risk Ratio (M‐H, Fixed, 95% CI) | 1.10 [0.46, 2.60] |
| 8.1 Supervised treatment during the intensive phase | 4 | 2056 | Risk Ratio (M‐H, Fixed, 95% CI) | 0.99 [0.40, 2.44] |
| 8.2 Self‐administered treatment during the intensive phase | 1 | 210 | Risk Ratio (M‐H, Fixed, 95% CI) | 3.17 [0.13, 77.05] |
| 9 Adverse events leading to discontinuation of therapy Show forest plot | 12 | 4408 | Risk Ratio (M‐H, Random, 95% CI) | 0.82 [0.43, 1.57] |
| 9.1 Supervised treatment during the intensive phase | 8 | 3121 | Risk Ratio (M‐H, Random, 95% CI) | 0.44 [0.11, 1.71] |
| 9.2 Self‐administered treatment during the intensive phase | 4 | 1287 | Risk Ratio (M‐H, Random, 95% CI) | 1.06 [0.55, 2.04] |
| 10 Other adverse events Show forest plot | 8 | 3517 | Risk Ratio (M‐H, Fixed, 95% CI) | 0.82 [0.68, 1.00] |
| 10.1 Supervised treatment during the intensive phase | 7 | 2979 | Risk Ratio (M‐H, Fixed, 95% CI) | 0.79 [0.64, 0.96] |
| 10.2 Self‐administered treatment during the intensive phase | 1 | 538 | Risk Ratio (M‐H, Fixed, 95% CI) | 2.56 [0.90, 7.23] |
| Outcome or subgroup title | No. of studies | No. of participants | Statistical method | Effect size |
| 1 Treatment failure Show forest plot | 7 | 3606 | Risk Ratio (M‐H, Fixed, 95% CI) | 1.28 [0.82, 2.00] |
| 1.1 Four drugs as FDCs during the intensive phase | 3 | 2941 | Risk Ratio (M‐H, Fixed, 95% CI) | 1.27 [0.80, 2.01] |
| 1.2 Three or 2 drugs as FDCs during the intensive phase | 4 | 665 | Risk Ratio (M‐H, Fixed, 95% CI) | 1.52 [0.26, 9.08] |
| 2 Relapse Show forest plot | 9 | 3523 | Risk Ratio (M‐H, Fixed, 95% CI) | 1.28 [1.00, 1.64] |
| 2.1 Four drugs as FDCs during the intensive phase | 4 | 2675 | Risk Ratio (M‐H, Fixed, 95% CI) | 1.18 [0.91, 1.54] |
| 2.2 Three or 2 drugs as FDCs during the intensive phase | 5 | 848 | Risk Ratio (M‐H, Fixed, 95% CI) | 2.55 [1.07, 6.06] |
| 3 Death Show forest plot | 11 | 4800 | Risk Ratio (M‐H, Fixed, 95% CI) | 0.96 [0.67, 1.39] |
| 3.1 Four drugs as FDCs during the intensive phase | 4 | 3002 | Risk Ratio (M‐H, Fixed, 95% CI) | 0.79 [0.48, 1.30] |
| 3.2 Three or 2 drugs as FDCs during the intensive phase | 7 | 1798 | Risk Ratio (M‐H, Fixed, 95% CI) | 1.21 [0.70, 2.10] |
| 4 Adverse events leading to discontinuation of therapy Show forest plot | 13 | 5530 | Risk Ratio (M‐H, Random, 95% CI) | 0.96 [0.56, 1.66] |
| 4.1 Four drugs as FDCs during the intensive phase | 4 | 3430 | Risk Ratio (M‐H, Random, 95% CI) | 1.21 [0.53, 2.78] |
| 4.2 Three or 2 drugs as FDCs during the intensive phase | 9 | 2100 | Risk Ratio (M‐H, Random, 95% CI) | 0.81 [0.37, 1.77] |
| 5 Sputum smear or culture conversion at EOT Show forest plot | 7 | 2319 | Risk Ratio (M‐H, Fixed, 95% CI) | 0.99 [0.96, 1.02] |
| 5.1 Four drugs as FDCs during the intensive phase | 2 | 1517 | Risk Ratio (M‐H, Fixed, 95% CI) | 0.98 [0.94, 1.02] |
| 5.2 Three or 2 drugs as FDCs during the intensive phase | 5 | 802 | Risk Ratio (M‐H, Fixed, 95% CI) | 1.01 [0.98, 1.03] |
| 6 Acquisition of drug resistance Show forest plot | 3 | 491 | Risk Ratio (M‐H, Fixed, 95% CI) | 0.76 [0.15, 3.77] |
| 6.1 Four drugs as FDCs during the intensive phase | 1 | 31 | Risk Ratio (M‐H, Fixed, 95% CI) | 1.07 [0.07, 15.57] |
| 6.2 Three or 2 drugs as FDCs during the intensive phase | 2 | 460 | Risk Ratio (M‐H, Fixed, 95% CI) | 0.64 [0.08, 4.79] |
| 7 Serious adverse events Show forest plot | 6 | 3388 | Risk Ratio (M‐H, Fixed, 95% CI) | 1.45 [0.90, 2.33] |
| 7.1 Four drugs as FDCs during the intensive phase | 3 | 2996 | Risk Ratio (M‐H, Fixed, 95% CI) | 1.34 [0.81, 2.23] |
| 7.2 Three or 2 drugs as FDCs during the intensive phase | 3 | 392 | Risk Ratio (M‐H, Fixed, 95% CI) | 2.59 [0.59, 11.34] |
| 8 Sputum smear or culture conversion at 2 months of starting treatment Show forest plot | 13 | 4836 | Risk Ratio (M‐H, Fixed, 95% CI) | 1.01 [0.99, 1.03] |
| 8.1 Four drugs as FDCs during the intensive phase | 4 | 2980 | Risk Ratio (M‐H, Fixed, 95% CI) | 1.00 [0.97, 1.03] |
| 8.2 Three or 2 drugs as FDCs during the intensive phase | 9 | 1856 | Risk Ratio (M‐H, Fixed, 95% CI) | 1.04 [1.01, 1.07] |
| 9 Other adverse events Show forest plot | 9 | 4639 | Risk Ratio (M‐H, Fixed, 95% CI) | 0.85 [0.72, 1.00] |
| 9.1 Four drugs as FDCs during the intensive phase | 3 | 2996 | Risk Ratio (M‐H, Fixed, 95% CI) | 0.81 [0.64, 1.02] |
| 9.2 Three or 2 drugs as FDCs during the intensive phase | 6 | 1643 | Risk Ratio (M‐H, Fixed, 95% CI) | 0.90 [0.71, 1.13] |