Niacin for primary and secondary prevention of cardiovascular events
Abstract
Background
Nicotinic acid (niacin) is known to decrease LDL‐cholesterol, and triglycerides, and increase HDL‐cholesterol levels. The evidence of benefits with niacin monotherapy or add‐on to statin‐based therapy is controversial.
Objectives
To assess the effectiveness of niacin therapy versus placebo, administered as monotherapy or add‐on to statin‐based therapy in people with or at risk of cardiovascular disease (CVD) in terms of mortality, CVD events, and side effects.
Search methods
Two reviewers independently and in duplicate screened records and potentially eligible full texts identified through electronic searches of CENTRAL, MEDLINE, Embase, Web of Science, two trial registries, and reference lists of relevant articles (latest search in August 2016).
Selection criteria
We included all randomised controlled trials (RCTs) that either compared niacin monotherapy to placebo/usual care or niacin in combination with other component versus other component alone. We considered RCTs that administered niacin for at least six months, reported a clinical outcome, and included adults with or without established CVD.
Data collection and analysis
Two reviewers used pre‐piloted forms to independently and in duplicate extract trials characteristics, risk of bias items, and outcomes data. Disagreements were resolved by consensus or third party arbitration. We conducted random‐effects meta‐analyses, sensitivity analyses based on risk of bias and different assumptions for missing data, and used meta‐regression analyses to investigate potential relationships between treatment effects and duration of treatment, proportion of participants with established coronary heart disease and proportion of participants receiving background statin therapy. We used GRADE to assess the quality of evidence.
Main results
We included 23 RCTs that were published between 1968 and 2015 and included 39,195 participants in total. The mean age ranged from 33 to 71 years. The median duration of treatment was 11.5 months, and the median dose of niacin was 2 g/day. The proportion of participants with prior myocardial infarction ranged from 0% (4 trials) to 100% (2 trials, median proportion 48%); the proportion of participants taking statin ranged from 0% (4 trials) to 100% (12 trials, median proportion 100%).
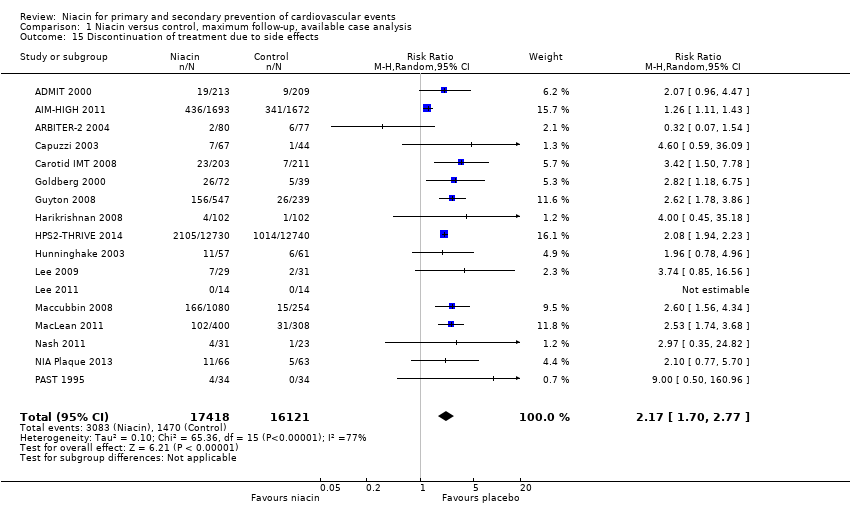
Using available cases, niacin did not reduce overall mortality (risk ratio (RR) 1.05, 95% confidence interval (CI) 0.97 to 1.12; participants = 35,543; studies = 12; I2 = 0%; high‐quality evidence), cardiovascular mortality (RR 1.02, 95% CI 0.93 to 1.12; participants = 32,966; studies = 5; I2 = 0%; moderate‐quality evidence), non‐cardiovascular mortality (RR 1.12, 95% CI 0.98 to 1.28; participants = 32,966; studies = 5; I2 = 0%; high‐quality evidence), the number of fatal or non‐fatal myocardial infarctions (RR 0.93, 95% CI 0.87 to 1.00; participants = 34,829; studies = 9; I2 = 0%; moderate‐quality evidence), nor the number of fatal or non‐fatal strokes (RR 0.95, 95% CI 0.74 to 1.22; participants = 33,661; studies = 7; I2 = 42%; low‐quality evidence). Participants randomised to niacin were more likely to discontinue treatment due to side effects than participants randomised to control group (RR 2.17, 95% CI 1.70 to 2.77; participants = 33,539; studies = 17; I2 = 77%; moderate‐quality evidence). The results were robust to sensitivity analyses using different assumptions for missing data.
Authors' conclusions
Moderate‐ to high‐quality evidence suggests that niacin does not reduce mortality, cardiovascular mortality, non‐cardiovascular mortality, the number of fatal or non‐fatal myocardial infarctions, nor the number of fatal or non‐fatal strokes but is associated with side effects. Benefits from niacin therapy in the prevention of cardiovascular disease events are unlikely.
PICOs
Plain language summary
Niacin for people with or without established cardiovascular disease
Review question
We reviewed the evidence about the effects of niacin for the prevention of death and cardiovascular disease.
Background
Heart attack and stroke are the most common causes of death, illness, disability and reduced quality of life in industrialised countries.
Niacin (nicotinic acid, vitamin B3) was considered a promising candidate to prevent cardiovascular disease because it is known to lower cholesterol in the blood, which is one of the main risk factors. Therefore, long‐term therapy with niacin was assumed to reduce the risk of heart attack, and stroke. We assessed whether clinical studies could show a benefit of taking niacin.
Study characteristics
We found 23 studies including 39,195 participants that compared niacin to placebo. The evidence is current up to August 2016. The majority of included participants were on average 65 years old and had already experienced a myocardial infarction. The participants took niacin or placebo for a period of between six months and five years. Seventeen out of 23 studies were fully or partially funded by the drug manufacturer with a commercial interest in the results of the studies.
Key results
Niacin did not reduce the number of deaths, heart attack or stroke. Many people (18%) had to stop taking niacin due to side effects. The results did not differ between participants who had or had not experienced a heart attack before taking niacin. The results did not differ between participants who were or were not taking a statin (another drug that prevents heart attack and stroke). The overall quality of evidence was moderate to high.
In summary, we found no evidence of benefits from niacin therapy.
Authors' conclusions
Summary of findings
| Niacin for primary and secondary prevention of cardiovascular events | ||||||
| Patient or population: people with or at risk of cardiovascular disease | ||||||
| Outcomes | Anticipated absolute effects* (95% CI) | Relative effect | № of participants | Quality of the evidence | Comments | |
| Risk with placebo | Risk with niacin | |||||
| Overall mortality | Study population | RR 1.05 | 35,543 | ⊕⊕⊕⊕ | High‐quality evidence that niacin does not reduce overall mortality (CI excludes clinically important benefit) | |
| 86 per 1000 | 90 per 1000 | |||||
| Cardiovascular mortality (follow‐up: 1 year to 5 years) | Study population | RR 1.02 | 32,966 | ⊕⊕⊕⊝ | Moderate‐quality evidence that niacin does not reduce cardiovascular mortality | |
| 63 per 1000 | 64 per 1000 | |||||
| Non‐cardiovascular mortality (follow‐up: 1 year to 5 years) | Study population | RR 1.12 | 32,966 | ⊕⊕⊕⊕ | High‐quality evidence that niacin does not reduce non‐cardiovascular mortality (CI excludes clinically important benefit) | |
| 24 per 1000 | 27 per 1000 | |||||
| Fatal or non‐fatal myocardial infarction (follow up: 0.5 years to 5 years) | Study population | RR 0.93 | 34,829 | ⊕⊕⊕⊝ | Moderate‐quality evidence that niacin does not reduce the number of fatal and non‐fatal myocardial infarctions | |
| 95 per 1000 | 90 per 1000 | |||||
| Fatal and non‐fatal stroke (follow‐up: 0.5 years to 5 years) | Study population | RR 0.95 | 33,661 | ⊕⊕⊝⊝ | Low‐quality evidence that niacin does not reduce the number of strokes | |
| 47 per 1000 | 45 per 1000 | |||||
| Discontinuation of treatment due to side effects (follow‐up: 0.5 years to 4 years) | Study population | RR 2.17 | 33,539 | ⊕⊕⊕⊝ | Moderate‐quality evidence that niacin does increase the number of participants discontinuing treatment due to side effects | |
| 91 per 1000 | 210 per 1000 | |||||
| *The risk in the intervention group (and its 95% confidence interval) is based on the assumed risk in the comparison group and the relative effect of the intervention (and its 95% CI). | ||||||
| GRADE Working Group grades of evidence | ||||||
| 1Confidence interval includes clinically relevant benefit and no benefit. We downgraded by one level due to imprecision. | ||||||
Background
Description of the condition
Cardiovascular disease (CVD) is the most common cause of death, illness, disability and reduced quality of life in industrialised countries (Thom 2006). Mortality data for 2011 show that CVD accounted for one of three deaths in the USA (approximately 800,000) (Mozaffarian 2015). One of the major risk factors for CVD is elevated low‐density lipoprotein cholesterol (LDL‐C). In individuals with elevated LDL‐C, statins (HMG CoA reductase inhibitors) are considered to be the first choice of pharmacological therapy, since they reduce CVD events and total mortality independently of baseline LDL‐C levels (4S 1994; Baigent 2005; Graham 2007; HCSBG 2002; Hooper 2001; Lestra 2005; Mills 2010). However, despite significant risk reduction with statin therapy, many cardiac events are not prevented. Moreover, some people are unable to tolerate or have contraindications to statin therapy. Therefore, further investigation of additional or alternative lipid‐lowering drug therapies is needed (Cannon 2008).
Description of the intervention
Nicotinic acid (niacin, vitamin B3) is a candidate to lower the remaining risk as it is known to decrease LDL‐C, triglycerides and lipoprotein (a). In addition, it is the most effective currently available drug to increase high‐density lipoprotein cholesterol (HDL‐C) levels by up to 35% (Birjmohun 2005; McKenney 2004; Singh 2007). Common side effects of niacin therapy include skin flushing (up to 71%), headache (8%), pruritus (6%) and gastrointestinal symptoms (10%) (Ballantyne 2008a; Ballantyne 2008b; Insull 2009; Karas 2008; Zhao 2004). Skin flushing often leads to discontinuation of niacin treatment, although it is a tachyphylactic phenomenon, that is, once the body compensates, it is most likely that the frequency and intensity of such episodes will decrease within days or weeks and may even go away completely. Therefore, strategies to reduce flushing were developed, including modified release preparations, administration of aspirin, and formulation with laropiprant. Glucose intolerance with or without overt diabetes is another potential side effect of niacin therapy and may require adjustment of antihyperglycaemic therapy (Grundy 2002).
How the intervention might work
A meta‐analysis published in 2006 and including 23 studies found that CVD event rates are reduced by nearly 1% for each 1% reduction in LDL‐C and by at least 1% for each 1% increase in HDL‐C, regardless of LDL‐C reduction (Brown 2006). These findings imply a significant benefit of HDL‐C‐raising therapy independent of LDL‐C reduction. However, a systematic review and meta‐regression analysis including 108 studies found no additional effect of raised HDL‐C levels on fatal or non‐fatal myocardial infarction or overall mortality when the analysis was adjusted for changes in LDL‐C levels (Briel 2009). A more recent meta‐regression analysis also raised doubt as to the proposed relationship between HDL‐C and risk of cardiac events (Hourcade‐Potelleret 2015).
Decision analytic computer models have been used to estimate the economic value in terms of costs per life years gained for niacin therapy in addition to existing lipid‐lowering therapy with statins. With incremental cost‐effectiveness ratios (ICER) between EUR 10,000 and EUR 20,000, add‐on niacin therapy was judged to be cost‐effective (Michailov 2011; Roze 2007). However, these models rely on the assumption of an additional outcome benefit due to raised HDL‐C levels, which is yet to be determined. Nevertheless, the cost of niacin treatment is generally considered to be low (Meyers 2003).
Why it is important to do this review
The evidence of CVD benefits with niacin therapy is controversial. Several randomised trials have investigated the efficacy and safety of niacin alone or in combination with other lipid‐modifying drugs, focusing mostly on surrogate end points like changes in lipid profiles or carotid intima‐media thickness as primary outcomes (e.g. Ballantyne 2008a; Canner 1986; JAMA 1975; Lee 2009; Maccubbin 2008; Moore 2007; Taylor 2004; Taylor 2009; Vaccari 2007). Several previous meta‐analyses investigated the effects of lipid‐modifying drugs and included niacin RCTs. However, these meta‐analyses were either not based on systematic reviews (Goldberg 2004, Guyton 2009a, Bays 2012a, McKenney 2010, McKenney 2015) or they included niacin combination therapy (i.e. niacin plus another agent) or active control groups (e.g. niacin versus other lipid‐modifying drugs) where it is impossible to discern any potentially incremental effects of niacin (Birjmohun 2005; Bruckert 2010; Charland 2010; Duggal 2010; Goldie 2015; Gould 2007; Keene 2014; Verdoia 2015). We identified only one previous systematic review and meta‐analysis that addressed explicitly the incremental effect of niacin on patient‐relevant outcomes: Ip 2015 assessed the effect of add‐on lipid‐modifying therapy on top of background statin treatment on major cardiovascular events. They included various comparisons but presented the subgroup of three RCTs that investigated the effect of niacin as add‐on therapy (AIM‐HIGH 2011; ARBITER‐2 2004; HPS2‐THRIVE 2014). None of the summary effects on clinical outcomes were significant. The risk ratio (RR) for all‐cause mortality was 1.10 (95% confidence interval (CI) 1.00 to 1.20, I2 = 0%), the RR for major cardiovascular events was 1.03 (95% CI 0.85 to 1.25, I2 = 48%), the RR for death from coronary heart disease was 1.07 (95% CI 0.94 to 1.21, I2 = 0%), the RR for myocardial infarction was 1.00 (95% CI 0.83 to 1.20, I2 = 29%), and the RR for stroke was 1.52 (CI 0.57 to 4.06. I2 = 11%) in favour of the placebo group. However, the meta‐analysis was limited to high risk patients taking background statin therapy and failed to discuss methodological limitations of included trials. The 2013 American College of Cardiology/American Heart Association guideline on the treatment of blood cholesterol to reduce atherosclerotic cardiovascular risk in adults recommends considering re‐emphasising adherence to lifestyle changes and to statin therapy before adding a non‐statin drug (ACC/AHA guideline 2013). The expert panel could not find any data supporting the routine use of non‐statin drugs combined with statin therapy to reduce cardiovascular events. In addition, no randomised controlled trials (RCTs) evaluating the effect of non‐statin drugs on cardiovascular outcomes in statin‐intolerant individuals were found.
Objectives
To assess the effectiveness of niacin therapy versus placebo administered as monotherapy or add‐on to statin‐based therapy in people with or at risk of cardiovascular (CVD) disease in terms of mortality, CDV events, and side effects.
Methods
Criteria for considering studies for this review
Types of studies
We included RCTs (published and unpublished) that documented an outcome of interest and had a treatment time (and thus follow‐up) of at least six months.
Types of participants
Adults 18 years or older with or without established CVD disease.
Types of interventions
-
Combination therapy including niacin plus other lipid‐modifying drug(s) versus other lipid‐modifying drug(s) alone for at least six months
-
Niacin monotherapy versus placebo or usual care for at least six months
Types of outcome measures
Primary outcomes
-
Overall mortality
Secondary outcomes
-
Fatal myocardial infarction (including sudden death)
-
Cardiovascular mortality (any death from cardiac or vascular cause)
-
Non‐cardiovascular mortality
-
Non‐fatal myocardial infarction
-
Fatal or non‐fatal myocardial infarction
-
Fatal or non‐fatal stroke
-
Revascularisation procedures (bypass grafts, angioplasty)
-
Patient‐perceived quality of life (only measured using validated scales)
-
Side effects, that is, skin flushing, pruritus, rash, headache, gastrointestinal symptoms, new onset of diabetes
-
Discontinuation of treatment due to side effects
-
Information on costs
Search methods for identification of studies
Electronic searches
We searched the following databases on 23 August 2016: Cochrane Central Register of Controlled Trials (CENTRAL, 2016, Issue 7) in the Cochrane Library, 'Epub Ahead of Print, In‐Process & Other Non‐Indexed Citations, MEDLINE Daily and MEDLINE' (Ovid, 1946 to 23 August 2016), 'Embase Classic and Embase' (Ovid, 1947 to 2016 August 22), and Web of Science (Thomson Reuters, 1970 to 23 August 2016).
When searching MEDLINE and Embase we used the Cochrane sensitivity‐maximising filter for RCTs (Lefebvre 2011) and an adaptation of it for Web of Science. The search strategies used can be found in Appendix 1. No date or language restrictions were imposed.
Searching other resources
We further screened reference lists of included studies, published editorials, and previous systematic reviews or meta‐analysis reviews on the topic (Bays 2012a; Birjmohun 2005; Bruckert 2010; Charland 2010; Duggal 2010; Goldberg 2004; Gould 2007; Guyton 2009a; Hourcade‐Potelleret 2015; Ip 2015; Keene 2014; McKenney 2010; McKenney 2015; Robinson 2009a; Singh 2007; Verdoia 2015).
In addition, we searched clinical trials registries in August 2016, (ClinicalTrials.gov and www.isrctn.com) for additional eligible studies and additional publications of included RCTs. We searched registries using synonyms for niacin ("niacin", "nicotinic", "vitamin B").
Data collection and analysis
Selection of studies
Investigators, working in teams of two (SS, AN), independently reviewed potentially eligible titles and abstracts. If either reviewer believed the study to be eligible, we obtained the full report. After obtaining full reports of the candidate studies (either in full peer‐reviewed publication or press article) the two reviewers independently assessed eligibility from full‐text papers. Discrepancies were resolved by reviewers’ consensus or, if needed, third party arbitration.
Data extraction and management
Two reviewers (SS and AN) used pre‐piloted forms to independently extract all relevant data on baseline characteristics of trials, participant populations, and outcomes. Any disagreements between reviewers were resolved by consensus.
Assessment of risk of bias in included studies
Working in teams of two, we independently assessed the quality of each included trial with respect to random sequence generation, concealment of treatment allocation, blinding of participants, caregivers, or assessors of clinical outcomes, completeness of follow‐up (Jüni 1999), and selective reporting of outcomes (Higgins 2011a). The results are presented as risk of bias tables as outlined in the Cochrane Handbook for Systematic Reviews of Interventions (Higgins 2011a). Possible disagreement was resolved by consensus or third party arbitration if needed. We explored the influence of risk of bias on the primary outcome in a sensitivity analysis excluding RCTs with high or unclear risk of bias.
Measures of treatment effect
Ratio of risk for harmful events (risk ratio) and accompanying 95% confidence intervals.
Assessment of reporting biases
We checked for outcome reporting bias by comparing reported outcomes to outcomes mentioned in corresponding trial protocols (provided they were published prospectively) or trial registry records (provided the trial was registered prospectively). We investigated the presence of publication bias by means of funnel plots (Egger 1997; Sterne 2001).
Data synthesis
We used random‐effects model meta‐analyses to calculate a weighted average of risk ratios across studies for all outcomes. We did not assume that all studies measure the same underlying true effect (that is, fixed‐effect across studies) since we included primary and secondary prevention studies, and studies with and without background statin treatment. If a study reported more than one eligible comparison, we pooled the intervention arms and the control arms of the eligible comparisons. Whenever possible, we analysed participants as randomised irrespective of adherence to treatment. However, some studies excluded protocol violators from the follow‐up or reported analysis. In that case, we also excluded them from our primary analysis, which was based on available cases. We considered available case analysis as our primary analysis because the underlying assumption is that missing data occurred at random. The commonly reported approach of using all randomised participants as a denominator for risks implicitly assumes no event for missing data which is less realistic than missing at random. We conducted all analyses using Review Manager 5 (RevMan 5) (RevMan 2014) and Stata 13 (stata.com).
In our analyses we made the following assumptions:
-
If the denominator for available cases was not explicitly reported, we calculated the denominator by subtracting lost to follow‐up from all randomised participants. For outcomes for which lost to follow‐up was not reported, we assumed the available case denominator as reported or calculated for other outcomes. If the denominator differed by outcomes, we used the smallest.
-
If a binary outcome was reported, both as a component of a composite endpoint (first occurrence) and as an independent outcome, we preferred the independent outcome in order to prevent bias due to competing risks.
-
If myocardial infarction was not explicitly defined as fatal or non‐fatal, we counted the events as 'fatal or non‐fatal myocardial infarction' only. We used the same strategy for undefined stroke.
-
If a specific side effect was reported both as 'discontinuation of treatment due to side effect' and 'experience of side effect', we preferred the latter in order to avoid assessment bias.
-
If a specific side effect was only reported in combination with another side effect but not as an individual component (e.g. 'flushing or pruritus') we used the combined outcome in the meta‐analysis of the individual component that occurred more frequently in other studies that reported both components. For example, if a study reported the outcome 'flushing or pruritus' we used 'flushing' in the meta‐analysis because flushing occurred more frequently in other studies that reported both components separately.
-
If several subcategories of an outcome (e.g. 'diarrhoea' as subcategory of 'gastrointestinal side effects') were reported but were not mutually exclusive, we assumed the outcome with the most events to represent the superordinate category. For instance, in a study that reported the outcomes 'diarrhoea' and 'vomiting', and 'diarrhoea' had more events than 'vomiting', we considered 'diarrhoea' to represent 'gastrointestinal side effects'.
-
If a study reported that a participant was withdrawn from the study, but did not explicitly state whether the participant was withdrawn from the intervention (non‐adherent) or from the follow‐up (missing outcome data), we assumed withdrawal from follow‐up.
Subgroup analysis and investigation of heterogeneity
We tested for heterogeneity with Cochrane’s Q‐test (Deeks 2011; Higgins 2002) and used I2 (Higgins 2003) to measure inconsistency of treatment effects across primary and secondary outcomes. We conducted inverse variance‐weighted meta‐regression analysis (Thompson 1999) to investigate any association between the outcomes and duration of niacin therapy, proportion of participants with established coronary heart disease, and proportion of participants receiving background statin therapy.
Sensitivity analysis
We conducted sensitivity analyses for all outcomes by assuming three different relationships between outcomes of missing and observed participants (Higgins 2008; command "metamiss" in Stata, Table 1 (stata.com)). Therefore, we specified the informative missingness odds ratio (IMOR = odds of event in missing data/odds of event in observed data) and specified a distribution of the assumed relationship of the standard deviation (logIMOR = 0.5) to account for the uncertainty of this assumption. For the first sensitivity analysis, we assumed missingness at random (IMOR 1.0 in each arm) that results in similar point estimates for the individual trials but may change the summary estimate by down‐weighting studies with high proportions of missing data. In the second sensitivity analysis, we assumed a lower IMOR of 0.5 in the niacin arms and a higher IMOR of 2.0 in the control arms, thereby shifting the estimate in favour of niacin treatment. In a third sensitivity analysis, we assumed an IMOR of 2.0 in the intervention arms and an IMOR of 0.5 in the niacin arms thereby shifting the estimate in favour of the control treatment. We did draw forest plots given the minimal differences and large number of sensitivity analyses. For the primary outcome, we also conducted a sensitivity analysis restricting the analysis to trials with low risk of bias.
| Outcome | Available case analysis | IMOR 1.0, 1.0* | IMOR 0.5, 2.0* | IMOR 2.0, 0.5* | ||||
| RR (95% CI) | I2 | RR (95% CI) | I2 | RR (95% CI) | I2 | RR (95% CI) | I2 | |
| Overall mortality | 1.05 (0.97 to 1.12) | 0% | 1.05 (0.97 to 1.12) | 0% | 1.04 (0.96 to 1.11) | 0% | 1.06 (0.98 to 1.14) | 0% |
| Cardiovascular mortality | 1.02 (0.93 to 1.12) | 0% | 1.02 (0.93 to 1.12) | 0% | 1.01 (0.92 to 1.11) | 0% | 1.03 (0.94 to 1.13) | 0% |
| Non‐cardiovascular mortality | 1.12 (0.98 to 1.28) | 0% | 1.12 (0.98 to 1.28) | 0% | 1.11 (0.97 to 1.27) | 0% | 1.14 (1.00 to 1.30) | 0% |
| Fatal or non‐fatal myocardial infarction | 0.93 (0.87 to 1.00) | 0% | 0.93 (0.87 to 1.00) | 0% | 0.92 (0.86 to 0.99) | 0% | 0.96 (0.87 to 1.05) | 14% |
| Fatal myocardial infarction | 1.01 (0.91 to 1.11) | 0% | 1.01 (0.91 to 1.11) | 0% | 1.00 (0.90 to 1.10) | 0% | 1.02 (0.92 to 1.12) | 0% |
| Non‐fatal myocardial infarction | 0.91 (0.77 to 1.07) | 53% | 0.91 (0.77 to 1.07) | 53% | 0.89 (0.76 to 1.05) | 47% | 0.92 (0.77 to 1.10) | 57% |
| Fatal or non‐fatal stroke | 0.95 (0.74 to 1.22) | 42% | 0.95 (0.74 to 1.22) | 42% | 0.94 (0.73 to 1.21) | 42% | 0.97 (0.75 to 1.26) | 42% |
| Revascularisation | 0.85 (0.68 to 1.06) | 45% | 0.85 (0.68 to 1.06) | 45% | 0.83 (0.66 to 1.04) | 48% | 0.88 (0.69 to 1.09) | 47% |
| Discontinuation of treatment due to side effects | 2.16 (1.70 to 2.76) | 77% | 2.15 (1.68 to 2.74) | 75% | 1.96 (1.55 to 2.49) | 73% | 2.35 (1.82 to 3.03) | 77% |
| Flushing | 7.69 (4.15 to 14.26) | 91% | 7.66 (4.11 to 14.29) | 91% | 6.68 (3.54 to 12.58) | 91% | 8.61 (4.67 to 15.87) | 90% |
| Rash | 3.16 (1.96 to 5.12) | 52% | 3.14 (1.93 to 5.10) | 51% | 2.74 (1.80 to 4.19) | 40% | 3.69 (2.13 to 6.40) | 60% |
| Pruritus | 5.15 (2.62 to 10.13) | 67% | 5.21 (2.68 to 10.13) | 62% | 4.23 (1.94 to 9.23) | 72% | 6.48 (3.78 to 11.10) | 46% |
| Gastrointestinal symptoms | 1.69 (1.37 to 2.09) | 62% | 1.69 (1.36 to 2.11) | 60% | 1.53 (1.23 to 1.91) | 59% | 1.88 (1.48 to 2.39) | 66% |
| Headache | 1.41 (0.86 to 2.30) | 0% | 1.43 (0.83 to 2.46) | 0% | 1.14 (0.64 to 2.03) | 0% | 1.76 (1.05 to 2.97) | 0% |
CI: confidence interval; IMOR: informative missingness odds ratio; RR: risk ratio
Sensitivity analysis for random‐effects meta‐analysis assuming different relationship between the outcomes from observed and missing participants and accounting for the uncertainty introduced by the proportion of missing data and assumed relationship (informative missingness odds ratio, IMOR = odds of event in missing data/odds of event in observed data, SD(logIMOR) = 0.5). We used the “metamiss”‐command in Stata (version 13) (stata.com).
*The two numbers represent the assumed IMORs for the niacin and the control arm, respectively: 1.0, 1.0: missing at random; 0.5, 2.0: assumption favours niacin, 2.0, 0.5: assumption favours control.
We could not conduct sensitivity analysis for the outcome 'new onset diabetes' because the proportion of missing data was not reported.
'Summary of findings' table
We created a 'Summary of findings' table using the following outcomes: overall mortality, cardiovascular mortality, non‐cardiovascular mortality, fatal or non‐fatal myocardial infarction, fatal or non‐fatal stroke, and discontinuation of treatment due to side effects. We used the five GRADE considerations (risk of bias, inconsistency, imprecision, indirectness and publication bias) to assess the quality of a body of evidence. We used methods and recommendations described in Section 8.5 (Higgins 2011a) and Chapter 12 (Schünemann 2011) of the Cochrane Handbook for Systematic Reviews of Interventions using GRADEpro GDT 2014 software. We used footnotes to justify all decisions to downgrade the quality of evidence.
Results
Description of studies
Results of the search
The search yielded 5631 unique records. We screened the full texts of 382 potentially eligible articles and finally included 23 RCTs (reported in 75 references) in our analysis (Figure 1; Characteristics of included studies). We excluded 307 articles including 65 RCTs involving niacin treatment that did not fulfil our eligibility criteria (Excluded studies).

Study flow diagram
Included studies
Methodology
We included 23 RCTs that were published between 1968 and 2015. In total, we included 39,195 participants. The median duration of treatment was 11.5 months. Of the 23 RCTs, there was one prospectively published protocol (Heart positive 2011) and five retrospectively published protocols (after end of recruitment) (ADMIT 2000; AIM‐HIGH 2011; CDP 1975; HPS2‐THRIVE 2014; Hunninghake 2003); 12 (52%) RCTs were registered in a clinical trials registry (all ClinicalTrials.gov). Pharmaceutical companies were mentioned as the only funding source in ten RCTs (ADMIT 2000; Capuzzi 2003; Carotid IMT 2008; Goldberg 2000; Guyton 2008; HPS2‐THRIVE 2014; Hunninghake 2003; Lee 2009; Maccubbin 2008; MacLean 2011) and provided partial funding in another seven RCTs (ARBITER‐2 2004; Harikrishnan 2008; Lee 2011; Linke 2009; Nash 2011; NIA Plaque 2013; Schoch 1968); four RCTs were explicitly not industry funded (AIM‐HIGH 2011; ALPINE‐SVG 2015; CDP 1975; Heart positive 2011) and funding was not disclosed in two RCTs (PAST 1995; Sang 2009).
Populations
Mean age ranged from 33 to 71 years across individual trials. Most trials included more men than women, two trials included as many women as men and only one trial (MacLean 2011) included more women than men. In two RCTs, all participants had experienced a prior myocardial infarction (CDP 1975; Schoch 1968) (secondary prevention trials). Four trials explicitly excluded people with prior myocardial infarction (Capuzzi 2003; Heart positive 2011; Linke 2009; Nash 2011) (primary prevention trials). In the remaining trials (mixed prevention trials), the proportion of individuals with prior myocardial infarction was in the range of 9% to 89% (ADMIT 2000; AIM‐HIGH 2011; ALPINE‐SVG 2015; ARBITER‐2 2004; Guyton 2008; Harikrishnan 2008; HPS2‐THRIVE 2014; Lee 2009; Lee 2011; NIA Plaque 2013; PAST 1995; Sang 2009) or was not reported in four trials (Carotid IMT 2008; Goldberg 2000; Hunninghake 2003; MacLean 2011).
Of the 23 included RCT populations, 16 (70%) received therapy with statin (ADMIT 2000; AIM‐HIGH 2011; ALPINE‐SVG 2015; ARBITER‐2 2004; Capuzzi 2003; Carotid IMT 2008; Guyton 2008; Harikrishnan 2008; HPS2‐THRIVE 2014; Hunninghake 2003; Lee 2009; Lee 2011; Maccubbin 2008; MacLean 2011; NIA Plaque 2013; Sang 2009). The proportions of individuals receiving statin therapy ranged from 67% to 100%. Statin therapy was part of the randomised interventions in eight RCTs, part of inclusion criteria in three RCTs, and part of allowed background therapy in five RCTs. The proportion of individuals receiving statins was 0% in four RCTs and not reported in three RCTs.
Most trials recruited participants in North America (ADMIT 2000; AIM‐HIGH 2011; ARBITER‐2 2004; Capuzzi 2003; CDP 1975; Goldberg 2000; Guyton 2008; Heart positive 2011; Hunninghake 2003; Nash 2011; NIA Plaque 2013; Schoch 1968), followed by Europe (Lee 2009; Linke 2009; PAST 1995), Asia (Harikrishnan 2008; Lee 2011; Sang 2009), or recruited world‐wide (Carotid IMT 2008; HPS2‐THRIVE 2014; Maccubbin 2008; MacLean 2011). Most studies did not report on the healthcare setting; four included participants in tertiary care (ALPINE‐SVG 2015; ARBITER‐2 2004; Capuzzi 2003; Harikrishnan 2008), one in secondary care (NIA Plaque 2013), and three from mixed healthcare settings (ADMIT 2000; Heart positive 2011; HPS2‐THRIVE 2014).
Interventions
The included trials administered a median dose of niacin of 2 g/day (range 0.5 g/day to 4.0 g/day) and the duration of treatment ranged between six months and six years. Nineteen trials applied one or more methods to reduce skin flushing due to niacin intake: Ten trials used an extended‐release formula (ALPINE‐SVG 2015; Capuzzi 2003; Goldberg 2000; HPS2‐THRIVE 2014; Linke 2009; Maccubbin 2008; MacLean 2011; Nash 2011; NIA Plaque 2013; Sang 2009), four trials combined niacin with laropiprant (Carotid IMT 2008; HPS2‐THRIVE 2014; Maccubbin 2008; MacLean 2011), ten trials gave aspirin prior to intake of niacin (AIM‐HIGH 2011; ARBITER‐2 2004; Goldberg 2000; Harikrishnan 2008; Hunninghake 2003; Lee 2009; Linke 2009; Maccubbin 2008; MacLean 2011; Nash 2011) and nine trials recommended intake at bedtime to reduce flushing, some together with a snack (AIM‐HIGH 2011; ARBITER‐2 2004; Capuzzi 2003; Goldberg 2000; Guyton 2008; Hunninghake 2003; Lee 2009; Maccubbin 2008; Nash 2011). Four trials (ADMIT 2000; ALPINE‐SVG 2015; AIM‐HIGH 2011; Heart positive 2011) applied a placebo that contained a minimal dose of niacin, enough to trigger skin flushes but with no effect on lipid levels, in order to prevent unblinding due to flushing.
Table 2 provides an overview of the change in lipid parameters associated with niacin therapy for each included RCT. Niacin increased the concentration of HDL‐C and decreased the concentration of triglycerides in all studies that reported these data. Niacin decreased the concentrations of LDL‐C and total cholesterol in most studies.
| Study | Niacin dose g/day | Follow‐up in months | Total cholesterol | LDL‐cholesterol | HDL‐cholesterol | Triglycerides |
| Baseline mean, | ||||||
| 3 | 11 | 214 (‐4) | 138 (‐6) | 41 (+11) | 176 (‐34) | |
| 2 | 38 | NA (NA) | 74 (‐3) | 35 (+10) | 165 (‐21) | |
| 2 | 12 | 136 (+1) | 69 (+2) | 38 (+3) | 158 (‐19) | |
| 1 | 12 | 158 (+6) | 89 (+3) | 40 (+8) | 163 (‐12) | |
| 2 | 6 | 262 (+3) | 146 (+6) | 36 (+6) | 377 (‐6) | |
| 2 | 18 | 237 (‐6) | 154 (‐9) | 42 (+6) | 201 (‐16) | |
| 3 | 72 | 249 (‐20) | NA (NA) | NA (NA) | NA (NA) | |
| 3 | 6 | 300 (‐31) | 216 (‐48) | 45 (+8) | 191 (NA) | |
| 2 | 6 | 241 (‐4) | 156 (‐9) | 51 (+11) | 159 (‐30) | |
| 1.5 | 9 | 178 (‐9) | 112 (‐11) | 35 (+5) | 157 (‐5) | |
| 2 | 6 | 211 (‐7) | NA (NA) | 39 (+5) | 306 (‐25) | |
| 2 | 23 | 128 (‐5) | 63 (‐10) | 43 (+6) | 124 (‐33) | |
| 2 | 6 | NA (NA) | 188 (‐10) | 44 (+24) | 197 (‐23) | |
| 2 | 12 | 157 (+1) | 85 (‐15) | 38 (+22) | 180 (‐7) | |
| 1 | 9 | 198 (NA) | 122 (NA) | 49 (NA) | 160 (NA) | |
| 1 | 6 | 218 (+4) | 133 (‐9) | 33 (+5) | 154 (‐29) | |
| 2 | 6 | 192 (‐9) | 223 (‐20) | 52 (+22) | 122 (‐57) | |
| 2 | 8 | 127 (NA) | 164 (‐33) | 86 (+21) | 50 (‐15) | |
| 2 | 12 | 178 (‐15) | 118 (‐22) | 33 (+8) | 141 (‐21) | |
| 1.5 | 18 | 172 (0) | 90 (‐4) | 60 (+8) | 130 (‐26) | |
| 0.5 | 36 | 243 (‐8) | 169 (‐13) | 42 (+1) | 162 (‐25) | |
| 1 | 12 | 183 (NA) | 105 (NA) | 50 (NA) | 147 (NA) | |
| 4 | 38 | 242 (‐34) | NA (NA) | NA (NA) | NA (NA) | |
NA: not available
Comparisons
Of the 23 RCTs, 14 had a placebo for niacin in the control group (ADMIT 2000; ALPINE‐SVG 2015; AIM‐HIGH 2011; ARBITER‐2 2004; Carotid IMT 2008; CDP 1975; Goldberg 2000; HPS2‐THRIVE 2014; Lee 2009; Maccubbin 2008; MacLean 2011; Nash 2011; NIA Plaque 2013; Schoch 1968). The remaining nine RCTs administered standard treatment without a specific placebo for niacin (Capuzzi 2003; Guyton 2008; Harikrishnan 2008; Heart positive 2011; Hunninghake 2003; Lee 2011; Linke 2009; PAST 1995; Sang 2009).
Outcomes
Ten trials specified a serum lipid parameter as their primary outcome (Capuzzi 2003; Goldberg 2000; Guyton 2008; Heart positive 2011; Hunninghake 2003; Maccubbin 2008; MacLean 2011; Nash 2011; Sang 2009; Schoch 1968), seven trials an angiographic outcome (AIM‐HIGH 2011; ALPINE‐SVG 2015; Carotid IMT 2008; Lee 2009; Lee 2011; NIA Plaque 2013; PAST 1995), two trials a composite of cardiovascular events (AIM‐HIGH 2011; HPS2‐THRIVE 2014), one trial feasibility (ADMIT 2000), and another trial overall mortality (CDP 1975). Two trials did not specify a primary outcome (Harikrishnan 2008; Linke 2009).
Of the 23 RCTs, 12 (52%) reported the outcome overall mortality, the primary outcome of the present systematic review. Of these, five specified overall mortality explicitly as an outcome (AIM‐HIGH 2011; ARBITER‐2 2004; CDP 1975; HPS2‐THRIVE 2014; Schoch 1968) while the remaining seven studies reported overall mortality under safety/adverse events (Goldberg 2000; Hunninghake 2003; Maccubbin 2008; MacLean 2011; NIA Plaque 2013; PAST 1995; Sang 2009).
None of the included studies reported information about quality of life or costs.
Excluded studies
Overall, we excluded 65 RCT reports that involved niacin treatment but did not report a comparison of interest (36 RCT reports), had a follow‐up shorter than six months (21 RCT reports), or reported no ocutome of interest (8 RCT reports) (see Characteristics of excluded studies).
Risk of bias in included studies
Figure 2 and Figure 2 provide an overview of the risk of bias in individual studies.
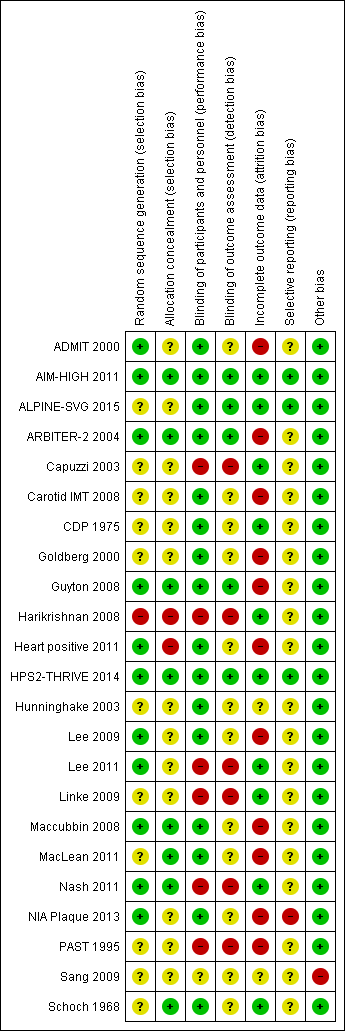
Risk of bias summary: review authors' judgements about each risk of bias item for each included study
Allocation
Eleven trials reported a method to generate the random sequence (low risk of bias), 11 trials did not report the method of random sequence generation (unclear risk of bias), and one trial used quasi randomisation (high risk of bias) (Figure 2).
Eight trials reported an adequate method to conceal allocation (low risk of bias), 13 trials reported no method (unclear risk of bias), and two trials did clearly not conceal allocation (high risk of bias) (Figure 2)..
Blinding
Sixteen trials were reported as double‐blind (low risk of performance bias), five as open‐label and one as single‐blind (high risk of performance bias), and the blinding status of participants and study personnel remained unclear in one trial (unclear risk of performance bias) (Figure 2).
Outcome assessment was blinded in five trials (low risk of detection bias), not mentioned in 12 trials (unclear risk of detection bias), and unblinded in six trials (high risk of detection bias) (Figure 2).
Incomplete outcome data
We judged the risk of attrition bias as high in 11 trials (proportion of missing data > 10%, or ratio events/missing < 1), unclear in two studies, and low in the remaining 10 studies (Figure 2). The median proportion of missing data in the 12 trials that reported overall mortality was 25% in the intervention arms and 19% in the control arm (Table 3). None of the included trials mentioned a sensitivity analysis for missing outcome data with respect to the clinical outcomes.
| Study | Outcome | Niacin group | Control group | ||||||
| Randomised | Complete | Missing | Events | Randomised | Complete | Missing | Events | ||
| Discontinuation of treatment due to side effects | 237 | 213 | 24 | 19 | 231 | 209 | 22 | 9 | |
| Fatal myocardial infarction | 1718 | 1693 | 25 | 38 | 1696 | 1672 | 24 | 34 | |
| Non‐cardiovascular mortality | 1718 | 1693 | 25 | 51 | 1696 | 1672 | 24 | 44 | |
| Fatal or non‐fatal myocardial infarction | 1718 | 1693 | 25 | 112 | 1696 | 1672 | 24 | 106 | |
| Cardiovascular mortality | 1718 | 1693 | 25 | 45 | 1696 | 1672 | 24 | 38 | |
| Overall mortality | 1718 | 1693 | 25 | 96 | 1696 | 1672 | 24 | 82 | |
| Non‐fatal myocardial infarction | 1718 | 1693 | 25 | 104 | 1696 | 1672 | 24 | 93 | |
| Revascularisation procedures | 1718 | 1693 | 25 | 167 | 1696 | 1672 | 24 | 168 | |
| Fatal or non‐fatal stroke | 1718 | 1693 | 25 | 30 | 1696 | 1672 | 24 | 18 | |
| Flushing | 1718 | 1693 | 25 | 104 | 1696 | 1672 | 24 | 43 | |
| Gastrointestinal symptoms | 1718 | 1693 | 25 | 26 | 1696 | 1672 | 24 | 12 | |
| Discontinuation of treatment due to side effects | 1718 | 1693 | 25 | 436 | 1696 | 1672 | 24 | 341 | |
| Flushing | 87 | 78 | 9 | 54 | 80 | 71 | 9 | 9 | |
| Overall mortality | 87 | 78 | 9 | 1 | 80 | 71 | 9 | 2 | |
| Cardiovascular mortality | 87 | 78 | 9 | 1 | 80 | 71 | 9 | 2 | |
| Non‐cardiovascular mortality | 87 | 78 | 9 | 0 | 80 | 71 | 9 | 0 | |
| Revascularisation procedures | 87 | 78 | 9 | 1 | 80 | 71 | 9 | 4 | |
| Fatal or non‐fatal stroke | 87 | 78 | 9 | 0 | 80 | 71 | 9 | 1 | |
| Discontinuation of treatment due to side effects | 87 | 80 | 7 | 2 | 80 | 77 | 3 | 6 | |
| Fatal or non‐fatal myocardial infarction | 19 | 19 | 0 | 0 | 19 | 19 | 0 | 1 | |
| Fatal and non‐fatal stroke | 19 | 19 | 0 | 0 | 19 | 19 | 0 | 1 | |
| Revascularisation procedures | 19 | 19 | 0 | 3 | 19 | 19 | 0 | 1 | |
| Flushing | 72 | 60 | 12 | 21 | 46 | 43 | 3 | 0 | |
| Pruritus | 72 | 60 | 12 | 5 | 46 | 43 | 3 | 0 | |
| Rash | 72 | 60 | 12 | 6 | 46 | 43 | 3 | 0 | |
| Discontinuation of treatment due to side effects | 72 | 67 | 5 | 7 | 46 | 44 | 2 | 1 | |
| Fatal or non‐fatal myocardial infarction | 214 | 180 | 34 | 0 | 218 | 204 | 14 | 1 | |
| Discontinuation of treatment due to side effects | 214 | 203 | 11 | 23 | 218 | 211 | 7 | 7 | |
| Overall mortality | 1119 | 1116 | 3 | 273 | 2798 | 2797 | 1 | 709 | |
| Cardiovascular mortality | 1119 | 1116 | 3 | 238 | 2798 | 2797 | 1 | 633 | |
| Non‐cardiovascular mortality | 1119 | 1116 | 3 | 30 | 2798 | 2797 | 1 | 54 | |
| Fatal myocardial infarction | 1119 | 1116 | 3 | 203 | 2798 | 2797 | 1 | 535 | |
| Non‐fatal myocardial infarction | 1119 | 1116 | 3 | 114 | 2798 | 2797 | 1 | 386 | |
| Fatal or non‐fatal myocardial infarction | 1119 | 1116 | 3 | 287 | 2798 | 2797 | 1 | 839 | |
| Fatal or non‐fatal stroke | 1119 | 1116 | 3 | 95 | 2798 | 2797 | 1 | 311 | |
| Revascularisation procedures | 1119 | 1116 | 3 | 29 | 2798 | 2695 | 103 | 132 | |
| Gastrointestinal symptoms | 1119 | 1073 | 46 | 230 | 2798 | 2695 | 103 | 385 | |
| Flushing | 1119 | 1073 | 46 | 987 | 2798 | 2695 | 103 | 115 | |
| Pruritus | 1119 | 1073 | 46 | 525 | 2798 | 2695 | 103 | 167 | |
| Rash | 1119 | 1073 | 46 | 289 | 2798 | 2695 | 103 | 199 | |
| Flushing | 87 | 87 | 0 | 74 | 44 | 44 | 0 | 7 | |
| Headache | 87 | 46 | 41 | 22 | 44 | 34 | 10 | 13 | |
| Gastrointestinal symptoms | 87 | 46 | 41 | 24 | 44 | 34 | 10 | 10 | |
| Pruritus | 87 | 46 | 41 | 10 | 44 | 34 | 10 | 0 | |
| Rash | 87 | 46 | 41 | 9 | 44 | 34 | 10 | 0 | |
| Overall mortality | 87 | 46 | 41 | 0 | 44 | 34 | 10 | 1 | |
| Discontinuation of treatment due to side effects | 87 | 72 | 15 | 26 | 44 | 39 | 5 | 5 | |
| Overall mortality | 676 | 391 | 285 | 0 | 272 | 213 | 59 | 0 | |
| Fatal or non‐fatal myocardial infarction | 676 | 391 | 285 | 1 | 272 | 213 | 59 | 1 | |
| Fatal or non‐fatal stroke | 676 | 391 | 285 | 0 | 272 | 213 | 59 | 1 | |
| Flushing | 676 | 457 | 219 | 66 | 272 | 214 | 58 | 1 | |
| New onset diabetes | 569 | NR | NR | 25 | 229 | NR | NR | 2 | |
| Discontinuation of treatment due to side effects | 676 | 547 | 129 | 156 | 272 | NR | 33 | 26 | |
| Flushing | 104 | 102 | 2 | 2 | 106 | NR | 4 | 0 | |
| Gastrointestinal symptoms | 104 | 102 | 2 | 5 | 106 | 102 | 4 | 2 | |
| Discontinuation of treatment due to side effects | 104 | 102 | 2 | 4 | 106 | 102 | 4 | 1 | |
| Gastrointestinal symptoms | 92 | 49 | 43 | 1 | 88 | 53 | 35 | 2 | |
| Rash | 723 | 412 | 311 | 1 | 315 | 237 | 78 | 2 | |
| Headache | 780 | 493 | 287 | 2 | 378 | 315 | 63 | 0 | |
| Flushing | 92 | 49 | 43 | 28 | 88 | 53 | 35 | 5 | |
| Fatal or non‐fatal myocardial infarction | 12838 | 12730 | 108 | 668 | 12835 | 12745 | 90 | 694 | |
| Non‐fatal myocardial infarction | 12838 | 12730 | 108 | 402 | 12835 | 12745 | 90 | 431 | |
| Non‐cardiovascular mortality | 12838 | 12730 | 108 | 350 | 12835 | 12745 | 90 | 321 | |
| Fatal myocardial infarction | 12838 | 12730 | 108 | 302 | 12835 | 12745 | 90 | 291 | |
| Cardiovascular mortality | 12838 | 12730 | 108 | 448 | 12835 | 12745 | 90 | 411 | |
| Fatal or non‐fatal stroke | 12838 | 12730 | 108 | 498 | 12835 | 12745 | 90 | 499 | |
| Revascularisation procedures | 12838 | 12730 | 108 | 807 | 12835 | 12745 | 90 | 897 | |
| Overall mortality | 12838 | 12730 | 108 | 798 | 12835 | 12745 | 90 | 732 | |
| New onset diabetes | 8704 | NR | NR | 494 | 8670 | NR | NR | 376 | |
| Gastrointestinal symptoms | 12838 | 12730 | 108 | 620 | 12835 | 12745 | 90 | 491 | |
| Rash | 12838 | 12730 | 108 | 54 | 12835 | 12745 | 90 | 33 | |
| Discontinuation of treatment due to side effects | 12838 | 12730 | 108 | 2105 | 12835 | 12740 | 95 | 1014 | |
| Flushing | 57 | 57 | 0 | 6 | 61 | 61 | 0 | 1 | |
| Overall mortality | 57 | 57 | 0 | 0 | 61 | 61 | 0 | 1 | |
| Headache | 57 | 57 | 0 | 5 | 61 | 61 | 0 | 2 | |
| Pruritus | 57 | 57 | 0 | 4 | 61 | 61 | 0 | 1 | |
| rash | 57 | 57 | 0 | 1 | 61 | 61 | 0 | 2 | |
| Discontinuation of treatment due to side effects | 57 | 57 | 0 | 11 | 61 | 61 | 0 | 6 | |
| Gastrointestinal symptoms | 35 | 25 | 10 | 3 | 36 | 30 | 6 | 1 | |
| Discontinuation of treatment due to side effects | 35 | 29 | 6 | 7 | 36 | 31 | 5 | 2 | |
| Discontinuation of treatment due to side effects | 14 | 14 | 0 | 0 | 14 | 14 | 0 | 0 | |
| flushing | 30 | 30 | 0 | 19 | 30 | 30 | 0 | 0 | |
| Overall mortality | 30 | 30 | 0 | 0 | 30 | 30 | 0 | 0 | |
| Rash | 1343 | 917 | 426 | 33 | 270 | 239 | 31 | 2 | |
| Discontinuation of treatment due to side effects | 1339 | 1080 | 259 | 166 | 270 | 254 | 16 | 15 | |
| Overall mortality | 1343 | 917 | 426 | 3 | 270 | 239 | 31 | 0 | |
| Pruritus | 1343 | 917 | 426 | 34 | 270 | 239 | 31 | 6 | |
| Flushing | 1343 | 917 | 426 | 142 | 270 | 239 | 31 | 5 | |
| Gastrointestinal symptoms | 1343 | 917 | 426 | 34 | 270 | 239 | 31 | 5 | |
| New onset diabetes | 1129 | NR | NR | 7 | 232 | NR | NR | 2 | |
| Discontinuation of treatment due to side effects | 454 | 400 | 54 | 102 | 342 | 308 | 34 | 31 | |
| Overall mortality | 454 | 298 | 156 | 0 | 342 | 277 | 65 | 1 | |
| Fatal or non‐fatal myocardial infarction | 454 | 298 | 156 | 2 | 342 | 277 | 65 | 0 | |
| Gastrointestinal symptoms | 454 | 298 | 156 | 68 | 342 | 277 | 65 | 38 | |
| Pruritus | 454 | 298 | 156 | 71 | 342 | 277 | 65 | 9 | |
| Rash | 454 | 298 | 156 | 26 | 342 | 277 | 65 | 5 | |
| Flushing | 454 | 298 | 156 | 79 | 342 | 277 | 65 | 16 | |
| Gastrointestinal symptoms | 31 | 31 | 0 | 2 | 23 | 23 | 0 | 0 | |
| Discontinuation of treatment due to side effects | 31 | 31 | 0 | 4 | 23 | 23 | 0 | 1 | |
| Revascularisation procedures | 72 | 59 | 13 | 5 | 73 | 58 | 15 | 2 | |
| Fatal or non‐fatal stroke | 72 | 59 | 13 | 1 | 73 | 58 | 15 | 0 | |
| Overall mortality | 72 | 59 | 13 | 0 | 73 | 58 | 15 | 1 | |
| Flushing | 72 | 59 | 13 | 7 | 73 | 58 | 15 | 1 | |
| Discontinuation of treatment due to side effects | 72 | 66 | 6 | 11 | 73 | 63 | 10 | 5 | |
| Overall mortality | 40 | 30 | 10 | 3 | 45 | 34 | 11 | 4 | |
| Fatal myocardial infarction | 40 | 30 | 10 | 2 | 45 | 34 | 11 | 3 | |
| Cardiovascular mortality | 40 | 30 | 10 | 2 | 45 | 34 | 11 | 3 | |
| Non‐cardiovascular mortality | 40 | 30 | 10 | 1 | 45 | 34 | 11 | 1 | |
| Fatal or non‐fatal myocardial infarction | 40 | 30 | 10 | 2 | 45 | 34 | 11 | 1 | |
| Revascularisation procedures | 40 | 30 | 10 | 2 | 45 | 34 | 11 | 4 | |
| Discontinuation of treatment due to side effects | 40 | 34 | 6 | 4 | 45 | 34 | 11 | 0 | |
| Rash | 52 | 52 | 0 | 1 | 56 | 56 | 0 | 0 | |
| Flushing | 52 | 52 | 0 | 4 | 56 | 56 | 0 | 0 | |
| Gastrointestinal symptoms | 52 | 52 | 0 | 1 | 56 | 56 | 0 | 0 | |
| Revascularisation procedures | 52 | 52 | 0 | 2 | 56 | 56 | 0 | 1 | |
| Overall mortality | 52 | 52 | 0 | 0 | 56 | 56 | 0 | 1 | |
| Fatal myocardial infarction | 52 | 52 | 0 | 0 | 56 | 56 | 0 | 1 | |
| Gastrointestinal symptoms | 141 | 134 | 7 | 71 | 284 | 277 | 7 | 57 | |
| Flushing | 141 | 134 | 7 | 71 | 284 | 277 | 7 | 20 | |
| Overall mortality | 141 | 140 | 1 | 31 | 284 | 283 | 1 | 54 | |
| Fatal myocardial infarction | 141 | 134 | 7 | 28 | 284 | 277 | 7 | 48 | |
| Non‐fatal myocardial infarction | 141 | 134 | 7 | 21 | 284 | 277 | 7 | 45 | |
| Fatal or non‐fatal myocardial infarction | 141 | 134 | 7 | 49 | 284 | 277 | 7 | 93 | |
Selective reporting
We systematically compared planned and reported outcomes in ten studies that provided a prospectively published protocol (Heart positive 2011) or prospectively published registry record (ALPINE‐SVG 2015; Carotid IMT 2008; Guyton 2008; Heart positive 2011; HPS2‐THRIVE 2014; Lee 2009; Maccubbin 2008; MacLean 2011; NIA Plaque 2013). Of these, we judged the risk of outcome reporting bias as high for one study that failed to report pre‐specified cardiovascular events (NIA Plaque 2013). The trials ALPINE‐SVG 2015, AIM‐HIGH 2011, and HPS2‐THRIVE 2014 reported all pre‐specified outcomes and were therefore judged as being at low risk of reporting bias. We judged the risk of reporting bias in the remaining five trials with a prospective protocol as unclear because the clinical outcomes that we extracted (e.g. death or flushing) were reported as side effects but not pre‐specified as separate outcomes. The risk of reporting bias was unclear for the 13 trials without published protocol or registry record (Figure 2).
Other potential sources of bias
We considered Sang 2009 at high risk of bias because the reported information was insufficient to rate any item of the risk of bias tool. In addition, treatment groups were considerably unbalanced with respect to cardiovascular risk factors, prior myocardial infarction (control: 36%, intervention 10%) and diabetes (control: 16%, intervention 54%) which raises doubts whether the method of randomisation was appropriate.
One trial was stopped early for futility (AIM‐HIGH 2011). It has been argued that stopping early for futility bears a potential risk for underestimation of potential treatment effects (Walter 2017). However, we considered a relevant bias extremely unlikely given the conservative stopping rules and point estimates consistently excluding any benefits.
Effects of interventions
Primary outcome
Twelve RCTs reported the primary outcome of overall mortality. Using available cases, we found high‐quality evidence that niacin did not reduce overall mortality (RR 1.05, 95% CI 0.97 to 1.12; participants = 35,543; studies = 12; I2 = 0%; Analysis 1.1). The sensitivity analyses using relatively extreme assumptions for imputation of missing data did not change the primary outcome (Table 1). When we considered only the two trials at low risk of bias (AIM‐HIGH 2011 and HPS2‐THRIVE 2014) as a sensitivity analysis, the pooled results suggested that niacin may increase overall mortality (RR 1.10, 95% CI 1.00 to 1.20; participants = 28,840; studies = 2; I2 = 0% Analysis 1.2).
Meta‐regression analyses did not suggest a significant effect modification by duration of treatment (P = 0.15, Figure 3), proportion of participants with established coronary heart disease (P = 0.19, Figure 4), or proportion of participants receiving background statin therapy (P = 0.15, Figure 5).
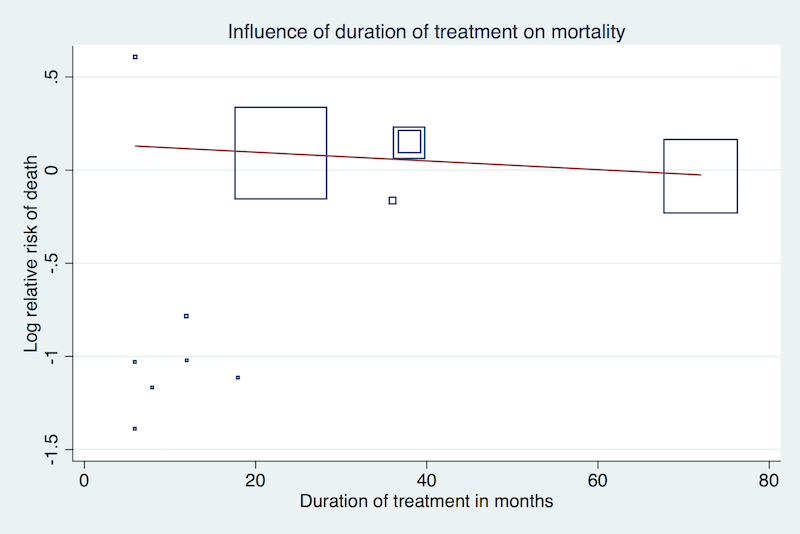
Meta‐regression by duration of treatment using the 'matreg' command in Stata version 13 (stata.com) (Number of observations: 12, P = 0.15)

Meta‐regression by proportion of participants with prior myocardial infarction using the 'matreg' command in Stata version 13 (stata.com) (Number of observations:8, P = 0.19)

Meta‐regression by proportion of participants receiving background statin therapy using the 'matreg' command in Stata version 13 (stata.com) (Number of observations: 10, P = 0.15)
Secondary outcomes
The effect of niacin was not significant in any cardiovascular outcome.
Using available cases, niacin did not reduce:
-
the number of fatal myocardial infarctions (RR 1.01, 95% CI 0.91 to 1.11; participants = 33,336; studies = 6; I2 = 0%, moderate‐quality evidence, downgraded due to imprecision, Analysis 1.3);
-
cardiovascular mortality (RR 1.02, 95% CI 0.93 to 1.12; participants = 32,966; studies = 5; I2 = 0%, moderate‐quality evidence, downgraded due to imprecision, Analysis 1.4);
-
non‐cardiovascular mortality (RR 1.12, 95% CI 0.98 to 1.28; participants = 32,966; studies = 5; I2 = 0%; high‐quality evidence, Analysis 1.5);
-
the number of non‐fatal myocardial infarctions (RR 0.91, 95% CI 0.77 to 1.07; participants = 33,164; studies = 4; I2 = 53%, low‐quality evidence, downgraded due to imprecision and inconsistency, Analysis 1.6);
-
the number of fatal or non‐fatal myocardial infarctions (RR 0.93, 95% CI 0.87 to 1.00; participants = 34,829; studies = 9; I2 = 0%, moderate‐quality evidence, downgraded due to imprecision, Analysis 1.7);
-
the number of fatal or non‐fatal strokes (RR 0.95, 95% CI 0.74 to 1.22; participants = 33,661; studies = 7; I2 = 42%, low‐quality evidence, downgraded due to imprecision and inconsistency, Analysis 1.8); nor
-
the number of revascularisation procedures (RR 0.85, 95% CI 0.68 to 1.06; participants = 33,130; studies = 8; I2 = 45%, low‐quality evidence, downgraded due to imprecision and inconsistency, Analysis 1.9).
Using available cases, niacin increased the number of side effects, specifically:
-
flushing (RR 7.69, 95% CI 4.14 to 14.28; participants = 11,038; studies = 15; I2 = 91%, moderate‐quality evidence, downgraded due to inconsistency, Analysis 1.10);
-
pruritus (RR 5.26, 95% CI 2.68 to 10.32; participants = 5800; studies = 6; I2 = 66%, moderate‐quality evidence, downgraded due to inconsistency, Analysis 1.11);
-
rash (RR 3.15, 95% CI 1.94 to 5.13; participants = 31,485; studies = 9; I2 = 52%, moderate‐quality evidence, downgraded due to inconsistency, Analysis 1.12);
-
headache (RR 1.40, 95% CI 0.86 to 2.28; participants = 300; studies = 3; I2 = 0%, moderate‐quality evidence, downgraded due to imprecision, Analysis 1.13);
-
gastrointestinal symptoms (RR 1.69, 95% CI 1.37 to 2.07; participants = 35,353; studies = 12; I2 = 60%, moderate‐quality evidence, downgraded due to inconsistency, Analysis 1.14); and
-
discontinuation of treatment due to side effects (RR 2.17, 95% CI 1.70 to 2.77; participants = 33,539; studies = 17; I2 = 77%, moderate‐quality evidence, downgraded due to inconsistency, Analysis 1.15).
The statistical heterogeneity (I2) was high for the outcomes flushing, pruritus, rash, gastrointestinal symptoms, and discontinuation of treatment due to side effects, and we could not explain the heterogeneity by dose, pharmacological measures to prevent side effects, use of run‐in or enrichment period, or risk of bias. Therefore, we downgraded our judgement of the quality of evidence due to statistical inconsistency. However, the consistent directions of effects and the generally large effect sizes leave no doubt that niacin does substantially increases the number of side effects. Although the exact size of the estimate is compromised by the inconsistency, the clinical implication is clear and pooling seems appropriate.
Sensitivity analyses using different assumptions for missing data did not affect the conclusion for any secondary outcome (Table 1. We did not draw forest plots given the minimal differences and large number of sensitivity analyses.
For the outcome of new onset of diabetes, none of the three included studies reported available case analysis. Instead, we considered all randomised participants (which assumes no events for missing participants). The pooled results suggested that Niacin increased the number of participants developing diabetes (RR 1.32, 95% CI 1.16 to 1.51; participants = 27,982; studies = 3; I2 = 0%, high‐quality evidence, Analysis 1.16). We did not downgrade due to risk of attrition bias because the proportion of missing data was as low as 1% in the dominating trial (HPS2‐THRIVE 2014). Therefore, we considered the risk of bias to be low for the body of evidence.
None of the studies reported information about quality of life or costs.
Discussion
Summary of main results
We found high‐quality evidence that niacin does not reduce the risk for overall mortality. A sensitivity analysis limited to the two RCTs at low risk of bias (28,840 participants), suggested that niacin may even increase the number of deaths. We found no significant effect modification by duration of treatment, prior myocardial infarction, or background statin therapy.
We found moderate‐ to high‐quality evidence that niacin does not reduce any other cardiovascular outcomes such as cardiovascular mortality, non‐cardiovascular mortality, fatal myocardial infarctions, non‐fatal myocardial infarction, or fatal or non‐fatal myocardial infarction. Low‐quality evidence suggested that niacin does not reduce the number of fatal or non‐fatal strokes, or revascularisation procedures.
We found moderate‐quality evidence that niacin does substantially increase the number of participants discontinuing treatment due to side effects and the number of selected side effects such as flushing, pruritus, rash, and gastrointestinal symptoms, but also the serious side effect of new onset diabetes.
Overall completeness and applicability of evidence
Completeness
We extensively searched the literature and carefully screened reference lists of relevant articles. Although we are confident that we did not miss any relevant study, potential selective outcome reporting might affect our results. First, the proportion of trials contributing to the meta‐analysis for our primary outcome (overall mortality) was below 50% when we also consider the six excluded RTCs that failed to report any clinically relevant outcome (Furukawa 2007). In addition, the funnel plot of the primary outcome was asymmetrical and suggested that positive studies were more likely to be published (Figure 6). Since positive study bias would overestimate beneficial effects of niacin, it is unlikely that missing studies may have biased our conclusion that niacin is not beneficial.

Funnel plot of comparison: 1 niacin over placebo, maximum follow‐up, available case analysis, outcome: 1.1 overall mortality
Applicability
Low heterogeneity despite considerable variety in populations suggests that the absence of beneficial effects of niacin treatment on mortality and cardiovascular outcomes are widely applicable. The generalisability is further supported by the fact that the meta‐regression analyses did not show any significant association between effect estimate and duration of treatment, secondary or primary prevention, or background statin therapy. Although there was high statistical heterogeneity in side effects and discontinuation of treatment due to side effects, the clinical interpretation that niacin does substantially increase the number of side effects was consistent across studies and can be generalised.
Quality of the evidence
The meta‐analyses were largely driven by one large trial at low risk of bias (HPS2‐THRIVE 2014). Therefore, although we considered most trials to be at high risk of bias, mainly due to missing data, we did not downgrade any outcome for risk of bias. The results were robust in a sensitivity analysis where we made relatively extreme assumptions for missing outcome data (Table 1). Moreover, other potential sources of bias such as performance bias due to open‐label medication or detection bias through unblinded outcome assessment were unlikely to affect our conclusions because the anticipated direction of these biases would favour niacin. Following the same logic, we did not downgrade for potential publications bias; the funnel plot for the main outcome was skewed in favour of positive studies (Figure 6).
We downgraded our certainty in effects due to imprecision when the confidence interval of the overall effect included both no effect and potential benefit. When the confidence interval excluded benefit but included no effect and potential harm, we did not downgrade. The rationale for the latter approach is that the distinction between no effect and harm is irrelevant for clinical decision‐making; the clinical interest lies in potential benefits of niacin.
We downgraded two outcomes for inconsistency. Overall, the quality of evidence ranged between high and moderate; quality was low only for the stroke outcome.
Potential biases in the review process
We screened all potentially relevant abstracts and full texts in duplicate and extracted included studies in duplicate. A potential limitation is that we did not systematically search the grey literature and did not systematically contact authors of identified studies for additional unpublished data. However, given the lack of significant benefits of niacin therapy, the large number of participants in our meta‐analysis, and the low heterogeneity, only a large trial demonstrating a clear benefit could affect the conclusions. It is unlikely that we missed such a trial.
We made a number of (conservative) assumptions when outcome details were not clearly reported, as specified under data synthesis. A survey of investigators would have been optimal. However, the reporting quality of the main trial (HPS2‐THRIVE 2014) was high and the potential risk of bias introduced by these assumptions therefore minimal.
Agreements and disagreements with other studies or reviews
Our conclusions are in line with the conclusions of related meta‐analyses. Ip 2015 reported a potentially harmful effect of niacin on overall mortality when niacin is administered on top of background statin treatment in high‐risk participants (RR 1.10, 95% CI 1.00 to 1.20, I2 = 0%), which is identical to our estimate based on the two trials at low risk of bias. Regarding new onset of diabetes, a recent meta‐analysis (Goldie 2015) found that "Niacin therapy was associated with an increase of new onset diabetes of RR 1.34 (95% CIs 1.21 to 1.49)". Although Goldie et at included RCTs evaluating niacin combination therapy, the estimate was very similar to our estimate (RR 1.32, 95% CI 1.16 to 1.51, I2 = 0%).
Risk of bias summary: review authors' judgements about each risk of bias item for each included study
Meta‐regression by duration of treatment using the 'matreg' command in Stata version 13 (stata.com) (Number of observations: 12, P = 0.15)
Meta‐regression by proportion of participants with prior myocardial infarction using the 'matreg' command in Stata version 13 (stata.com) (Number of observations:8, P = 0.19)
Meta‐regression by proportion of participants receiving background statin therapy using the 'matreg' command in Stata version 13 (stata.com) (Number of observations: 10, P = 0.15)
Funnel plot of comparison: 1 niacin over placebo, maximum follow‐up, available case analysis, outcome: 1.1 overall mortality

Comparison 1 Niacin versus control, maximum follow‐up, available case analysis, Outcome 1 Overall mortality.

Comparison 1 Niacin versus control, maximum follow‐up, available case analysis, Outcome 2 Overall mortality, sensitivity analysis with stratification by risk of bias trials only.

Comparison 1 Niacin versus control, maximum follow‐up, available case analysis, Outcome 3 Fatal myocardial infarction.

Comparison 1 Niacin versus control, maximum follow‐up, available case analysis, Outcome 4 Cardiovascular mortality.
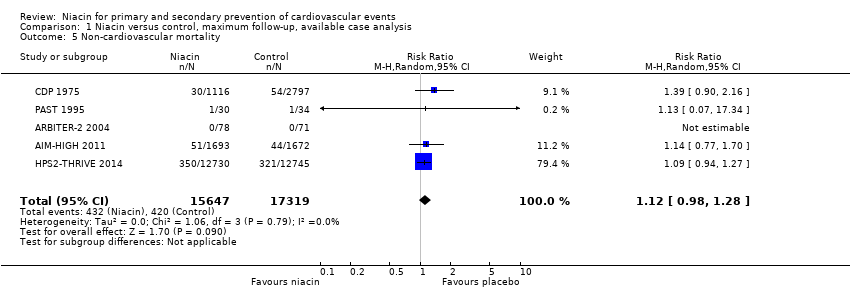
Comparison 1 Niacin versus control, maximum follow‐up, available case analysis, Outcome 5 Non‐cardiovascular mortality.

Comparison 1 Niacin versus control, maximum follow‐up, available case analysis, Outcome 6 Non‐fatal myocardial infarction.
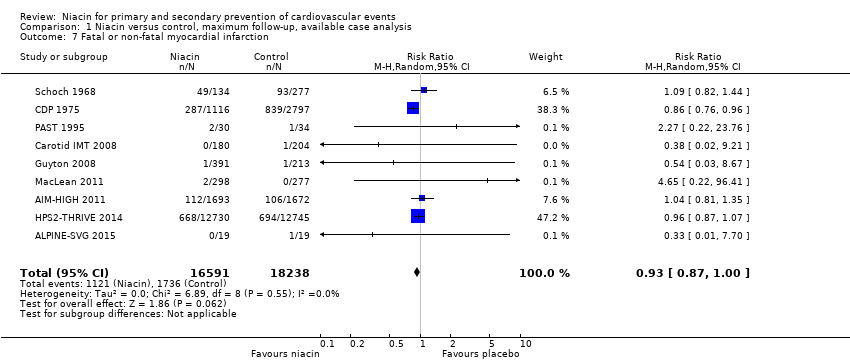
Comparison 1 Niacin versus control, maximum follow‐up, available case analysis, Outcome 7 Fatal or non‐fatal myocardial infarction.

Comparison 1 Niacin versus control, maximum follow‐up, available case analysis, Outcome 8 Fatal and non‐fatal stroke.
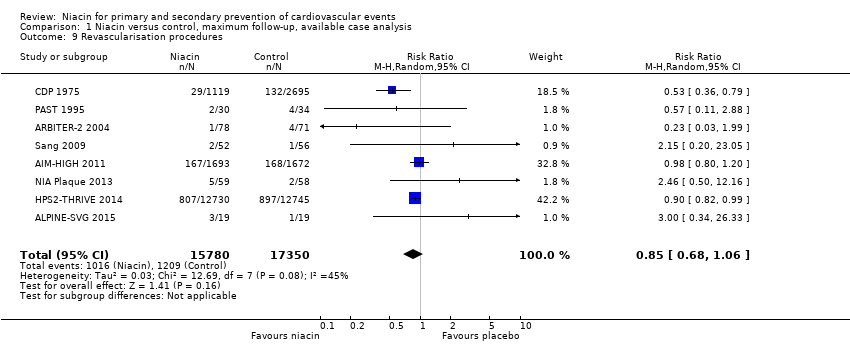
Comparison 1 Niacin versus control, maximum follow‐up, available case analysis, Outcome 9 Revascularisation procedures.
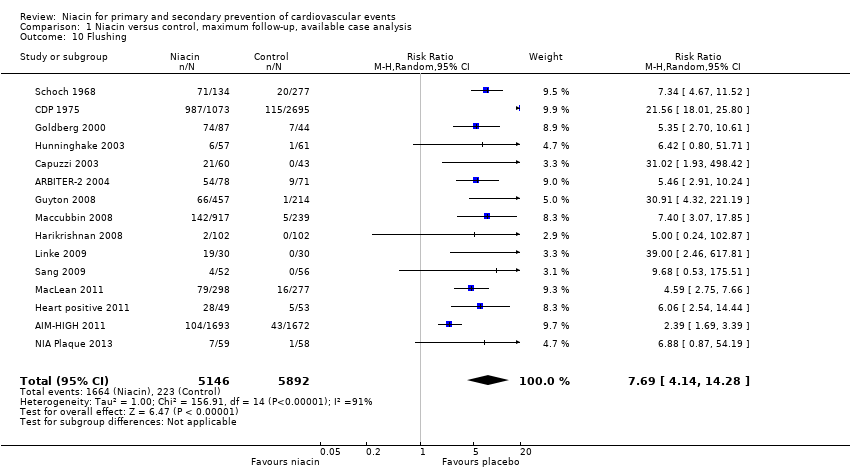
Comparison 1 Niacin versus control, maximum follow‐up, available case analysis, Outcome 10 Flushing.

Comparison 1 Niacin versus control, maximum follow‐up, available case analysis, Outcome 11 Pruritus.
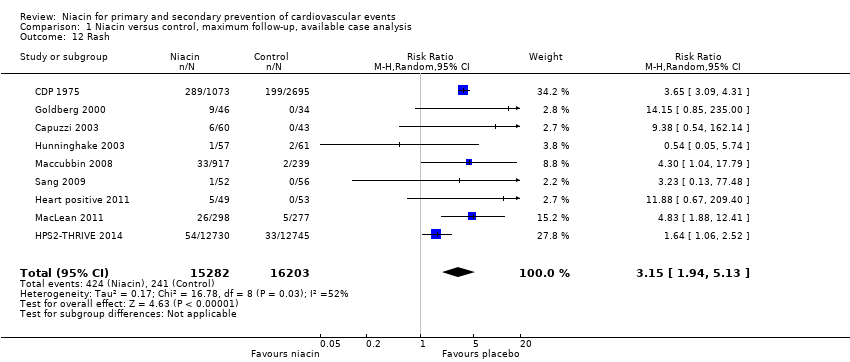
Comparison 1 Niacin versus control, maximum follow‐up, available case analysis, Outcome 12 Rash.
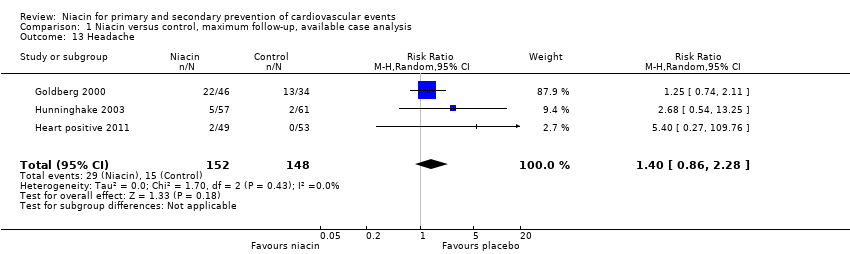
Comparison 1 Niacin versus control, maximum follow‐up, available case analysis, Outcome 13 Headache.

Comparison 1 Niacin versus control, maximum follow‐up, available case analysis, Outcome 14 Gastrointestinal symptoms.
Comparison 1 Niacin versus control, maximum follow‐up, available case analysis, Outcome 15 Discontinuation of treatment due to side effects.

Comparison 1 Niacin versus control, maximum follow‐up, available case analysis, Outcome 16 New onset diabetes).
| Niacin for primary and secondary prevention of cardiovascular events | ||||||
| Patient or population: people with or at risk of cardiovascular disease | ||||||
| Outcomes | Anticipated absolute effects* (95% CI) | Relative effect | № of participants | Quality of the evidence | Comments | |
| Risk with placebo | Risk with niacin | |||||
| Overall mortality | Study population | RR 1.05 | 35,543 | ⊕⊕⊕⊕ | High‐quality evidence that niacin does not reduce overall mortality (CI excludes clinically important benefit) | |
| 86 per 1000 | 90 per 1000 | |||||
| Cardiovascular mortality (follow‐up: 1 year to 5 years) | Study population | RR 1.02 | 32,966 | ⊕⊕⊕⊝ | Moderate‐quality evidence that niacin does not reduce cardiovascular mortality | |
| 63 per 1000 | 64 per 1000 | |||||
| Non‐cardiovascular mortality (follow‐up: 1 year to 5 years) | Study population | RR 1.12 | 32,966 | ⊕⊕⊕⊕ | High‐quality evidence that niacin does not reduce non‐cardiovascular mortality (CI excludes clinically important benefit) | |
| 24 per 1000 | 27 per 1000 | |||||
| Fatal or non‐fatal myocardial infarction (follow up: 0.5 years to 5 years) | Study population | RR 0.93 | 34,829 | ⊕⊕⊕⊝ | Moderate‐quality evidence that niacin does not reduce the number of fatal and non‐fatal myocardial infarctions | |
| 95 per 1000 | 90 per 1000 | |||||
| Fatal and non‐fatal stroke (follow‐up: 0.5 years to 5 years) | Study population | RR 0.95 | 33,661 | ⊕⊕⊝⊝ | Low‐quality evidence that niacin does not reduce the number of strokes | |
| 47 per 1000 | 45 per 1000 | |||||
| Discontinuation of treatment due to side effects (follow‐up: 0.5 years to 4 years) | Study population | RR 2.17 | 33,539 | ⊕⊕⊕⊝ | Moderate‐quality evidence that niacin does increase the number of participants discontinuing treatment due to side effects | |
| 91 per 1000 | 210 per 1000 | |||||
| *The risk in the intervention group (and its 95% confidence interval) is based on the assumed risk in the comparison group and the relative effect of the intervention (and its 95% CI). | ||||||
| GRADE Working Group grades of evidence | ||||||
| 1Confidence interval includes clinically relevant benefit and no benefit. We downgraded by one level due to imprecision. | ||||||
| Outcome | Available case analysis | IMOR 1.0, 1.0* | IMOR 0.5, 2.0* | IMOR 2.0, 0.5* | ||||
| RR (95% CI) | I2 | RR (95% CI) | I2 | RR (95% CI) | I2 | RR (95% CI) | I2 | |
| Overall mortality | 1.05 (0.97 to 1.12) | 0% | 1.05 (0.97 to 1.12) | 0% | 1.04 (0.96 to 1.11) | 0% | 1.06 (0.98 to 1.14) | 0% |
| Cardiovascular mortality | 1.02 (0.93 to 1.12) | 0% | 1.02 (0.93 to 1.12) | 0% | 1.01 (0.92 to 1.11) | 0% | 1.03 (0.94 to 1.13) | 0% |
| Non‐cardiovascular mortality | 1.12 (0.98 to 1.28) | 0% | 1.12 (0.98 to 1.28) | 0% | 1.11 (0.97 to 1.27) | 0% | 1.14 (1.00 to 1.30) | 0% |
| Fatal or non‐fatal myocardial infarction | 0.93 (0.87 to 1.00) | 0% | 0.93 (0.87 to 1.00) | 0% | 0.92 (0.86 to 0.99) | 0% | 0.96 (0.87 to 1.05) | 14% |
| Fatal myocardial infarction | 1.01 (0.91 to 1.11) | 0% | 1.01 (0.91 to 1.11) | 0% | 1.00 (0.90 to 1.10) | 0% | 1.02 (0.92 to 1.12) | 0% |
| Non‐fatal myocardial infarction | 0.91 (0.77 to 1.07) | 53% | 0.91 (0.77 to 1.07) | 53% | 0.89 (0.76 to 1.05) | 47% | 0.92 (0.77 to 1.10) | 57% |
| Fatal or non‐fatal stroke | 0.95 (0.74 to 1.22) | 42% | 0.95 (0.74 to 1.22) | 42% | 0.94 (0.73 to 1.21) | 42% | 0.97 (0.75 to 1.26) | 42% |
| Revascularisation | 0.85 (0.68 to 1.06) | 45% | 0.85 (0.68 to 1.06) | 45% | 0.83 (0.66 to 1.04) | 48% | 0.88 (0.69 to 1.09) | 47% |
| Discontinuation of treatment due to side effects | 2.16 (1.70 to 2.76) | 77% | 2.15 (1.68 to 2.74) | 75% | 1.96 (1.55 to 2.49) | 73% | 2.35 (1.82 to 3.03) | 77% |
| Flushing | 7.69 (4.15 to 14.26) | 91% | 7.66 (4.11 to 14.29) | 91% | 6.68 (3.54 to 12.58) | 91% | 8.61 (4.67 to 15.87) | 90% |
| Rash | 3.16 (1.96 to 5.12) | 52% | 3.14 (1.93 to 5.10) | 51% | 2.74 (1.80 to 4.19) | 40% | 3.69 (2.13 to 6.40) | 60% |
| Pruritus | 5.15 (2.62 to 10.13) | 67% | 5.21 (2.68 to 10.13) | 62% | 4.23 (1.94 to 9.23) | 72% | 6.48 (3.78 to 11.10) | 46% |
| Gastrointestinal symptoms | 1.69 (1.37 to 2.09) | 62% | 1.69 (1.36 to 2.11) | 60% | 1.53 (1.23 to 1.91) | 59% | 1.88 (1.48 to 2.39) | 66% |
| Headache | 1.41 (0.86 to 2.30) | 0% | 1.43 (0.83 to 2.46) | 0% | 1.14 (0.64 to 2.03) | 0% | 1.76 (1.05 to 2.97) | 0% |
| CI: confidence interval; IMOR: informative missingness odds ratio; RR: risk ratio Sensitivity analysis for random‐effects meta‐analysis assuming different relationship between the outcomes from observed and missing participants and accounting for the uncertainty introduced by the proportion of missing data and assumed relationship (informative missingness odds ratio, IMOR = odds of event in missing data/odds of event in observed data, SD(logIMOR) = 0.5). We used the “metamiss”‐command in Stata (version 13) (stata.com). *The two numbers represent the assumed IMORs for the niacin and the control arm, respectively: 1.0, 1.0: missing at random; 0.5, 2.0: assumption favours niacin, 2.0, 0.5: assumption favours control. We could not conduct sensitivity analysis for the outcome 'new onset diabetes' because the proportion of missing data was not reported. | ||||||||
| Study | Niacin dose g/day | Follow‐up in months | Total cholesterol | LDL‐cholesterol | HDL‐cholesterol | Triglycerides |
| Baseline mean, | ||||||
| 3 | 11 | 214 (‐4) | 138 (‐6) | 41 (+11) | 176 (‐34) | |
| 2 | 38 | NA (NA) | 74 (‐3) | 35 (+10) | 165 (‐21) | |
| 2 | 12 | 136 (+1) | 69 (+2) | 38 (+3) | 158 (‐19) | |
| 1 | 12 | 158 (+6) | 89 (+3) | 40 (+8) | 163 (‐12) | |
| 2 | 6 | 262 (+3) | 146 (+6) | 36 (+6) | 377 (‐6) | |
| 2 | 18 | 237 (‐6) | 154 (‐9) | 42 (+6) | 201 (‐16) | |
| 3 | 72 | 249 (‐20) | NA (NA) | NA (NA) | NA (NA) | |
| 3 | 6 | 300 (‐31) | 216 (‐48) | 45 (+8) | 191 (NA) | |
| 2 | 6 | 241 (‐4) | 156 (‐9) | 51 (+11) | 159 (‐30) | |
| 1.5 | 9 | 178 (‐9) | 112 (‐11) | 35 (+5) | 157 (‐5) | |
| 2 | 6 | 211 (‐7) | NA (NA) | 39 (+5) | 306 (‐25) | |
| 2 | 23 | 128 (‐5) | 63 (‐10) | 43 (+6) | 124 (‐33) | |
| 2 | 6 | NA (NA) | 188 (‐10) | 44 (+24) | 197 (‐23) | |
| 2 | 12 | 157 (+1) | 85 (‐15) | 38 (+22) | 180 (‐7) | |
| 1 | 9 | 198 (NA) | 122 (NA) | 49 (NA) | 160 (NA) | |
| 1 | 6 | 218 (+4) | 133 (‐9) | 33 (+5) | 154 (‐29) | |
| 2 | 6 | 192 (‐9) | 223 (‐20) | 52 (+22) | 122 (‐57) | |
| 2 | 8 | 127 (NA) | 164 (‐33) | 86 (+21) | 50 (‐15) | |
| 2 | 12 | 178 (‐15) | 118 (‐22) | 33 (+8) | 141 (‐21) | |
| 1.5 | 18 | 172 (0) | 90 (‐4) | 60 (+8) | 130 (‐26) | |
| 0.5 | 36 | 243 (‐8) | 169 (‐13) | 42 (+1) | 162 (‐25) | |
| 1 | 12 | 183 (NA) | 105 (NA) | 50 (NA) | 147 (NA) | |
| 4 | 38 | 242 (‐34) | NA (NA) | NA (NA) | NA (NA) | |
| NA: not available | ||||||
| Study | Outcome | Niacin group | Control group | ||||||
| Randomised | Complete | Missing | Events | Randomised | Complete | Missing | Events | ||
| Discontinuation of treatment due to side effects | 237 | 213 | 24 | 19 | 231 | 209 | 22 | 9 | |
| Fatal myocardial infarction | 1718 | 1693 | 25 | 38 | 1696 | 1672 | 24 | 34 | |
| Non‐cardiovascular mortality | 1718 | 1693 | 25 | 51 | 1696 | 1672 | 24 | 44 | |
| Fatal or non‐fatal myocardial infarction | 1718 | 1693 | 25 | 112 | 1696 | 1672 | 24 | 106 | |
| Cardiovascular mortality | 1718 | 1693 | 25 | 45 | 1696 | 1672 | 24 | 38 | |
| Overall mortality | 1718 | 1693 | 25 | 96 | 1696 | 1672 | 24 | 82 | |
| Non‐fatal myocardial infarction | 1718 | 1693 | 25 | 104 | 1696 | 1672 | 24 | 93 | |
| Revascularisation procedures | 1718 | 1693 | 25 | 167 | 1696 | 1672 | 24 | 168 | |
| Fatal or non‐fatal stroke | 1718 | 1693 | 25 | 30 | 1696 | 1672 | 24 | 18 | |
| Flushing | 1718 | 1693 | 25 | 104 | 1696 | 1672 | 24 | 43 | |
| Gastrointestinal symptoms | 1718 | 1693 | 25 | 26 | 1696 | 1672 | 24 | 12 | |
| Discontinuation of treatment due to side effects | 1718 | 1693 | 25 | 436 | 1696 | 1672 | 24 | 341 | |
| Flushing | 87 | 78 | 9 | 54 | 80 | 71 | 9 | 9 | |
| Overall mortality | 87 | 78 | 9 | 1 | 80 | 71 | 9 | 2 | |
| Cardiovascular mortality | 87 | 78 | 9 | 1 | 80 | 71 | 9 | 2 | |
| Non‐cardiovascular mortality | 87 | 78 | 9 | 0 | 80 | 71 | 9 | 0 | |
| Revascularisation procedures | 87 | 78 | 9 | 1 | 80 | 71 | 9 | 4 | |
| Fatal or non‐fatal stroke | 87 | 78 | 9 | 0 | 80 | 71 | 9 | 1 | |
| Discontinuation of treatment due to side effects | 87 | 80 | 7 | 2 | 80 | 77 | 3 | 6 | |
| Fatal or non‐fatal myocardial infarction | 19 | 19 | 0 | 0 | 19 | 19 | 0 | 1 | |
| Fatal and non‐fatal stroke | 19 | 19 | 0 | 0 | 19 | 19 | 0 | 1 | |
| Revascularisation procedures | 19 | 19 | 0 | 3 | 19 | 19 | 0 | 1 | |
| Flushing | 72 | 60 | 12 | 21 | 46 | 43 | 3 | 0 | |
| Pruritus | 72 | 60 | 12 | 5 | 46 | 43 | 3 | 0 | |
| Rash | 72 | 60 | 12 | 6 | 46 | 43 | 3 | 0 | |
| Discontinuation of treatment due to side effects | 72 | 67 | 5 | 7 | 46 | 44 | 2 | 1 | |
| Fatal or non‐fatal myocardial infarction | 214 | 180 | 34 | 0 | 218 | 204 | 14 | 1 | |
| Discontinuation of treatment due to side effects | 214 | 203 | 11 | 23 | 218 | 211 | 7 | 7 | |
| Overall mortality | 1119 | 1116 | 3 | 273 | 2798 | 2797 | 1 | 709 | |
| Cardiovascular mortality | 1119 | 1116 | 3 | 238 | 2798 | 2797 | 1 | 633 | |
| Non‐cardiovascular mortality | 1119 | 1116 | 3 | 30 | 2798 | 2797 | 1 | 54 | |
| Fatal myocardial infarction | 1119 | 1116 | 3 | 203 | 2798 | 2797 | 1 | 535 | |
| Non‐fatal myocardial infarction | 1119 | 1116 | 3 | 114 | 2798 | 2797 | 1 | 386 | |
| Fatal or non‐fatal myocardial infarction | 1119 | 1116 | 3 | 287 | 2798 | 2797 | 1 | 839 | |
| Fatal or non‐fatal stroke | 1119 | 1116 | 3 | 95 | 2798 | 2797 | 1 | 311 | |
| Revascularisation procedures | 1119 | 1116 | 3 | 29 | 2798 | 2695 | 103 | 132 | |
| Gastrointestinal symptoms | 1119 | 1073 | 46 | 230 | 2798 | 2695 | 103 | 385 | |
| Flushing | 1119 | 1073 | 46 | 987 | 2798 | 2695 | 103 | 115 | |
| Pruritus | 1119 | 1073 | 46 | 525 | 2798 | 2695 | 103 | 167 | |
| Rash | 1119 | 1073 | 46 | 289 | 2798 | 2695 | 103 | 199 | |
| Flushing | 87 | 87 | 0 | 74 | 44 | 44 | 0 | 7 | |
| Headache | 87 | 46 | 41 | 22 | 44 | 34 | 10 | 13 | |
| Gastrointestinal symptoms | 87 | 46 | 41 | 24 | 44 | 34 | 10 | 10 | |
| Pruritus | 87 | 46 | 41 | 10 | 44 | 34 | 10 | 0 | |
| Rash | 87 | 46 | 41 | 9 | 44 | 34 | 10 | 0 | |
| Overall mortality | 87 | 46 | 41 | 0 | 44 | 34 | 10 | 1 | |
| Discontinuation of treatment due to side effects | 87 | 72 | 15 | 26 | 44 | 39 | 5 | 5 | |
| Overall mortality | 676 | 391 | 285 | 0 | 272 | 213 | 59 | 0 | |
| Fatal or non‐fatal myocardial infarction | 676 | 391 | 285 | 1 | 272 | 213 | 59 | 1 | |
| Fatal or non‐fatal stroke | 676 | 391 | 285 | 0 | 272 | 213 | 59 | 1 | |
| Flushing | 676 | 457 | 219 | 66 | 272 | 214 | 58 | 1 | |
| New onset diabetes | 569 | NR | NR | 25 | 229 | NR | NR | 2 | |
| Discontinuation of treatment due to side effects | 676 | 547 | 129 | 156 | 272 | NR | 33 | 26 | |
| Flushing | 104 | 102 | 2 | 2 | 106 | NR | 4 | 0 | |
| Gastrointestinal symptoms | 104 | 102 | 2 | 5 | 106 | 102 | 4 | 2 | |
| Discontinuation of treatment due to side effects | 104 | 102 | 2 | 4 | 106 | 102 | 4 | 1 | |
| Gastrointestinal symptoms | 92 | 49 | 43 | 1 | 88 | 53 | 35 | 2 | |
| Rash | 723 | 412 | 311 | 1 | 315 | 237 | 78 | 2 | |
| Headache | 780 | 493 | 287 | 2 | 378 | 315 | 63 | 0 | |
| Flushing | 92 | 49 | 43 | 28 | 88 | 53 | 35 | 5 | |
| Fatal or non‐fatal myocardial infarction | 12838 | 12730 | 108 | 668 | 12835 | 12745 | 90 | 694 | |
| Non‐fatal myocardial infarction | 12838 | 12730 | 108 | 402 | 12835 | 12745 | 90 | 431 | |
| Non‐cardiovascular mortality | 12838 | 12730 | 108 | 350 | 12835 | 12745 | 90 | 321 | |
| Fatal myocardial infarction | 12838 | 12730 | 108 | 302 | 12835 | 12745 | 90 | 291 | |
| Cardiovascular mortality | 12838 | 12730 | 108 | 448 | 12835 | 12745 | 90 | 411 | |
| Fatal or non‐fatal stroke | 12838 | 12730 | 108 | 498 | 12835 | 12745 | 90 | 499 | |
| Revascularisation procedures | 12838 | 12730 | 108 | 807 | 12835 | 12745 | 90 | 897 | |
| Overall mortality | 12838 | 12730 | 108 | 798 | 12835 | 12745 | 90 | 732 | |
| New onset diabetes | 8704 | NR | NR | 494 | 8670 | NR | NR | 376 | |
| Gastrointestinal symptoms | 12838 | 12730 | 108 | 620 | 12835 | 12745 | 90 | 491 | |
| Rash | 12838 | 12730 | 108 | 54 | 12835 | 12745 | 90 | 33 | |
| Discontinuation of treatment due to side effects | 12838 | 12730 | 108 | 2105 | 12835 | 12740 | 95 | 1014 | |
| Flushing | 57 | 57 | 0 | 6 | 61 | 61 | 0 | 1 | |
| Overall mortality | 57 | 57 | 0 | 0 | 61 | 61 | 0 | 1 | |
| Headache | 57 | 57 | 0 | 5 | 61 | 61 | 0 | 2 | |
| Pruritus | 57 | 57 | 0 | 4 | 61 | 61 | 0 | 1 | |
| rash | 57 | 57 | 0 | 1 | 61 | 61 | 0 | 2 | |
| Discontinuation of treatment due to side effects | 57 | 57 | 0 | 11 | 61 | 61 | 0 | 6 | |
| Gastrointestinal symptoms | 35 | 25 | 10 | 3 | 36 | 30 | 6 | 1 | |
| Discontinuation of treatment due to side effects | 35 | 29 | 6 | 7 | 36 | 31 | 5 | 2 | |
| Discontinuation of treatment due to side effects | 14 | 14 | 0 | 0 | 14 | 14 | 0 | 0 | |
| flushing | 30 | 30 | 0 | 19 | 30 | 30 | 0 | 0 | |
| Overall mortality | 30 | 30 | 0 | 0 | 30 | 30 | 0 | 0 | |
| Rash | 1343 | 917 | 426 | 33 | 270 | 239 | 31 | 2 | |
| Discontinuation of treatment due to side effects | 1339 | 1080 | 259 | 166 | 270 | 254 | 16 | 15 | |
| Overall mortality | 1343 | 917 | 426 | 3 | 270 | 239 | 31 | 0 | |
| Pruritus | 1343 | 917 | 426 | 34 | 270 | 239 | 31 | 6 | |
| Flushing | 1343 | 917 | 426 | 142 | 270 | 239 | 31 | 5 | |
| Gastrointestinal symptoms | 1343 | 917 | 426 | 34 | 270 | 239 | 31 | 5 | |
| New onset diabetes | 1129 | NR | NR | 7 | 232 | NR | NR | 2 | |
| Discontinuation of treatment due to side effects | 454 | 400 | 54 | 102 | 342 | 308 | 34 | 31 | |
| Overall mortality | 454 | 298 | 156 | 0 | 342 | 277 | 65 | 1 | |
| Fatal or non‐fatal myocardial infarction | 454 | 298 | 156 | 2 | 342 | 277 | 65 | 0 | |
| Gastrointestinal symptoms | 454 | 298 | 156 | 68 | 342 | 277 | 65 | 38 | |
| Pruritus | 454 | 298 | 156 | 71 | 342 | 277 | 65 | 9 | |
| Rash | 454 | 298 | 156 | 26 | 342 | 277 | 65 | 5 | |
| Flushing | 454 | 298 | 156 | 79 | 342 | 277 | 65 | 16 | |
| Gastrointestinal symptoms | 31 | 31 | 0 | 2 | 23 | 23 | 0 | 0 | |
| Discontinuation of treatment due to side effects | 31 | 31 | 0 | 4 | 23 | 23 | 0 | 1 | |
| Revascularisation procedures | 72 | 59 | 13 | 5 | 73 | 58 | 15 | 2 | |
| Fatal or non‐fatal stroke | 72 | 59 | 13 | 1 | 73 | 58 | 15 | 0 | |
| Overall mortality | 72 | 59 | 13 | 0 | 73 | 58 | 15 | 1 | |
| Flushing | 72 | 59 | 13 | 7 | 73 | 58 | 15 | 1 | |
| Discontinuation of treatment due to side effects | 72 | 66 | 6 | 11 | 73 | 63 | 10 | 5 | |
| Overall mortality | 40 | 30 | 10 | 3 | 45 | 34 | 11 | 4 | |
| Fatal myocardial infarction | 40 | 30 | 10 | 2 | 45 | 34 | 11 | 3 | |
| Cardiovascular mortality | 40 | 30 | 10 | 2 | 45 | 34 | 11 | 3 | |
| Non‐cardiovascular mortality | 40 | 30 | 10 | 1 | 45 | 34 | 11 | 1 | |
| Fatal or non‐fatal myocardial infarction | 40 | 30 | 10 | 2 | 45 | 34 | 11 | 1 | |
| Revascularisation procedures | 40 | 30 | 10 | 2 | 45 | 34 | 11 | 4 | |
| Discontinuation of treatment due to side effects | 40 | 34 | 6 | 4 | 45 | 34 | 11 | 0 | |
| Rash | 52 | 52 | 0 | 1 | 56 | 56 | 0 | 0 | |
| Flushing | 52 | 52 | 0 | 4 | 56 | 56 | 0 | 0 | |
| Gastrointestinal symptoms | 52 | 52 | 0 | 1 | 56 | 56 | 0 | 0 | |
| Revascularisation procedures | 52 | 52 | 0 | 2 | 56 | 56 | 0 | 1 | |
| Overall mortality | 52 | 52 | 0 | 0 | 56 | 56 | 0 | 1 | |
| Fatal myocardial infarction | 52 | 52 | 0 | 0 | 56 | 56 | 0 | 1 | |
| Gastrointestinal symptoms | 141 | 134 | 7 | 71 | 284 | 277 | 7 | 57 | |
| Flushing | 141 | 134 | 7 | 71 | 284 | 277 | 7 | 20 | |
| Overall mortality | 141 | 140 | 1 | 31 | 284 | 283 | 1 | 54 | |
| Fatal myocardial infarction | 141 | 134 | 7 | 28 | 284 | 277 | 7 | 48 | |
| Non‐fatal myocardial infarction | 141 | 134 | 7 | 21 | 284 | 277 | 7 | 45 | |
| Fatal or non‐fatal myocardial infarction | 141 | 134 | 7 | 49 | 284 | 277 | 7 | 93 | |
| Outcome or subgroup title | No. of studies | No. of participants | Statistical method | Effect size |
| 1 Overall mortality Show forest plot | 12 | 35543 | Risk Ratio (M‐H, Random, 95% CI) | 1.05 [0.97, 1.12] |
| 2 Overall mortality, sensitivity analysis with stratification by risk of bias trials only Show forest plot | 12 | 35543 | Risk Ratio (M‐H, Random, 95% CI) | 1.05 [0.97, 1.12] |
| 2.1 High risk of bias | 10 | 6703 | Risk Ratio (M‐H, Random, 95% CI) | 0.97 [0.87, 1.09] |
| 2.2 Low risk of bias | 2 | 28840 | Risk Ratio (M‐H, Random, 95% CI) | 1.10 [1.00, 1.20] |
| 3 Fatal myocardial infarction Show forest plot | 6 | 33336 | Risk Ratio (M‐H, Random, 95% CI) | 1.01 [0.91, 1.11] |
| 4 Cardiovascular mortality Show forest plot | 5 | 32966 | Risk Ratio (M‐H, Random, 95% CI) | 1.02 [0.93, 1.12] |
| 5 Non‐cardiovascular mortality Show forest plot | 5 | 32966 | Risk Ratio (M‐H, Random, 95% CI) | 1.12 [0.98, 1.28] |
| 6 Non‐fatal myocardial infarction Show forest plot | 4 | 33164 | Risk Ratio (M‐H, Random, 95% CI) | 0.91 [0.77, 1.07] |
| 7 Fatal or non‐fatal myocardial infarction Show forest plot | 9 | 34829 | Risk Ratio (M‐H, Random, 95% CI) | 0.93 [0.87, 1.00] |
| 8 Fatal and non‐fatal stroke Show forest plot | 7 | 33661 | Risk Ratio (M‐H, Random, 95% CI) | 0.95 [0.74, 1.22] |
| 9 Revascularisation procedures Show forest plot | 8 | 33130 | Risk Ratio (M‐H, Random, 95% CI) | 0.85 [0.68, 1.06] |
| 10 Flushing Show forest plot | 15 | 11038 | Risk Ratio (M‐H, Random, 95% CI) | 7.69 [4.14, 14.28] |
| 11 Pruritus Show forest plot | 6 | 5800 | Risk Ratio (M‐H, Random, 95% CI) | 5.26 [2.68, 10.32] |
| 12 Rash Show forest plot | 9 | 31485 | Risk Ratio (M‐H, Random, 95% CI) | 3.15 [1.94, 5.13] |
| 13 Headache Show forest plot | 3 | 300 | Risk Ratio (M‐H, Random, 95% CI) | 1.40 [0.86, 2.28] |
| 14 Gastrointestinal symptoms Show forest plot | 12 | 35353 | Risk Ratio (M‐H, Random, 95% CI) | 1.69 [1.37, 2.07] |
| 15 Discontinuation of treatment due to side effects Show forest plot | 17 | 33539 | Risk Ratio (M‐H, Random, 95% CI) | 2.17 [1.70, 2.77] |
| 16 New onset diabetes) Show forest plot | 3 | 27982 | Risk Ratio (M‐H, Random, 95% CI) | 1.32 [1.16, 1.51] |