| Study | Outcome | Niacin group | Control group |
| Randomised | Complete | Missing | Events | Randomised | Complete | Missing | Events |
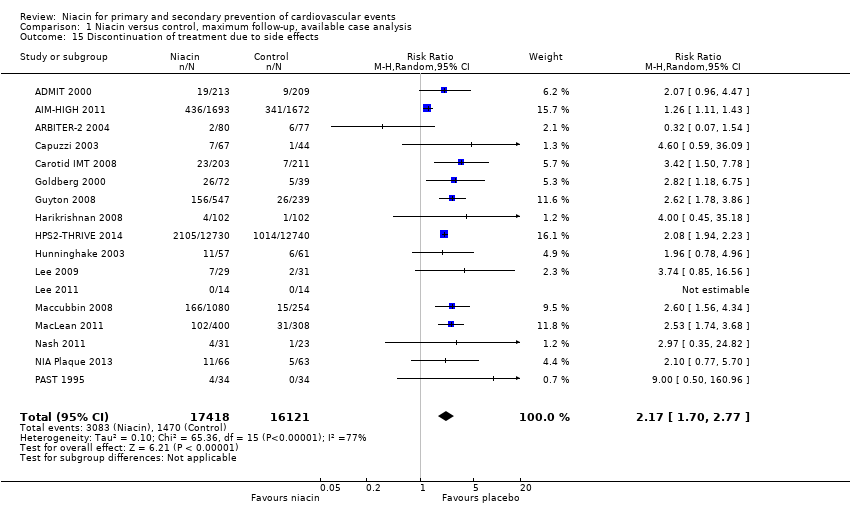
| ADMIT 2000 | Discontinuation of treatment due to side effects | 237 | 213 | 24 | 19 | 231 | 209 | 22 | 9 |
| AIM‐HIGH 2011 | Fatal myocardial infarction | 1718 | 1693 | 25 | 38 | 1696 | 1672 | 24 | 34 |
| Non‐cardiovascular mortality | 1718 | 1693 | 25 | 51 | 1696 | 1672 | 24 | 44 |
| Fatal or non‐fatal myocardial infarction | 1718 | 1693 | 25 | 112 | 1696 | 1672 | 24 | 106 |
| Cardiovascular mortality | 1718 | 1693 | 25 | 45 | 1696 | 1672 | 24 | 38 |
| Overall mortality | 1718 | 1693 | 25 | 96 | 1696 | 1672 | 24 | 82 |
| Non‐fatal myocardial infarction | 1718 | 1693 | 25 | 104 | 1696 | 1672 | 24 | 93 |
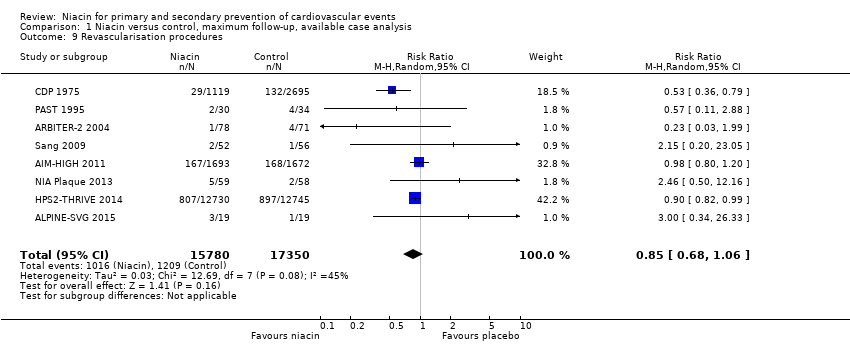
| Revascularisation procedures | 1718 | 1693 | 25 | 167 | 1696 | 1672 | 24 | 168 |
| Fatal or non‐fatal stroke | 1718 | 1693 | 25 | 30 | 1696 | 1672 | 24 | 18 |
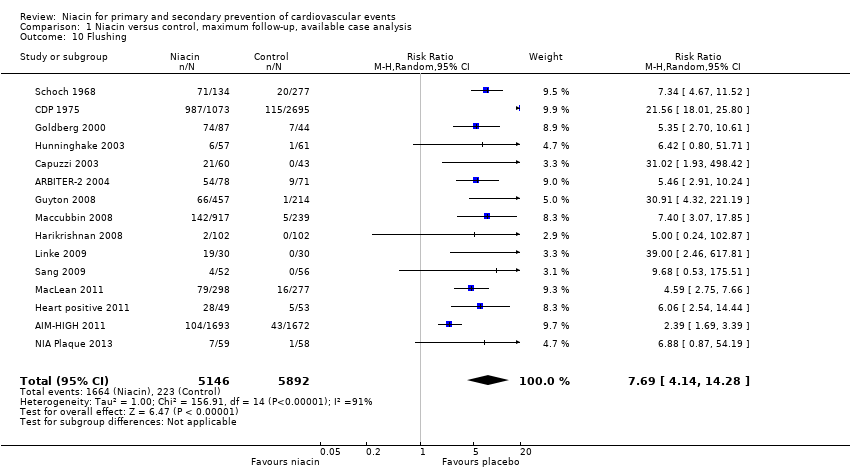
| Flushing | 1718 | 1693 | 25 | 104 | 1696 | 1672 | 24 | 43 |
| Gastrointestinal symptoms | 1718 | 1693 | 25 | 26 | 1696 | 1672 | 24 | 12 |
| Discontinuation of treatment due to side effects | 1718 | 1693 | 25 | 436 | 1696 | 1672 | 24 | 341 |
| ARBITER‐2 2004 | Flushing | 87 | 78 | 9 | 54 | 80 | 71 | 9 | 9 |
| Overall mortality | 87 | 78 | 9 | 1 | 80 | 71 | 9 | 2 |
| Cardiovascular mortality | 87 | 78 | 9 | 1 | 80 | 71 | 9 | 2 |
| Non‐cardiovascular mortality | 87 | 78 | 9 | 0 | 80 | 71 | 9 | 0 |
| Revascularisation procedures | 87 | 78 | 9 | 1 | 80 | 71 | 9 | 4 |
| Fatal or non‐fatal stroke | 87 | 78 | 9 | 0 | 80 | 71 | 9 | 1 |
| Discontinuation of treatment due to side effects | 87 | 80 | 7 | 2 | 80 | 77 | 3 | 6 |
| ALPINE‐SVG 2015 | Fatal or non‐fatal myocardial infarction | 19 | 19 | 0 | 0 | 19 | 19 | 0 | 1 |
| Fatal and non‐fatal stroke | 19 | 19 | 0 | 0 | 19 | 19 | 0 | 1 |
| Revascularisation procedures | 19 | 19 | 0 | 3 | 19 | 19 | 0 | 1 |
| Capuzzi 2003 | Flushing | 72 | 60 | 12 | 21 | 46 | 43 | 3 | 0 |
| Pruritus | 72 | 60 | 12 | 5 | 46 | 43 | 3 | 0 |
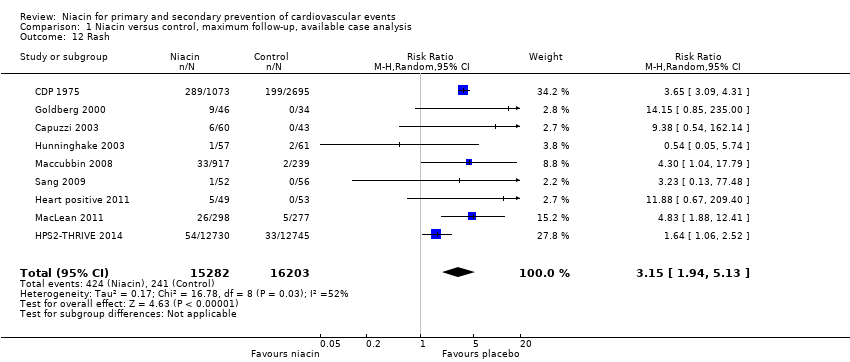
| Rash | 72 | 60 | 12 | 6 | 46 | 43 | 3 | 0 |
| Discontinuation of treatment due to side effects | 72 | 67 | 5 | 7 | 46 | 44 | 2 | 1 |
| Carotid IMT 2008 | Fatal or non‐fatal myocardial infarction | 214 | 180 | 34 | 0 | 218 | 204 | 14 | 1 |
| Discontinuation of treatment due to side effects | 214 | 203 | 11 | 23 | 218 | 211 | 7 | 7 |
| CDP 1975 | Overall mortality | 1119 | 1116 | 3 | 273 | 2798 | 2797 | 1 | 709 |
| Cardiovascular mortality | 1119 | 1116 | 3 | 238 | 2798 | 2797 | 1 | 633 |
| Non‐cardiovascular mortality | 1119 | 1116 | 3 | 30 | 2798 | 2797 | 1 | 54 |
| Fatal myocardial infarction | 1119 | 1116 | 3 | 203 | 2798 | 2797 | 1 | 535 |
| Non‐fatal myocardial infarction | 1119 | 1116 | 3 | 114 | 2798 | 2797 | 1 | 386 |
| Fatal or non‐fatal myocardial infarction | 1119 | 1116 | 3 | 287 | 2798 | 2797 | 1 | 839 |
| Fatal or non‐fatal stroke | 1119 | 1116 | 3 | 95 | 2798 | 2797 | 1 | 311 |
| Revascularisation procedures | 1119 | 1116 | 3 | 29 | 2798 | 2695 | 103 | 132 |
| Gastrointestinal symptoms | 1119 | 1073 | 46 | 230 | 2798 | 2695 | 103 | 385 |
| Flushing | 1119 | 1073 | 46 | 987 | 2798 | 2695 | 103 | 115 |
| Pruritus | 1119 | 1073 | 46 | 525 | 2798 | 2695 | 103 | 167 |
| Rash | 1119 | 1073 | 46 | 289 | 2798 | 2695 | 103 | 199 |
| Goldberg 2000 | Flushing | 87 | 87 | 0 | 74 | 44 | 44 | 0 | 7 |
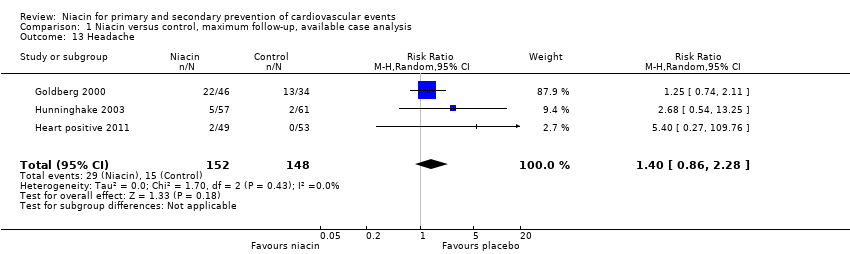
| Headache | 87 | 46 | 41 | 22 | 44 | 34 | 10 | 13 |
| Gastrointestinal symptoms | 87 | 46 | 41 | 24 | 44 | 34 | 10 | 10 |
| Pruritus | 87 | 46 | 41 | 10 | 44 | 34 | 10 | 0 |
| Rash | 87 | 46 | 41 | 9 | 44 | 34 | 10 | 0 |
| Overall mortality | 87 | 46 | 41 | 0 | 44 | 34 | 10 | 1 |
| Discontinuation of treatment due to side effects | 87 | 72 | 15 | 26 | 44 | 39 | 5 | 5 |
| Guyton 2008 | Overall mortality | 676 | 391 | 285 | 0 | 272 | 213 | 59 | 0 |
| Fatal or non‐fatal myocardial infarction | 676 | 391 | 285 | 1 | 272 | 213 | 59 | 1 |
| Fatal or non‐fatal stroke | 676 | 391 | 285 | 0 | 272 | 213 | 59 | 1 |
| Flushing | 676 | 457 | 219 | 66 | 272 | 214 | 58 | 1 |
| New onset diabetes | 569 | NR | NR | 25 | 229 | NR | NR | 2 |
| Discontinuation of treatment due to side effects | 676 | 547 | 129 | 156 | 272 | NR | 33 | 26 |
| Harikrishnan 2008 | Flushing | 104 | 102 | 2 | 2 | 106 | NR | 4 | 0 |
| Gastrointestinal symptoms | 104 | 102 | 2 | 5 | 106 | 102 | 4 | 2 |
| Discontinuation of treatment due to side effects | 104 | 102 | 2 | 4 | 106 | 102 | 4 | 1 |
| Heart positive 2011 | Gastrointestinal symptoms | 92 | 49 | 43 | 1 | 88 | 53 | 35 | 2 |
| Rash | 723 | 412 | 311 | 1 | 315 | 237 | 78 | 2 |
| Headache | 780 | 493 | 287 | 2 | 378 | 315 | 63 | 0 |
| Flushing | 92 | 49 | 43 | 28 | 88 | 53 | 35 | 5 |
| HPS2‐THRIVE 2014 | Fatal or non‐fatal myocardial infarction | 12838 | 12730 | 108 | 668 | 12835 | 12745 | 90 | 694 |
| Non‐fatal myocardial infarction | 12838 | 12730 | 108 | 402 | 12835 | 12745 | 90 | 431 |
| Non‐cardiovascular mortality | 12838 | 12730 | 108 | 350 | 12835 | 12745 | 90 | 321 |
| Fatal myocardial infarction | 12838 | 12730 | 108 | 302 | 12835 | 12745 | 90 | 291 |
| Cardiovascular mortality | 12838 | 12730 | 108 | 448 | 12835 | 12745 | 90 | 411 |
| Fatal or non‐fatal stroke | 12838 | 12730 | 108 | 498 | 12835 | 12745 | 90 | 499 |
| Revascularisation procedures | 12838 | 12730 | 108 | 807 | 12835 | 12745 | 90 | 897 |
| Overall mortality | 12838 | 12730 | 108 | 798 | 12835 | 12745 | 90 | 732 |
| New onset diabetes | 8704 | NR | NR | 494 | 8670 | NR | NR | 376 |
| Gastrointestinal symptoms | 12838 | 12730 | 108 | 620 | 12835 | 12745 | 90 | 491 |
| Rash | 12838 | 12730 | 108 | 54 | 12835 | 12745 | 90 | 33 |
| Discontinuation of treatment due to side effects | 12838 | 12730 | 108 | 2105 | 12835 | 12740 | 95 | 1014 |
| Hunninghake 2003 | Flushing | 57 | 57 | 0 | 6 | 61 | 61 | 0 | 1 |
| Overall mortality | 57 | 57 | 0 | 0 | 61 | 61 | 0 | 1 |
| Headache | 57 | 57 | 0 | 5 | 61 | 61 | 0 | 2 |
| Pruritus | 57 | 57 | 0 | 4 | 61 | 61 | 0 | 1 |
| rash | 57 | 57 | 0 | 1 | 61 | 61 | 0 | 2 |
| Discontinuation of treatment due to side effects | 57 | 57 | 0 | 11 | 61 | 61 | 0 | 6 |
| Lee 2009 | Gastrointestinal symptoms | 35 | 25 | 10 | 3 | 36 | 30 | 6 | 1 |
| Discontinuation of treatment due to side effects | 35 | 29 | 6 | 7 | 36 | 31 | 5 | 2 |
| Lee 2011 | Discontinuation of treatment due to side effects | 14 | 14 | 0 | 0 | 14 | 14 | 0 | 0 |
| Linke 2009 | flushing | 30 | 30 | 0 | 19 | 30 | 30 | 0 | 0 |
| Overall mortality | 30 | 30 | 0 | 0 | 30 | 30 | 0 | 0 |
| Maccubbin 2008 | Rash | 1343 | 917 | 426 | 33 | 270 | 239 | 31 | 2 |
| Discontinuation of treatment due to side effects | 1339 | 1080 | 259 | 166 | 270 | 254 | 16 | 15 |
| Overall mortality | 1343 | 917 | 426 | 3 | 270 | 239 | 31 | 0 |
| Pruritus | 1343 | 917 | 426 | 34 | 270 | 239 | 31 | 6 |
| Flushing | 1343 | 917 | 426 | 142 | 270 | 239 | 31 | 5 |
| Gastrointestinal symptoms | 1343 | 917 | 426 | 34 | 270 | 239 | 31 | 5 |
| New onset diabetes | 1129 | NR | NR | 7 | 232 | NR | NR | 2 |
| MacLean 2011 | Discontinuation of treatment due to side effects | 454 | 400 | 54 | 102 | 342 | 308 | 34 | 31 |
| Overall mortality | 454 | 298 | 156 | 0 | 342 | 277 | 65 | 1 |
| Fatal or non‐fatal myocardial infarction | 454 | 298 | 156 | 2 | 342 | 277 | 65 | 0 |
| Gastrointestinal symptoms | 454 | 298 | 156 | 68 | 342 | 277 | 65 | 38 |
| Pruritus | 454 | 298 | 156 | 71 | 342 | 277 | 65 | 9 |
| Rash | 454 | 298 | 156 | 26 | 342 | 277 | 65 | 5 |
| Flushing | 454 | 298 | 156 | 79 | 342 | 277 | 65 | 16 |
| Nash 2011 | Gastrointestinal symptoms | 31 | 31 | 0 | 2 | 23 | 23 | 0 | 0 |
| Discontinuation of treatment due to side effects | 31 | 31 | 0 | 4 | 23 | 23 | 0 | 1 |
| NIA Plaque 2013 | Revascularisation procedures | 72 | 59 | 13 | 5 | 73 | 58 | 15 | 2 |
| Fatal or non‐fatal stroke | 72 | 59 | 13 | 1 | 73 | 58 | 15 | 0 |
| Overall mortality | 72 | 59 | 13 | 0 | 73 | 58 | 15 | 1 |
| Flushing | 72 | 59 | 13 | 7 | 73 | 58 | 15 | 1 |
| Discontinuation of treatment due to side effects | 72 | 66 | 6 | 11 | 73 | 63 | 10 | 5 |
| PAST 1995 | Overall mortality | 40 | 30 | 10 | 3 | 45 | 34 | 11 | 4 |
| Fatal myocardial infarction | 40 | 30 | 10 | 2 | 45 | 34 | 11 | 3 |
| Cardiovascular mortality | 40 | 30 | 10 | 2 | 45 | 34 | 11 | 3 |
| Non‐cardiovascular mortality | 40 | 30 | 10 | 1 | 45 | 34 | 11 | 1 |
| Fatal or non‐fatal myocardial infarction | 40 | 30 | 10 | 2 | 45 | 34 | 11 | 1 |
| Revascularisation procedures | 40 | 30 | 10 | 2 | 45 | 34 | 11 | 4 |
| Discontinuation of treatment due to side effects | 40 | 34 | 6 | 4 | 45 | 34 | 11 | 0 |
| Sang 2009 | Rash | 52 | 52 | 0 | 1 | 56 | 56 | 0 | 0 |
| Flushing | 52 | 52 | 0 | 4 | 56 | 56 | 0 | 0 |
| Gastrointestinal symptoms | 52 | 52 | 0 | 1 | 56 | 56 | 0 | 0 |
| Revascularisation procedures | 52 | 52 | 0 | 2 | 56 | 56 | 0 | 1 |
| Overall mortality | 52 | 52 | 0 | 0 | 56 | 56 | 0 | 1 |
| Fatal myocardial infarction | 52 | 52 | 0 | 0 | 56 | 56 | 0 | 1 |
| Schoch 1968 | Gastrointestinal symptoms | 141 | 134 | 7 | 71 | 284 | 277 | 7 | 57 |
| Flushing | 141 | 134 | 7 | 71 | 284 | 277 | 7 | 20 |
| Overall mortality | 141 | 140 | 1 | 31 | 284 | 283 | 1 | 54 |
| Fatal myocardial infarction | 141 | 134 | 7 | 28 | 284 | 277 | 7 | 48 |
| Non‐fatal myocardial infarction | 141 | 134 | 7 | 21 | 284 | 277 | 7 | 45 |
| Fatal or non‐fatal myocardial infarction | 141 | 134 | 7 | 49 | 284 | 277 | 7 | 93 |