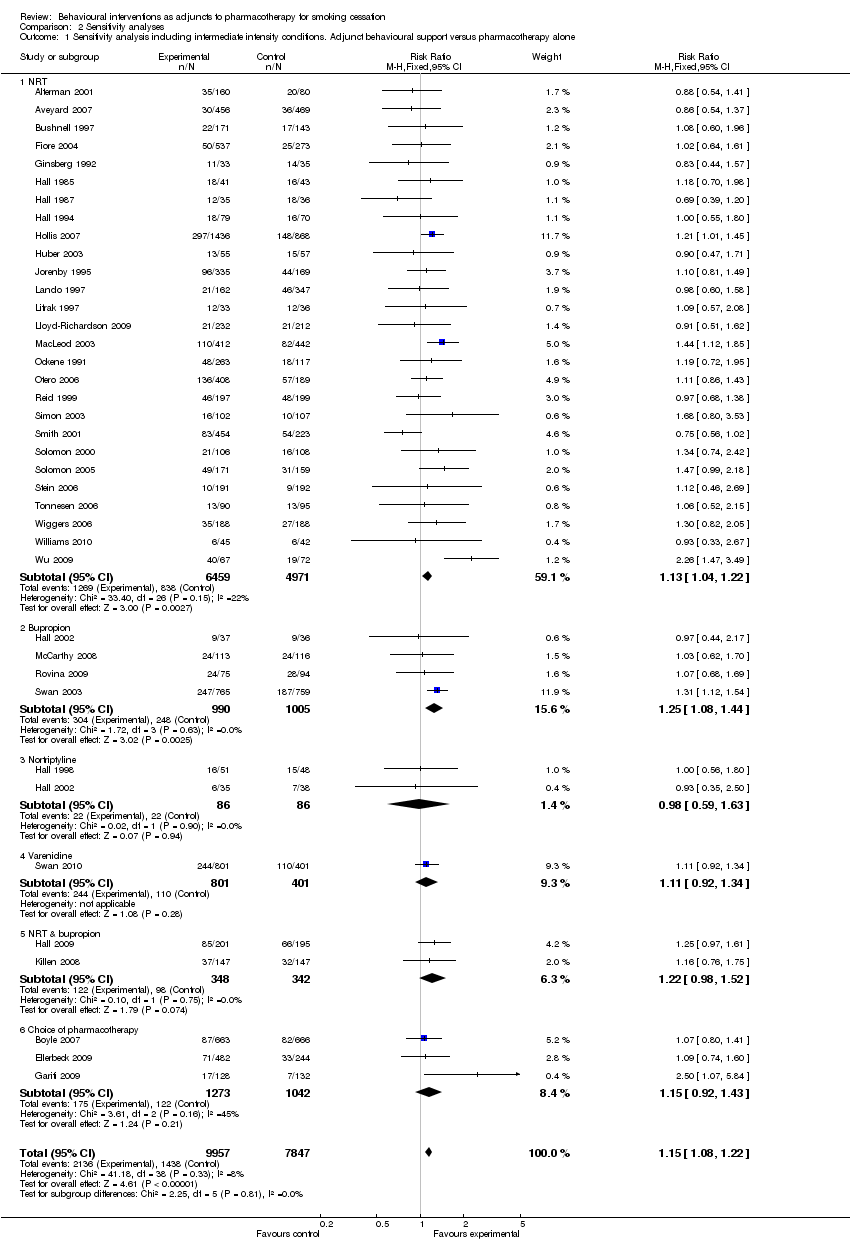
| 1 Subgroups by type of pharmacotherapy Show forest plot | 38 | 15506 | Risk Ratio (M‐H, Fixed, 95% CI) | 1.16 [1.09, 1.24] |
|
| 1.1 NRT | 27 | 9772 | Risk Ratio (M‐H, Fixed, 95% CI) | 1.15 [1.06, 1.25] |
| 1.2 Bupropion | 4 | 1995 | Risk Ratio (M‐H, Fixed, 95% CI) | 1.25 [1.08, 1.44] |
| 1.3 Nortriptyline | 2 | 172 | Risk Ratio (M‐H, Fixed, 95% CI) | 0.98 [0.59, 1.63] |
| 1.4 Varenicline | 1 | 800 | Risk Ratio (M‐H, Fixed, 95% CI) | 1.11 [0.89, 1.37] |
| 1.5 NRT & bupropion | 2 | 690 | Risk Ratio (M‐H, Fixed, 95% CI) | 1.22 [0.98, 1.52] |
| 1.6 Choice of pharmacotherapy | 3 | 2077 | Risk Ratio (M‐H, Fixed, 95% CI) | 1.15 [0.92, 1.45] |
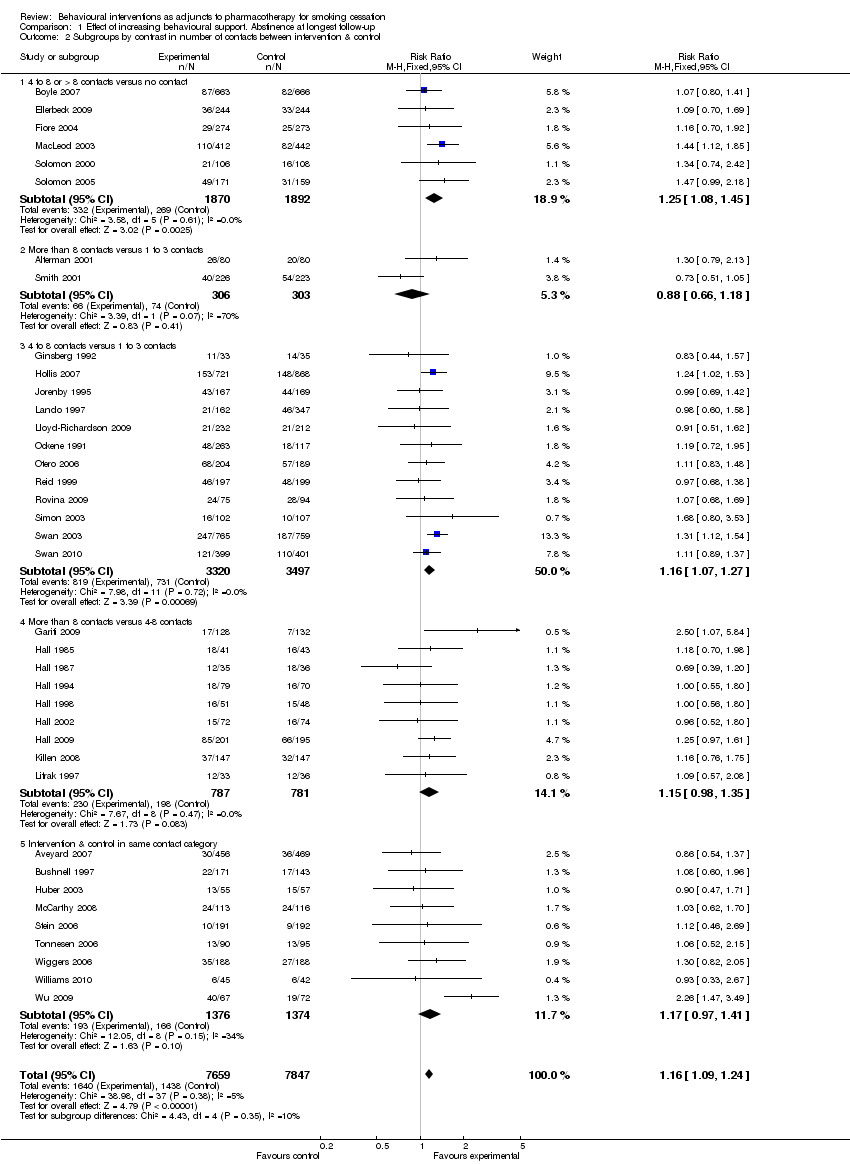
| 2 Subgroups by contrast in number of contacts between intervention & control Show forest plot | 38 | 15506 | Risk Ratio (M‐H, Fixed, 95% CI) | 1.16 [1.09, 1.24] |
|
| 2.1 4 to 8 or > 8 contacts versus no contact | 6 | 3762 | Risk Ratio (M‐H, Fixed, 95% CI) | 1.25 [1.08, 1.45] |
| 2.2 More than 8 contacts versus 1 to 3 contacts | 2 | 609 | Risk Ratio (M‐H, Fixed, 95% CI) | 0.88 [0.66, 1.18] |
| 2.3 4 to 8 contacts versus 1 to 3 contacts | 12 | 6817 | Risk Ratio (M‐H, Fixed, 95% CI) | 1.16 [1.07, 1.27] |
| 2.4 More than 8 contacts versus 4‐8 contacts | 9 | 1568 | Risk Ratio (M‐H, Fixed, 95% CI) | 1.15 [0.98, 1.35] |
| 2.5 Intervention & control in same contact category | 9 | 2750 | Risk Ratio (M‐H, Fixed, 95% CI) | 1.17 [0.97, 1.41] |
| 3 Subgroups by duration of contact in control condition (not prespecified) Show forest plot | 38 | 15506 | Risk Ratio (M‐H, Fixed, 95% CI) | 1.16 [1.09, 1.24] |
|
| 3.1 'Brief intervention' for control | 20 | 11042 | Risk Ratio (M‐H, Fixed, 95% CI) | 1.18 [1.10, 1.27] |
| 3.2 'Dose response', over 30 minutes contact for control | 18 | 4464 | Risk Ratio (M‐H, Fixed, 95% CI) | 1.11 [0.99, 1.25] |
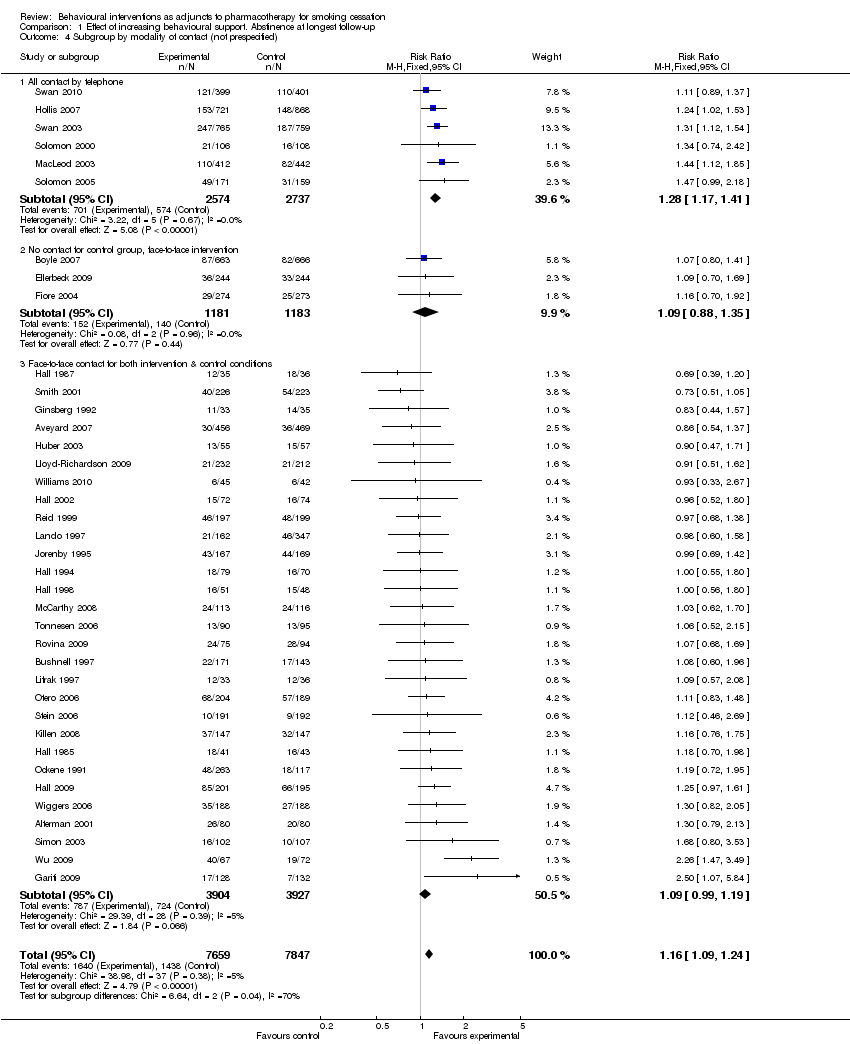
| 4 Subgroup by modality of contact (not prespecified) Show forest plot | 38 | 15506 | Risk Ratio (M‐H, Fixed, 95% CI) | 1.16 [1.09, 1.24] |
|
| 4.1 All contact by telephone | 6 | 5311 | Risk Ratio (M‐H, Fixed, 95% CI) | 1.28 [1.17, 1.41] |
| 4.2 No contact for control group, face‐to‐face intervention | 3 | 2364 | Risk Ratio (M‐H, Fixed, 95% CI) | 1.09 [0.88, 1.35] |
| 4.3 Face‐to‐face contact for both intervention & control conditions | 29 | 7831 | Risk Ratio (M‐H, Fixed, 95% CI) | 1.09 [0.99, 1.19] |
| 5 Subgroups by setting Show forest plot | 38 | 15506 | Risk Ratio (M‐H, Fixed, 95% CI) | 1.16 [1.09, 1.24] |
|
| 5.1 Recruited and treatment initiated in health care setting | 12 | 5422 | Risk Ratio (M‐H, Fixed, 95% CI) | 1.09 [0.94, 1.26] |
| 5.2 Members of health care organisation | 3 | 2833 | Risk Ratio (M‐H, Fixed, 95% CI) | 1.21 [1.07, 1.37] |
| 5.3 Community volunteers | 23 | 7251 | Risk Ratio (M‐H, Fixed, 95% CI) | 1.17 [1.08, 1.27] |