Anticoagulants and antiplatelet agents for preventing central venous haemodialysis catheter malfunction in patients with end‐stage kidney disease
Information
- DOI:
- https://doi.org/10.1002/14651858.CD009631.pub2Copy DOI

- Database:
-
- Cochrane Database of Systematic Reviews
- Version published:
-
- 04 April 2016see what's new
- Type:
-
- Intervention
- Stage:
-
- Review
- Cochrane Editorial Group:
-
Cochrane Kidney and Transplant Group
- Copyright:
-
- Copyright © 2016 The Cochrane Collaboration. Published by John Wiley & Sons, Ltd.
Article metrics
Altmetric:
Cited by:
Authors
Contributions of authors
-
Ying Wang: literature search, study selection, quality appraisal, data extraction, data analysis, data display, writing the review, updating the review
-
Jessica Ivany: literature search, study selection, quality appraisal, data extraction, data analysis, data display
-
Meg Jardine: data analysis, quality appraisal, data display, writing the review, updating the review
-
Martin Gallagher: updating the review
-
Vlado Perkovic: updating the review
-
Mark Woodward: data analysis and updating the review
Declarations of interest
-
Martin Gallagher has received funding competitive research funding from the Royal Australasian College of Physicians, the Australian National Health and Medical Research Council and the Commonwealth Fund in the last 36 months.
-
Jessica Ivany: None known
-
Meg Jardine is supported by a Career Development Fellowship from the National Health and Medical Research Council of Australia and the National Heart Foundation. She has received speakers’ fees from Amgen and Roche, funding for a clinical trial from Gambro and serves on Steering Committees for trials funded by Janssen. Her employer conducts clinical trials funded by Servier, Janssen, Roche and Merck. This funding is unrelated to the conduct of this review.
-
Vlado Perkovic is supported by a fellowship from the Heart Foundation of Australia and a various grants from the Australian National Health and Medical Research Council. He has received speakers' fees from Roche, Servier and Astra Zeneca, funding for a clinical trial from Baxter, and serves on Steering Committees for trials funded by Johnson and Johnson, Boehringer Ingelheim, Vitae and Abbott. His employer conducts clinical trials funded by Servier, Johnson and Johnson, Roche and Merck. This funding is unrelated to the conduct of this review.
-
Ying Wang: None known
-
Mark Woodward has a consultancy contract with Amgen and has had consultancy contracts with Novartis and Sanofi, has received lecturing fees from Servier and has served as an expert witness for Bernstein, Litowitz, Berger and Grossmann LLP. This support is unrelated to the conduct of this review.
Acknowledgements
Ying Wang was supported by a NHMRC Medical and Dental Postgraduate Research Scholarship. Meg Jardine was supported by a Career Development Fellowship from the National Health and Medical Research Council of Australia and the National Heart Foundation.
We wish to thank the referees for their comments and feedback during the preparation of this review.
Version history
| Published | Title | Stage | Authors | Version |
| 2016 Apr 04 | Anticoagulants and antiplatelet agents for preventing central venous haemodialysis catheter malfunction in patients with end‐stage kidney disease | Review | Ying Wang, Jessica N Ivany, Vlado Perkovic, Martin P Gallagher, Mark Woodward, Meg J Jardine | |
| 2012 Feb 15 | Anticoagulants and antiplatelet agents for preventing central venous haemodialysis catheter malfunction in patients with end‐stage kidney disease | Protocol | Ying Wang, Jessica N Ivany, Vlado Perkovic, Martin P Gallagher, Meg J Jardine | |
Differences between protocol and review
Our original protocol was designed to use a conventional random‐effects model for data synthesis. However, we observed a variety of methods of outcome reporting including reporting by patient numbers experiencing an event and reporting by repeated events. The random‐effects model weights individual studies by the confidence interval of the relative risk. As confidence intervals decrease in inverse proportion to increasing events, the use of repeated events measures will generally result in a smaller confidence interval than the use of patient numbers. The use of a pure random‐effects model would thus mean that the weighting of individual studies in the meta‐analysis would be determined in part by the decision on reporting measure. This appeared to introduce an arbitrary component into the analysis. We therefore developed a modified statistical analysis in which we derived the summary estimates of relative risks in a two‐step process. Firstly random effects models were constructed pooling individual studies that reported by any particular method (by patient or by repeated event rate). Secondly the relative risks derived from step one were combined using a fixed effects model weighted by trial sample size.
We have added Prof Mark Woodward as an author in recognition of his contribution to the statistical analyses, particularly in finding a solution to the issues addressed above.
Keywords
MeSH
Medical Subject Headings (MeSH) Keywords
- *Catheter Obstruction;
- *Central Venous Catheters;
- Anticoagulants [*administration & dosage];
- Bacteremia [prevention & control];
- Catheter‐Related Infections [prevention & control];
- Heparin [administration & dosage];
- Kidney Failure, Chronic [*therapy];
- Platelet Aggregation Inhibitors [*administration & dosage];
- Randomized Controlled Trials as Topic;
- Renal Dialysis [*instrumentation];
Medical Subject Headings Check Words
Humans;
PICOs

Risk of bias graph: review authors' judgements about each risk of bias item presented as percentages across all included studies.

Risk of bias summary: review authors' judgements about each risk of bias item for each included study.


Catheter malfunction (subgroup analysis)

Catheter‐related bacteraemia

Catheter‐related bacteraemia (subgroup analysis)


Exit site infection (subgroup analysis)
Requirement for thrombolytic agents

Requirement for thrombolytic agents (subgroup analysis)
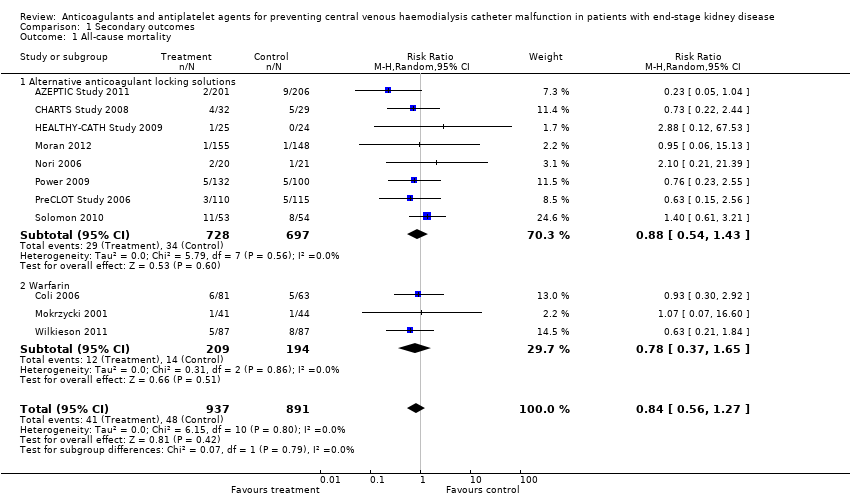
Comparison 1 Secondary outcomes, Outcome 1 All‐cause mortality.

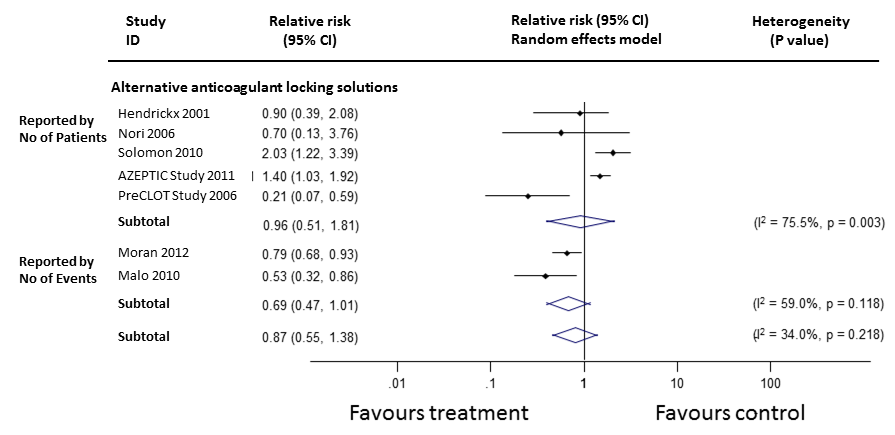
Comparison 1 Secondary outcomes, Outcome 2 Subgroup analysis of all‐cause mortality in alternative anticoagulant locking solutions.

Comparison 1 Secondary outcomes, Outcome 3 Total bleeding events.

Comparison 1 Secondary outcomes, Outcome 4 Subgroup analysis of total bleeding events in alternative anticoagulant locking solutions.
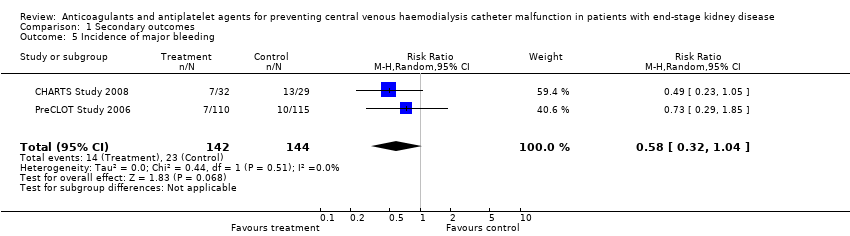
Comparison 1 Secondary outcomes, Outcome 5 Incidence of major bleeding.

Comparison 1 Secondary outcomes, Outcome 6 Incidence of minor bleeding.
| Study Definition of | Overall malfunction | Sub‐classification of catheter malfunction events | |||
| Loss due to | Catheter duration | Interventions | Venous occlusion | ||
| Alternative anticoagulant locking solutions | |||||
| BFR < 200 mL/min for non‐tunnelled and 250 mL/min for tunnelled | Int: 20/92 Cont: 14/95 | Int: 20/92 Cont: 14/95 | Not reported | Not reported | Not reported |
| BFR < 250 mL/min | Int: 13/32 Cont: 12/39 | Int: 25% Cont: 17.2% | Int: 55 days Cont: 90 days | Not reported | Not reported |
| BFR < 200 mL/min | Int: 13/42 Cont: 16/37 | Not reported | Not reported | Not reported | Not reported |
| BFR < 250 mL/min | Int: 9/59 Cont: 11/60 | Not reported | Not reported | Not reported | Not reported |
| Catheter removal due to flow difficulties | Not reported | Not reported | Not reported | Not reported | Not reported |
| BFR < 200 mL/min | Int: 5/10 Cont: 5/9 | Not reported | Not reported | Not reported | Int: 105 non‐occlusive clots Cont: 44 non‐occlusive clots |
| BFR < 250 mL/min | Int: 4/14 Cont: 6/19 | Not reported | Not reported | Not reported | Not reported |
| BFR < 200 mL/min | Int: 18/110 Cont: 36/115 | Not reported | Not reported | Int: 0/110 Cont: 1/115 | Not reported |
| Catheter loss due to occlusion | Int: 8/53 Cont: 3/54 | Int: 8/53 Cont: 3/54 | Not reported | Not reported | Int: 8/53 Cont: 3/54 |
| Systematic anticoagulants | |||||
| Catheter thrombosis | Int: 4/20 Cont: 9/19 | Not reported | Int: 75% survival at 12 months Cont: 36.8% survival at 12 months | Not reported | Int: 4/20 Cont: 9/19 |
| BFR < 300 mL/min | Int: 10/81 Cont: 33/63 | Not reported | Not reported | Not reported | Not reported |
| BFR < 300 mL/min | Int: 8/41 Cont: 8/44 | Int: 8/41 Cont: 8/44 | Not reported | Not reported | Nor reported |
| BFR < 250 mL/min | Int: 1/10 Cont: 1/8 | Not reported | Int: 188 days Cont: 356 days | Not reported | Not reported |
| BFR < 150 mL/min | Int: 8/41 Cont: 8/44 | Not reported | Not reported | Not reported | Not reported |
| No or low dose heparin locking solution | |||||
| Catheter thrombosis | Int: 0/37 Cont: 0/38 | Not reported | Not reported | Not reported | Int: 0/37 Cont: 0/38 |
| Catheter thrombosis or BFR < 140 mL/min | Int: 1/26 Cont: 1/22 | Not reported | Not reported | Not reported | Int: 1/26 Cont: 1/22 |
| BFR ‐ blood flow rate; Cont ‐ control; Int ‐ intervention | |||||
| Study | Number | Intervention arm | Control arm | Background care |
| 58 | Variable dose warfarin Target INR 1.5 to 2 | Placebo | Tinzaparin 40 to 50 IU/kg | |
| 144 | Variable dose warfarin Target INR 1.8 to 2.5 | Warfarin after catheter malfunction | Ticlopidine 250 mg/d | |
| 85 | Fixed dose warfarin 1 mg/d | Placebo | Heparin 5000 U/mL | |
| 18 | Fixed dose warfarin 1 mg/d | Placebo | Not reported | |
| 174 | Variable dose warfarin Target INR 1.5 to 1.9 | Placebo | Heparin 1000 to 10,000 U/mL | |
| INR ‐ international normalised ratio | ||||
| Outcome or subgroup title | No. of studies | No. of participants | Statistical method | Effect size |
| 1 All‐cause mortality Show forest plot | 11 | 1828 | Risk Ratio (M‐H, Random, 95% CI) | 0.84 [0.56, 1.27] |
| 1.1 Alternative anticoagulant locking solutions | 8 | 1425 | Risk Ratio (M‐H, Random, 95% CI) | 0.88 [0.54, 1.43] |
| 1.2 Warfarin | 3 | 403 | Risk Ratio (M‐H, Random, 95% CI) | 0.78 [0.37, 1.65] |
| 2 Subgroup analysis of all‐cause mortality in alternative anticoagulant locking solutions Show forest plot | 8 | 1425 | Risk Ratio (M‐H, Random, 95% CI) | 0.88 [0.54, 1.43] |
| 2.1 Citrate | 6 | 1151 | Risk Ratio (M‐H, Random, 95% CI) | 0.89 [0.52, 1.51] |
| 2.2 rt‐PA | 1 | 225 | Risk Ratio (M‐H, Random, 95% CI) | 0.63 [0.15, 2.56] |
| 2.3 Ethanol | 1 | 49 | Risk Ratio (M‐H, Random, 95% CI) | 2.88 [0.12, 67.53] |
| 3 Total bleeding events Show forest plot | 7 | 849 | Risk Ratio (M‐H, Random, 95% CI) | 0.87 [0.61, 1.25] |
| 3.1 Alternative anticoagulant locking solutions | 3 | 335 | Risk Ratio (M‐H, Random, 95% CI) | 0.69 [0.47, 1.01] |
| 3.2 Systemic agents | 3 | 439 | Risk Ratio (M‐H, Random, 95% CI) | 1.30 [0.93, 1.83] |
| 3.3 Low/no dose heparin | 1 | 75 | Risk Ratio (M‐H, Random, 95% CI) | 0.45 [0.21, 0.96] |
| 4 Subgroup analysis of total bleeding events in alternative anticoagulant locking solutions Show forest plot | 7 | 1074 | Risk Ratio (M‐H, Random, 95% CI) | 0.88 [0.65, 1.19] |
| 4.1 Citrates | 2 | 286 | Risk Ratio (M‐H, Random, 95% CI) | 0.70 [0.47, 1.02] |
| 4.2 Ethanol | 1 | 49 | Risk Ratio (M‐H, Random, 95% CI) | 0.32 [0.01, 7.50] |
| 4.3 Warfarin | 2 | 259 | Risk Ratio (M‐H, Random, 95% CI) | 1.43 [0.86, 2.39] |
| 4.4 Aspirin | 1 | 180 | Risk Ratio (M‐H, Random, 95% CI) | 1.21 [0.77, 1.90] |
| 4.5 rt‐PA | 1 | 225 | Risk Ratio (M‐H, Random, 95% CI) | 0.85 [0.43, 1.68] |
| 4.6 Low/no dose heparin | 1 | 75 | Risk Ratio (M‐H, Random, 95% CI) | 0.45 [0.21, 0.96] |
| 5 Incidence of major bleeding Show forest plot | 2 | 286 | Risk Ratio (M‐H, Random, 95% CI) | 0.58 [0.32, 1.04] |
| 6 Incidence of minor bleeding Show forest plot | 2 | 286 | Risk Ratio (M‐H, Random, 95% CI) | 0.81 [0.44, 1.50] |