Scolaris Content Display Scolaris Content Display

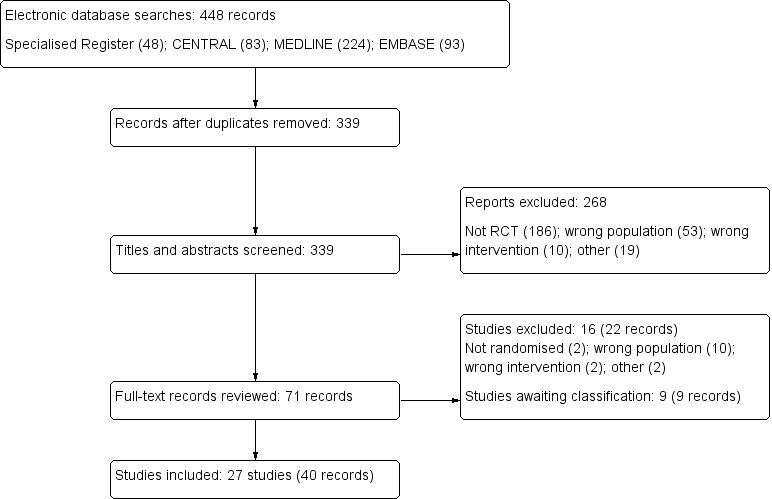
Study flow diagram.
Figures and Tables -
Figure 1

Study flow diagram.

Risk of bias graph: review authors' judgements about each risk of bias item presented as percentages across all included studies.
Figures and Tables -
Figure 2

Risk of bias graph: review authors' judgements about each risk of bias item presented as percentages across all included studies.

Risk of bias summary: review authors' judgements about each risk of bias item for each included study.
Figures and Tables -
Figure 3

Risk of bias summary: review authors' judgements about each risk of bias item for each included study.

Catheter malfunction
Figures and Tables -
Figure 4

Catheter malfunction

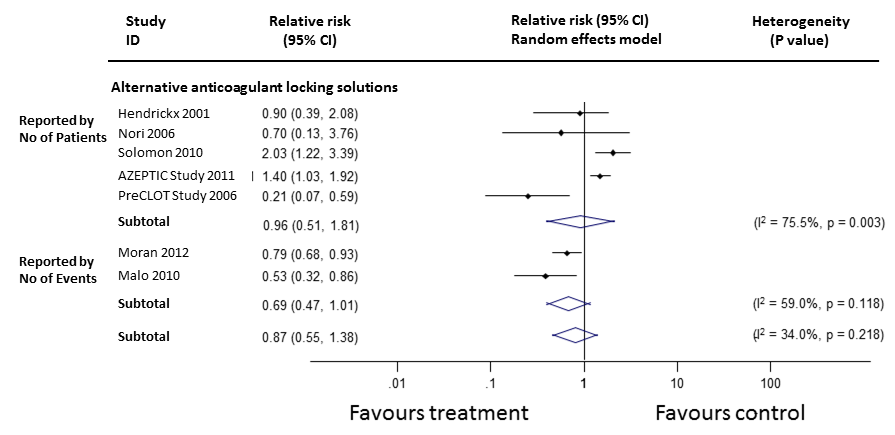
Catheter malfunction (subgroup analysis)
Figures and Tables -
Figure 5

Catheter malfunction (subgroup analysis)

Catheter‐related bacteraemia
Figures and Tables -
Figure 6

Catheter‐related bacteraemia

Catheter‐related bacteraemia (subgroup analysis)
Figures and Tables -
Figure 7

Catheter‐related bacteraemia (subgroup analysis)

Exit site infection
Figures and Tables -
Figure 8

Exit site infection

Exit site infection (subgroup analysis)
Figures and Tables -
Figure 9

Exit site infection (subgroup analysis)

Requirement for thrombolytic agents
Figures and Tables -
Figure 10

Requirement for thrombolytic agents

Requirement for thrombolytic agents (subgroup analysis)
Figures and Tables -
Figure 11

Requirement for thrombolytic agents (subgroup analysis)

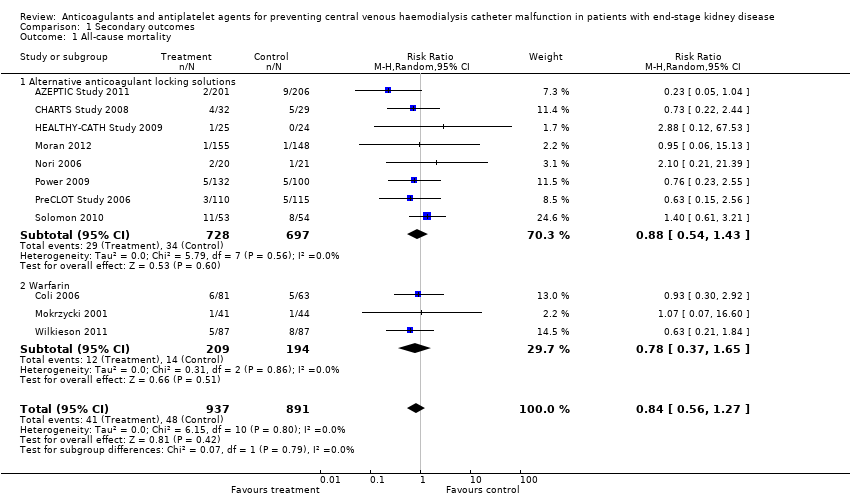
Comparison 1 Secondary outcomes, Outcome 1 All‐cause mortality.
Figures and Tables -
Analysis 1.1

Comparison 1 Secondary outcomes, Outcome 1 All‐cause mortality.

Comparison 1 Secondary outcomes, Outcome 2 Subgroup analysis of all‐cause mortality in alternative anticoagulant locking solutions.
Figures and Tables -
Analysis 1.2

Comparison 1 Secondary outcomes, Outcome 2 Subgroup analysis of all‐cause mortality in alternative anticoagulant locking solutions.

Comparison 1 Secondary outcomes, Outcome 3 Total bleeding events.
Figures and Tables -
Analysis 1.3

Comparison 1 Secondary outcomes, Outcome 3 Total bleeding events.

Comparison 1 Secondary outcomes, Outcome 4 Subgroup analysis of total bleeding events in alternative anticoagulant locking solutions.
Figures and Tables -
Analysis 1.4

Comparison 1 Secondary outcomes, Outcome 4 Subgroup analysis of total bleeding events in alternative anticoagulant locking solutions.

Comparison 1 Secondary outcomes, Outcome 5 Incidence of major bleeding.
Figures and Tables -
Analysis 1.5

Comparison 1 Secondary outcomes, Outcome 5 Incidence of major bleeding.

Comparison 1 Secondary outcomes, Outcome 6 Incidence of minor bleeding.
Figures and Tables -
Analysis 1.6

Comparison 1 Secondary outcomes, Outcome 6 Incidence of minor bleeding.

Table 1. Catheter malfunction events reported by study authors

Study

Definition of
malfunction

Overall malfunction

Sub‐classification of catheter malfunction events

Loss due to
malfunction

Catheter duration

Interventions
to maintain
catheter function

Venous occlusion

Alternative anticoagulant locking solutions

Campos 2011

BFR < 200 mL/min for non‐tunnelled and 250 mL/min for tunnelled

Int: 20/92

Cont: 14/95

Int: 20/92

Cont: 14/95

Not reported

Not reported

Not reported

CHARTS Study 2008

BFR < 250 mL/min

Int: 13/32

Cont: 12/39

Int: 25%

Cont: 17.2%

Int: 55 days

Cont: 90 days

Not reported

Not reported

Dogra 2002

BFR < 200 mL/min

Int: 13/42

Cont: 16/37

Not reported

Not reported

Not reported

Not reported

Filiopoulos 2011

BFR < 250 mL/min

Int: 9/59

Cont: 11/60

Not reported

Not reported

Not reported

Not reported

HEALTHY‐CATH Study 2009

Catheter removal due to flow difficulties

Not reported

Not reported

Not reported

Not reported

Not reported

Hendrickx 2001

BFR < 200 mL/min

Int: 5/10

Cont: 5/9

Not reported

Not reported

Not reported

Int: 105 non‐occlusive clots

Cont: 44 non‐occlusive clots

Pervez 2002

BFR < 250 mL/min

Int: 4/14

Cont: 6/19

Not reported

Not reported

Not reported

Not reported

PreCLOT Study 2006

BFR < 200 mL/min

Int: 18/110

Cont: 36/115

Not reported

Not reported

Int: 0/110

Cont: 1/115

Not reported

Solomon 2010

Catheter loss due to occlusion

Int: 8/53

Cont: 3/54

Int: 8/53

Cont: 3/54

Not reported

Not reported

Int: 8/53

Cont: 3/54

Systematic anticoagulants

Abdul‐Rahman 2007

Catheter thrombosis

Int: 4/20

Cont: 9/19

Not reported

Int: 75% survival at 12 months

Cont: 36.8% survival at 12 months

Not reported

Int: 4/20

Cont: 9/19

Coli 2006

BFR < 300 mL/min

Int: 10/81

Cont: 33/63

Not reported

Not reported

Not reported

Not reported

Mokrzycki 2001

BFR < 300 mL/min

Int: 8/41

Cont: 8/44

Int: 8/41

Cont: 8/44

Not reported

Not reported

Nor reported

Traynor 2001

BFR < 250 mL/min

Int: 1/10

Cont: 1/8

Not reported

Int: 188 days

Cont: 356 days

Not reported

Not reported

Wilkieson 2011

BFR < 150 mL/min

Int: 8/41

Cont: 8/44

Not reported

Not reported

Not reported

Not reported

No or low dose heparin locking solution

Hryszko 2013

Catheter thrombosis

Int: 0/37

Cont: 0/38

Not reported

Not reported

Not reported

Int: 0/37

Cont: 0/38

Kaneko 2004

Catheter thrombosis or BFR < 140 mL/min

Int: 1/26

Cont: 1/22

Not reported

Not reported

Not reported

Int: 1/26

Cont: 1/22

BFR ‐ blood flow rate; Cont ‐ control; Int ‐ intervention

Figures and Tables -
Table 1. Catheter malfunction events reported by study authors
Table 2. Warfarin dosage and target INR in systemic anticoagulant studies

Study

Number

Intervention arm

Control arm

Background care

Abdul‐Rahman 2007

58

Variable dose warfarin

Target INR 1.5 to 2

Placebo

Tinzaparin 40 to 50 IU/kg

Coli 2006

144

Variable dose warfarin

Target INR 1.8 to 2.5

Warfarin after catheter malfunction

Ticlopidine 250 mg/d

Mokrzycki 2001

85

Fixed dose warfarin 1 mg/d

Placebo

Heparin 5000 U/mL

Traynor 2001

18

Fixed dose warfarin 1 mg/d

Placebo

Not reported

Wilkieson 2011

174

Variable dose warfarin

Target INR 1.5 to 1.9

Placebo

Heparin 1000 to 10,000 U/mL

INR ‐ international normalised ratio

Figures and Tables -
Table 2. Warfarin dosage and target INR in systemic anticoagulant studies
Comparison 1. Secondary outcomes

Outcome or subgroup title

No. of studies

No. of participants

Statistical method

Effect size

1 All‐cause mortality Show forest plot

11

1828

Risk Ratio (M‐H, Random, 95% CI)

0.84 [0.56, 1.27]

1.1 Alternative anticoagulant locking solutions

8

1425

Risk Ratio (M‐H, Random, 95% CI)

0.88 [0.54, 1.43]

1.2 Warfarin

3

403

Risk Ratio (M‐H, Random, 95% CI)

0.78 [0.37, 1.65]

2 Subgroup analysis of all‐cause mortality in alternative anticoagulant locking solutions Show forest plot

8

1425

Risk Ratio (M‐H, Random, 95% CI)

0.88 [0.54, 1.43]

2.1 Citrate

6

1151

Risk Ratio (M‐H, Random, 95% CI)

0.89 [0.52, 1.51]

2.2 rt‐PA

1

225

Risk Ratio (M‐H, Random, 95% CI)

0.63 [0.15, 2.56]

2.3 Ethanol

1

49

Risk Ratio (M‐H, Random, 95% CI)

2.88 [0.12, 67.53]

3 Total bleeding events Show forest plot

7

849

Risk Ratio (M‐H, Random, 95% CI)

0.87 [0.61, 1.25]

3.1 Alternative anticoagulant locking solutions

3

335

Risk Ratio (M‐H, Random, 95% CI)

0.69 [0.47, 1.01]

3.2 Systemic agents

3

439

Risk Ratio (M‐H, Random, 95% CI)

1.30 [0.93, 1.83]

3.3 Low/no dose heparin

1

75

Risk Ratio (M‐H, Random, 95% CI)

0.45 [0.21, 0.96]

4 Subgroup analysis of total bleeding events in alternative anticoagulant locking solutions Show forest plot

7

1074

Risk Ratio (M‐H, Random, 95% CI)

0.88 [0.65, 1.19]

4.1 Citrates

2

286

Risk Ratio (M‐H, Random, 95% CI)

0.70 [0.47, 1.02]

4.2 Ethanol

1

49

Risk Ratio (M‐H, Random, 95% CI)

0.32 [0.01, 7.50]

4.3 Warfarin

2

259

Risk Ratio (M‐H, Random, 95% CI)

1.43 [0.86, 2.39]

4.4 Aspirin

1

180

Risk Ratio (M‐H, Random, 95% CI)

1.21 [0.77, 1.90]

4.5 rt‐PA

1

225

Risk Ratio (M‐H, Random, 95% CI)

0.85 [0.43, 1.68]

4.6 Low/no dose heparin

1

75

Risk Ratio (M‐H, Random, 95% CI)

0.45 [0.21, 0.96]

5 Incidence of major bleeding Show forest plot

2

286

Risk Ratio (M‐H, Random, 95% CI)

0.58 [0.32, 1.04]

6 Incidence of minor bleeding Show forest plot

2

286

Risk Ratio (M‐H, Random, 95% CI)

0.81 [0.44, 1.50]

Figures and Tables -
Comparison 1. Secondary outcomes