Statins for aortic valve stenosis
Information
- DOI:
- https://doi.org/10.1002/14651858.CD009571.pub2Copy DOI

- Database:
-
- Cochrane Database of Systematic Reviews
- Version published:
-
- 05 September 2016see what's new
- Type:
-
- Intervention
- Stage:
-
- Review
- Cochrane Editorial Group:
-
Cochrane Heart Group
- Copyright:
-
- Copyright © 2016 The Cochrane Collaboration. Published by John Wiley & Sons, Ltd.
Article metrics
Altmetric:
Cited by:
Authors
Contributions of authors
Luciana Thiago: is the primary author of the review, drafted the protocol, searched the references, entered data into RevMan, selected the included papers, extracted the data, organised and analysed data and drafted the manuscript.
Selma Rumiko Tsuji: Drafted the protocol.
Jonathan Nyong: Quality assured the report and data entry, organised the data into GRADE software and produced 'Summary of findings' table
Maria Eduarda dos Santos Puga: Developed the search strategy.
Aécio Flávio Teixeira de Góis: Extracted and analysed the data.
Cristiane Rufino Macedo: Entered the data into Revman and organised the data into GRADE software.
Orsine Valente: Drafted the protocol.
Álvaro Nagib Átallah: Organised and analysed the data.
Sources of support
Internal sources
-
Brazilian Cochrane Centre, Federal University of Sao Paulo and Marilia Medical, Brazil.
External sources
-
No sources of support supplied
Declarations of interest
There is no conflict of interest in this review.
Acknowledgements
We thank the staff of the Cochrane Heart Group for their help and assistance with the systematic review. We also thank Dr Álvaro Nagib Atallah (Director) and the staff of the Brazilian Cochrane Centre for their orientation and assistance with the review. We thank Patricia Moerbeck Casadei for her assistance with the English version of this study. We are grateful to Nicole Martin and Jo Abbot for conducting the searches for this review.
Version history
| Published | Title | Stage | Authors | Version |
| 2016 Sep 05 | Statins for aortic valve stenosis | Review | Luciana Thiago, Selma Rumiko Tsuji, Jonathan Nyong, Maria ES Puga, Aecio FT Gois, Cristiane R Macedo, Orsine Valente, Álvaro N Atallah | |
| 2012 Jan 18 | Statins for aortic valve stenosis | Protocol | Luciana Thiago, Selma Rumiko Tsuji, Álvaro N Atallah, Maria Eduarda dos Santos Puga, Aecio FT Gois, Orsine Valente | |
Differences between protocol and review
We included GRADE to assess the quality evidence of the review (GRADE PRO 2011).
Two new co‐authors were added (Cristiane Rufino Macedo and Jonathan Nyong).
We excluded two studies on the basis of high risk of bias and methodological flaws as instructed by the editorial staff. The low number of patients in these trials suggests that no significant change could occur in meta‐analysis results.
In the protocol of this review, we planned to assess if the effect of the treatment varies according to different populations (age, gender and severity of illness) or to characteristics of the intervention (type of statin). However, the numbers of the included studies identified by the electronic search were not enough to carry out subgroup analysis. We also did not conduct the planned sensitivity analysis to assess the robustness of the observed effects due to insufficient number of trials. Although we did not specify the number in the protocol, we consider that at least 10 included studies are required to carry out subgroup and sensitivity analyses. In future updates of this review, we intend to carry out subgroup analysis by age, gender, type of statin and severity of Illness (mild, moderate and severe aortic valve stenosis) and sensitivity analysis, provided we have more than 10 eligible studies.
We planned to calculate NNT (number needed to treat for an additional beneficial outcome (NNTB) or the number needed to treat for an additional harmful outcome (NNTH)) (Higgins 2011) in the protocol, but it was not possible because we did not find any significant difference between the participants who received statin compared with the participants who received placebo for the following outcomes: mean pressure gradient, freedom from valve replacement, death from cardiovascular cause and valve area.
PICOs


'Risk of bias' graph: review authors' judgements about each risk of bias item presented as percentages across all included studies.
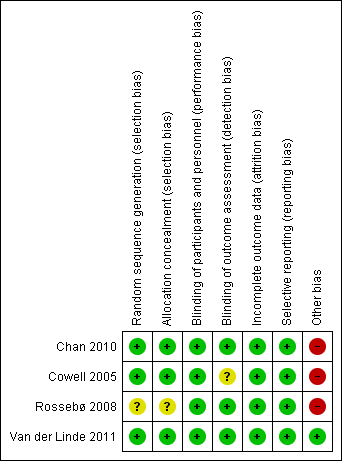
'Risk of bias' summary: review authors' judgements about each risk of bias item for each included study.

Comparison 1 Statin versus Placebo, Outcome 1 Mean pressure gradient.

Comparison 1 Statin versus Placebo, Outcome 2 Valve area.

Comparison 1 Statin versus Placebo, Outcome 3 Aortic jet velocity.

Comparison 1 Statin versus Placebo, Outcome 4 Freedom from valve replacement.

Comparison 1 Statin versus Placebo, Outcome 5 Death from cardiovascular cause.

Comparison 1 Statin versus Placebo, Outcome 6 Hospitalisation for any reason.

Comparison 1 Statin versus Placebo, Outcome 7 Severe adverse events.
| Statin versus Placebo for aortic valve stenosis | |||||
| Patient or population: patients with aortic valve stenosis | |||||
| Outcomes | Illustrative comparative risks* (95% CI) | Relative effect | No of Participants | Quality of the evidence | |
| Assumed risk | Corresponding risk | ||||
| Placebo | Statin | ||||
| Mean pressure gradient (mmHg) Better indicated by lower scores. Follow‐up: median 2.4 to 4.5 years | The mean mean pressure gradient in the control groups was | The mean mean pressure gradient in the intervention groups was | MD ‐0.54 (‐1.88 to 0.80) | 1935 | ⊕⊕⊝⊝ |
| Valve area (cm2) Follow‐up: median 2.4‐ to 3.5 years | The mean valve area in the control groups was | The mean valve area in the intervention groups was | MD ‐0.07 (‐0.28 to 0.14) | 127 | ⊕⊕⊝⊝ |
| Aortic jet velocity (m/s) | The mean aortic jet velocity in the control groups was | The mean aortic jet velocity in the intervention groups was | MD ‐0.06 (‐0.26 to 0.14) | 155 | ⊕⊕⊝⊝ |
| Freedom from valve replacement | Study population | RR 0.93 | 2360 | ⊕⊕⊕⊝ | |
| 281 per 1000 | 261 per 1000 | ||||
| Moderate population | |||||
| 222 per 1000 | 206 per 1000 | ||||
| Death from cardiovascular cause | Study population | RR 0.80 | 2297 | ⊕⊕⊝⊝ | |
| 56 per 1000 | 45 per 1000 | ||||
| Moderate population | |||||
| 39 per 1000 | 31 per 1000 | ||||
| Hospitalisation for any reason | 154 per 1000 | 129 per 1000 | RR 0.84 | 155 | ⊕⊝⊝⊝ |
| Adverse events ‐ Muscle pain | Study population | RR 0.91 | 2204 | ⊕⊕⊕⊝ | |
| 168 per 1000 | 153 per 1000 | ||||
| Moderate population | |||||
| 30 per 1000 | 27 per 1000 | ||||
| *The basis for the assumed risk (e.g. the median control group risk across studies) is provided in footnotes. The corresponding risk (and its 95% confidence interval) is based on the assumed risk in the comparison group and the relative effect of the intervention (and its 95% CI). | |||||
| GRADE Working Group grades of evidence | |||||
| 1 Downgraded by one due to randomisation and allocation being unclear for Rossebø 2008. | |||||
| Mild Aortic stenosis | Moderate Aortic stenosis | Severe Aortic stenosis | |
| Valve area | 1.5 cm² | 1.0 to 1.5 cm² | < 1.0 cm² |
| Mean pressure gradient | < 20 mmHg | 20 to 39 mmHg | > 40 mmHg |
| Aortic jet velocity | < 2.0 to 2.9 m per second | 3.0 to 3.9 m per second | > 4.0 m per second |
| Outcome or subgroup title | No. of studies | No. of participants | Statistical method | Effect size |
| 1 Mean pressure gradient Show forest plot | 2 | 1935 | Mean Difference (IV, Fixed, 95% CI) | ‐0.54 [‐1.88, 0.80] |
| 2 Valve area Show forest plot | 2 | 127 | Mean Difference (IV, Fixed, 95% CI) | ‐0.07 [‐0.28, 0.14] |
| 3 Aortic jet velocity Show forest plot | 1 | Mean Difference (IV, Fixed, 95% CI) | Subtotals only | |
| 4 Freedom from valve replacement Show forest plot | 4 | 2360 | Risk Ratio (M‐H, Fixed, 95% CI) | 0.93 [0.81, 1.06] |
| 5 Death from cardiovascular cause Show forest plot | 3 | 2297 | Risk Ratio (M‐H, Fixed, 95% CI) | 0.80 [0.56, 1.15] |
| 6 Hospitalisation for any reason Show forest plot | 1 | Risk Ratio (M‐H, Fixed, 95% CI) | Subtotals only | |
| 7 Severe adverse events Show forest plot | 4 | Risk Ratio (M‐H, Fixed, 95% CI) | Subtotals only | |
| 7.1 Muscle pain | 3 | 2204 | Risk Ratio (M‐H, Fixed, 95% CI) | 0.91 [0.75, 1.09] |
| 7.2 Hepatic enzymes elevation | 2 | 2109 | Risk Ratio (M‐H, Fixed, 95% CI) | 2.66 [1.24, 5.67] |
| 7.3 Hepatitis | 2 | 2141 | Risk Ratio (M‐H, Fixed, 95% CI) | 1.14 [0.40, 3.25] |
| 7.4 Gastrointestinal condition | 3 | 2296 | Risk Ratio (M‐H, Fixed, 95% CI) | 1.10 [0.96, 1.25] |
| 7.5 Creatine kinase | 2 | 2109 | Risk Ratio (M‐H, Fixed, 95% CI) | 0.75 [0.17, 3.33] |