Scolaris Content Display Scolaris Content Display

Study flow diagram.
Figures and Tables -
Figure 1

Study flow diagram.

'Risk of bias' graph: review authors' judgements about each risk of bias item presented as percentages across all included studies.
Figures and Tables -
Figure 2

'Risk of bias' graph: review authors' judgements about each risk of bias item presented as percentages across all included studies.

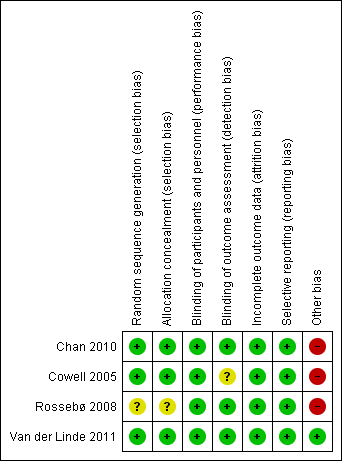
'Risk of bias' summary: review authors' judgements about each risk of bias item for each included study.
Figures and Tables -
Figure 3

'Risk of bias' summary: review authors' judgements about each risk of bias item for each included study.

Comparison 1 Statin versus Placebo, Outcome 1 Mean pressure gradient.
Figures and Tables -
Analysis 1.1

Comparison 1 Statin versus Placebo, Outcome 1 Mean pressure gradient.

Comparison 1 Statin versus Placebo, Outcome 2 Valve area.
Figures and Tables -
Analysis 1.2

Comparison 1 Statin versus Placebo, Outcome 2 Valve area.

Comparison 1 Statin versus Placebo, Outcome 3 Aortic jet velocity.
Figures and Tables -
Analysis 1.3

Comparison 1 Statin versus Placebo, Outcome 3 Aortic jet velocity.

Comparison 1 Statin versus Placebo, Outcome 4 Freedom from valve replacement.
Figures and Tables -
Analysis 1.4

Comparison 1 Statin versus Placebo, Outcome 4 Freedom from valve replacement.

Comparison 1 Statin versus Placebo, Outcome 5 Death from cardiovascular cause.
Figures and Tables -
Analysis 1.5

Comparison 1 Statin versus Placebo, Outcome 5 Death from cardiovascular cause.

Comparison 1 Statin versus Placebo, Outcome 6 Hospitalisation for any reason.
Figures and Tables -
Analysis 1.6

Comparison 1 Statin versus Placebo, Outcome 6 Hospitalisation for any reason.

Comparison 1 Statin versus Placebo, Outcome 7 Severe adverse events.
Figures and Tables -
Analysis 1.7

Comparison 1 Statin versus Placebo, Outcome 7 Severe adverse events.

Summary of findings for the main comparison. Statin versus Placebo for aortic valve stenosis

Statin versus Placebo for aortic valve stenosis

Patient or population: patients with aortic valve stenosis
Settings: Outpatients and hospitalisation
Intervention: Statin versus Placebo

Outcomes

Illustrative comparative risks* (95% CI)

Relative effect
(95% CI)

No of Participants
(studies)

Quality of the evidence
(GRADE)

Assumed risk

Corresponding risk

Placebo

Statin

Mean pressure gradient (mmHg)

Better indicated by lower scores.

Follow‐up: median 2.4 to 4.5 years

The mean mean pressure gradient in the control groups was
34 to 35 mmHg

The mean mean pressure gradient in the intervention groups was
0.54 lower
(1.88 lower to 0.8 higher)

MD ‐0.54 (‐1.88 to 0.80)

1935
(2 studies)

⊕⊕⊝⊝
low1,2

Valve area (cm2)
Better indicated by higher scores.

Follow‐up: median 2.4‐ to 3.5 years

The mean valve area in the control groups was
1 to 1.5 cm2

The mean valve area in the intervention groups was
0.07 lower
(0.28 lower to 0.14 higher)

MD ‐0.07 (‐0.28 to 0.14)

127
(2 studies)

⊕⊕⊝⊝
low2,3

Aortic jet velocity (m/s)
Follow‐up: median 2.1 years

The mean aortic jet velocity in the control groups was
3.45 m per second

The mean aortic jet velocity in the intervention groups was
0.06 lower
(0.26 lower to 0.14 higher)

MD ‐0.06 (‐0.26 to 0.14)

155
(1 study)

⊕⊕⊝⊝
low2, 3

Freedom from valve replacement
Follow‐up: median 2.1 to 4.5 years

Study population

RR 0.93
(0.81 to 1.06)

2360
(4 studies)

⊕⊕⊕⊝
moderate2

281 per 1000

261 per 1000
(227 to 298)

Moderate population

222 per 1000

206 per 1000
(180 to 235)

Death from cardiovascular cause
Follow‐up: median 2.1 to 4.5 years

Study population

RR 0.80
(0.56 to 1.15)

2297
(3 studies)

⊕⊕⊝⊝
low2,4

56 per 1000

45 per 1000
(31 to 64)

Moderate population

39 per 1000

31 per 1000
(22 to 45)

Hospitalisation for any reason
Follow‐up: median 2.1 years

154 per 1000

129 per 1000
(60 to 283)

RR 0.84
(0.39 to 1.84)

155
(1 study)

⊕⊝⊝⊝
very low2,3,4

Adverse events ‐ Muscle pain
Follow‐up: median 2.4 to 4.5 years

Study population

RR 0.91
(0.75 to 1.09)

2204
(3 studies)

⊕⊕⊕⊝
moderate2

168 per 1000

153 per 1000
(126 to 183)

Moderate population

30 per 1000

27 per 1000
(22 to 33)

*The basis for the assumed risk (e.g. the median control group risk across studies) is provided in footnotes. The corresponding risk (and its 95% confidence interval) is based on the assumed risk in the comparison group and the relative effect of the intervention (and its 95% CI).
CI: Confidence interval; RR: Risk ratio;

GRADE Working Group grades of evidence
High quality: Further research is very unlikely to change our confidence in the estimate of effect.
Moderate quality: Further research is likely to have an important impact on our confidence in the estimate of effect and may change the estimate.
Low quality: Further research is very likely to have an important impact on our confidence in the estimate of effect and is likely to change the estimate.
Very low quality: We are very uncertain about the estimate.

1 Downgraded by one due to randomisation and allocation being unclear for Rossebø 2008.
2 Downgraded by one due to possible risk of publication bias as only a small number of studies were identified.
3 Downgraded by one due to imprecision: small sample size with effect size crossing the line of no effect.
4 Downgraded by one due to imprecision: very few events < 300.

Figures and Tables -
Summary of findings for the main comparison. Statin versus Placebo for aortic valve stenosis
Table 1. Echocardiografic criteria for aortic valve stenosis (Vahanian 2012; Nishimura 2014)

Mild

Aortic stenosis

Moderate

Aortic stenosis

Severe

Aortic stenosis

Valve area

1.5 cm²

1.0 to 1.5 cm²

< 1.0 cm²

Mean pressure

gradient

< 20 mmHg

20 to 39 mmHg

> 40 mmHg

Aortic jet velocity

< 2.0 to 2.9 m

per second

3.0 to 3.9 m

per second

> 4.0 m

per second

Figures and Tables -
Table 1. Echocardiografic criteria for aortic valve stenosis (Vahanian 2012; Nishimura 2014)
Comparison 1. Statin versus Placebo

Outcome or subgroup title

No. of studies

No. of participants

Statistical method

Effect size

1 Mean pressure gradient Show forest plot

2

1935

Mean Difference (IV, Fixed, 95% CI)

‐0.54 [‐1.88, 0.80]

2 Valve area Show forest plot

2

127

Mean Difference (IV, Fixed, 95% CI)

‐0.07 [‐0.28, 0.14]

3 Aortic jet velocity Show forest plot

1

Mean Difference (IV, Fixed, 95% CI)

Subtotals only

4 Freedom from valve replacement Show forest plot

4

2360

Risk Ratio (M‐H, Fixed, 95% CI)

0.93 [0.81, 1.06]

5 Death from cardiovascular cause Show forest plot

3

2297

Risk Ratio (M‐H, Fixed, 95% CI)

0.80 [0.56, 1.15]

6 Hospitalisation for any reason Show forest plot

1

Risk Ratio (M‐H, Fixed, 95% CI)

Subtotals only

7 Severe adverse events Show forest plot

4

Risk Ratio (M‐H, Fixed, 95% CI)

Subtotals only

7.1 Muscle pain

3

2204

Risk Ratio (M‐H, Fixed, 95% CI)

0.91 [0.75, 1.09]

7.2 Hepatic enzymes elevation

2

2109

Risk Ratio (M‐H, Fixed, 95% CI)

2.66 [1.24, 5.67]

7.3 Hepatitis

2

2141

Risk Ratio (M‐H, Fixed, 95% CI)

1.14 [0.40, 3.25]

7.4 Gastrointestinal condition

3

2296

Risk Ratio (M‐H, Fixed, 95% CI)

1.10 [0.96, 1.25]

7.5 Creatine kinase

2

2109

Risk Ratio (M‐H, Fixed, 95% CI)

0.75 [0.17, 3.33]

Figures and Tables -
Comparison 1. Statin versus Placebo