Vacunas contra la gripe en adultos con cáncer e inmunodeprimidos
Information
- DOI:
- https://doi.org/10.1002/14651858.CD008983.pub3Copy DOI

- Database:
-
- Cochrane Database of Systematic Reviews
- Version published:
-
- 01 February 2018see what's new
- Type:
-
- Intervention
- Stage:
-
- Review
- Cochrane Editorial Group:
-
Cochrane Gynaecological, Neuro-oncology and Orphan Cancer Group
- Copyright:
-
- Copyright © 2018 The Cochrane Collaboration. Published by John Wiley & Sons, Ltd.
Article metrics
Altmetric:
Cited by:
Authors
Contributions of authors
Current version
Roni Bitterman (RB) and Noa Eliakim Raz (NER) co‐ordinated the review, guided by Mical Paul (MP). Both RB and NER contributed equally to the review.
RB and MP were responsible for undertaking searches and organised retrieval of papers.
RB and MP were responsible for data collection, writing to study authors for additional information.
RB and MP were responsible for screening search results, screening retrieved papers against inclusion criteria and appraising quality of papers and abstracting data from papers (disagreement was settled by discussion).
RB was responsible for entering data into Review Manager 5.
All review authors participated in analysis and interpretation of data.
RB and NER were responsible for writing the review.
Prior version
Inbal Levi‐Vinograd (ILV) wrote the original protocol.
Noa Eliakim Raz (NER) co‐ordinated the review, guided by Mical Paul (MP).
NER and ILV were responsible for undertaking searches and organised retrieval of papers.
NER and ILV were responsible for data collection, writing to study authors for additional information.
NER, ILV, AZT, LL and MP were responsible for screening search results, screening retrieved papers against inclusion criteria and appraising quality of papers and abstracting data from papers (the latter review author was arbiter in case of disagreement).
NER was responsible for entering data into Review Manager 5.
All review authors participated in analysis and interpretation of data.
NER was responsible for writing the review.
Sources of support
Internal sources
-
None, Other.
External sources
-
Beilinson Young Researcher Foundation, Israel.
-
Clalit Foundation, Israel.
Declarations of interest
None known.
Acknowledgements
We thank Jo Morrison for clinical and editorial advice, Jo Platt designing and running the searches and Gail Quinn, Clare Jess and Tracey Harrison for their contribution to the editorial process.
This project was supported by the National Institute for Health Research, via Cochrane Infrastructure funding to the Cochrane Gynaecological, Neuro‐oncology and Orphan Cancer Group. The views and opinions expressed therein are those of the authors and do not necessarily reflect those of the Systematic Reviews Programme, NIHR, NHS or the Department of Health.
Version history
| Published | Title | Stage | Authors | Version |
| 2018 Feb 01 | Influenza vaccines in immunosuppressed adults with cancer | Review | Roni Bitterman, Noa Eliakim‐Raz, Inbal Vinograd, Anca Zalmanovici Trestioreanu, Leonard Leibovici, Mical Paul | |
| 2013 Oct 29 | Influenza vaccines in immunosuppressed adults with cancer | Review | Noa Eliakim‐Raz, Inbal Vinograd, Anca Zalmanovici Trestioreanu, Leonard Leibovici, Mical Paul | |
| 2011 Feb 16 | Influenza vaccines for prevention of influenza‐like illness and influenza in immunosuppressed cancer patients | Protocol | Inbal Levi‐Vinograd, Anca Zalmanovici Trestioreanu, Leonard Leibovici, Mical Paul | |
Differences between protocol and review
The primary protocol‐defined outcome was: 'Influenza‐like illness defined as: ILI definition in study or Pneumonia of any cause or influenza‐related death'. We have changed the primary outcome to 'all‐cause mortality' since ultimately this is the goal of influenza vaccination and the composite outcome of infections, hospitalisations, chemotherapy delays and other effects of influenza. All components of the former primary outcome are included as secondary outcomes.
In the previous version of this review it was not stated whether studies conducted on a mixed population of adults and children would be included. Though this is a review on an adult population, we believe mixed population studies should not be omitted. We thus specifically stated that only studies that included more than 30% children were excluded.
When the original review was published adjuvanted influenza vaccines were not commercially available and no studies were conducted on people with cancer. However, as adjuvanted vaccines are now more prevalent we have added them to the updated review.
Though not stated specifically in the original protocol, studies evaluating different dosing regimens were excluded. In this version we stated this clearly.
Keywords
MeSH
Medical Subject Headings (MeSH) Keywords
- Adjuvants, Immunologic [administration & dosage];
- Bone Marrow Transplantation [mortality];
- Case‐Control Studies;
- Cause of Death;
- Cohort Studies;
- Hematologic Neoplasms [immunology, mortality];
- Immunocompromised Host [*immunology];
- Influenza Vaccines [*administration & dosage, immunology];
- Influenza, Human [epidemiology, immunology, *prevention & control];
- Neoplasms [*immunology, mortality];
- Observational Studies as Topic;
- Randomized Controlled Trials as Topic;
Medical Subject Headings Check Words
Adult; Humans;
PICOs


Risk of bias graph: review authors' judgements about each risk of bias item presented as percentages across all included studies.

Risk of bias summary: review authors' judgements about each risk of bias item for each included study.

Comparison 1 Influenza vaccine versus none, Outcome 1 All‐cause mortality.

Comparison 1 Influenza vaccine versus none, Outcome 2 Influenza‐like illness.
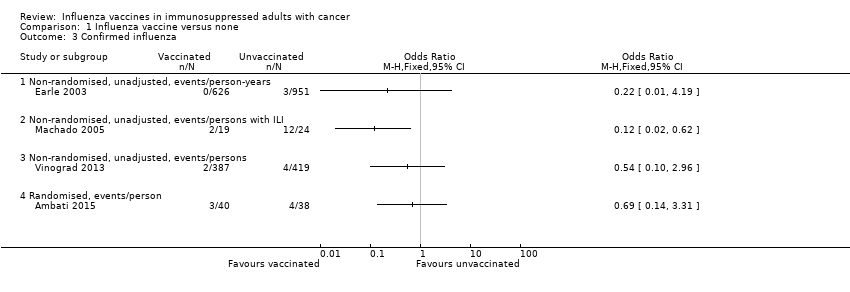
Comparison 1 Influenza vaccine versus none, Outcome 3 Confirmed influenza.
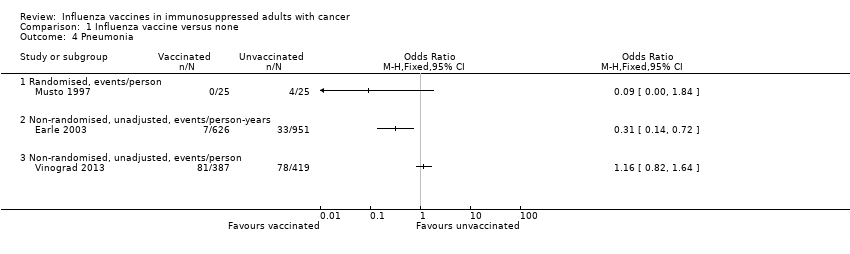
Comparison 1 Influenza vaccine versus none, Outcome 4 Pneumonia.

Comparison 1 Influenza vaccine versus none, Outcome 5 Any hospitalisation.

Comparison 1 Influenza vaccine versus none, Outcome 6 Influenza‐related mortality.
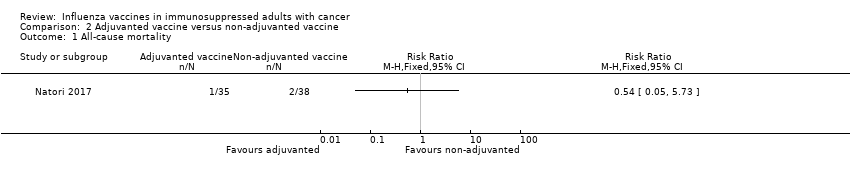
Comparison 2 Adjuvanted vaccine versus non‐adjuvanted vaccine, Outcome 1 All‐cause mortality.

Comparison 2 Adjuvanted vaccine versus non‐adjuvanted vaccine, Outcome 2 Confirmed influenza.
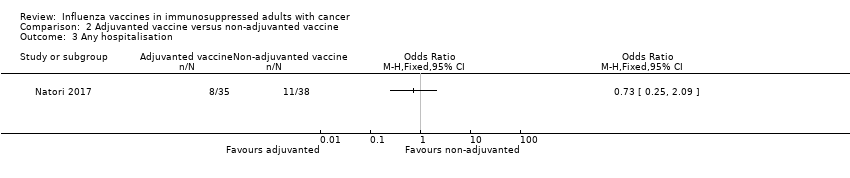
Comparison 2 Adjuvanted vaccine versus non‐adjuvanted vaccine, Outcome 3 Any hospitalisation.
| Influenza vaccine compared to no vaccine for immunosuppressed adults with cancer | ||||||
| Patient or population: immunosuppressed adults with cancer | ||||||
| Outcomes | Anticipated absolute effects* (95% CI) | Relative effect | № of participants | Certainty of the evidence | Comments | |
| Risk with no vaccine | Risk with influenza vaccine | |||||
| All‐cause mortality, solid cancers | Study population | OR 0.88 | 1577 | ⊕⊝⊝⊝ | ||
| 417 per 1,000 | 387 per 1,000 | |||||
| All‐cause mortality, solid and haematological malignancies | Study population | OR 0.42 | 806 | ⊕⊝⊝⊝ | ||
| 456 per 1,000 | 260 per 1,000 | |||||
| All‐cause mortality, allogeneic BMT | Study population | OR 1.25 | 78 | ⊕⊕⊝⊝ | ||
| 211 per 1,000 | 250 per 1,000 | |||||
| *The risk in the intervention group (and its 95% confidence interval) is based on the assumed risk in the comparison group and the relative effect of the intervention (and its 95% CI). | ||||||
| GRADE Working Group grades of evidence | ||||||
| 1 observational study, low Newcastle Ottawa score 2 confidence interval up to 1 3 observational study 4 observational study, high Newcastle Ottawa score 5 reporting bias‐ no trial registry, vague description of outcomes in methods, small numbers 6 wide confidence interval crossing 1 | ||||||
| Adjuvanted influenza vaccine compared to non‐adjuvanted influenza vaccine in immunosuppressed adults with cancer | ||||||
| Patient or population: immunosuppressed adults with cancer | ||||||
| Outcomes | Anticipated absolute effects* (95% CI) | Relative effect | № of participants | Certainty of the evidence | Comments | |
| Risk with non‐adjuvanted influenza vaccine | Risk with adjuvanted influenza vaccine | |||||
| All‐cause mortality, allogeneic BMT, | Study population | RR 0.54 | 73 | ⊕⊕⊝⊝ | ||
| 53 per 1,000 | 28 per 1,000 | |||||
| *The risk in the intervention group (and its 95% confidence interval) is based on the assumed risk in the comparison group and the relative effect of the intervention (and its 95% CI). | ||||||
| GRADE Working Group grades of evidence | ||||||
| 1 Small sample size, large confidence intervals | ||||||
| Ref. | Type of malignancy (influenza years) | No of cases | Influenza cases | Outcome |
| Allogeneic BMT/HSCT recipients (1997 to 1998) | 819 | 1.7% | Deaths 29% | |
| Autologous BMT/HSCT recipients (1997 to 1998) | 1154 | 0.2% | Deaths 0% | |
| Allogeneic BMT/HSCT recipients (1997 to 2000) | >819 |
| Deaths 23% | |
| Autologous BMT/HSCT recipients (1997 to 2000) | >1154 |
| Deaths 22% | |
| Allogeneic BMT/HSCT recipients (1996 to 2001) | 230 | 2.2% | Deaths 20% | |
| Autologous BMT/HSCT recipients (1996 to 2001) | 396 | 0% |
| |
| HSCT recipients (within 120 days after transplantation) (1989 to 2002) | 4797 | 1.3% | Deaths 10% Pneumonia 29% | |
| HSCT recipients (URTI symptoms present) (2001 to 2002) | 179 | 23% | Deaths 0% | |
| HSCT recipients AND haematologic malignancies (retrospective study of patients with laboratory‐confirmed viral respiratory infection) (2000 to 2002) | 343 | 33% | Deaths 4% Pneumonia 30% | |
| HSCT recipients | 230 | 29% |
| |
| Leukaemia | 61 | 33% |
| |
| Lymphoma | 37 | 51% |
| |
| Multiple myeloma | 15 | 40% |
| |
| CLL /acute leukaemia (hospitalised patients) (1993 to 1994) | 45 | 33% | Deaths 27% Pneumonia 80% | |
| CLL /acute leukaemia (1991 to 1992) | 37 | 11% | Deaths 25% Pneumonia 75% | |
| Solid cancers (H1N1 2009 pandemic) | 226 | 7% | 0% Deaths | |
| Haematologic malignancies (H1N1 2009 pandemic) | 167 (96 HSCT) | 17% (22%) | 0% Deaths | |
| HSCT recipients (prospective study of patients with laboratory‐confirmed H1N1 infection) (H1N1 2009 pandemic) | 286 | Deaths 6% Pneumonia 33% | ||
| Solid cancers (retrospective study of patients with laboratory‐confirmed H1N1 infection) (H1N1 2009 pandemic) | 115 | Deaths 9.5% Pneumonia 23% | ||
| BMT: bone marrow transplantation; CLL: chronic lymphocytic leukaemia; HSCT: haematopoietic stem cell transplantation; URTI: upper respiratory tract infection | ||||
| Selection | Comparability | Outcome | Total stars score | ||||||
| Representativeness of the exposed cohort | Selection of the non‐exposed cohort | Ascertainment of exposure | Demonstration that outcome of interest was not present at start of study | Comparability * | Assessment of outcome | Was follow‐up long enough for outcomes to occur? | Adequacy of follow‐up of cohorts ** | ||
| c | a | a | a | No | d *** | a | a | 5 | |
| c | a | a | a | No | b | a | a | 6 | |
| b | a | a+b | a | a+b | b+c | a | a | 10 | |
| * The most important factor to control for was the cancer stage. The second most important factor was functional capacity ** A follow‐up rate of >=80% was considered adequate *** Procedure was described but considered inadequate (through billing accounts and other administrative databases) | |||||||||
| Outcome | Design | All‐cause mortality | Influenza‐like‐ illness | Influenza‐ related mortality | Confirmed influenza | Pneumonia | Any hospitalisation | Chemotherapy interruptions | GMT | |||||||
| Vaccination status | Yes | No | Yes | No | Yes | No | Yes | No | Yes | No | Yes | No | Yes | No | ||
| Retrospective observational | Cox adjusted HR 0.88 (95% CI 0.78 to 1), 626 versus 951 py * | 0/626 py | 2/951 py | 0/626 py | 3/951 py | 7/626 py * | 33/951 py * | mean days 15.6, 95% CI 13.3 to 17.8 (N = 626 py) | mean days 16.4, 95% CI 14.3 to 18.4 (N = 951 py) | mean 5.06 days (N = 626 py) ** | mean 6.04 days (N = 951 py) ** | |||||
| Retrospective case‐control | 2/19 * | 12/24 * | ||||||||||||||
| Randomised, open‐label | 8/25 * | 18/25 * | 0/25 | 2/25 | 0/25 | 4/25 | 2/25 * | 12/25 * | ||||||||
| Prospective observational | MV adjusted OR 0.42 (95% CI 0.24 to 0.75) (387 versus 419p); MV adjusted OR in propensity‐matched cohort 0.42 (95% CI 0.24 to 0.76) (218p versus 218p) | 134/387 | 137/419 | 2/387 | 4/419 | 81/387 | 78/419 | 183/387 | 205/419 | 97/387 | 116/419 | |||||
| Randomised, open‐label | OR 1.25 (95%CI 0.43‐3.62) | 2/40 | 2/38 | 3/40 | 4/38 | 15*, 30*, 110 *** | 10*, 12.5*, 60 *** | |||||||||
| py= persons years * denoted statistically significant difference, P < 0.05 ** mean interval between chemotherapy bills *** data is for A/H1N1, A/H3N2 and B respectively CI: confidence interval;GMT: geometric mean titre. (Data are for 30 days post vaccination); HR: hazard ratio; OR: odds ratio; | ||||||||||||||||
| Outcome | Design | All‐cause mortality | Influenza‐related mortality | Confirmed influenza | Any hospitalisation | GMT | |||||
| Vaccination status | Adjuvanted | Non‐adjuvanted | Adjuvanted | Non‐adjuvanted | Adjuvanted | Non‐adjuvanted | Adjuvanted | Non‐adjuvanted | Adjuvanted | Non‐adjuvanted | |
| Randomised, open‐label | 1/35 | 2/38 | 0/35 | 0/38 | 5/35 | 3/38 | 8/35 | 11/38 | 319.6, 480.7, 298.9 * | 195.9, 359.3, 240.5 * | |
| * data is for A/H1N1, A/H3N2 and B respectively GMT: geometric mean titre. (Data are for 30 days post vaccination). | |||||||||||
| Outcome or subgroup title | No. of studies | No. of participants | Statistical method | Effect size |
| 1 All‐cause mortality Show forest plot | 3 | Odds Ratio (Fixed, 95% CI) | Totals not selected | |
| 1.1 Non‐randomised, adjusted, events/person‐years | 1 | Odds Ratio (Fixed, 95% CI) | 0.0 [0.0, 0.0] | |
| 1.2 Non‐randomised, adjusted, events/person | 1 | Odds Ratio (Fixed, 95% CI) | 0.0 [0.0, 0.0] | |
| 1.3 Randomised, events/person | 1 | Odds Ratio (Fixed, 95% CI) | 0.0 [0.0, 0.0] | |
| 2 Influenza‐like illness Show forest plot | 2 | Odds Ratio (M‐H, Fixed, 95% CI) | Totals not selected | |
| 2.1 Randomised, events/person | 1 | Odds Ratio (M‐H, Fixed, 95% CI) | 0.0 [0.0, 0.0] | |
| 2.2 Non‐randomised, unadjusted, events/person | 1 | Odds Ratio (M‐H, Fixed, 95% CI) | 0.0 [0.0, 0.0] | |
| 3 Confirmed influenza Show forest plot | 4 | Odds Ratio (M‐H, Fixed, 95% CI) | Totals not selected | |
| 3.1 Non‐randomised, unadjusted, events/person‐years | 1 | Odds Ratio (M‐H, Fixed, 95% CI) | 0.0 [0.0, 0.0] | |
| 3.2 Non‐randomised, unadjusted, events/persons with ILI | 1 | Odds Ratio (M‐H, Fixed, 95% CI) | 0.0 [0.0, 0.0] | |
| 3.3 Non‐randomised, unadjusted, events/persons | 1 | Odds Ratio (M‐H, Fixed, 95% CI) | 0.0 [0.0, 0.0] | |
| 3.4 Randomised, events/person | 1 | Odds Ratio (M‐H, Fixed, 95% CI) | 0.0 [0.0, 0.0] | |
| 4 Pneumonia Show forest plot | 3 | Odds Ratio (M‐H, Fixed, 95% CI) | Totals not selected | |
| 4.1 Randomised, events/person | 1 | Odds Ratio (M‐H, Fixed, 95% CI) | 0.0 [0.0, 0.0] | |
| 4.2 Non‐randomised, unadjusted, events/person‐years | 1 | Odds Ratio (M‐H, Fixed, 95% CI) | 0.0 [0.0, 0.0] | |
| 4.3 Non‐randomised, unadjusted, events/person | 1 | Odds Ratio (M‐H, Fixed, 95% CI) | 0.0 [0.0, 0.0] | |
| 5 Any hospitalisation Show forest plot | 2 | Odds Ratio (M‐H, Fixed, 95% CI) | Totals not selected | |
| 5.1 Randomised, events/person | 1 | Odds Ratio (M‐H, Fixed, 95% CI) | 0.0 [0.0, 0.0] | |
| 5.2 Non‐randomised, unadjusted, events/person | 1 | Odds Ratio (M‐H, Fixed, 95% CI) | 0.0 [0.0, 0.0] | |
| 6 Influenza‐related mortality Show forest plot | 3 | Odds Ratio (M‐H, Fixed, 95% CI) | Totals not selected | |
| 6.1 Randomised, events/person | 2 | Odds Ratio (M‐H, Fixed, 95% CI) | 0.0 [0.0, 0.0] | |
| 6.2 Non‐randomised, unadjusted, events/person‐years | 1 | Odds Ratio (M‐H, Fixed, 95% CI) | 0.0 [0.0, 0.0] | |
| Outcome or subgroup title | No. of studies | No. of participants | Statistical method | Effect size |
| 1 All‐cause mortality Show forest plot | 1 | Risk Ratio (M‐H, Fixed, 95% CI) | Totals not selected | |
| 2 Confirmed influenza Show forest plot | 1 | Odds Ratio (M‐H, Fixed, 95% CI) | Totals not selected | |
| 3 Any hospitalisation Show forest plot | 1 | Odds Ratio (M‐H, Fixed, 95% CI) | Totals not selected | |