Milnacipran for pain in fibromyalgia in adults
References
References to studies included in this review
References to studies excluded from this review
Additional references
References to other published versions of this review
Characteristics of studies
Characteristics of included studies [ordered by study ID]
Jump to:
| Methods | Prospective, multicentre, randomised, double‐blind, placebo‐controlled trial with parallel groups. Participants recruited from outpatient clinical/research centres in the USA and Canada 1‐ to 4‐week screening and washout (all FM therapy stopped), 4‐ to 6‐week flexible dose titration, 12‐week stable dose of milnacipran 100 mg/day (50 mg twice daily). Participants unable to tolerate 100 mg/day were discontinued from study Data collected using electronic PED; pain improvement based on time weighted average of mean weekly 24‐h recall pain scores | |
| Participants | Inclusion: age 18 to 70 years, ACR criteria for FM; physical function (FIQ) ≥ 4, and BDI > 25 at screening, mean PI ≥ 40 and ≤ 90/100 mm over 14‐day baseline period Excluded people with various medical and psychiatric conditions/risk factors, and previous exposure to milnacipran; women not using adequate contraception N = 1025 Mean age ˜ 49 years, M:F 48:977, 91% white, mean duration of symptoms ˜ 10.8 years, baseline pain > 60/100 mm | |
| Interventions | Milnacipran 100 mg/day, n = 516 Placebo, n = 509 Permitted analgesics: paracetamol, aspirin, NSAIDs Short‐term rescue medication up to week 4: tramadol, hydrocodone | |
| Outcomes | PI using 100 mm VAS: at least 30% and 50% improvement from baseline PGIC using 7‐point scale: much or very much improved Composite pain scores: 2‐part BOCF composite responder criteria: 24‐h and weekly recall pain scores using 100 mm VAS ≥ 30% improvement and PGIC score 'much' or 'very much' improved on 7‐point scale 3‐part BOCF composite responder criteria: 24‐h and weekly recall pain scores using 100 mm VAS ≥ 30% improvement, PGIC score 'much' or 'very much' improved on 7‐point scale, and SF‐36 PCS ≥ 6‐point improvement Adverse events Withdrawals | |
| Notes | Oxford Quality Score: R = 1, DB = 2, W = 1. Total = 4 | |
| Risk of bias | ||
| Bias | Authors' judgement | Support for judgement |
| Random sequence generation (selection bias) | Unclear risk | "Randomization assignments generated in blocks of four" |
| Allocation concealment (selection bias) | Low risk | "Assignments to treatment groups was conducted centrally (i.e. at the study level) using an interactive voice response system" |
| Blinding of participants and personnel (performance bias) | Low risk | "identical‐appearing capsules were used by all patients during all phases of the study" |
| Blinding of outcome assessment (detection bias) | Low risk | "Clinical staff, investigators, patients, and the study sponsor were blinded to treatment allocation" |
| Incomplete outcome data (attrition bias) | High risk | LOCF in analysis of individual outcomes, but BOCF in analysis of composite outcomes |
| Selective reporting (reporting bias) | Low risk | All relevant outcomes in methods were reported in some way, although not necessarily as our preferred outcome |
| Size | Low risk | Both groups > 200 participants |
| Methods | Multicentre, randomised, double‐blind, placebo‐controlled switch study. Participants recruited from multiple centres in the United States All participants used stable dosage of duloxetine 60 mg/day for ≥ 4 weeks before enrolment, followed by open‐label duloxetine 60 mg for 2 weeks. Participants with PI ≥ 40/100 then randomised to double‐blind treatment for 10 weeks with milnacipran (direct switch) or placebo (with 1 week blinded taper of duloxetine 30 mg/day) 1 week double‐blind down‐taper period at end of study | |
| Participants | Inclusion: FM (diagnostic criteria not given) with inadequate response to duloxetine 60 mg/day for ≥ 4 weeks, age 18 to 70 years, VAS 1‐week pain recall score ≥ 40 mm and ≤ 90 mm Excluded: people with various medical and psychiatric conditions or risk factors; women not using adequate contraception; concomitant medication except paracetamol, aspirin, and NSAIDs N = 100 Mean age ˜ 49 years, M:F 8:92, 91% white, mean baseline pain > 60/100 mm | |
| Interventions | Milnacipran 100 to 200 mg/day with option to reduce to 50 mg/day or 75 mg/day during the first 2 weeks if not tolerated, n = 79 Placebo, n = 21 | |
| Outcomes | PGIC using 7‐point scale: much or very much improved PI using 100 mm VAS: change from baseline | |
| Notes | Oxford Quality Score: R = 1, DB = 1, W = 1. Total = 3 | |
| Risk of bias | ||
| Bias | Authors' judgement | Support for judgement |
| Random sequence generation (selection bias) | Unclear risk | Method of sequence generation not described |
| Allocation concealment (selection bias) | Unclear risk | Method not described |
| Blinding of participants and personnel (performance bias) | Unclear risk | Method to maintain blinding not described |
| Blinding of outcome assessment (detection bias) | Unclear risk | Method to maintain blinding not described |
| Incomplete outcome data (attrition bias) | High risk | LOCF in individual outcome analysis |
| Selective reporting (reporting bias) | Low risk | No problems detected |
| Size | High risk | < 50 participants in each treatment arm |
| Methods | Prospective, multicentre, randomised, double‐blind, placebo‐controlled trial with parallel groups. Participants recruited from outpatient centres in Europe 1‐ to 4‐week screening and washout (all FM therapy stopped), 4‐week dose escalation, 12‐week stable dose with target milnacipran 200 mg/day (100 mg twice daily), 9‐day down‐titration, 2‐week follow‐up Data collected using electronic PED: daily PI averaged for 2 weeks immediately preceding visit day Adverse event data collected by spontaneous reporting, non‐leading questions, and clinical evaluation | |
| Participants | Inclusion: age 18 to 70 years, met ACR criteria for FM; physical function (FIQ) ≥ 3, BDI > 25 at screening; mean PI ≥ 40 and ≥ 90 over 14‐day baseline period Excluded: people with various medical and psychiatric conditions or risk factors, considered unlikely to comply with treatment; women not using adequate contraception or pregnant N = 884 Mean age ˜ 49 years, M:F 58:826, mean duration of symptoms ˜ 9.5 years | |
| Interventions | Milnacipran 200 mg/day, n = 435 Placebo, n = 449 | |
| Outcomes | PI using 100 mm VAS: 30% improvement from baseline PGIC using 7‐point scale: much or very much improved Composite pain score: 2‐measure BOCF composite responder criteria: 24‐h morning recall pain scores ≥ 30% improvement using 100 mm VAS, PGIC score of 'very much' or 'much' improved Adverse events Withdrawals | |
| Notes | Oxford Quality Score: R = 1, DB = 2, W = 1. Total = 4 | |
| Risk of bias | ||
| Bias | Authors' judgement | Support for judgement |
| Random sequence generation (selection bias) | Unclear risk | Method of sequence generation not described |
| Allocation concealment (selection bias) | Unclear risk | Method not described |
| Blinding of participants and personnel (performance bias) | Low risk | "In patients receiving placebo, twice‐daily sham dosing was used to maintain blinding" |
| Blinding of outcome assessment (detection bias) | Low risk | "In patients receiving placebo, twice‐daily sham dosing was used to maintain blinding" |
| Incomplete outcome data (attrition bias) | High risk | LOCF in analysis of individual outcomes, but BOCF in analysis of composite outcomes |
| Selective reporting (reporting bias) | Low risk | All relevant outcomes in methods were reported in some way, although not necessarily as our preferred outcome |
| Size | Low risk | Both groups > 200 participants |
| Methods | Prospective, multicentre, randomised, double‐blind, placebo‐controlled trial with parallel groups. Participants recruited from outpatient centres in United States. 1‐ to 4‐week washout (all FM therapy stopped), 3‐week dose escalation, 12‐week stable dose with 100 mg/day (50 mg twice daily) or 200 mg/day (100 mg twice daily) milnacipran Data collected using electronic PED: daily PI averaged for 2 weeks immediately preceding visit day Adverse event data collected by spontaneous reporting and clinical evaluation | |
| Participants | Inclusion: age 18 to 70 years, met ACR criteria for FM, physical function (FIQ) ≥ 4 and BDI > 25 at screening, baseline PI ≥ 40/100 Excluded: various medical and psychiatric conditions/risk factors, interfering medication over the last 30 days, women not using adequate contraception or pregnant N = 1151 Mean age ˜50 years, M:F 45:1151, ˜ 93% white, mean duration of symptoms ˜ 10 years, baseline pain > 60/100 mm | |
| Interventions | Milnacipran 100 mg/day, n = 401 (396 for analysis) Milnacipran 200 mg/day, n = 410 (399 for analyses) Placebo, n = 405 (401 for analysis) | |
| Outcomes | PI using 100 mm VAS: 30% improvement from baseline PGIC using 7‐point scale: much or very much improved Composite pain scores: 2‐measure BOCF composite responder criteria: 24‐h and weekly recall pain scores using 100 mm VAS ≥ 30% improvement and PGIC score 'much' or 'very much' improved on 7‐point scale 3‐measure BOCF composite responder criteria: 24‐h and weekly recall pain scores using 100 mm VAS ≥ 30% improvement, PGIC score 'much' or 'very much' improved on 7‐point scale, and SF‐36 PCS ≥ 6‐point improvement Adverse events Withdrawals | |
| Notes | Oxford Quality Score: R = 2, DB = 2, W = 1, Total = 5/5 | |
| Risk of bias | ||
| Bias | Authors' judgement | Support for judgement |
| Random sequence generation (selection bias) | Low risk | "Randomization lists for each site were generated by a computer program" |
| Allocation concealment (selection bias) | Low risk | "randomization assignments were made via an interactive voice response system" |
| Blinding of participants and personnel (performance bias) | Low risk | "Milnacipran and placebo capsules were visually identical" |
| Blinding of outcome assessment (detection bias) | Low risk | "Clinical staff, investigators, patients, and the study sponsor were blinded to treatment allocation" |
| Incomplete outcome data (attrition bias) | High risk | LOCF in analysis of individual outcomes, but BOCF in analysis of composite outcomes |
| Selective reporting (reporting bias) | Low risk | All relevant outcomes in methods were reported in some way, although not necessarily as our preferred outcome |
| Size | Low risk | All groups > 200 participants |
| Methods | Double‐blind randomisation to placebo or continuing on milnacipran 50 to 200 mg ‐ the established daily dose for individual participants. Participants recruited from 58 centres in the United States There was a 4‐week maintenance phase, a 12‐week randomised withdrawal phase, and 1 week of tapering | |
| Participants | Adults meeting the 1990 ACR criteria for FM entered directly from a long‐term, open‐label, flexible‐dose, lead‐in study in which they received milnacipran 50 to 200 mg/day for up to 3.25 years. They had previously received up to 15 months of treatment with milnacipran 100 or 200 mg/day during double‐blind studies resulting in up to 4.5 years of milnacipran exposure before entering the discontinuation study. Participants had to be classified as responders (≥ 50% pain improvement after long‐term treatment) and be receiving a minimum of milnacipran 100 mg/day | |
| Interventions | Milnacipran 100 or 200 mg/day, n = 100 Placebo, n = 51 | |
| Outcomes | Loss of therapeutic response, defined as time from randomisation to the first double‐blind study visit in which a participant had < 30% reduction in VAS pain from pre‐milnacipran exposure or worsening of FM requiring alternative treatment, as judged by the study's principal investigator PGIC Quality of life (SF‐36) | |
| Notes | Oxford Quality Score: R = 2, DB = 2, W = 1. Total = 5. Note, though, that this score is not designed for EERW trials | |
| Risk of bias | ||
| Bias | Authors' judgement | Support for judgement |
| Random sequence generation (selection bias) | Low risk | Computer generation implied |
| Allocation concealment (selection bias) | Low risk | Remote allocation using "interactive voice and/or web response system" |
| Blinding of participants and personnel (performance bias) | Low risk | Medication "sealed and coded to maintain the double‐blinding" |
| Blinding of outcome assessment (detection bias) | Low risk | Medication "sealed and coded to maintain the double‐blinding" |
| Incomplete outcome data (attrition bias) | Unclear risk | LOCF imputation for missing data |
| Selective reporting (reporting bias) | High risk | Participants who did not experience loss of therapeutic response or withdrew for other reasons were censored in the primary efficacy analysis |
| Size | Unclear risk | 50 to 200 participants per treatment arm |
| Methods | Prospective, multicentre, randomised, double‐blind, placebo‐controlled trial with parallel groups. Participants recruited from 59 outpatient clinical/research centres in the United States Electronic PED used to collect data; 1‐ to 4‐week screening and washout (all FM therapy stopped), 3‐week baseline measurement and PED training, 24‐week stable dose with placebo or milnacipran 100 mg/day (50 mg twice daily) or milnacipran 200 mg/day (100 mg twice daily) (ratio milnacipran 100 mg/day:milnacipran 200 mg:placebo = 1:2:1) Adverse events collected from spontaneous reports, clinical observation, and clinical evaluation | |
| Participants | Inclusion: age 18 to 70 years, met ACR criteria for FM, physical function (FIQ) ≥ 4, BDI > 25, and PI > 50/100 mm Exclusion: people with various medical and psychiatric conditions/risk factors; women not using adequate contraception N = 888 Mean age ˜ 49 years, M:F 39:849, ˜ 93% white, mean duration of symptoms ˜ 5.5 years, baseline PI > 60/100 at screening Analgesics prohibited, except for paracetamol, aspirin, stable doses of NSAIDs, and hydrocortisone | |
| Interventions | Milnacipran 100 mg/day, n = 224 Milnacipran 200 mg/day, n = 441 Placebo, n = 223 | |
| Outcomes | Composite pain scores: 2‐measure BOCF composite responder criteria: 24‐h and 2‐week mean recall pain scores using 100 mm VAS ≥ 30% improvement and PGIC score 'much' or 'very much' improved on 7‐point scale 3‐measure BOCF composite responder criteria: 24‐h and weekly recall pain scores using 100 mm VAS ≥ 30% improvement, PGIC score 'much' or 'very much' improved on 7‐point scale, and SF‐36 PCS ≥ 6‐point improvement Adverse events Withdrawals | |
| Notes | Oxford Quality Score: R = 1, DB = 1, W = 1. Total = 3/5 | |
| Risk of bias | ||
| Bias | Authors' judgement | Support for judgement |
| Random sequence generation (selection bias) | Unclear risk | Method of sequence generation not described |
| Allocation concealment (selection bias) | Unclear risk | Method not described |
| Blinding of participants and personnel (performance bias) | Unclear risk | Method to maintain blinding not described |
| Blinding of outcome assessment (detection bias) | Unclear risk | Method to maintain blinding not described |
| Incomplete outcome data (attrition bias) | High risk | LOCF in individual outcome analysis |
| Selective reporting (reporting bias) | Low risk | All relevant outcomes in methods were reported in some way, although not necessarily as our preferred outcome |
| Size | Low risk | All groups > 200 participants |
| Methods | Prospective, multicentre, randomised, double‐blind, placebo‐controlled trial with parallel groups. Participants recruited from outpatient centres in US with experience in treating FM Electronic PED used to collect data; 1‐ to 4‐week screening and washout (all FM therapy stopped), 2‐week baseline measurement and PED training, 4‐week dose titration, 8‐week stable dose with milnacipran 200 mg/day (once daily), milnacipran 200 mg/day (100 mg twice daily), or placebo (ratio once daily:twice daily:placebo = 3:3:2) Adverse events collected from spontaneous reports, clinical observation, and clinical evaluation | |
| Participants | Inclusion: age 18 to 70 years, met ACR criteria for FM; baseline PI ≥ 10/20 (Gracely log‐scale) Exclusion: people with various medical and psychiatric conditions/risk factors, women not using adequate contraception N = 125 participants Mean age 46 to 48 years, 96% to 98% female, 79% to 89% white, mean duration of symptoms 3.8 to 4.3 years Analgesics prohibited, except for stable doses of paracetamol, aspirin, and NSAIDs | |
| Interventions | Milnacipran 200 mg/day (once daily), n = 46 Milnacipran 200 mg/day (twice daily), n = 51 Placebo, n = 28 | |
| Outcomes | Pain (Short‐form McGill Pain Questionnaire, VAS, Gracely and Kwilosz anchored logarithmic scale) PGIC at end of study (completers analysis only) Adverse events Withdrawals | |
| Notes | Oxford Quality Score: R = 2 (from Gendreau 2005), DB = 2 (from Gendreau 2005), W = 1. Total = 5/5 | |
| Risk of bias | ||
| Bias | Authors' judgement | Support for judgement |
| Random sequence generation (selection bias) | Low risk | "Randomization was performed by an independent contract research organization that generated randomisation assignments" (from Gendreau 2005 ‐ see Vitton 2004) |
| Allocation concealment (selection bias) | Unclear risk | Method not described |
| Blinding of participants and personnel (performance bias) | Low risk | "Blinding was rigorously maintained, as all patients took capsules morning and evening that were visually identical" (from Gendreau 2005 ‐ see Vitton 2004) |
| Blinding of outcome assessment (detection bias) | Low risk | "Patients and investigators remained blinded to patients' treatment allocation" (from Gendreau 2005 ‐ see Vitton 2004) |
| Incomplete outcome data (attrition bias) | High risk | LOCF for all analyses |
| Selective reporting (reporting bias) | Low risk | All relevant outcomes in methods were reported in some way, although not necessarily as our preferred outcome |
| Size | High risk | All groups ≤ 51 |
ACR: American College of Rheumatology; BDI: Beck Depression Inventory, BOCF: baseline observation carried forward; DB: double‐blinding; EERW: enriched enrolment randomised withdrawal; F: female; FIQ: fibromyalgia impact questionnaire; FM: fibromyalgia; h: hour; LOCF: last observation carried forward; M: male; N: number of participants in study; n: number of participants in treatment arm; NSAID: non‐steroidal anti‐inflammatory drug; PCS: physical component summary; PED: patient experience diary; PGIC: patient global impression of change; PI: pain intensity; R: randomisation; SF‐36: 36‐item short form; VAS: visual analogue scale; W: withdrawals.
Characteristics of excluded studies [ordered by study ID]
Jump to:
| Study | Reason for exclusion |
| Less than 8 weeks of treatment phase | |
| Study of effect on body weight not pain | |
| Participants from Branco 2010 re‐randomised for extension study | |
| No placebo control (trial followed a 6‐month lead‐in study, where placebo controls were re‐randomised to treatment with milnacipran) | |
| Systematic review | |
| Less than 8 weeks of treatment phase | |
| Less than 8 weeks of treatment phase | |
| Pooled analysis of three fibromyalgia trials | |
| Open‐label study | |
| Short conference abstract, not full publication |
Data and analyses
| Outcome or subgroup title | No. of studies | No. of participants | Statistical method | Effect size |
| 1 At least 30% pain relief Show forest plot | 3 | 1925 | Risk Ratio (M‐H, Fixed, 95% CI) | 1.38 [1.22, 1.57] |
| Analysis 1.1  Comparison 1 Milnacipran 100 mg/day versus placebo, Outcome 1 At least 30% pain relief. | ||||
| 2 PGIC 'much improved' or 'very much improved' Show forest plot | 3 | 1925 | Risk Ratio (M‐H, Fixed, 95% CI) | 1.51 [1.32, 1.73] |
| Analysis 1.2  Comparison 1 Milnacipran 100 mg/day versus placebo, Outcome 2 PGIC 'much improved' or 'very much improved'. | ||||
| 3 At least 50% pain relief Show forest plot | 2 | 1250 | Risk Ratio (M‐H, Fixed, 95% CI) | 1.57 [1.26, 1.96] |
| Analysis 1.3  Comparison 1 Milnacipran 100 mg/day versus placebo, Outcome 3 At least 50% pain relief. | ||||
| 4 Composite 1 Show forest plot | 3 | 2272 | Risk Ratio (M‐H, Fixed, 95% CI) | 1.46 [1.25, 1.71] |
| Analysis 1.4  Comparison 1 Milnacipran 100 mg/day versus placebo, Outcome 4 Composite 1. | ||||
| 5 Composite 2 Show forest plot | 3 | 2272 | Risk Ratio (M‐H, Fixed, 95% CI) | 1.73 [1.41, 2.14] |
| Analysis 1.5  Comparison 1 Milnacipran 100 mg/day versus placebo, Outcome 5 Composite 2. | ||||
| 6 At least one adverse event Show forest plot | 4 | 2378 | Risk Difference (M‐H, Fixed, 95% CI) | 0.07 [0.04, 0.10] |
| Analysis 1.6 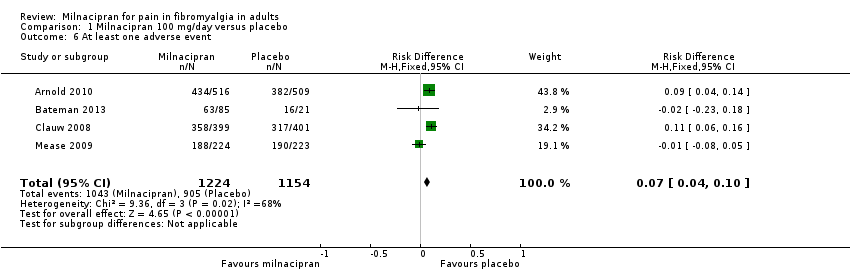 Comparison 1 Milnacipran 100 mg/day versus placebo, Outcome 6 At least one adverse event. | ||||
| 7 Serious adverse events Show forest plot | 4 | 2378 | Risk Ratio (M‐H, Fixed, 95% CI) | 0.90 [0.47, 1.73] |
| Analysis 1.7  Comparison 1 Milnacipran 100 mg/day versus placebo, Outcome 7 Serious adverse events. | ||||
| 8 Individual adverse events Show forest plot | 4 | Risk Ratio (M‐H, Fixed, 95% CI) | Subtotals only | |
| Analysis 1.8  Comparison 1 Milnacipran 100 mg/day versus placebo, Outcome 8 Individual adverse events. | ||||
| 8.1 Nausea | 4 | 2378 | Risk Ratio (M‐H, Fixed, 95% CI) | 1.84 [1.59, 2.12] |
| 8.2 Constipation | 3 | 2272 | Risk Ratio (M‐H, Fixed, 95% CI) | 4.12 [2.97, 5.71] |
| 8.3 Hot flush | 4 | 2378 | Risk Ratio (M‐H, Fixed, 95% CI) | 4.12 [2.79, 6.06] |
| 8.4 Dizziness | 4 | 2378 | Risk Ratio (M‐H, Fixed, 95% CI) | 2.05 [1.52, 2.77] |
| 8.5 Palpitations | 3 | 2272 | Risk Ratio (M‐H, Fixed, 95% CI) | 3.02 [1.97, 4.63] |
| 8.6 Increased heart rate/tachycardia | 3 | 2272 | Risk Ratio (M‐H, Fixed, 95% CI) | 5.42 [2.87, 10.25] |
| 8.7 Hyperhidrosis | 4 | 2378 | Risk Ratio (M‐H, Fixed, 95% CI) | 4.99 [3.01, 8.26] |
| 8.8 Vomiting | 2 | 1247 | Risk Ratio (M‐H, Fixed, 95% CI) | 2.70 [1.44, 5.05] |
| 8.9 Hypertension | 3 | 1931 | Risk Ratio (M‐H, Fixed, 95% CI) | 4.58 [2.45, 8.58] |
| 9 All‐cause withdrawals Show forest plot | 4 | 2379 | Risk Ratio (M‐H, Fixed, 95% CI) | 1.13 [1.01, 1.27] |
| Analysis 1.9  Comparison 1 Milnacipran 100 mg/day versus placebo, Outcome 9 All‐cause withdrawals. | ||||
| 10 Lack of efficacy withdrawals Show forest plot | 4 | 2379 | Risk Ratio (M‐H, Fixed, 95% CI) | 0.72 [0.55, 0.94] |
| Analysis 1.10  Comparison 1 Milnacipran 100 mg/day versus placebo, Outcome 10 Lack of efficacy withdrawals. | ||||
| 11 Adverse event withdrawals Show forest plot | 4 | 2379 | Risk Ratio (M‐H, Fixed, 95% CI) | 1.62 [1.33, 1.97] |
| Analysis 1.11  Comparison 1 Milnacipran 100 mg/day versus placebo, Outcome 11 Adverse event withdrawals. | ||||
| Outcome or subgroup title | No. of studies | No. of participants | Statistical method | Effect size |
| 1 At least 30% pain relief Show forest plot | 3 | 1798 | Risk Ratio (M‐H, Fixed, 95% CI) | 1.35 [1.18, 1.54] |
| Analysis 2.1  Comparison 2 Milnacipran 200 mg/day versus placebo, Outcome 1 At least 30% pain relief. | ||||
| 2 PGIC 'much improved' or 'very much improved' Show forest plot | 2 | 1673 | Risk Ratio (M‐H, Fixed, 95% CI) | 1.57 [1.34, 1.83] |
| Analysis 2.2  Comparison 2 Milnacipran 200 mg/day versus placebo, Outcome 2 PGIC 'much improved' or 'very much improved'. | ||||
| 3 Composite 1 Show forest plot | 3 | 2337 | Risk Ratio (M‐H, Fixed, 95% CI) | 1.55 [1.31, 1.84] |
| Analysis 2.3  Comparison 2 Milnacipran 200 mg/day versus placebo, Outcome 3 Composite 1. | ||||
| 4 Composite 2 Show forest plot | 2 | 1461 | Risk Ratio (M‐H, Fixed, 95% CI) | 1.61 [1.21, 2.13] |
| Analysis 2.4  Comparison 2 Milnacipran 200 mg/day versus placebo, Outcome 4 Composite 2. | ||||
| 5 At least one adverse event Show forest plot | 3 | 2338 | Risk Ratio (M‐H, Fixed, 95% CI) | 1.10 [1.06, 1.15] |
| Analysis 2.5  Comparison 2 Milnacipran 200 mg/day versus placebo, Outcome 5 At least one adverse event. | ||||
| 6 Serious adverse events Show forest plot | 4 | 2463 | Risk Ratio (M‐H, Fixed, 95% CI) | 0.91 [0.52, 1.60] |
| Analysis 2.6  Comparison 2 Milnacipran 200 mg/day versus placebo, Outcome 6 Serious adverse events. | ||||
| 7 Individual adverse events Show forest plot | 3 | Risk Ratio (M‐H, Fixed, 95% CI) | Subtotals only | |
| Analysis 2.7  Comparison 2 Milnacipran 200 mg/day versus placebo, Outcome 7 Individual adverse events. | ||||
| 7.1 Nausea | 3 | 2338 | Risk Ratio (M‐H, Fixed, 95% CI) | 2.37 [2.00, 2.80] |
| 7.2 Constipation | 3 | 2338 | Risk Ratio (M‐H, Fixed, 95% CI) | 5.01 [3.46, 7.24] |
| 7.3 Hot flush | 3 | 2338 | Risk Ratio (M‐H, Fixed, 95% CI) | 6.71 [4.06, 11.09] |
| 7.4 Dizziness | 3 | 2338 | Risk Ratio (M‐H, Fixed, 95% CI) | 1.63 [1.22, 2.18] |
| 7.5 Palpitations | 3 | 2288 | Risk Ratio (M‐H, Fixed, 95% CI) | 3.38 [2.17, 5.29] |
| 7.6 Increased heart rate/tachycardia | 3 | 2338 | Risk Ratio (M‐H, Fixed, 95% CI) | 6.81 [3.54, 13.13] |
| 7.7 Hyperhidrosis | 2 | 1461 | Risk Ratio (M‐H, Fixed, 95% CI) | 5.18 [2.67, 10.02] |
| 7.8 Vomiting | 3 | 2338 | Risk Ratio (M‐H, Fixed, 95% CI) | 2.30 [1.48, 3.58] |
| 8 All‐cause withdrawals Show forest plot | 4 | 2416 | Risk Ratio (M‐H, Fixed, 95% CI) | 1.38 [1.22, 1.57] |
| Analysis 2.8  Comparison 2 Milnacipran 200 mg/day versus placebo, Outcome 8 All‐cause withdrawals. | ||||
| 9 Lack of efficacy withdrawals Show forest plot | 4 | 2462 | Risk Ratio (M‐H, Fixed, 95% CI) | 0.66 [0.51, 0.87] |
| Analysis 2.9 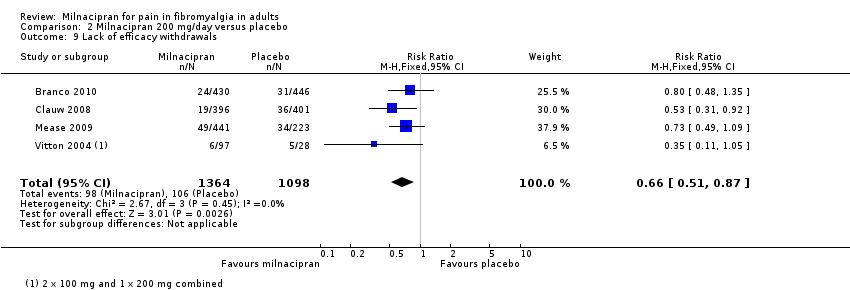 Comparison 2 Milnacipran 200 mg/day versus placebo, Outcome 9 Lack of efficacy withdrawals. | ||||
| 10 Adverse event withdrawals Show forest plot | 4 | 2470 | Risk Ratio (M‐H, Fixed, 95% CI) | 2.51 [2.03, 3.09] |
| Analysis 2.10 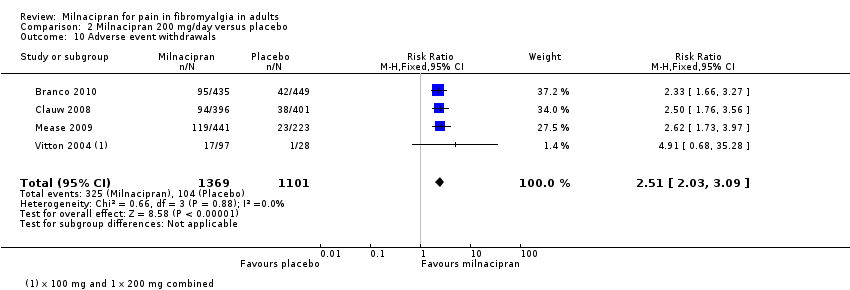 Comparison 2 Milnacipran 200 mg/day versus placebo, Outcome 10 Adverse event withdrawals. | ||||

Study flow diagram. EERW: enriched enrolment randomised withdrawal; RCT: randomised controlled trial.

Risk of bias graph: review authors' judgements about each risk of bias item presented as percentages across all included studies.
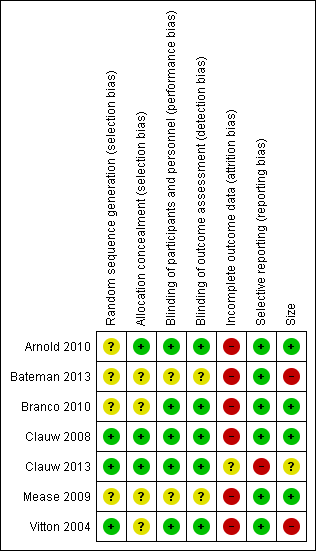
Risk of bias summary: review authors' judgements about each risk of bias item for each included study.

Forest plot of comparison: 1 Milnacipran 100 mg/day versus placebo, outcome: 1.1 At least 30% pain relief.

Forest plot of comparison: 1 Milnacipran 100 mg/day versus placebo, outcome: 1.8 Individual adverse events.
Comparison 1 Milnacipran 100 mg/day versus placebo, Outcome 1 At least 30% pain relief.
Comparison 1 Milnacipran 100 mg/day versus placebo, Outcome 2 PGIC 'much improved' or 'very much improved'.
Comparison 1 Milnacipran 100 mg/day versus placebo, Outcome 3 At least 50% pain relief.
Comparison 1 Milnacipran 100 mg/day versus placebo, Outcome 4 Composite 1.
Comparison 1 Milnacipran 100 mg/day versus placebo, Outcome 5 Composite 2.
Comparison 1 Milnacipran 100 mg/day versus placebo, Outcome 6 At least one adverse event.
Comparison 1 Milnacipran 100 mg/day versus placebo, Outcome 7 Serious adverse events.
Comparison 1 Milnacipran 100 mg/day versus placebo, Outcome 8 Individual adverse events.
Comparison 1 Milnacipran 100 mg/day versus placebo, Outcome 9 All‐cause withdrawals.
Comparison 1 Milnacipran 100 mg/day versus placebo, Outcome 10 Lack of efficacy withdrawals.
Comparison 1 Milnacipran 100 mg/day versus placebo, Outcome 11 Adverse event withdrawals.
Comparison 2 Milnacipran 200 mg/day versus placebo, Outcome 1 At least 30% pain relief.
Comparison 2 Milnacipran 200 mg/day versus placebo, Outcome 2 PGIC 'much improved' or 'very much improved'.
Comparison 2 Milnacipran 200 mg/day versus placebo, Outcome 3 Composite 1.
Comparison 2 Milnacipran 200 mg/day versus placebo, Outcome 4 Composite 2.
Comparison 2 Milnacipran 200 mg/day versus placebo, Outcome 5 At least one adverse event.
Comparison 2 Milnacipran 200 mg/day versus placebo, Outcome 6 Serious adverse events.
Comparison 2 Milnacipran 200 mg/day versus placebo, Outcome 7 Individual adverse events.
Comparison 2 Milnacipran 200 mg/day versus placebo, Outcome 8 All‐cause withdrawals.
Comparison 2 Milnacipran 200 mg/day versus placebo, Outcome 9 Lack of efficacy withdrawals.
Comparison 2 Milnacipran 200 mg/day versus placebo, Outcome 10 Adverse event withdrawals.
| Milnacipran compared with placebo for fibromyalgia | ||||||
| Patient or population: adults with fibromyalgia Settings: community Intervention: milnacipran 100 and 200 mg/day Comparison: placebo | ||||||
| Outcomes | Probable outcome with placebo | Probable outcome with intervention | Risk ratio (95% CI) and NNT or NNH | No of studies and participants | Quality of the evidence | Comments |
| Milnacipran 100 mg/day | ||||||
| At least 50% reduction in pain or equivalent (substantial) | 180 in 1000 | 270 in 1000 | RR 1.6 (1.3 to 2.0) NNT 10 (7.0 to 20) | 2 studies, 1250 participants | Moderate | Only 2 studies, 1 much smaller than other Downgrade because of LOCF analysis |
| At least 30% reduction in pain or equivalent (moderate) | 300 in 1000 | 410 in 1000 | RR 1.4 (1.2 to 1.6) NNT 9.0 (6.5 to 15) | 3 studies, 1925 participants | High | Downgrade because of LOCF analysis, but upgrade as the result is supported by Composite outcome 1 giving a very similar result; this is a BOCF analysis for the outcome plus PGIC much or very much improved |
| Adverse event withdrawals | 120 in 1000 | 190 in 1000 | RR 1.6 (1.3 to 2.0) NNH 14 (10 to 24) | 4 studies, 2379 participants | High | ‐ |
| Serious adverse events | 16 in 1000 | 15 in 1000 | RR 0.90 (0.47 to 1.7) NNH not calculated | 4 studies, 2378 participants | Low | Few events (36) |
| Death | None reported | |||||
| Milnacipran 200 mg/day | ||||||
| At least 50% reduction in pain or equivalent (substantial) | 140 in 1000 | 280 in 1000 | Not calculated | 1 study, 125 participants | Very low | 1 study, few participants |
| At least 30% reduction in pain or equivalent (moderate) | 290 in 1000 | 390 in 1000 | RR 1.4 (1.2 to 1.5) NNT 10 (7.0 to 18) | 3 studies, 1798 participants | High | Downgrade because of LOCF analysis, but upgrade as the result is supported by composite outcome 1 giving a very similar result; this is a BOCF analysis for the outcome plus PGIC much or very much improved |
| Adverse event withdrawals | 95 in 1000 | 240 in 1000 | RR 2.5 (2.0 to 3.1) NNH 7.0 (5.8 to 8.7) | 4 studies, 2470 participants | High | ‐ |
| Serious adverse events | 21 in 1000 | 19 in 1000 | RR 0.91 (0.52 to 1.6) NNH not calculated | 4 studies, 2463 participants | Low | Few events (49) |
| Death | None reported | |||||
| BOCF: baseline observation carried forward; CI: confidence interval; LOCF: last observation carried forward; NNT: number needed to treat for an additional beneficial outcome; NNH: number needed to treat for an additional harm outcome; RR: risk ratio | ||||||
| GRADE Working Group grades of evidence | ||||||
| Outcome or subgroup title | No. of studies | No. of participants | Statistical method | Effect size |
| 1 At least 30% pain relief Show forest plot | 3 | 1925 | Risk Ratio (M‐H, Fixed, 95% CI) | 1.38 [1.22, 1.57] |
| 2 PGIC 'much improved' or 'very much improved' Show forest plot | 3 | 1925 | Risk Ratio (M‐H, Fixed, 95% CI) | 1.51 [1.32, 1.73] |
| 3 At least 50% pain relief Show forest plot | 2 | 1250 | Risk Ratio (M‐H, Fixed, 95% CI) | 1.57 [1.26, 1.96] |
| 4 Composite 1 Show forest plot | 3 | 2272 | Risk Ratio (M‐H, Fixed, 95% CI) | 1.46 [1.25, 1.71] |
| 5 Composite 2 Show forest plot | 3 | 2272 | Risk Ratio (M‐H, Fixed, 95% CI) | 1.73 [1.41, 2.14] |
| 6 At least one adverse event Show forest plot | 4 | 2378 | Risk Difference (M‐H, Fixed, 95% CI) | 0.07 [0.04, 0.10] |
| 7 Serious adverse events Show forest plot | 4 | 2378 | Risk Ratio (M‐H, Fixed, 95% CI) | 0.90 [0.47, 1.73] |
| 8 Individual adverse events Show forest plot | 4 | Risk Ratio (M‐H, Fixed, 95% CI) | Subtotals only | |
| 8.1 Nausea | 4 | 2378 | Risk Ratio (M‐H, Fixed, 95% CI) | 1.84 [1.59, 2.12] |
| 8.2 Constipation | 3 | 2272 | Risk Ratio (M‐H, Fixed, 95% CI) | 4.12 [2.97, 5.71] |
| 8.3 Hot flush | 4 | 2378 | Risk Ratio (M‐H, Fixed, 95% CI) | 4.12 [2.79, 6.06] |
| 8.4 Dizziness | 4 | 2378 | Risk Ratio (M‐H, Fixed, 95% CI) | 2.05 [1.52, 2.77] |
| 8.5 Palpitations | 3 | 2272 | Risk Ratio (M‐H, Fixed, 95% CI) | 3.02 [1.97, 4.63] |
| 8.6 Increased heart rate/tachycardia | 3 | 2272 | Risk Ratio (M‐H, Fixed, 95% CI) | 5.42 [2.87, 10.25] |
| 8.7 Hyperhidrosis | 4 | 2378 | Risk Ratio (M‐H, Fixed, 95% CI) | 4.99 [3.01, 8.26] |
| 8.8 Vomiting | 2 | 1247 | Risk Ratio (M‐H, Fixed, 95% CI) | 2.70 [1.44, 5.05] |
| 8.9 Hypertension | 3 | 1931 | Risk Ratio (M‐H, Fixed, 95% CI) | 4.58 [2.45, 8.58] |
| 9 All‐cause withdrawals Show forest plot | 4 | 2379 | Risk Ratio (M‐H, Fixed, 95% CI) | 1.13 [1.01, 1.27] |
| 10 Lack of efficacy withdrawals Show forest plot | 4 | 2379 | Risk Ratio (M‐H, Fixed, 95% CI) | 0.72 [0.55, 0.94] |
| 11 Adverse event withdrawals Show forest plot | 4 | 2379 | Risk Ratio (M‐H, Fixed, 95% CI) | 1.62 [1.33, 1.97] |
| Outcome or subgroup title | No. of studies | No. of participants | Statistical method | Effect size |
| 1 At least 30% pain relief Show forest plot | 3 | 1798 | Risk Ratio (M‐H, Fixed, 95% CI) | 1.35 [1.18, 1.54] |
| 2 PGIC 'much improved' or 'very much improved' Show forest plot | 2 | 1673 | Risk Ratio (M‐H, Fixed, 95% CI) | 1.57 [1.34, 1.83] |
| 3 Composite 1 Show forest plot | 3 | 2337 | Risk Ratio (M‐H, Fixed, 95% CI) | 1.55 [1.31, 1.84] |
| 4 Composite 2 Show forest plot | 2 | 1461 | Risk Ratio (M‐H, Fixed, 95% CI) | 1.61 [1.21, 2.13] |
| 5 At least one adverse event Show forest plot | 3 | 2338 | Risk Ratio (M‐H, Fixed, 95% CI) | 1.10 [1.06, 1.15] |
| 6 Serious adverse events Show forest plot | 4 | 2463 | Risk Ratio (M‐H, Fixed, 95% CI) | 0.91 [0.52, 1.60] |
| 7 Individual adverse events Show forest plot | 3 | Risk Ratio (M‐H, Fixed, 95% CI) | Subtotals only | |
| 7.1 Nausea | 3 | 2338 | Risk Ratio (M‐H, Fixed, 95% CI) | 2.37 [2.00, 2.80] |
| 7.2 Constipation | 3 | 2338 | Risk Ratio (M‐H, Fixed, 95% CI) | 5.01 [3.46, 7.24] |
| 7.3 Hot flush | 3 | 2338 | Risk Ratio (M‐H, Fixed, 95% CI) | 6.71 [4.06, 11.09] |
| 7.4 Dizziness | 3 | 2338 | Risk Ratio (M‐H, Fixed, 95% CI) | 1.63 [1.22, 2.18] |
| 7.5 Palpitations | 3 | 2288 | Risk Ratio (M‐H, Fixed, 95% CI) | 3.38 [2.17, 5.29] |
| 7.6 Increased heart rate/tachycardia | 3 | 2338 | Risk Ratio (M‐H, Fixed, 95% CI) | 6.81 [3.54, 13.13] |
| 7.7 Hyperhidrosis | 2 | 1461 | Risk Ratio (M‐H, Fixed, 95% CI) | 5.18 [2.67, 10.02] |
| 7.8 Vomiting | 3 | 2338 | Risk Ratio (M‐H, Fixed, 95% CI) | 2.30 [1.48, 3.58] |
| 8 All‐cause withdrawals Show forest plot | 4 | 2416 | Risk Ratio (M‐H, Fixed, 95% CI) | 1.38 [1.22, 1.57] |
| 9 Lack of efficacy withdrawals Show forest plot | 4 | 2462 | Risk Ratio (M‐H, Fixed, 95% CI) | 0.66 [0.51, 0.87] |
| 10 Adverse event withdrawals Show forest plot | 4 | 2470 | Risk Ratio (M‐H, Fixed, 95% CI) | 2.51 [2.03, 3.09] |