Scolaris Content Display Scolaris Content Display

Study flow diagram. EERW: enriched enrolment randomised withdrawal; RCT: randomised controlled trial.
Figures and Tables -
Figure 1

Study flow diagram. EERW: enriched enrolment randomised withdrawal; RCT: randomised controlled trial.

Risk of bias graph: review authors' judgements about each risk of bias item presented as percentages across all included studies.
Figures and Tables -
Figure 2

Risk of bias graph: review authors' judgements about each risk of bias item presented as percentages across all included studies.

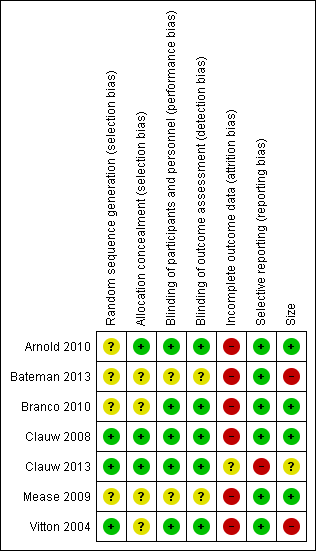
Risk of bias summary: review authors' judgements about each risk of bias item for each included study.
Figures and Tables -
Figure 3

Risk of bias summary: review authors' judgements about each risk of bias item for each included study.

Forest plot of comparison: 1 Milnacipran 100 mg/day versus placebo, outcome: 1.1 At least 30% pain relief.
Figures and Tables -
Figure 4

Forest plot of comparison: 1 Milnacipran 100 mg/day versus placebo, outcome: 1.1 At least 30% pain relief.

Forest plot of comparison: 1 Milnacipran 100 mg/day versus placebo, outcome: 1.8 Individual adverse events.
Figures and Tables -
Figure 5

Forest plot of comparison: 1 Milnacipran 100 mg/day versus placebo, outcome: 1.8 Individual adverse events.

Comparison 1 Milnacipran 100 mg/day versus placebo, Outcome 1 At least 30% pain relief.
Figures and Tables -
Analysis 1.1

Comparison 1 Milnacipran 100 mg/day versus placebo, Outcome 1 At least 30% pain relief.

Comparison 1 Milnacipran 100 mg/day versus placebo, Outcome 2 PGIC 'much improved' or 'very much improved'.
Figures and Tables -
Analysis 1.2

Comparison 1 Milnacipran 100 mg/day versus placebo, Outcome 2 PGIC 'much improved' or 'very much improved'.

Comparison 1 Milnacipran 100 mg/day versus placebo, Outcome 3 At least 50% pain relief.
Figures and Tables -
Analysis 1.3

Comparison 1 Milnacipran 100 mg/day versus placebo, Outcome 3 At least 50% pain relief.

Comparison 1 Milnacipran 100 mg/day versus placebo, Outcome 4 Composite 1.
Figures and Tables -
Analysis 1.4

Comparison 1 Milnacipran 100 mg/day versus placebo, Outcome 4 Composite 1.

Comparison 1 Milnacipran 100 mg/day versus placebo, Outcome 5 Composite 2.
Figures and Tables -
Analysis 1.5

Comparison 1 Milnacipran 100 mg/day versus placebo, Outcome 5 Composite 2.

Comparison 1 Milnacipran 100 mg/day versus placebo, Outcome 6 At least one adverse event.
Figures and Tables -
Analysis 1.6

Comparison 1 Milnacipran 100 mg/day versus placebo, Outcome 6 At least one adverse event.

Comparison 1 Milnacipran 100 mg/day versus placebo, Outcome 7 Serious adverse events.
Figures and Tables -
Analysis 1.7

Comparison 1 Milnacipran 100 mg/day versus placebo, Outcome 7 Serious adverse events.

Comparison 1 Milnacipran 100 mg/day versus placebo, Outcome 8 Individual adverse events.
Figures and Tables -
Analysis 1.8

Comparison 1 Milnacipran 100 mg/day versus placebo, Outcome 8 Individual adverse events.

Comparison 1 Milnacipran 100 mg/day versus placebo, Outcome 9 All‐cause withdrawals.
Figures and Tables -
Analysis 1.9

Comparison 1 Milnacipran 100 mg/day versus placebo, Outcome 9 All‐cause withdrawals.

Comparison 1 Milnacipran 100 mg/day versus placebo, Outcome 10 Lack of efficacy withdrawals.
Figures and Tables -
Analysis 1.10

Comparison 1 Milnacipran 100 mg/day versus placebo, Outcome 10 Lack of efficacy withdrawals.

Comparison 1 Milnacipran 100 mg/day versus placebo, Outcome 11 Adverse event withdrawals.
Figures and Tables -
Analysis 1.11

Comparison 1 Milnacipran 100 mg/day versus placebo, Outcome 11 Adverse event withdrawals.

Comparison 2 Milnacipran 200 mg/day versus placebo, Outcome 1 At least 30% pain relief.
Figures and Tables -
Analysis 2.1

Comparison 2 Milnacipran 200 mg/day versus placebo, Outcome 1 At least 30% pain relief.

Comparison 2 Milnacipran 200 mg/day versus placebo, Outcome 2 PGIC 'much improved' or 'very much improved'.
Figures and Tables -
Analysis 2.2

Comparison 2 Milnacipran 200 mg/day versus placebo, Outcome 2 PGIC 'much improved' or 'very much improved'.

Comparison 2 Milnacipran 200 mg/day versus placebo, Outcome 3 Composite 1.
Figures and Tables -
Analysis 2.3

Comparison 2 Milnacipran 200 mg/day versus placebo, Outcome 3 Composite 1.

Comparison 2 Milnacipran 200 mg/day versus placebo, Outcome 4 Composite 2.
Figures and Tables -
Analysis 2.4

Comparison 2 Milnacipran 200 mg/day versus placebo, Outcome 4 Composite 2.

Comparison 2 Milnacipran 200 mg/day versus placebo, Outcome 5 At least one adverse event.
Figures and Tables -
Analysis 2.5

Comparison 2 Milnacipran 200 mg/day versus placebo, Outcome 5 At least one adverse event.

Comparison 2 Milnacipran 200 mg/day versus placebo, Outcome 6 Serious adverse events.
Figures and Tables -
Analysis 2.6

Comparison 2 Milnacipran 200 mg/day versus placebo, Outcome 6 Serious adverse events.

Comparison 2 Milnacipran 200 mg/day versus placebo, Outcome 7 Individual adverse events.
Figures and Tables -
Analysis 2.7

Comparison 2 Milnacipran 200 mg/day versus placebo, Outcome 7 Individual adverse events.

Comparison 2 Milnacipran 200 mg/day versus placebo, Outcome 8 All‐cause withdrawals.
Figures and Tables -
Analysis 2.8

Comparison 2 Milnacipran 200 mg/day versus placebo, Outcome 8 All‐cause withdrawals.

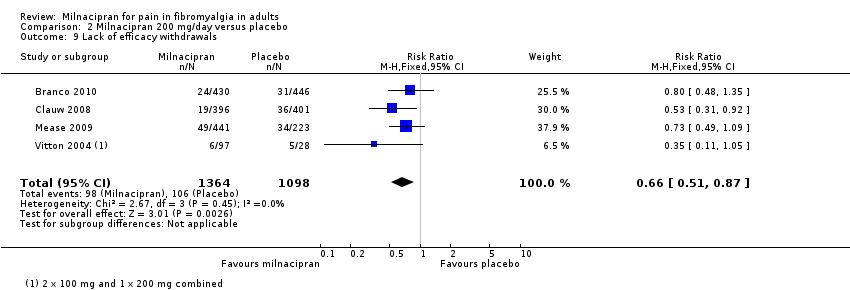
Comparison 2 Milnacipran 200 mg/day versus placebo, Outcome 9 Lack of efficacy withdrawals.
Figures and Tables -
Analysis 2.9

Comparison 2 Milnacipran 200 mg/day versus placebo, Outcome 9 Lack of efficacy withdrawals.

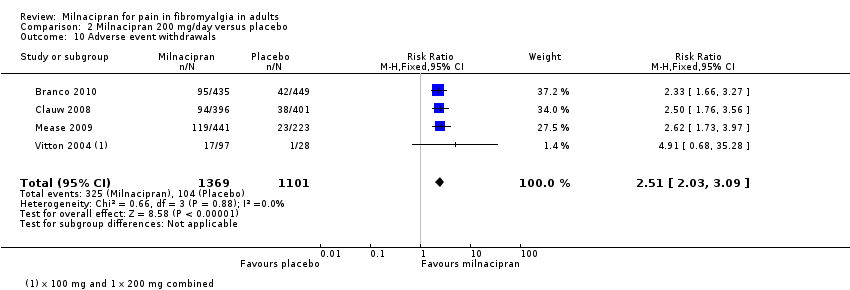
Comparison 2 Milnacipran 200 mg/day versus placebo, Outcome 10 Adverse event withdrawals.
Figures and Tables -
Analysis 2.10

Comparison 2 Milnacipran 200 mg/day versus placebo, Outcome 10 Adverse event withdrawals.

Milnacipran compared with placebo for fibromyalgia

Patient or population: adults with fibromyalgia

Settings: community

Intervention: milnacipran 100 and 200 mg/day

Comparison: placebo

Outcomes

Probable outcome with placebo

Probable outcome with intervention

Risk ratio (95% CI) and NNT or NNH

No of studies and participants

Quality of the evidence
(GRADE)

Comments

Milnacipran 100 mg/day

At least 50% reduction in pain or equivalent (substantial)

180 in 1000

270 in 1000

RR 1.6 (1.3 to 2.0)

NNT 10 (7.0 to 20)

2 studies, 1250 participants

Moderate

Only 2 studies, 1 much smaller than other

Downgrade because of LOCF analysis

At least 30% reduction in pain or equivalent (moderate)

300 in 1000

410 in 1000

RR 1.4 (1.2 to 1.6)

NNT 9.0 (6.5 to 15)

3 studies, 1925 participants

High

Downgrade because of LOCF analysis, but upgrade as the result is supported by Composite outcome 1 giving a very similar result; this is a BOCF analysis for the outcome plus PGIC much or very much improved

Adverse event withdrawals

120 in 1000

190 in 1000

RR 1.6 (1.3 to 2.0)

NNH 14 (10 to 24)

4 studies, 2379 participants

High

Serious adverse events

16 in 1000

15 in 1000

RR 0.90 (0.47 to 1.7)

NNH not calculated

4 studies,

2378 participants

Low

Few events (36)

Death

None reported

Milnacipran 200 mg/day

At least 50% reduction in pain or equivalent (substantial)

140 in 1000

280 in 1000

Not calculated

1 study, 125 participants

Very low

1 study, few participants

At least 30% reduction in pain or equivalent (moderate)

290 in 1000

390 in 1000

RR 1.4 (1.2 to 1.5)

NNT 10 (7.0 to 18)

3 studies, 1798 participants

High

Downgrade because of LOCF analysis, but upgrade as the result is supported by composite outcome 1 giving a very similar result; this is a BOCF analysis for the outcome plus PGIC much or very much improved

Adverse event withdrawals

95 in 1000

240 in 1000

RR 2.5 (2.0 to 3.1)

NNH 7.0 (5.8 to 8.7)

4 studies, 2470 participants

High

Serious adverse events

21 in 1000

19 in 1000

RR 0.91 (0.52 to 1.6)

NNH not calculated

4 studies, 2463 participants

Low

Few events (49)

Death

None reported

BOCF: baseline observation carried forward; CI: confidence interval; LOCF: last observation carried forward; NNT: number needed to treat for an additional beneficial outcome; NNH: number needed to treat for an additional harm outcome; RR: risk ratio

GRADE Working Group grades of evidence
High quality: Further research is very unlikely to change our confidence in the estimate of effect.
Moderate quality: Further research is likely to have an important impact on our confidence in the estimate of effect and may change the estimate.
Low quality: Further research is very likely to have an important impact on our confidence in the estimate of effect and is likely to change the estimate.
Very low quality: We are very uncertain about the estimate.

Figures and Tables -
Comparison 1. Milnacipran 100 mg/day versus placebo

Outcome or subgroup title

No. of studies

No. of participants

Statistical method

Effect size

1 At least 30% pain relief Show forest plot

3

1925

Risk Ratio (M‐H, Fixed, 95% CI)

1.38 [1.22, 1.57]

2 PGIC 'much improved' or 'very much improved' Show forest plot

3

1925

Risk Ratio (M‐H, Fixed, 95% CI)

1.51 [1.32, 1.73]

3 At least 50% pain relief Show forest plot

2

1250

Risk Ratio (M‐H, Fixed, 95% CI)

1.57 [1.26, 1.96]

4 Composite 1 Show forest plot

3

2272

Risk Ratio (M‐H, Fixed, 95% CI)

1.46 [1.25, 1.71]

5 Composite 2 Show forest plot

3

2272

Risk Ratio (M‐H, Fixed, 95% CI)

1.73 [1.41, 2.14]

6 At least one adverse event Show forest plot

4

2378

Risk Difference (M‐H, Fixed, 95% CI)

0.07 [0.04, 0.10]

7 Serious adverse events Show forest plot

4

2378

Risk Ratio (M‐H, Fixed, 95% CI)

0.90 [0.47, 1.73]

8 Individual adverse events Show forest plot

4

Risk Ratio (M‐H, Fixed, 95% CI)

Subtotals only

8.1 Nausea

4

2378

Risk Ratio (M‐H, Fixed, 95% CI)

1.84 [1.59, 2.12]

8.2 Constipation

3

2272

Risk Ratio (M‐H, Fixed, 95% CI)

4.12 [2.97, 5.71]

8.3 Hot flush

4

2378

Risk Ratio (M‐H, Fixed, 95% CI)

4.12 [2.79, 6.06]

8.4 Dizziness

4

2378

Risk Ratio (M‐H, Fixed, 95% CI)

2.05 [1.52, 2.77]

8.5 Palpitations

3

2272

Risk Ratio (M‐H, Fixed, 95% CI)

3.02 [1.97, 4.63]

8.6 Increased heart rate/tachycardia

3

2272

Risk Ratio (M‐H, Fixed, 95% CI)

5.42 [2.87, 10.25]

8.7 Hyperhidrosis

4

2378

Risk Ratio (M‐H, Fixed, 95% CI)

4.99 [3.01, 8.26]

8.8 Vomiting

2

1247

Risk Ratio (M‐H, Fixed, 95% CI)

2.70 [1.44, 5.05]

8.9 Hypertension

3

1931

Risk Ratio (M‐H, Fixed, 95% CI)

4.58 [2.45, 8.58]

9 All‐cause withdrawals Show forest plot

4

2379

Risk Ratio (M‐H, Fixed, 95% CI)

1.13 [1.01, 1.27]

10 Lack of efficacy withdrawals Show forest plot

4

2379

Risk Ratio (M‐H, Fixed, 95% CI)

0.72 [0.55, 0.94]

11 Adverse event withdrawals Show forest plot

4

2379

Risk Ratio (M‐H, Fixed, 95% CI)

1.62 [1.33, 1.97]

Figures and Tables -
Comparison 1. Milnacipran 100 mg/day versus placebo
Comparison 2. Milnacipran 200 mg/day versus placebo

Outcome or subgroup title

No. of studies

No. of participants

Statistical method

Effect size

1 At least 30% pain relief Show forest plot

3

1798

Risk Ratio (M‐H, Fixed, 95% CI)

1.35 [1.18, 1.54]

2 PGIC 'much improved' or 'very much improved' Show forest plot

2

1673

Risk Ratio (M‐H, Fixed, 95% CI)

1.57 [1.34, 1.83]

3 Composite 1 Show forest plot

3

2337

Risk Ratio (M‐H, Fixed, 95% CI)

1.55 [1.31, 1.84]

4 Composite 2 Show forest plot

2

1461

Risk Ratio (M‐H, Fixed, 95% CI)

1.61 [1.21, 2.13]

5 At least one adverse event Show forest plot

3

2338

Risk Ratio (M‐H, Fixed, 95% CI)

1.10 [1.06, 1.15]

6 Serious adverse events Show forest plot

4

2463

Risk Ratio (M‐H, Fixed, 95% CI)

0.91 [0.52, 1.60]

7 Individual adverse events Show forest plot

3

Risk Ratio (M‐H, Fixed, 95% CI)

Subtotals only

7.1 Nausea

3

2338

Risk Ratio (M‐H, Fixed, 95% CI)

2.37 [2.00, 2.80]

7.2 Constipation

3

2338

Risk Ratio (M‐H, Fixed, 95% CI)

5.01 [3.46, 7.24]

7.3 Hot flush

3

2338

Risk Ratio (M‐H, Fixed, 95% CI)

6.71 [4.06, 11.09]

7.4 Dizziness

3

2338

Risk Ratio (M‐H, Fixed, 95% CI)

1.63 [1.22, 2.18]

7.5 Palpitations

3

2288

Risk Ratio (M‐H, Fixed, 95% CI)

3.38 [2.17, 5.29]

7.6 Increased heart rate/tachycardia

3

2338

Risk Ratio (M‐H, Fixed, 95% CI)

6.81 [3.54, 13.13]

7.7 Hyperhidrosis

2

1461

Risk Ratio (M‐H, Fixed, 95% CI)

5.18 [2.67, 10.02]

7.8 Vomiting

3

2338

Risk Ratio (M‐H, Fixed, 95% CI)

2.30 [1.48, 3.58]

8 All‐cause withdrawals Show forest plot

4

2416

Risk Ratio (M‐H, Fixed, 95% CI)

1.38 [1.22, 1.57]

9 Lack of efficacy withdrawals Show forest plot

4

2462

Risk Ratio (M‐H, Fixed, 95% CI)

0.66 [0.51, 0.87]

10 Adverse event withdrawals Show forest plot

4

2470

Risk Ratio (M‐H, Fixed, 95% CI)

2.51 [2.03, 3.09]

Figures and Tables -
Comparison 2. Milnacipran 200 mg/day versus placebo