Administración de heparina subcutánea lenta versus rápida para la prevención de la equimosis y la intensidad del dolor en el sitio de inyección
Information
- DOI:
- https://doi.org/10.1002/14651858.CD008077.pub5Copy DOI

- Database:
-
- Cochrane Database of Systematic Reviews
- Version published:
-
- 01 November 2017see what's new
- Type:
-
- Intervention
- Stage:
-
- Review
- Cochrane Editorial Group:
-
Cochrane Vascular Group
- Copyright:
-
- Copyright © 2017 The Cochrane Collaboration. Published by John Wiley & Sons, Ltd.
Article metrics
Altmetric:
Cited by:
Authors
Contributions of authors
MM: design of the review; literature search and identification of trials for inclusion; evaluation of methodological quality of included trials; data extraction; contact with trial authors; interpretation of data; writing of the draft review; and assuming responsibility for writing of future updates.
LJ: design of the review; literature search and identification of trials for inclusion; evaluation of methodological quality of included trials; data extraction; interpretation of data; and writing the review.
AAS: design of the review; methodological advice; writing of the review; overall supervision.
Sources of support
Internal sources
-
Tehran University of Medical Sciences, Tehran, Iran.
External sources
-
Chief Scientist Office, Scottish Government Health Directorates, The Scottish Government, UK.
The Vascular Group editorial base is supported by the Chief Scientist Office.
Declarations of interest
MM: none known.
LJ: none known.
AAS: none known.
Acknowledgements
We would like to thank Cochrane Vascular for extensive and kind support provided, and Dr Saharnaz Nedjat for input into the previous version of this review.
Version history
| Published | Title | Stage | Authors | Version |
| 2021 Jun 08 | Slow versus fast subcutaneous heparin injections for prevention of bruising and site pain intensity | Review | Mina Mohammady, Maryam Radmehr, Leila Janani | |
| 2017 Nov 01 | Slow versus fast subcutaneous heparin injections for prevention of bruising and site pain intensity | Review | Mina Mohammady, Leila Janani, Ali Akbari Sari | |
| 2017 Oct 01 | Slow versus fast subcutaneous heparin injections for prevention of bruising and site pain intensity | Review | Mina Mohammady, Leila Janani, Ali Akbari Sari | |
| 2014 Jul 18 | Slow versus fast subcutaneous heparin injections for prevention of bruising and site‐pain intensity | Review | Ali Akbari Sari, Leila Janani, Mina Mohammady, Saharnaz Nedjat | |
| 2010 Feb 17 | Slow versus fast subcutaneous heparin injections for prevention of bruising and site‐pain intensity | Protocol | Mina Mohammady, Leila Janani, Ali Akbari Sari, Saharnaz Nedjat | |
| 2009 Oct 07 | Slow versus fast subcutaneous heparin injections for prevention of bruising and site‐pain intensity | Protocol | Mina Mohammady, Leila Janani, Ali Akbari Sari, Saharnaz Nedjat, Seyyed Meisam Ebrahimi | |
Differences between protocol and review
The protocol stated that this review would include randomised controlled trials, clinical controlled trials, and quasi‐experimental studies. However, on the basis of discussions with the Vascular Group editorial base, review authors agreed to exclude clinical controlled trials and quasi‐experimental studies to reduce risk of bias.
Keywords
MeSH
Medical Subject Headings (MeSH) Keywords
- Anticoagulants [*administration & dosage, adverse effects];
- Contusions [chemically induced, *prevention & control];
- Heparin, Low‐Molecular‐Weight [*administration & dosage, adverse effects];
- Injections, Subcutaneous [adverse effects, *methods];
- Pain Measurement [methods];
- Pain, Procedural [etiology, *prevention & control];
- Randomized Controlled Trials as Topic;
- Time Factors;
Medical Subject Headings Check Words
Humans; Middle Aged;
PICOs


Risk of bias summary: review authors' judgements about each risk of bias item for each included study.
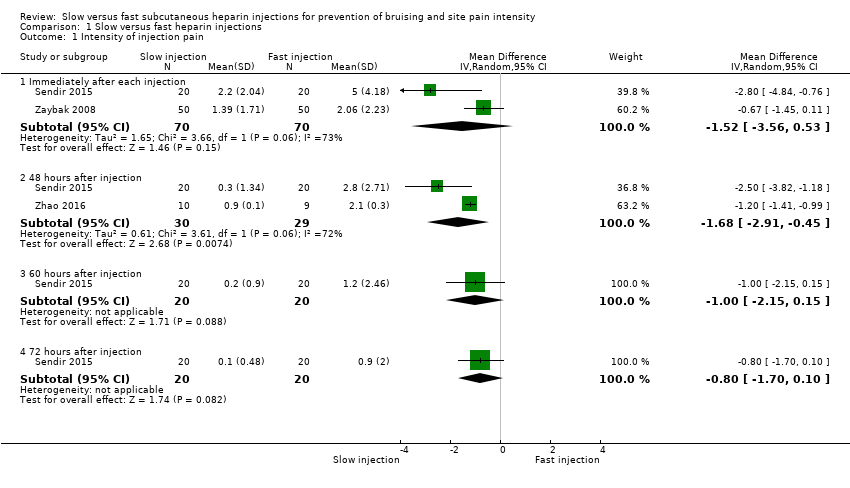
Comparison 1 Slow versus fast heparin injections, Outcome 1 Intensity of injection pain.
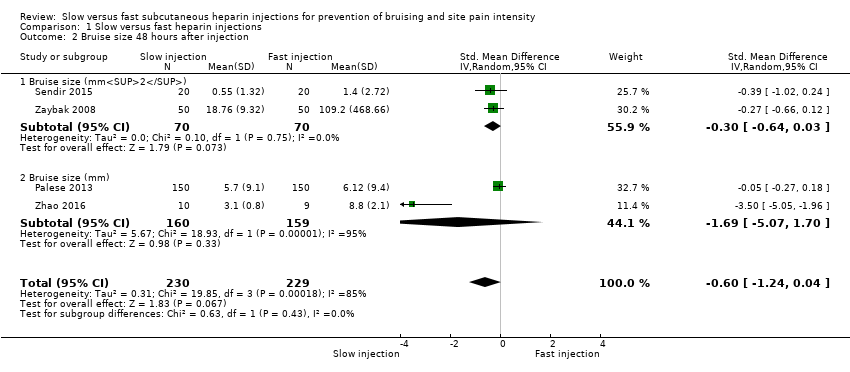
Comparison 1 Slow versus fast heparin injections, Outcome 2 Bruise size 48 hours after injection.

Comparison 1 Slow versus fast heparin injections, Outcome 3 Bruise size.
| Slow vs fast subcutaneous heparin injection for prevention of bruising and site pain intensity | |||||
| Patient or population: patients treated with subcutaneous heparin injections Settings: hospital outpatient and inpatient units Intervention: slow injection (injection speed of 20 or more seconds) Comparison: fast injection (injection speed of less than 20 seconds) | |||||
| Outcomes | Illustrative comparative risks* (95% CI) | Number of participants | Quality of the evidence | Comments | |
| Assumed risk with fast injection | Corresponding risk with slow injection | ||||
| Intensity of injection pain immediately after injection (VAS 0 to 10 cm) 0 (no pain) to 10 (worst possible pain) | Mean pain intensity reported by the 2 studies ranged across fast injection groups from 2 to 5. | Mean pain intensity in the slow injection group was 1.52 points less than in the fast group (3.56 lower to 0.53 higher; P = 0.15). | 140 | ⊕⊕⊝⊝a | |
| Intensity of injection pain 48 hours after injection (VAS 0 to 10 cm) 0 (no pain) to 10 (worst possible pain) | Mean pain intensity ranged across fast injection groups from 2.1 to 2.8. | Mean pain intensity in the slow injection group was 1.68 points less than in the fast group (2.91 lower to 0.45 lower; P = 0.007). | 59 | ⊕⊕⊝⊝b | |
| Bruise size 48 hours after injection (mm/mm2) | See comment. | Mean bruising size in the slow injection group was 0.6 SD lower than in the fast injection group (1.24 lower to 0.04 higher; P = 0.07). | 459 | ⊕⊕⊝⊝c | Bruise size was measured on different scales; therefore we used the SMD to pool data. |
| Haematoma at injection site | See comment. | No studies measured this outcome. | |||
| *The basis for the assumed risk (e.g. median control group risk across studies) for pain intensity was the range of mean pain score reported following fast injection by the 2 studies. The corresponding risk (and its 95% confidence interval) is based on the assumed risk in the comparison group and the mean difference of the intervention (and its 95% CI). | |||||
| GRADE Working Group grades of evidence. | |||||
| aWe downgraded the quality of evidence by two steps owing to study limitations, as we identified few studies with small numbers of participants (imprecision) and high heterogeneity (I2 = 73%) (inconsistency). | |||||
| Outcome or subgroup title | No. of studies | No. of participants | Statistical method | Effect size |
| 1 Intensity of injection pain Show forest plot | 3 | Mean Difference (IV, Random, 95% CI) | Subtotals only | |
| 1.1 Immediately after each injection | 2 | 140 | Mean Difference (IV, Random, 95% CI) | ‐1.52 [‐3.56, 0.53] |
| 1.2 48 hours after injection | 2 | 59 | Mean Difference (IV, Random, 95% CI) | ‐1.68 [‐2.91, ‐0.45] |
| 1.3 60 hours after injection | 1 | 40 | Mean Difference (IV, Random, 95% CI) | ‐1.0 [‐2.15, 0.15] |
| 1.4 72 hours after injection | 1 | 40 | Mean Difference (IV, Random, 95% CI) | ‐0.8 [‐1.70, 0.10] |
| 2 Bruise size 48 hours after injection Show forest plot | 4 | 459 | Std. Mean Difference (IV, Random, 95% CI) | ‐0.60 [‐1.24, 0.04] |
| 2.1 Bruise size (mm2) | 2 | 140 | Std. Mean Difference (IV, Random, 95% CI) | ‐0.30 [‐0.64, 0.03] |
| 2.2 Bruise size (mm) | 2 | 319 | Std. Mean Difference (IV, Random, 95% CI) | ‐1.69 [‐5.07, 1.70] |
| 3 Bruise size Show forest plot | 2 | Mean Difference (IV, Fixed, 95% CI) | Subtotals only | |
| 3.1 60 hours after injection (mm2) | 1 | 40 | Mean Difference (IV, Fixed, 95% CI) | ‐3.85 [‐8.99, 1.29] |
| 3.2 72 hours after injection (mm2) | 2 | 140 | Mean Difference (IV, Fixed, 95% CI) | ‐2.29 [‐6.57, 1.99] |