Maintenance treatment with antipsychotic drugs for schizophrenia
Abstract
Background
The symptoms and signs of schizophrenia have been linked to high levels of dopamine in specific areas of the brain (limbic system). Antipsychotic drugs block the transmission of dopamine in the brain and reduce the acute symptoms of the disorder. An original version of the current review, published in 2012, examined whether antipsychotic drugs are also effective for relapse prevention. This is the updated version of the aforesaid review.
Objectives
To review the effects of maintaining antipsychotic drugs for people with schizophrenia compared to withdrawing these agents.
Search methods
We searched the Cochrane Schizophrenia Group's Study‐Based Register of Trials including the registries of clinical trials (12 November 2008, 10 October 2017, 3 July 2018, 11 September 2019).
Selection criteria
We included all randomised trials comparing maintenance treatment with antipsychotic drugs and placebo for people with schizophrenia or schizophrenia‐like psychoses.
Data collection and analysis
We extracted data independently. For dichotomous data we calculated risk ratios (RR) and their 95% confidence intervals (CIs) on an intention‐to‐treat basis based on a random‐effects model. For continuous data, we calculated mean differences (MD) or standardised mean differences (SMD), again based on a random‐effects model.
Main results
The review currently includes 75 randomised controlled trials (RCTs) involving 9145 participants comparing antipsychotic medication with placebo. The trials were published from 1959 to 2017 and their size ranged between 14 and 420 participants. In many studies the methods of randomisation, allocation and blinding were poorly reported. However, restricting the analysis to studies at low risk of bias gave similar results. Although this and other potential sources of bias limited the overall quality, the efficacy of antipsychotic drugs for maintenance treatment in schizophrenia was clear. Antipsychotic drugs were more effective than placebo in preventing relapse at seven to 12 months (primary outcome; drug 24% versus placebo 61%, 30 RCTs, n = 4249, RR 0.38, 95% CI 0.32 to 0.45, number needed to treat for an additional beneficial outcome (NNTB) 3, 95% CI 2 to 3; high‐certainty evidence).
Hospitalisation was also reduced, however, the baseline risk was lower (drug 7% versus placebo 18%, 21 RCTs, n = 3558, RR 0.43, 95% CI 0.32 to 0.57, NNTB 8, 95% CI 6 to 14; high‐certainty evidence). More participants in the placebo group than in the antipsychotic drug group left the studies early due to any reason (at seven to 12 months: drug 36% versus placebo 62%, 24 RCTs, n = 3951, RR 0.56, 95% CI 0.48 to 0.65, NNTB 4, 95% CI 3 to 5; high‐certainty evidence) and due to inefficacy of treatment (at seven to 12 months: drug 18% versus placebo 46%, 24 RCTs, n = 3951, RR 0.37, 95% CI 0.31 to 0.44, NNTB 3, 95% CI 3 to 4).
Quality of life might be better in drug‐treated participants (7 RCTs, n = 1573 SMD ‐0.32, 95% CI to ‐0.57 to ‐0.07; low‐certainty evidence); probably the same for social functioning (15 RCTs, n = 3588, SMD ‐0.43, 95% CI ‐0.53 to ‐0.34; moderate‐certainty evidence).
Underpowered data revealed no evidence of a difference between groups for the outcome ‘Death due to suicide’ (drug 0.04% versus placebo 0.1%, 19 RCTs, n = 4634, RR 0.60, 95% CI 0.12 to 2.97,low‐certainty evidence) and for the number of participants in employment (at 9 to 15 months, drug 39% versus placebo 34%, 3 RCTs, n = 593, RR 1.08, 95% CI 0.82 to 1.41, low certainty evidence).
Antipsychotic drugs (as a group and irrespective of duration) were associated with more participants experiencing movement disorders (e.g. at least one movement disorder: drug 14% versus placebo 8%, 29 RCTs, n = 5276, RR 1.52, 95% CI 1.25 to 1.85, number needed to treat for an additional harmful outcome (NNTH) 20, 95% CI 14 to 50), sedation (drug 8% versus placebo 5%, 18 RCTs, n = 4078, RR 1.52, 95% CI 1.24 to 1.86, NNTH 50, 95% CI not significant), and weight gain (drug 9% versus placebo 6%, 19 RCTs, n = 4767, RR 1.69, 95% CI 1.21 to 2.35, NNTH 25, 95% CI 20 to 50).
Authors' conclusions
For people with schizophrenia, the evidence suggests that maintenance on antipsychotic drugs prevents relapse to a much greater extent than placebo for approximately up to two years of follow‐up. This effect must be weighed against the adverse effects of antipsychotic drugs. Future studies should better clarify the long‐term morbidity and mortality associated with these drugs.
PICOs
Plain language summary
Maintenance treatment with antipsychotic drugs for schizophrenia
Antipsychotic drugs are the mainstay of treatment of schizophrenia, not only in the event of acute episodes, but also in the long‐term perspective. While people might want to stop their treatment at some stage, recurrences of psychotic symptoms are known to occur after treatment discontinuation. Relapses can lead to risk of harm, loss of autonomy and substantial distress for individuals and their families.
The current report presents the update version of a systematic review previously published in 2012, and is based on 75 randomised controlled trials (RCTs) published over a long period since the 1950s and including more than 9000 participants. The effects of all antipsychotic drugs are here compared to those of placebo ‐ namely drug discontinuation ‐ for maintenance treatment, that is prevention of relapses. The aim is to explore the benefits and risks of each of the two options.
The results of this review show very consistently that antipsychotic drugs effectively reduce relapses and need for hospitalisation. Indeed, in case of treatment discontinuation, the risk of relapse at one year is almost three times higher. Antipsychotic drugs appear to have a positive effect on the ability to engage in activities and relationships, and on the possibility to fulfil remission from symptoms, although less evidence is available in this regard. Though based again on a lower number of reports, people continuing their treatment tend to experience higher satisfaction with their life, which confirms the negative consequences on well‐being of being at higher risk for recurrence. Conversely, antipsychotic drugs are, as a group, associated with a number of side effects such as movement disorders, weight gain and sedation. However, this review allows more understanding of the fact that stopping treatment is far more harmful than thoughtfully maintaining it.
Unfortunately, studies included in this review do generally last up to one year, and this makes difficult to clarify the longer‐term effect of these drugs. It is however true that the longer the study the more likely that other factors ‐ e.g. environmental – may accumulate and complicate the interpretation of results. Most of all, this review supports the advantages of antipsychotic drugs among many different types of participants. The best strategy would be therefore to continue treatment with antipsychotics, eventually discussing and adapting it if any adverse effect occurs.
Authors' conclusions
Summary of findings
| Maintenance treatment with antipsychotic drugs versus placebo/no treatment for schizophrenia | ||||||
| Patient or population: schizophrenia | ||||||
| Outcomes | Illustrative comparative risks (95% CI) | Relative effect | № of participants | Certainty of the evidence | Comments | |
|---|---|---|---|---|---|---|
| Assumed risk | Corresponding risk | |||||
| Control | Maintenance treatment with antipsychotic drugs versus placebo/no treatment | |||||
| Relapse: 7 to 12 months Follow‐up: 7‐12 months | 606 per 1.000 | 230 per 1.000 | RR 0.38 | 4249 | ⊕⊕⊕⊕ | |
| Leaving the study early: due to any reason (acceptability of treatment) Follow‐up: 1‐24 months | 541 per 1.000 | 292 per 1.000 | RR 0.54 | 7001 | ⊕⊕⊕⊕ | |
| Service use: number of participants hospitalised Follow‐up: 1‐36 months | 177 per 1.000 | 76 per 1.000 | RR 0.43 | 3558 | ⊕⊕⊕⊕ | |
| Death: due to suicide Follow‐up: 1‐15 months | 1 per 1.000 | 1 per 1.000 | RR 0.60 | 4634 | ⊕⊕⊝⊝ | |
| Quality of life (various scales; low score=better) Follow‐up: 3‐18 months | The mean quality of life in the intervention group was 0.32 standard deviations lower (from 0.57 to 0.07 standard deviations lower), with lower scores reflecting a better condition. | ‐ | 1573 | ⊕⊕⊝⊝ | SMD ‐0.32 (‐0.57 to ‐0.07) | |
| Number of participants in employment Follow‐up: 9‐15 months | 344 per 1.000 | 372 per 1.000 | RR 1.08 | 593 | ⊕⊕⊝⊝ | |
| Social functioning (various scales; low score=better) Follow‐up: 1‐15 months | The mean social functioning in the intervention group was 0.43 standard deviations lower (from 0.53 to 0.34 standard deviations lower), with lower scores reflecting a better condition. | ‐ | 3588 | ⊕⊕⊕⊝ | SMD ‐0.43 (‐0.53 to ‐0.34) | |
| *The corresponding risk (and its 95% confidence interval) is based on the assumed risk in the comparison group and the relative effect of the intervention (and its 95% CI). | ||||||
| GRADE Working Group grades of evidence | ||||||
| 1 Publication bias: rated 'undetected' ‐ although the funnel plot was asymmetrical, the trim and fill test did not change the point estimate and the point estimate was also similar when only large studies were included (Analysis 3.5). 2 Risk of bias: rated 'no' ‐ many studies did not report the methods for sequence generation and/or allocation concealment. However, in subgroup analysis (Analysis 2.8) studies reporting high standards of methods showed a similar effect size as compared to studies with unclear methods. Also, in a sensitivity analysis excluding studies with unclear methods (Analysis 3.10 and Analysis 3.11), the effect sizes did not change substantially. Early terminated studies were not judged to contribute substantial weight to this outcome. 3 Inconsistency: rated 'no' ‐ the P value for heterogeneity was statistically significant and the I2 higher than 50%. However, results of individual studies differed rather in magnitude of effect (which could be partly explained by subgroup analyses) rather than in direction of effect. Therefore, this inconsistency does not challenge the overall results. 4 No indirectness was found in terms of study population nor of interventions. In terms of outcome, we followed the original authors definitions of relapse. These definitions used different criteria, but all addressed symptomatic deterioration related to relapse. Therefore, this was not judged to lead to indirectness. 5 Inconsistency: rated 'no' ‐ the P value for heterogeneity was statistically significant and the I‐square higher than 50%. However, results of individual studies differed rather in magnitude of effect than in direction of effect, which was the same in almost all the studies. Therefore, this inconsistency does not challenge the overall results. 6 Publication bias: it is unlikely that a study was unpublished because of unfavourable data in a secondary outcome. As a possible publication bias had no effect on the results for the primary outcome (relapse at 7 to 12 months), we deem that there was no relevant publication bias for this secondary outcome. 7 Indirectness: hospitalisation due to relapse was our primary interest, but in some studies reasons for hospitalisation were unclearly reported. Overall, we do not deem that this uncertainty was an important source of indirectness. 8 Imprecision: rated 'very serious' ‐ only few studies with few events contributed data to this outcome. The CI was wide, ranging from substantial harm to substantial benefit. 9 Risk of bias: rated 'serious' ‐ five out of seven studies were terminated early after interim analyses, possibly leading to overestimation of effect. 10 Indirectness: some rating scales used in the studies have been criticised for eventually not measuring what people understand by quality of life. However, it was decided not to further lower the quality of evidence for this outcome after downgrading for other factors, despite some uncertainty. 11 Imprecise data ‐ only a few studies provided data for this outcome and the confidence interval was large. 12 Indirectness: rated 'serious' ‐ the only three studies included mixed groups of employed and non‐employed participants at baseline, and it is unclear whether employment was supported or competitive employment. 13 Imprecision: rated 'serious' ‐ only three studies contributed to this event which depends on various factors (e.g. the existence of supported employment, rural versus service economy etc). 14 Risk of bias: rated 'serious' ‐ eleven out of fifteen studies were terminated early after interim analyses, possibly leading to overestimation of effects. 15 Indirectness: rated 'no' ‐ different rating scales were used in the studies, but this was not judged to challenge the results. | ||||||
Background
Description of the condition
Schizophrenia is often a chronic and disabling psychiatric disorder. It afflicts approximately 1% of the population worldwide with few gender differences (McGrath 2008). Its typical manifestations are 'positive' symptoms such as fixed, false beliefs (delusions) and perceptions without cause (hallucinations); 'negative' symptoms such as apathy and lack of drive, disorganisation of behaviour and thought; and catatonic symptoms such as mannerisms and bizarre posturing (Carpenter 1994). The degree of suffering and disability is considerable with 80% to 90% of people not employed (Marvaha 2004) and up to 10% dying (Tsuang 1978).
Description of the intervention
Antipsychotic drugs are the mainstay of treatment for schizophrenia. They can be classified according to their biochemical structure (e.g. butyrophenones, phenothiazines, thioxanthenes, etc.), the doses necessary for an antipsychotic effect (high‐potency versus low‐potency antipsychotic drugs), and their risk of producing movement disorders ('atypical' versus 'typical' antipsychotic drugs). What they all have in common is that they block, to a greater or lesser extent, the transmission of dopamine in the brain. Currently there is not a single antipsychotic drug available that is not a dopamine receptor antagonist and the hypothesis that dopamine plays a role in the causation of schizophrenia has been partly derived from the mechanism of action of antipsychotic drugs (Berger 2003). Furthermore, there is no firm evidence that ‐ except for clozapine and possibly some other second‐generation antipsychotic drugs (Kane 1988; Leucht 2009; Leucht 2009a; Leucht 2013; Wahlbeck 1999) ‐ any of these agents is more effective than another (Klein 1969). Early (non‐systematic) reviews (Baldessarini 1985; Davis 1975) have shown that keeping people with schizophrenia on antipsychotic drugs after successful treatment of the acute episode substantially lowers relapse risk, for example, from 53.2% to 15.6% within a period of approximately 9.7 months (Gilbert 1995). Conversely, the side‐effect burden can be considerable, as antipsychotic drugs produce movement disorders, sedation, weight gain and are even related with sudden death. Therefore, clinicians and those with schizophrenia often face a trade‐off between protection against further psychotic episodes and adverse effects.
How the intervention might work
The theory is that schizophrenia is a chronic disorder caused by hyperdopaminergic states in the limbic system (Berger 2003). All antipsychotic drugs block dopamine receptors. Continuous treatment with antipsychotic drugs may be necessary to keep the dopaminergic tone low and to avoid psychotic relapses.
Why it is important to do this review
Although previous reviews had shown that maintenance treatment with antipsychotic drugs reduces relapse rates (Baldessarini 1985; Davis 1975; Gilbert 1995), they did not meet modern systematic review criteria and addressed only one outcome (relapse). The present review is an update of the previous Cochrane Review of Maintenance treatment with antipsychotic drugs for schizophrenia (Leucht 2012b). This update is important, because a lot of evidence has emerged since 2012.
Objectives
To review the effects of maintaining antipsychotic drug treatment for people with schizophrenia compared with withdrawing these agents.
Methods
Criteria for considering studies for this review
Types of studies
All relevant randomised controlled trials (RCTs). We excluded quasi‐randomised trials, such as those where allocation is undertaken on surname. If a trial was described as double‐blind, but it was implied it had been randomised, we included it, but excluded such trials in a sensitivity analysis. Randomised cross‐over studies were eligible but only data up to the point of first cross‐over were used because of the instability of the problem behaviours and the likely carry‐over effects of the treatments (Elbourne 2002).
Types of participants
We included people with schizophrenia and schizophrenia‐like psychoses (schizophreniform and schizoaffective disorders) who had stabilised on antipsychotic medications. There is no clear evidence that the schizophrenia‐like psychoses are caused by fundamentally different disease processes or require different treatment approaches (Carpenter 1994).
Types of interventions
-
Antipsychotic drugs: any dose or mode of administration (oral or by injection). There is no evidence for large differences in the efficacy of the available antipsychotic drugs (e.g. Davis 1989; Duggan 2005; Leucht 2009; Srisurapanont 2004). All currently available antipsychotic drugs have in common that they act via the blockade of dopamine and their classification according to their chemical properties (e.g. butyrophenones, thioxanthenes or phenothiazines) does not have an important clinical impact. Other classifications into 'low‐ versus high‐potency' or 'typical versus atypical' are continuums, at best (Leucht 2009). We therefore decided to include all antipsychotic drugs that are currently on the market in at least one country.
-
Active or inactive placebo, or no treatment.
Types of outcome measures
The outcomes were analysed for different lengths of follow‐up: up to three months, four to six months, seven months to one year and more than one year.
Primary outcomes
Relapse at one year (seven to 12 months) as defined by the original studies or by a deterioration in mental state requiring further treatment. Overall relapse and relapse at other time points were considered as secondary outcomes.
Secondary outcomes
The following outcomes were added to the list for this update: number of participants in symptomatic remission, number of participants in sustained remission, number of participants in recovery, social functioning.
1. Relapse
1.1 Across the pre‐specified time periods (please see above).
1.2 Independent of duration
2. Leaving the study early
2.1 Due to any reason (acceptability of treatment)
2.2 Due to adverse events (overall tolerability)
2.3 Due to inefficacy
3. Global state
3.1 Improved (at least minimally)
3.2 In symptomatic remission
3.3 In sustained remission
3.4 In recovery
4. Service use
4.1 Number hospitalised
4.2 Number discharged
5. Death
5.1 Due to any reason
5.2 Due to natural causes
5.3 Due to suicide
6. Suicidal behaviour
6.1 Number with suicide attempts
6.2 Number with suicide ideation
7. Violent/aggressive behaviour
8. Adverse effects
8.1 General: at least one adverse event
8.2 Specific: movement disorders
8.2.1 At least one movement disorder
8.2.2 Akathisia
8.2.3 Akinesia
8.2.4 Dyskinesia
8.2.5 Dystonia
8.2.6 Rigor
8.2.7 Tremor
8.2.8 Use of antiparkinson medication
8.3 Specific: sedation
8.4 Specific: weight gain
9. Satisfaction with care (any published rating scale)
9.1 Participants satisfied
9.2 Carers satisfied
10. Quality of life (any published rating scale)
11. Functioning
11.1 Number in employment
11.2 Social functioning (any published rating scale)
'Summary of findings' table
We used the GRADE approach to interpret findings (Schünemann 2008) and used GRADEPRO to import data from Review Manager to create a 'Summary of findings' table. This table provides outcome‐specific information concerning the overall certainty of evidence from each included study in the comparison, the magnitude of effect of the interventions examined and the sum of available data on all outcomes that we rated as important to patient care and decision making. We anticipated including the following long‐term main outcomes in a 'Summary of findings' table:
-
relapse: seven to 12 months;
-
leaving the study early: due to any reason (acceptability of treatment);
-
service use: number hospitalised;
-
death: due to suicide;
-
quality of life (any published rating scale);
-
functioning: number in employment;
-
functioning: social functioning (any published rating scale).
Search methods for identification of studies
No language restriction was applied within the limitations of the search tools.
Electronic searches
Cochrane Schizophrenia Group’s Study‐Based Register of Trials
On 10 October 2017, the Information Specialist searched the register using the following search strategy which has been developed based on literature review and consulting with the authors of the review:
((*Cessation* OR *Discontinu* OR *Halt* OR *Maintain* OR *Maintenance* OR *Recur* OR *Rehospitali* OR *Re‐Hospitali* OR *Relaps* OR *Stop* OR *Withdr*) in Title OR Abstract Fields of REFERENCE OR (Maintenance Treatment*) in Intervention Field of STUDY) AND ((*Amisulpride* OR *Aripiprazole* OR *Asenapine* OR *Benperidol* OR *Brexpiprazole* OR *Cariprazine* OR *Chlorpromazine* OR *Clopenthixol* OR *Clozapine* OR *Flupenthixol* OR *Fluphenazine* OR *Fluspirilene* OR *Haloperidol* OR *Iloperidone* OR *Levomepromazine* OR *Methotrimeprazine* OR *Loxapine* OR *Lurasidone* OR *Molindone* OR *Olanzapine* OR *Paliperidone* OR *Penfluridol* OR *Perazine* OR *Perphenazine* OR *Pimozide* OR *Quetiapine* OR *Risperidone* OR *Sertindole* OR *Sulpiride* OR *Thioridazine* OR *Thiothixene* OR *Trifluoperazine* OR *Ziprasidone* OR *Zotepine* OR *Zuclopenthixol*) in Intervention Field of STUDY)
In such study‐based register, searching the major concept retrieves all the synonyms and relevant studies because all the studies have already been organised based on their interventions and linked to the relevant topics (Shokraneh 2017).
This register is compiled by systematic searches of major resources (AMED, BIOSIS, CINAHL, ClinicalTrials.Gov, Embase, MEDLINE, PsycINFO, PubMed, WHO ICTRP) and their monthly updates, ProQuest Dissertations and Theses A&I and its quarterly update, Chinese databases (CBM, CNKI, and Wanfang) and their annual updates, handsearches, grey literature, and conference proceedings (see Group’s Module). There is no language, date, document type, or publication status limitations for inclusion of records into the register.
This search was conducted for a broader project and includes studies comparing antipsychotic drugs for relapse prevention (head‐to‐head studies).
On 3 July 2018 first and then on 11 September 2019, a further updated search of the register was performed. The following search strategy, which was also developed consulting with the authors of the review, was used in both cases:
(*{AP}* in Intervention Field of Study) AND ((*Cessation* OR *Discontinu* OR *Halt* OR *Maintain* OR *Maintenance* OR *Recur* OR *Rehospitali* OR *Re‐Hospitali* OR *Relaps* OR *Stop* OR *Withdr*) in Title OR Abstract Fields of REFERENCE OR (Maintenance Treatment*) in Intervention Field of STUDY); {AP} refers to all antipsychotic drugs in the register.
For previous searches, please see Appendix 1.
Searching other resources
1. Reference searching
We inspected the references of all included studies and of previous reviews (e.g. Davis 1975; Gilbert 1995) for more trials. The targeted update version of this review performed in 2016 was also inspected (New Reference).
2. Personal contact
We contacted the first author of each included study for missing information and for the existence of further studies.
3. Drug companies
We contacted the manufacturers of antipsychotic drugs and asked them about further relevant studies and for missing information on identified studies.
Data collection and analysis
Selection of studies
For the 2019 search, two review authors (JS, AC) identified and independently inspected citations. For the 2018 search, identified citations were independently inspected by two review authors (AC, JL). For the 2017 search, identified citations were independently inspected by two review authors (among JS, AC and JL). For the original search, two review authors (SL, KK) identified and independently inspected citations. We identified potentially relevant reports and ordered full‐text papers for reassessment. Where disagreements arose we asked a third member of the team for help, and if it was impossible to decide, the full papers were ordered for assessment. This process was repeated for the full papers. If it was impossible to resolve disagreements these studies were added to those awaiting classification and we contacted the authors of the papers for clarification.
Data extraction and management
1. Extraction
For this update, three review authors (AC, JL, JS) independently extracted data from included studies. For the original review, three review authors (SL, MT, KK) independently extracted data from the included studies. Any disagreement was discussed with another member of the review team, decisions documented and, if necessary, we contacted authors of studies for clarification. The studies included in the original review were closely inspected in order to collect data on the outcomes that were added to the list within the updating process, and to look for potentially new information from eventual recent secondary publications.
2. Management
For the original review, we extracted data onto standard simple forms. For the review update, we extracted data using electronic forms in Microsoft Access.
3. Scale‐derived data
3.1 Valid measures
We included continuous data from rating scales only if: (a) the psychometric properties of the measuring instrument had been described in a peer‐reviewed journal (Marshall 2000); (b) the measuring instrument was not written or modified by one of the trialists.
3.2 Endpoint versus change data
Since there is no principal statistical reason why endpoint and change data should measure different effects (Higgins 2011, we decided primarily to use scale change data. If change data were not available we used endpoint data. Endpoint and change data were presented in separate subgroups, then pooled in the final analysis.
4. Common measure
To facilitate comparison between trials, we intended to convert variables that can be reported in different metrics, such as days in hospital (mean days per year, per week or per month) to a common metric (e.g. mean days per month).
5. Direction of graphs
Where possible, we entered data in such a way that the area to the left of the line of no effect indicates a favourable outcome for maintenance treatment.
Assessment of risk of bias in included studies
Three review authors (AC, JL, JS) for this update and three review authors (SL, MT, KK) for the original review worked independently by using criteria described in the Cochrane Handbook for Systematic Reviews of Interventions (Higgins 2011) to assess trial quality. This set of criteria is based on evidence of associations between overestimate of effect and high risk of bias of the article, such as sequence generation, allocation concealment, blinding, incomplete outcome data, selective reporting, other potential sources of bias (i.e. fraud, premature interruption of the studies, baseline clinical imbalances among study groups).
Where inadequate details of randomisation and other characteristics of trials were provided, we contacted authors of the studies in order to obtain additional information.
We noted the level of risk of bias in the text of the review, the 'Risk of bias' tables and in the summary of findings Table 1.
Measures of treatment effect
1. Dichotomous data
The review focused on binary data, which are easier to interpret and can be more intuitively understood. For binary outcomes we calculated a standard estimation of the random‐effects (Der‐Simonian 1986) risk ratio (RR) and its 95% confidence interval (CI). It has been shown that RR is more intuitive (Boissel 1999) than odds ratios (ORs) and that ORs tend to be interpreted as RR by clinicians (Deeks 2000). This mis‐interpretation then leads to an overestimate of the impression of the effect. For statistically significant results we calculated the number needed to treat for an additional beneficial outcome/number needed to treat for an additional harmful outcome statistic (NNTB/NNTH), and its 95% CI as the inverse of the risk difference (RD).
Where possible, efforts were made to convert outcome measures to dichotomous data. This could be done by identifying cut‐off points on rating scales and dividing participants accordingly into 'clinically improved' or 'not clinically improved'. It was generally assumed that if there had been a 20% reduction in a scale‐derived score such as the Brief Psychiatric Rating Scale (BPRS, Overall 1962) or the Positive and Negative Syndrome Scale (PANSS; Kay 1986), this could be considered as a minimally significant response (Leucht 2005a; Leucht 2005b). If data based on these thresholds were not available, we used the primary cut‐off presented by the original authors.
2. Continuous data
2.1 Summary statistic
For continuous outcomes we estimated a mean difference (MD) between groups. MDs were based on the random‐effects model as this takes into account any differences between studies even if there is no statistically significant heterogeneity. In the case of where scales were judged of such similarity to allow pooling, we calculated the standardised mean difference (SMD) and, whenever possible, transformed the effect back to the units of one or more of the specific instruments.
All the numbers were entered in a way that a decrease in score should indicate improvement (for change data), and a lower score a better outcome (for endpoint data), in order to provide a similarity to the Positive and Negative Syndrome Scale (PANSS, Kay 1986), and make the numbers comparable and easy to interpret. When a rating scale construct provided for a higher score to indicate a better outcome, a minus (‐) was added before the numbers.
2.3 Skewed data
Continuous data on clinical and social outcomes are often not normally distributed. To avoid the pitfall of applying parametric tests to non‐parametric data, we applied the following standards to all data before inclusion:
(a) data from studies of at least 200 participants were entered in the analysis irrespective of the following rules, because skewed data pose less of a problem in large studies;
(b) change data: when continuous data are presented on a scale that includes a possibility of negative values (such as change data), it is difficult to determine whether data are skewed or not. We entered the study, because change data tend to be less skewed and because excluding studies would also lead to bias, because not all the available information was used;
(c) endpoint data: when a scale starts from the finite number zero, we subtracted the lowest possible value from the mean, and divided this by the standard deviation. If this value was lower than 1, it strongly suggested a skew and the study was excluded. If this ratio was higher than 1 but below 2, there is suggestion of skew. We entered the study and tested whether its inclusion or exclusion substantially changed the results. If the ratio was larger than 2 the study was included, because skew is less likely (Altman 1996; Higgins 2011).
Unit of analysis issues
1. Cluster trials
Studies increasingly employ 'cluster randomisation' (such as randomisation by clinician or practice) but analysis and pooling of clustered data poses problems. First, authors often fail to account for intra‐class correlation in clustered studies, leading to a 'unit of analysis' error (Divine 1992) whereby P values are spuriously low, CIs unduly narrow and statistical significance overestimated. This causes type I errors (Bland 1997; Gulliford 1999).
Where clustering is not accounted for in primary studies, we presented data in a table, with a (*) symbol to indicate the presence of a probable unit of analysis error. In subsequent versions of this review we will seek to contact first authors of studies to obtain intra‐class correlation coefficients (ICCs) for their clustered data and to adjust for this by using accepted methods (Gulliford 1999). Where clustering had been incorporated into the analysis of primary studies, we present these data as if from a non‐cluster randomised study, but adjusted for the clustering effect.
We have sought statistical advice and have been advised that the binary data as presented in a report should be divided by a 'design effect'. This is calculated using the mean number of participants per cluster (m) and the ICCs [design effect = 1 + (m ‐ 1)*ICC] (Donner 2002). If the ICC was not reported it was assumed to be 0.1 (Ukoumunne 1999).
If cluster studies have been appropriately analysed taking into account ICCs and relevant data documented in the report, synthesis with other studies would have been possible using the generic inverse variance technique.
2. Cross‐over trials
A major concern of cross‐over trials is the carry‐over effect. It occurs if an effect (e.g. pharmacological, physiological or psychological) of the treatment in the first phase is carried over to the second phase. As a consequence, on entry to the second phase the participants can differ systematically from their initial state despite a wash‐out phase. For the same reason cross‐over trials are not appropriate if the condition of interest is unstable (Elbourne 2002). As both effects are very likely in schizophrenia, randomised cross‐over studies were eligible but only data up to the point of first cross‐over.
3. Studies with multiple treatment groups
Where a study involved more than two treatment arms, especially two appropriate dose groups of an antipsychotic drug, the different dose arms were pooled and considered to be one. Where the additional treatment arms were not relevant, we did not reproduce these data.
Dealing with missing data
1. Overall loss of credibility
At some degree of loss to follow‐up, data must lose credibility (Xia 2009). The loss to follow‐up in randomised schizophrenia trials is often considerable calling the validity of the results into question. Nevertheless, it is unclear which degree of attrition leads to a high degree of bias. We did not exclude trials from outcomes on the basis of the percentage of participants completing them. However, we used the 'Risk of bias' tool described above to indicate potential bias when more than 25% of the participants left the studies prematurely, when the reasons for attrition differed between the intervention and the control group and when no appropriate imputation strategies were applied.
2. Dichotomous data
We presented data on a 'once‐randomised‐always‐analyse' basis, assuming an intention‐to‐treat (ITT) analysis. If the authors applied such a strategy, we used their results. If the original authors presented only the results of the per‐protocol or completer population, we assumed that those participants lost to follow‐up would have had the same percentage of events as those who remained in the study.
3. Continuous data
3.1 General
ITT was used when available. We anticipated that in some studies, in order to perform an ITT analysis, the method of last observation carried forward (LOCF) would be employed within the study report. As with all methods of imputation to deal with missing data, LOCF introduces uncertainty about the reliability of the results (Leon 2006). Therefore, where LOCF data have been used in the analysis, they are indicated in the review.
3.2 Missing standard deviations
Where there are missing measures of variance for continuous data but an exact standard error and CI are available for group means, either 'P' value or 't' value are available for differences in mean, we calculated the standard deviation value according to method described in Section 7.7.3 of the Cochrane Handbook for Systematic Reviews of Interventions (Higgins 2011). If standard deviations were not reported and could not be calculated from available data, we asked authors to supply the data. In the absence of data from authors, we used the mean standard deviation from other studies.
Assessment of heterogeneity
1. Clinical heterogeneity
We considered all included studies initially, without seeing comparison data, to judge clinical heterogeneity. We simply inspected all studies for clearly outlying people or situations that we had not predicted would arise and, where found, discussed such participant groups or situations.
2. Methodological heterogeneity
We considered all included studies initially, without seeing comparison data, to judge methodological heterogeneity. We simply inspected all studies for clearly outlying methods, which we had not predicted, would arise and discussed any such methodological outliers.
3. Statistical heterogeneity
3.1. Visual inspection
We inspected graphs visually to investigate the possibility of statistical heterogeneity.
3.2. Employing the I² statistic
We investigated heterogeneity between studies by considering the I² statistic alongside the Chi² P value. The I² statistic provides an estimate of the percentage of inconsistency thought to be due to chance (Higgins 2003). The importance of the observed value of I² statistic depends on both the magnitude and direction of effects and the strength of evidence for heterogeneity (e.g. P value from the Chi² test, or 95% CIs for the I² statistic). An I² statistic estimate equal or greater than 50% accompanied by a statistically significant Chi² statistic would be interpreted as evidence of substantial levels of heterogeneity (Higgins 2011). When substantial levels of heterogeneity were found in the primary outcome, we explored reasons for heterogeneity (Subgroup analysis and investigation of heterogeneity).
Assessment of reporting biases
Reporting biases arise when the dissemination of research findings is influenced by the nature and direction of results (Egger 1997). These are described in Section 10.1 of the Cochrane Handbook for Systematic Reviews of Interventions (Higgins 2011). We are aware that funnel plots may be useful in investigating reporting biases but are of limited power to detect small‐study effects. We did not use funnel plots for outcomes where there were 10 or fewer studies, or where all studies were of similar sizes. In other cases, where funnel plots were possible, we sought statistical advice in their interpretation.
Data synthesis
We employed a random‐effects model for analyses (Der‐Simonian 1986). We understand that there is no closed argument for preference for use of fixed‐effect or random‐effects models. The random‐effects method incorporates an assumption that the different studies are estimating different, yet related, intervention effects. This does seem true to us and the random‐effects model takes into account differences between studies even if there is no statistically significant heterogeneity. Therefore, the random‐effects model is usually more conservative in terms of statistical significance, although as a disadvantage it puts added weight onto smaller studies, which can either inflate or deflate the effect size. We examined in a secondary analysis whether using a fixed‐effect model markedly changed the results of the primary outcome.
Subgroup analysis and investigation of heterogeneity
Reasons for heterogeneity in the primary outcome were explored by the following subgroup analyses and restricted‐maximum‐likelihood‐random‐effect meta‐regressions, the latter performed using meta v4.9‐9 (Schwarzer 2007) in R statistical language v3.6.2 (R Core Team 2018). The R code used for meta‐regressions is reported in Appendix 2. Post‐hoc analyses are marked with an asterisk.
Subgroup analyses addressed people with only one episode of schizophrenia and people in remission at baseline, who may both have a better prognosis. We examined people who had been stable for different durations before study entry (at least three, six, nine, 12 and more than 12 months) to find out whether after long‐term stability antipsychotic drugs are no longer necessary. Abrupt versus gradual withdrawal of the pre‐study antipsychotic drug, defined as a minimum taper period of three weeks or depot treatment before the study following Viguera 1997*, was examined because abrupt withdrawal may lead to rebound psychoses. Other subgroup analyses addressed: single antipsychotic drugs*, depot versus oral medication* (depot drugs are thought to be superior due to better compliance), first‐ versus second‐generation antipsychotic drugs* (to address the debate whether the more expensive second‐generation drugs are more efficacious), unblinded versus blinded trials* and studies with appropriate and unclear allocation concealment methods*.
Duration of stability before study entry and duration of taper in the placebo group were also examined by meta‐regressions. Other meta‐regressions addressed severity of illness at baseline, mean dose in chlorpromazine equivalents and study duration. Meta‐regressions were performed only if at least 10 studies per comparison were available (Higgins 2011). For the dose conversion to chlorpromazine equivalents, doses were transferred following the conversion factors provided by available publications (Davis 1974, Gardner 2010, Gopal 2010). Regarding long‐acting injectable drugs, the mean daily dose was obtained by dividing the given dose by the injection interval, and then transferred to chlorpromazine equivalents.
Sensitivity analysis
All sensitivity analyses were made only for the primary outcome. Some of them were performed post‐hoc, due to the fact that reviewers of the original Lancet publication (Leucht 2012a) asked for them.
1. Implication of randomisation
We excluded studies in a sensitivity analysis if they were described in some way as to imply randomisation. If there was no substantive difference when the implied randomised studies were excluded or added to those with better description of randomisation, then all data were employed from these studies.
2. Implication of non double‐blind trials
We excluded trials in a sensitivity analysis if they were not double‐blinded. If there was no substantive difference when the non double‐blind studies were excluded or added to the double‐blind studies, then all data were employed from these studies.
3. Fixed‐effect model
A sensitivity analysis was performed employing a fixed‐effect model for the analysis of data for all the relevant studies, in order to examine whether applying a different approach markedly changed the results of the primary outcome or not.
4. Assumptions for lost binary data
Where assumptions had to be made regarding people lost to follow‐up (see Dealing with missing data), we compared the findings when we used our assumption compared with completer data only. If there was a substantial difference, we reported results and discussed them but continued to employ our assumption.
5. Inclusion of large studies only
We included trials in a sensitivity analysis only if at least 200 participants were enrolled.
6. Exclusion of studies that used clinical criteria to diagnose the participants
We excluded trials in a sensitivity analysis if either enrolled participants were diagnosed with schizophrenia only on a clinical basis, or no mention to the use of specific operational diagnostic criteria was made.
7. Inclusion of only those participants who had been in the trials without a relapse for specific time intervals
Secondary analyses were performed entering only data of those participants who had not relapsed for various durations after study start (three months, six months, nine months). Relapse risks resulted therefore from the number of relapse events from the beginning at the time interval till the end of a study, divided by the patients at risk of relapse, who had not relapsed before.
8. Exclusion of studies with unclear randomisation/allocation concealment methods
We excluded trials in a sensitivity analysis if a detailed description of the randomisation method used was not provided. In another sensitivity analysis, trials were excluded whether the method of allocation concealment was judged to be inadequately clarified
Summary of findings and assessment of the certainty of the evidence
Results
Description of studies
For substantive description of studies please see Characteristics of included studies and Characteristics of excluded studies tables.
Results of the search
The original search in the CSG register yielded 1163 reports and two previous reviews contained 66 (Gilbert 1995) and 24 studies (Davis 1975). The update search in 2011 identified another 669 reports. Overall, 185 studies were closely inspected. We included 116 publications on 65 studies and we excluded 69 publications on 49 studies. See Study flow diagram (Figure 1).

Study flow diagram (results of the original search)
For the review update in 2018: 3 reports describing the 2 studies originally excluded from quantitative synthesis were moved to excluded studies (no usable data for outcomes of interest); 3 reports on 1 study, originally excluded (short duration of follow‐up), were moved to included studies; one report originally included as independent study was moved as secondary publication of another included study.
The update search performed in October 2017 yielded 3562 reports; the update search performed in July 2018 yielded 295 reports; the update search performed in September 2019 yielded 137 reports. An additional five reports were identified through other sources (handsearch in our research group's database of schizophrenia trials). Overall, 198 reports were closely inspected within the update process. We included 80 publications on 12 studies, and we excluded 35 studies (81 publications); five reports are still awaiting classification after contacting the corresponding authors, and three reports on three ongoing and potentially relevant trials were also identified. Twenty‐nine reports were moved as secondary publications of already included/excluded studies. See Study flow diagram (Figure 2).

Study flow diagram (results of the 2017/2018/2019 update search and combined results of the original search and the update search)
For this update, one study (originally referenced as 'Pfizer 2000', previously included as an independent study obtained from a pharmaceutical company) was found to be an unpublished report of another included study (Ziprasidone 2002), and was therefore moved into this study; the references reported a slightly different sample size, as one recruiting centre was removed due to protocol deviation, but the reported study ID was the same (128‐303). One study (Olanzapine 1999) was previously excluded due to short duration of follow‐up (one to three days), but was then moved to included studies (a sensitivity analysis of the outcome relapse excluding this study was performed and found no different results); two studies (Gitlin 1988 and Hirsch 1996) were previously included in the qualitative synthesis but not in the meta‐analysis, due to the absence of usable outcome data. For this update, they were moved to excluded studies (see Figure 1).
Overall, 225 publications on 75 studies were included and 150 publications on 85 studies were excluded. See Study flow diagram (Figure 2).
Included studies
Seventy‐five studies (9145 participants) met the inclusion criteria.
1. Length of trials
Of the included studies, 17 had a duration up to three months. Twenty‐six studies lasted up to six months and 25 up to 12 months. Seven studies lasted more than 12 months. The longest study had a duration of three years.
2. Participants
In 33 of the 65 studies, participants were diagnosed according to clinical diagnoses (i.e. specific diagnostic criteria were not mentioned). The others used a variety of tools, combinations of tools and versions of those tools.
| Number of studies | Diagnostic tool | Version | + additional tool |
|---|---|---|---|
| 4 | Diagnostic and Statistical Manual | II | |
| 5 | III | ||
| 2 | III‐R | ||
| 9 | IV | ||
| 10 | IV‐TR | ||
| 1 | IV Axis I Disorders (Structured Clinical Interview) | ||
| 3 | Present State Examination (PSE) | ||
| 3 | Research Diagnostic Criteria (RDC) | ||
| 1 | + Schedule for Affective Disorder | ||
| 1 | + PSE + Feighner's criteria | ||
| 1 | Feighner's criteria | ||
| 1 | International Statistical Classification of Diseases and Related Health Problems (ICD‐9) | + RDC | |
| 1 | + PSE | ||
The average age of participants was around 45 years old, and the mean duration of illness well over two decades (26.2 years). In 13 studies, participants were in remission at baseline.
3. Setting
Twenty‐nine studies were conducted in hospitals (at least at the start of the trial) and 34 studies in outpatients. Seven studies included both inpatients and outpatients. Several important and [mostly] quite recent studies did not report on setting (Asenapine 2011, Lurasidone 2016, Paliperidone depot1M 2010, Penfluridol 1987, Quetiapine 2007).
4. Study size
The average number of participants was 122 (median 67). Chlorpromazine 1968 was the largest study with 420 participants, while Chlorpromazine 1975 was the smallest, randomising only 14 people. Thirty‐four studies had fewer than 50 participants and 19 randomised more than 200. The oldest trials were some of the largest but, in recent years the size did seem to be increasing (Figure 3).
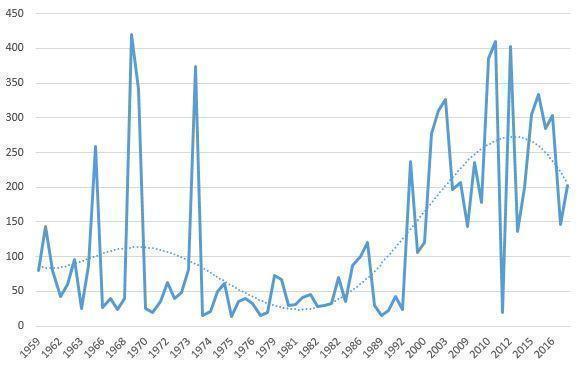
Size of trial over time
5. Interventions
Seventy‐three studies compared maintenance treatment with antipsychotic drugs and inactive placebo; two open randomised controlled trials (RCTs) compared antipsychotic drugs with no treatment. No data on active placebo as a comparator were available. In most studies flexible doses of antipsychotic drugs were employed although some trials did use fixed doses (see table below). The older trials did have ranges which could have included using doses that would be considered very high now. For example, the doses in Pimozide 1971 and Trifluoperazine 1969 were very high (pimozide 40 mg/day and trifluoperazine 80 mg/day, respectively) and in Various drugs 1982 (chlorpromazine 75 mg/day, haloperidol 3 mg/day) they were very low. However, in most cases most participants would have been given doses of drugs well within the usual ranges employed in current day‐to‐day practice.
| Flexible doses | Fixed doses | ||
|---|---|---|---|
| Drug | Dose range | Drug | Fixed doses |
| aripiprazole | 10 mg/day to 30 mg/day | aripiprazole long‐acting | 300 mg or 400 mg four‐weekly |
| brexpiprazole | 1 mg/day to 4 mg/day | haloperidol decanoate | 60 mg four‐weekly |
| cariprazine | 3 mg/day to 9 mg/day | olanzapine | 10 mg/day, 15 mg/day or 20 mg/day |
| chlorpromazine (equivalent) | 50 mg/day to 1000 mg/day | paliperidone depot | 25 mg, 50 mg,100 mg or 150 mg four‐weekly or 175 mg, 263 mg, 350 mg or 525 mg twelve‐weekly |
| flupenthixol depot | 20 mg to 40 mg three‐weekly | zotepine | 300 mg/day |
| fluphenazine decanoate | 1.25 mg to 5 mg twice‐weekly | ||
| fluphenazine depot | 12.5 mg to 25 mg three‐weekly or 25 mg to 50 mg four‐weekly | ||
| iloperidone | 8 mg/day to 24 mg/day | ||
| paliperidone | 3 to mg/day 15 mg/day | ||
| penfluridol | 10 mg/week to 160 mg/week | ||
| perphenazine | 8 mg/day to 24 mg/day | ||
| pimozide | 2 mg/day to 40 mg/day | ||
| prochlorpromazine | 15 mg/day to 150 mg/day | ||
| promazine | 200 mg/day to 400 mg/day | ||
| quetiapine | 500 mg/day to 800 mg/day | ||
| thioridazine | 75 mg/day to 1000 mg/day | ||
| trifluoperazine | 5 mg/day to 50 mg/day | ||
| ziprasidone. | 40 mg/day to 160 mg/day | ||
In a number of studies various antipsychotic drugs could be administered.
6. Sponsor
Most studies had either a neutral sponsor or sponsorship was not indicated. Twenty‐five studies were industry sponsored (Aripiprazole 2003; Aripiprazole 2017; Aripiprazole depot 2012; Asenapine 2011; Brexpiprazole 2017; Cariprazine 2016; Fluphenazine depot 1992; Iloperidone 2016; Lurasidone 2016; Olanzapine 2003; Paliperidone 2007; Paliperidone 2014; Paliperidone depot1M 2010; Paliperidone depot1M 2015; Paliperidone depot3M 2015; Penfluridol 1970; Penfluridol 1974b; Quetiapine 2007; Quetiapine 2009a; Quetiapine 2009b; Quetiapine 2010; Various drugs 1971; Various drugs 1989; Ziprasidone 2002; Zotepine 2000). Frequently medication was provided by the manufacturers of the antipsychotic drugs, but we did not record such studies as primarily 'industry sponsored'.
7. Outcomes
7.1 Relapse
The main relapse criteria in 25 studies was clinical judgement. However, in 24 studies various rating‐scale‐based definitions of relapse were used, in another 16 studies we took relapse as 'need of medication', in four 'admission to hospital', in two 'dropout due to worsening of symptoms', and, finally, in four the criteria used for 'relapse' was not indicated.
7.2 Leaving the study early
The number of participants leaving the study early was recorded by category ('any reason', 'adverse events' and 'lack of efficacy'). In the more recent trials, efficacy‐related adverse events (e.g. exacerbation of psychosis) are often grouped with tolerability‐related adverse events as "Leaving the study early due to adverse events". Where detailed data on leaving early were available, data on 'exacerbation of psychosis' were not entered as 'adverse events'.
7.3 Service use
Service use was described as the number of people re‐hospitalised and the numbers discharged during the trial. When reasons for hospitalisation were provided, we decided to enter data relative to people rehospitalised due to relapse or exacerbation of psychosis.
7.4 Scales
Scales that provided usable data are described below. We had, however, a priori, decided in the protocol to focus on dichotomous outcomes apart from quality of life and social functioning (see Measures of treatment effect). However, a few authors used rating scales to examine extrapyramidal adverse effects and defined cut‐offs to decide whether participants had a particular side effect or not. We used these data and explain below which cut‐offs were used.
7.4.1 Adverse effects scales
7.4.1.1 Abnormal Involuntary Movement Scale (AIMS) (Guy 1976)
This scale has been used to assess tardive dyskinesia, a long‐term, drug‐induced movement disorder and short‐term movement disorders such as tremor. A low score indicates low levels of abnormal involuntary movements. In Fluphenazine depot 1982, all participants with any positive AIMS score were considered to have tardive dyskinesia. In Olanzapine 2003, the cut‐off was 3 or more on any item, or 2 or more on any two of the items. In Fluphenazine 1980 the cut‐off was any item rated 2. In Quetiapine 2010, the cut‐off was 2 or more on the global severity item.
7.4.1.2 Barnes Akathisia Scale (BAS) (Barnes 1989)
The scale comprises items rating the observable, restless movements that characterise akathisia, a subjective awareness of restlessness, and any distress associated with the condition. These items are rated from 0 (normal) to 3 (severe). In addition, there is an item for rating global severity (from 0 (absent) to 5 (severe)). A low score indicates low levels of akathisia. In Olanzapine 2003 all participants with a BAS score of 2 or more were considered to have akathisia. In Quetiapine 2010 the cut‐off was 2 or more on the global severity item.
7.4.1.3 Simpson‐Angus Scale (SAS) (Simpson 1970)
The 10‐item scale, with a scoring system of 0 to 4 for each item, measures drug‐induced parkinsonism, a short‐term drug‐induced movement disorder. A low score indicates low levels of parkinsonism. In Olanzapine 2003 all participants with a SAS score of 4 or more were considered to have parkinsonism. In Quetiapine 2010 the cut‐off was 1 or more on the mean SAS score.
7.4.2 Satisfaction with care scales
7.4.2.1 Participant Satisfaction with Medication Questionnaire ‐ Modified (PSMQ‐M) (Kalali 1999)
This self‐administered instrument consists of a 4‐part list of items rated according to 6‐point Likert scales, and measures the patient's satisfaction with current medication (ranging from "extremely satisfied" to "extremely unsatisfied") and the side effects burden (ranging from "no side effects" to "much more side effects"), with respect to previous antipsychotic medications. At the end, the patient is asked to state his preference for "current" versus "previous" medication. This instrument was applied in Aripiprazole depot 2012. The proportion of participants defined by the study authors as "at least very satisfied" was taken into the analysis for the present review.
7.4.2.2 Medication Satisfaction Questionnaire (MSQ) (Vernon 2010)
The instrument consists of a single question, read aloud by the clinician to the patient ("Overall, how satisfied are you with your current antipsychotic medication"). The answer has to be given according to a 7‐point Likert scale, ranging from 1 ("extremely dissatisfied") to 7 ("extremely satisfied). A 1‐point change over time may be considered as clinically meaningful. The proportion of participants defined as "satisfied with medication" according to this instrument was entered into the analysis for the current review, This scale was applied in Paliperidone depot1M 2015.
7.4.3 Quality of life scales
7.4.3.1 Heinrichs‐Carpenter Quality of Life Scale (QLS) (Carpenter 1994)
This semi‐structured interview is administered and rated by trained clinicians. It contains 21 items rated on a 7‐point scale based on the interviewer's judgement of patient functioning. A total quality‐of‐life score and four subscale scores are calculated, with higher scores indicating less impairment. This scale was applied in Olanzapine 2003.
7.4.3.2 Symptom Questionnaire of Kellner and Sheffield (SQKS) (Kellner 1973)
The 30‐item self‐completion questionnaire measures subjective well‐being. A total score and four subscale scores are obtainable from the questionnaire. This instrument was applied in Various drugs 1981b.
7.4.3.3 Self‐report Quality of Life Scale (SQLS) (Wilkinson 2000)
The scale is a self‐administered rating scale that includes 33 items concerning the patient's symptoms and well‐being over the preceding seven days, on a scale from 0 (never) to 4 (always). Total scores range from 0 to 100, with low scores representing a better outcome. Results based on this rating scale were found in Paliperidone 2007 and Paliperidone depot1M 2010.
7.4.3.4 Schizophrenia Quality of Life (S‐QoL) (Auquier 2003, Boyer 2010)
The scale is a self‐administered questionnaire to assess health‐related quality of life among people with schizophrenia, defined as the discrepancy between expectation and current life experience. The original version is composed of 41 items, and a shortened 18‐item version has been validated, with high degree of comparability with the original one. It is a multidimensional instrument with high reliability, validity and sensitivity to change. It evaluates 8 dimensions (psychological well‐being, self‐esteem, family relationships, relationships with friends, resilience, physical well‐being, autonomy and sentimental life). Each of the items is accompanied by a 5‐point Likert scale (1 = less than expected; 5 = more than expected, with the negatively worded item scores reversed). The score of each of the eight dimensions can be obtained by computing the mean of each item score within the dimension; by summing up every dimension score a total score is obtained. Quetiapine 2009a and Quetiapine 2009b applied this instrument.
7.4.3.5 EuroQol 5 Dimension ‐ Visual Analog Scale (EQ‐5D VAS) (EuroQol 1990)
The EQ‐5D is a self‐administered standardised measure of health status, applicable to a wide range of health conditions, and it is used to evaluate health care from a clinical and economic point of view, as well as in population health surveys. It consists of two parts: the EQ‐5D descriptive system and the EQ 20‐cm visual analogue scale (VAS). The first parts consists of one question in each of five dimensions (mobility, self‐care, pain, usual activities, and anxiety) with five possible response levels per question (level 1= no problem; level 5= extreme problems). The 20‐cm VAS has endpoints labelled "best imaginable health state" (anchored at 100) and "worst imaginable health state" (anchored at 0). Respondents are asked to indicate how they rate their own health by drawing a line from an anchor box to that point on the EQ‐VAS, which best represents their own health on a specified time period (usually that day). This instrument was used in Lurasidone 2016.
7.4.4 Social functioning scales
7.4.4.1 Personal and Social Performance (PSP) (Morosini 2000)
The scale is a validated clinician‐reported instrument that has been widely used in clinical trials to assess personal and social functioning of patients with psychiatric disorders. It is based on four distinct domains: (a) socially useful activities, (b) personal and social relationships, (c) self‐care, (d) disturbing and aggressive behaviour. Each PSP domain is assessed on a 6‐point severity scale ranging from "absent" to "very severe" difficulties in the specified area. After each domain is scored, raters determine one total score by selecting a 10‐point range within a 100‐point scale based on the domain scores following PSP scoring guidelines. The higher the score, the better the functioning. A variation of eight points over time should be classified as clinically significant. This scale was applied in the studies Aripiprazole depot 2012, Brexpiprazole 2017, Cariprazine 2016, Paliperidone 2007, Paliperidone 2014, Paliperidone depot1M 2010, Paliperidone depot1M 2015, Paliperidone depot3M 2015, Quetiapine 2009a and Quetiapine 2009b.
7.4.4.2 Global Assessment of Functioning (GAF) (American Psychiatric Association 1987)
The scale is a numeric scale (0 to 100 points) used by clinicians to subjectively rate the severity of mental illnesses in terms of their impact on day‐to‐day life. It is a brief and easy‐to‐administer scale, although based on a single global impression. It is broken into 10 sections, so that the higher the score, the better the functioning of the patients. Results derived from this scale were found in Ziprasidone 2002.
7.4.4.3 Sheehan Disability Scale (SDS) (Sheenan 1983)
The SDS is a brief, 5‐item self‐administered tool that assesses functional impairment in three areas: work/school, social life and family life. The patient has to rate the extent to which each area is affected by his/her symptoms. Total score is obtained by summing the single dimension score into one measure, and ranges from 0 (unimpaired) to 30 (highly impaired). No cut‐off has been recommended, but a score of 5 or more on any of the three areas could be classified as significant functional impairment. This scale was applied in Iloperidone 2016.
7.4.4.4 Specific Level of Functioning (SLOF) (Schneider 1983)
The scale is a 43‐item multidimensional behavioural survey assessing schizophrenia patients' current functioning and observable behaviour, and it is focused on the person's skills rather than deficits. It can be administered to the patient him/herself or to his/her caregiver. It comprises six subscales: (a) physical functioning, (b) personal care skills, (c) interpersonal relationships, (d) social acceptability, (e) activities of community living and (f) work skills. Each question is rated on a 5‐point Likert scale. Total scores range from 43 to 215, with higher scores representing better overall functioning. This instrument was applied in Lurasidone 2016.
7.4.4.5 Global Assessment Scale (GAS) (Endicott 1976) and Children Global Assessment Scale (CGAS) (Shaffer 1983)
The GAS is a rating scale used to evaluate the overall functioning of a person seeking mental health services, during a specified time period, independently of specific mental health diagnoses. It has proven to have good reliability and high sensitivity to change over time. The scale values range from 1 to 100, with higher scores representing better functioning and scores above 70 indicating good functioning. The CGAS is and adaptation of the GAS, designed to reflect the lower level of functioning of children and adolescents with respect to adults. Fluphenazine depot 1981 reported data from GAS, while the adaptation for children was used in Aripiprazole 2017.
7.5 Other adverse effects
Other adverse events such as death, suicide, suicide attempts, suicidal ideation, violent/aggressive behaviour, at least one adverse event, at least one movement disorder, akathisia, akinesia, dystonia rigor, tremor, use of antiparkinson medication, tardive dyskinesia, sedation and weight gain were reported in a dichotomous manner in terms of the number of participants with a given side effect.
7.6 Global state: number of participants improved (at least minimally)
The number of people who improved at the end of the studies was assessed by the Clinical Global Impression (CGI) scale (Guy 1976) or similar rating systems. The CGI compares the conditions of the person standardised against other people with the same diagnosis. A 7‐point scoring system is used with low scores showing decreased severity, overall improvement, or both. The outcome was defined as the number of participants 'at least minimally improved' (CGI score of 3 or less). When other scales were used in the original studies (e.g. PANSS, BPRS), data based on the '20% reduction of score' cut‐off were used. If data based on these thresholds were not available, we used the numbers presented by the original authors (study‐defined improvement), when available.
7.7 Global state: number of participants in symptomatic remission
The number of participants in symptomatic remission was defined by either 'mild or better' at the Clinical Global Impression (CGI) or similar rating systems, or using the operational criteria for remission in schizophrenia proposed by Andreasen et al (Andreasen 2005), without employing any duration threshold. In this case, a score of 'mild or less' at all eight core symptoms (delusions, hallucinatory behaviour and unusual thought content for the positive dimension, conceptual disorganisation and mannerism/disorders of posture for the disorganisation dimension, blunted affect, social withdrawal and lack of spontaneity/flow of conversation for the negative dimension) constitutes the symptom severity level of remission. If data based on these criteria were not available, other definitions of remission used by the original Authors ‐ with no mention to its duration ‐ were accepted. It should be noted that we defined this outcome as cross‐sectional and representative of the clinical severity level of patients, independent on the fact that the patients were achieving or maintaining it.
7.8 Global state: number of participants in sustained remission
This outcome was defined as either the number of participants achieving and maintaining the aforementioned symptom severity level (symptomatic remission) for a minimum period of six months, as proposed by Andreasen 2005, or the number already in remission at baseline and maintaining the same severity level for the whole duration of the study (if lasting at least six months).
7.9 Global state: number of participants in recovery
At present, more research is needed in order to achieve consensus regarding operational criteria for recovery (Andreasen 2005). Therefore, every definition of recovery provided by the original studies, including symptom severity, social‐occupational functioning and data on subjective recovery, was accepted.
7.10 Number of participants in employment
This outcome was described as the number of participants being employed at the end of the trials.
Excluded studies
We excluded 85 studies. Twenty‐six studies were excluded because they were not (appropriately) randomised. Twenty‐four studies were excluded because they did not examine suitable participants (e.g. participants had not been stabilised on antipsychotic drugs before study start. Twenty‐two studies were excluded because the interventions were not appropriate for this review ‐ most, for example, did not use a placebo control group. Thirteen studies were excluded because they did not report any usable or relevant outcomes.
Risk of bias in included studies
For graphical representations of our judgements of risk of bias please refer to Figure 4 and Figure 5. Full details of judgements are seen in the 'Risk of bias' tables.

'Risk of bias' graph: review authors' judgements about each risk of bias item presented as percentages across all included studies.

'Risk of bias' summary: review authors' judgements about each risk of bias item for each included study.
Allocation
In 22 studies, random sequence generation was adequate. In the remaining 53 studies this was unclear. Among these, 50 studies were described as "randomised", but 39 of these did not provide any further details about random sequence generation. Eleven studies gave further information about randomisation, but these details were rather superficial and we still had to rate them as 'unclear'. Three further studies (Haloperidol 1973; Penfluridol 1987; Various drugs 1989) did not provide any information about sequence generation, but they were double‐blind and we assumed they were also randomised.
In 26 studies, allocation concealment was rated as adequate. For example, some studies reported that the only people with access to the identity of patients were the hospital pharmacist (e.g. Chlorpromazine 1976; Trifluoperazine 1972), a research assistant (e.g. Fluphenazine depot 1973), a psychiatrist without contact to participants (Various drugs 1962b) or a unit secretary (Various drugs 1971). Aripiprazole depot 2012, Brexpiprazole 2017, Iloperidone 2016Lurasidone 2016, Olanzapine 2003, Paliperidone 2007, Paliperidone 2014, Paliperidone depot1M 2010, Paliperidone depot1M 2015 and Paliperidone depot3M 2015 used an interactive voice‐response system for allocation concealment. One study (Ziprasidone 2002) used treatment cards numbered for each participant and investigators and pharmacists allocated numbers to people. Quetiapine 2010 reported that AstraZeneca prepared individually‐numbered study drugs and packed them according to the randomisation sequence. Two studies mentioned that codes were not broken until the time of the analysis and that the code was unknown to the investigators (Haloperidol depot 1982, Zotepine 2000).
The remaining 49 studies ‐ often undertaken well beyond the period when the need for good reporting was widely recognised (CONSORT) ‐ did not provide any details on allocation concealment. Therefore, it was unclear for most of the studies whether adequate allocation concealment methods were used.
Blinding
Concerning bias related to blinding of participants and personnel, we rated seven studies to have a low risk of bias. In them it was either tested that blinding had worked (Chlorpromazine 1962; Fluphenazine depot 1973; Perphenazine 1963; Various drugs 1971), or the authors had applied specific measures to improve blinding (e.g. prophylactic antiparkinson medication to avoid unmasking by side effects, Fluphenazine 1979; medication was administered by a person distinct from other study personnel, Paliperidone depot1M 2015 and Paliperidone depot3M 2015).
Six studies were rated with a high risk of bias. Various drugs 2011 was an open study, without providing any further information. In Various drugs 1964a, the placebo group received medication only every other day and blinding was not fully maintained. Various drugs 1968 and Various drugs 1981a reported that nurses had made correct guesses as to who was on drug and who was on placebo. In Fluphenazine depot 1982 evaluating psychiatrists and participants were unaware of the contents of the injections, while treating psychiatrists seemed to be aware of it. Various drugs 1993 was an open trial with rating scales being additionally rated by a second blind assessor.
In the other 62 studies, we rated the risk of bias as unclear. All these studies were described as double‐blind, with no further relevant information.
Concerning blinding of outcome assessment, all studies were rated as 'low risk of bias' concerning what we designated as 'more' objective outcomes, because we considered blinding to be less important for these.
As to subjective outcomes, we rated seven studies to have a low risk of bias. In them it was either tested that blinding had worked (Chlorpromazine 1962; Fluphenazine depot 1973; Perphenazine 1963; Various drugs 1971) or the authors had applied specific measures to improve blinding (e.g. prophylactic antiparkinson medication to avoid unmasking by side effects, Fluphenazine 1979; medication was administered by a person distinct from other study personnel, Paliperidone depot1M 2015 and Paliperidone depot3M 2015).
Four studies were rated with a high risk of bias for subjective outcomes. Various drugs 2011 was an open study, without providing any further information. In Various drugs 1964a, the placebo group received medication only every other day and blinding was not fully maintained. Various drugs 1968 and Various drugs 1981a reported that nurses had made correct guesses as to who was on drug and who was on placebo.
In the other 64 studies, we rated the risk of bias for subjective outcomes as 'unclear'. With the exception of Various drugs 1993 (an open trial with rating scales being additionally rated by a second blind assessor), all these 64 studies were described as double‐blind. But as antipsychotic drugs have adverse effects we considered that we should make a conservative judgment about the success of blinding. Many of these reports did not provide any details about how double‐blind conditions were maintained. It was usually just stated that the studies were "double‐blind" or it was simply indicated that "identical capsules" were used. Some studies using depot antipsychotic drugs reported that sesame oil injections were used in the placebo groups (e.g. Fluphenazine depot 1968 and Various drugs 1984a).
Incomplete outcome data
The number of participants leaving the studies early was frequently high leading to a judgement of high risk of bias in 30 included studies. The most frequent reason for leaving the studies early was 'relapse', because many studies had predefined in their protocols that once participants had relapsed they had to discontinue the trial. This had two consequences: the primary outcome relapse was frequently not affected by attrition, because most participants reached this end point. However, there was a risk of bias for other outcomes (e.g. adverse effects), because the reasons for leaving the studies early differed between participants on placebo (mainly relapse/inefficacy) and participants on antipsychotic drugs (other reasons).
Only 19 studies used survival analyses to examine relapse rates, while most others simply counted the numbers of participants who relapsed. We, therefore, had to restrict this review to analysis of relapse rates rather than more sensitive parameters such as 'time to relapse'.
Selective reporting
We judged 63 studies to be free of selective reporting. However, many did not (sufficiently) report on predefined outcomes.
| Studies with insufficient reporting of pre‐defined outcomes |
|---|
| Aripiprazole 2003, Haloperidol 1991, Iloperidone 2016, Lurasidone 2016, Olanzapine 2003, Penfluridol 1970, Penfluridol 1974c, Quetiapine 2007, Quetiapine 2009a, Quetiapine 2009b, Various drugs 1962a, Zotepine 2000, |
Other potential sources of bias
We judged 44 studies to be free of other potential sources of bias ‐ as far as we could detect. However, for six trials this was unclear (please see table below). Fourteen studies were terminated prematurely after pre‐planned interim analyses. One study had baseline imbalances in terms of the mean number of previous hospitalisations and mean age and duration of illness (Quetiapine 2007). This trial was also terminated prematurely. For Fluphenazine depot 1992, there were imbalances of gender and baseline medication. In five studies participants who relapsed were discontinued and their code was broken, which can be a threat for blinding (Chlorpromazine 1962; Trifluoperazine 1972; Various drugs 1960; Various drugs 1968; Various drugs 1986a) as can be administration of additional antipsychotic drugs in case of deterioration (Fluphenazine depot 1968). In Various drugs 1962b, three out of 19 participants in the placebo group continued to receive active medication (also terminated prematurely).
| Unclear if free from 'other biases' |
|---|
| Fluphenazine 1982, Lurasidone 2016, Olanzapine 1999, Various drugs 1964a, Various drugs 1989, Various drugs 1986b |
| Terminated prematurely after pre‐planned interim analyses |
| Aripiprazole 2017, Aripiprazole depot 2012, Brexpiprazole 2017,Cariprazine 2016, Iloperidone 2016, Olanzapine 2003, Paliperidone 2007, Paliperidone 2014, Paliperidone depot1M 2010, Paliperidone depot3M 2015, Quetiapine 2007, Quetiapine 2009a, Quetiapine 2009b, Various drugs 2011 |
Effects of interventions
1. Comparison 1. Maintenance treatment with antipsychotic drugs versus placebo/no treatment
1.1 Relapse
Antipsychotic medication was clearly more effective than placebo in preventing relapse in studies lasting up to three months (percentage of participants relapsed drug 12% versus placebo 35%, 44 randomised controlled trials (RCTs), n = 6362, risk ratio (RR) 0.34, 95% confidence intervals (CI) 0.28 to 0.40, number needed to treat for an additional beneficial outcome (NNTB) 4, 95% CI 3 to 5, Analysis 1.1); four to six months (drug 18% versus placebo 49%, 49 RCTs, n = 7599, RR 0.36, 95% CI 0.31 to 0.42, NNTB 3, 95% CI 3 to 4, Analysis 1.1); seven to 12 months (primary outcome: drug 24% versus placebo 61%, 30 RCTs, n = 4249, RR 0.38, 95% CI 0.32 to 0.45, NNTB 3, 95% CI 2 to 3; high‐certainty evidence, Analysis 1.1); more than 12 months (drug 31% versus placebo 68%, 10 RCTs, n = 1786, RR 0.46, 95% CI 0.33 to 0.64, NNTB 3, CI 2 to 4, Analysis 1.1), and all studies combined (drug 22% versus placebo 58%, 71 RCTs, n = 8666, RR 0.35, 95% CI 0.30 to 0.40, NNTB 3, 95% CI 2 to 3, Analysis 1.2). There was considerable heterogeneity of study results up to three months (P <.0001, I2=50%), four to six months (P < 0.00001, I2 = 68%), seven to 12 months (P < 0.00001, I2 = 71%), more than 12 months (P < 0.00001, I2 = 90%); and all studies combined (P < 0.00001, I2 = 78%). However, in all studies the relapse rates were lower in the antipsychotic drug group than in the placebo group. Therefore, the heterogeneity expressed a difference in the magnitude of the superiority rather than in the direction of the effect. Subgroup analyses and meta‐regressions showed that the heterogeneity may be in part explained by study duration and differences between oral and depot medication (see sections 2.5 and 2.10 below).
The funnel plot of the primary outcome 'relapse at 12 months' was asymmetrical (see Figure 6), and this was corroborated by Egger's regression test (intercept ‐1.39, t value 2.46, degrees of freedom (df) 28, P = 0.02042, Egger 1997) and a contour‐enhanced funnel‐plot (Peters 2008, the plot can be received from the authors upon request). However, when adjusted by Duval's trim and fill method (Duval 2000) the RR did not change substantially (RR 0.45, 95% CI 0.38 to 0.54), neither did it when only large studies (defined as > 200 participants) were included (10 RCTs, n = 2950, RR 0.37, 95% CI 0.31 to 0.45, Analysis 3.5).

Funnel plot of comparison: 1 Maintenance treatment with antipsychotic drugs versus placebo/no treatment, outcome: Relapse
1.2 Leaving the study early
1.2.1 Due to any reason (acceptability of treatment)
Studies lasting up to three months (drug 9% versus placebo 29%, 11 RCTs, n = 517, RR 0.34, 95% CI 0.17 to 0.67); between four to six months (drug 22% versus placebo 44%, 18 RCTs, n = 1792, RR 0.49, 95% CI 0.37 to 0.65, NNTB 6, 95% CI 4 to 10); between seven to 12 months (drug 36% versus placebo 62%, 24 RCTs, n = 3951, RR 0.56, 95% CI 0.48 to 0.65, NNTB 4, 95% CI 3 to 5), high‐certainty evidence; and more than 12 months (drug 35% versus placebo 53%, 5 RCTs, n = 741, RR 0.64, 95% CI 0.51 to 0.82) showed a clear difference in favour of antipsychotic medication. Overall, there was a clear difference ‐ to conventional levels of statistical significance ‐ in favour of antipsychotic medication (drug 30% versus placebo 54%, 56 RCTs, n = 7001, RR 0.54, 95% CI 0.49 to 0.61, NNTB 4, 95% CI 4 to 6, Analysis 1.3). There was considerable heterogeneity within the group of studies lasting up to six months (P =.005, I2 = 54%), in studies lasting up to12 months (P < 0.00001, I2= 80%) and in all studies combined (P < 0.00001, I2 = 69%), but again this reflected heterogeneity in the degree of superiority rather than in the direction of the effect.
1.2.2 Due to adverse events (overall tolerability)
There was not a clear difference in studies lasting up to three months (drug 1% versus placebo 0%, 10 RCTs, n = 371, RR 2.84, 95% CI 0.12 to 65.34); four to six months (drug 4% versus placebo 4%, 15 RCTs, n = 1852, RR 1.20, 95% 95% CI 0.63 to 2,28); and seven to 12 months (drug 5% versus placebo 4%, 23 RCTs, n = 3870, RR 1.16, 95% CI 0.69 to 1.97), while the difference was statistically significant in studies lasting more than 12 months (drug 4% versus placebo 1%, 5 RCTs, n = 534, RR 5.70, 95% CI 1.28 to 25.33, NNTB 50, 95% CI 17 to 50). Overall, there was not a clear difference between groups (drug 5% versus placebo 3%, 53 RCTs, n = 6627, RR 1.27, 95% CI 0.85 to 1.89, Analysis 1.4). There was some heterogeneity in the group of studies lasting seven to 12 months (P = 0.009, I2 = 48%) and overall (P = 0.007, I2 = 43%). A possible explanation is that in particular, in recent trials not only tolerability‐related adverse events, but also efficacy‐related adverse events (e.g. exacerbation of psychosis) were summarised as "leaving the study due to adverse events". This may explain the clearest outlier (Olanzapine 2003), where all leaving due to adverse events were efficacy‐related. Removing this study and Ziprasidone 2002 (where details about dropout due to adverse events were not presented), results in the data becoming homogeneous. Statistically significantly more patients in the antipsychotic group left early for adverse events at 12 months (RR 1.56, 95% CI 1.04 to 2.34; heterogeneity test: P = 0.4, I² = 5%), and overall (RR 1.51, 95% CI 1.07 to 2.13; heterogeneity test: P = 0.23, I² = 15%).
1.2.3 Due to inefficacy
Studies lasting up to three months (drug 5% versus placebo 27%, 11 RCTs, n = 421, RR 0.21, 95% CI 0.07 to 0.64), four to six months (drug 14% versus placebo 36%, 16 RCTs, n = 1661, RR 0.41, 95% CI 0.31 to 0.54, NNTB 5, 95% CI 3 to 9), seven to 12 months (drug 18% versus placebo 46%, 24 RCTs, n = 3951, RR 0.37, 95% CI 0.31 to 0.44, NNTB 3, 95% CI 3 to 4), and more than 12 months (drug 11% versus placebo 25%, 4 RCTs, n = 504, RR 0.43, 95% CI 0.29 to 0.64) showed a clear difference in favour of antipsychotic medication. Overall, there was a statistically significant difference in favour of antipsychotic medication (drug 16% versus placebo 40%, 55 RCTs, n = 6537, RR 0.38, 95% CI 0.32 to 0.43, NNTB 4, 95% CI 3 to 5, Analysis 1.5). The results at three months (P = 0.05, I2 = 50%), at seven to 12 months (P < 0.0001, I2 = 64%) and pooling all studies (P < 0.0001, I2= 50%) were heterogeneous, but, with the exception of Penfluridol 1987 and Various drugs 1964b, all studies showed at least a trend in favour of antipsychotic drugs. Thus, again, we feel the heterogeneity reflected differences in the degree of superiority rather than in the direction of the effect. Re‐inspection of Penfluridol 1987 and Various drugs 1964b did not reveal clear reasons why these studies showed a slight trend in favour of placebo.
1.3 Global state
1.3.1 Number of participants improved (at least minimally)
Studies in the up to three months category (drug 46% versus placebo 6%, 3 RCTs, n 0 = 119, RR 4.76, 95% CI 1.65 to 13.68, NNTB 3, 95% CI 2 to 6), and studies in the four to six months category (drug 30% versus placebo 11%, 8 RCTs, n=1037, RR 2.33, 95% CI 1.69 to 3.21, NNTB 4, 95% CI 2 to 8) showed a clear significant difference in favour of antipsychotic medication. The impression was the same in the seven to 12 months category (drug 24% versus placebo 15%, 4 RCTs, n = 388, RR 1.67, 95% CI 0.89 to 3.13), and in studies lasting more than 12 months (drug 23% versus placebo 17%, 1 RCT, n = 334, RR 1.36, 95% CI 0.88 to 2.09), but the difference did not reach conventional levels of statistical significance. When all studies were combined drugs were again significantly superior to switching to placebo (drug 29% versus placebo 13%, 16 RCTs, n = 1878, RR 2.12, 95% CI 1.58 to 2.85, NNTB 5, CI 3 to 8, Analysis 1.6). No significant heterogeneity was found.
1.3.2 Number of participants in symptomatic remission
This outcome was added to the list of outcomes for this update. One small study in the four to six months category (drug 70% versus placebo 40%, 1 RCT, n = 40, RR 1.75, 95% CI 0.79 to 3.87, NNTB 3, 95% CI 2 to 20) and studies in the seven to 12 months category (drug 52% versus placebo 31%, 5 RCTs, n = 807, RR 1.70,95% CI 1.11 to 2.59, NNTB 5, 95% CI 3 to 14) showed a significant difference in favour of antipsychotic medication. Again, the impression was the same in one small study in the up to three months category (drug 50% versus placebo 20%, 1 RCT, n = 20, RR 2.50, 95% CI 0.63 to 10.00), but the difference was not statistically significant. When all studies were combined drugs were clearly superior to placebo (drug 53% versus placebo 31%, 7 RCTs, n = 867, RR 1.73, 95% CI 1.20 to 2.48, NNTB 5, 95% CI 3 to 10, Analysis 1.7). There were heterogeneous results at 12 months (P < 0.0001, I2 = 82%) and overall (P = 0.0007, I2 = 74%), but by removing the only study that clearly was outlying (Aripiprazole 2017) all others showed concurred on the direction of effect in favour of antipsychotic drugs, and heterogeneity expressed differences in the degree of superiority rather than in the direction of effect (all the studies combined: P = 0.16, I2 = 37%). This may be explained by the different criteria used to define symptomatic remission among the studies.
1.3.3 Number of participants in sustained remission
This outcome was added to the list of outcomes for the current update. Studies in the seven to 12 months category (drug 27% versus placebo 16%, 6 RCTs, n = 1443, RR 1.83, 95% CI 1.49 to 2.25, NNTB 7, 95% CI 5 to 12), studies in the more than 12 months category (drug 76% versus placebo 61%, 2 RCTs, n = 364, RR 1.29, 95% CI 1.13 to 1.47, NNTB 6, 95% CI 4 to 10), and all the studies combined (drug 36% versus placebo 26%, 8 RCTs, n = 1807, RR 1.67, 95% CI 1.28 to 2.19, NNTB 7, 95% CI 5 to 10, Analysis 1.8) showed a clear and statistically significant difference in favour of antipsychotic medication. The results pooling all the studies were slightly heterogeneous (P =.03, I2= 55%), but the direction of effect was the same among all the studies, reflecting at least a trend in favour of antipsychotic drugs.
1.3.4. Number of participants in recovery
No data were available for this outcome.
1.4. Service use
1.4.1 Number of participants hospitalised
Studies lasting seven to 12 months (drug 4% versus placebo 13%, 11 RCTs, n = 2119, RR 0.36, 95% CI 0.23 to 0.56, NNTB 10, 95% CI 6 to 20), and more than 12 months (drug 17% versus placebo 31%, 4 RCTs, n = 965, RR 0.55, 95% CI 0.44 to 0.69, NNTB 7, 95% CI 3 to 10) showed a statistically and clinically significant difference in favour of antipsychotic medication. There was no clear difference for studies lasting up to three months (drug 4% versus placebo 7%, 2 RCTs, n = 55, RR 0.42, 95% CI 0.04 to 4.06), but these short‐term data are only based on two small studies. Again, the difference was not statistically significant in four studies lasting four to six months (drug 3% versus placebo 11%, 4 RCTs, n = 419, RR 0.19, 95% CI 0.03 to 1.32). Overall, there was a clear difference in favour of antipsychotic medication (drug 7% versus placebo 18%, 21 RCTs, n = 3558, RR 0.43, 95% CI 0.32 to 0.57, NNTB 8, 95% CI 6 to 14,high‐certainty evidence; Analysis 1.9). There was some heterogeneity for studies lasting four to six months (P =.04, I2 = 63%), but all studies showed favoured antipsychotic drugs.
1.4.2 Number of participants discharged
Three studies in inpatients reported on the number of participants who could be discharged. There was no significant difference between groups (drug 5% versus placebo 1%, 3 RCTs, n = 404, RR 2.76, 95% CI 0.69 to 11.06, Analysis 1.10). All the three studies lasted four to six months.
1.5 Death
1.5.1 Any
In tota,l there were nine deaths in the drug group and eight deaths in the placebo group. There was no significant difference between groups in studies lasting up to three months (drug 0% versus placebo 0%, 3 RCTs, n = 415, RR not estimable), between four to six months (drug 0.9% versus placebo 0.2%, 6 RCTs, n = 1159, RR 2.30, 95% CI 0.59 to 8.98), seven to 12 months (drug 0.1% versus placebo 0.5%, 15 RCTs, n = 3273, RR 0.35, 95% CI 0.11 to 1.12), in one study lasting more than 12 months (drug 1.2% versus placebo 0%, 1 RCT, n = 334, RR 5.18, 95% CI 0.25 to 107.12), and in all studies combined (drug 0.3% versus placebo 0.3%, 25 RCTs, n = 5181, RR 0.90, 95% CI 0.39 to 2.11, Analysis 1.11).
1.5.2 Due to natural causes
Studies lasting up to three months (drug 0% versus placebo 0%, 2 RCTs, n = 379, RR not estimable), four to six months (drug 0.9% versus placebo 0.2%, 6 RCTs, n = 1159, RR 2.30, 95% CI 0.59 to 8.98), seven to 12 months (drug 0.1% versus placebo 0.1%, 16 RCTs, n = 3354, RR 0.53, 95% CI 0.11 to 2.58), in one study lasting more than 12 months (drug 0.6% versus placebo 0%, 1 RCT, n = 334, RR 3.11, 95% CI 0.13 to 75.78), and in all studies combined (drug 0.3% versus placebo 0.1%, 25 RCTs, n=5226, RR 1.35, 95% CI 0.50 to 3.6, Analysis 1.12) did not reveal a significant difference between groups.
1.6. Suicidal behaviour
1.6.1 Death due to suicide
Studies up to three months (drug 0% versus placebo 0%, 3 RCTs, n = 415, RR not estimable), four to six months (drug 0% versus placebo 0%, 3 RCTs, n = 1033, RR not estimable), seven to 12 months (drug 0% versus placebo 0.2%, 12 RCTs, n = 2852, RR 0.35, 95% CI 0.06 to 2.21), one study lasting more than 12 months (drug 0.6% versus placebo 0%, 1 RCT, n = 334, RR 3.11, 95% CI 0.13 to 75.78), and all studies combined irrespective of their duration (drug 0.04% versus placebo 0.1%, 19 RCTs, n = 4634, RR 0.60, 95% CI 0.12 to 2.97,low‐certainty evidence; Analysis 1.13) did not show clear differences.
1.6.2 Number of participants with suicide attempts
There was also no clear difference in terms of suicide attempts in two studies lasting four to six months (drug 0.3% versus placebo 0%, 3 RCTs, n = 776, RR 3.00, 95% CI 0.13 to 71.51), and seven to 12 months (drug 0.2% versus placebo 0.5%, 9 RCTs, n = 2347, RR 0.48, 95% CI 0.13 to 1.69). Also, when all studies were combined irrespective or their duration, there was no difference between groups (drug 0.2% versus placebo 0.3%, 12 RCTs, n = 3123, RR 0.61, 95% CI 0.19 to 1.99, Analysis 1.14).
1.6.3 Number of participants with suicide ideation
There was no significant difference in the number of participants with suicidal ideation in one study in the up to three months category (drug 0% versus placebo 6%, 1 RCT, n = 49, RR 0.17, 95% CI 0.01 to 3.88), in one study in the four to six months category (drug 0% versus placebo 0%, 1 RCT, n = 386, RR not estimable), in studies in the seven to 12 months category (drug 0.9% versus placebo 2%, 10 RCTs, n = 2486, RR 0.52, 95% CI 0.24 to 1.09), in one study lasting more than 12 months (drug 3% versus placebo 2.4%, 1 RCT, n = 334, RR 1.30, 95% CI 0.35 to 4.74), and in all studies combined irrespective of duration (drug 1% versus placebo 1.8%, 13 RCTs, n = 3255, RR 0.61, 95% CI 0.99 to 1.16, Analysis 1.15).
1.7 Violent/aggressive behaviour
There were data in one small study in the up to three months category (drug 0% versus placebo 8%, 1 RCT, n = 26, RR 0.33, 95% CI 0.01 to 7.50), two studies in the four to six months category (drug 4% versus placebo 9%, 2 RCTs, n = 350, RR 0.46, 95% CI 0.2 to 1.08), and one study lasting more than 12 months (drug 0% versus placebo 1%, 1 RCT, n = 334, RR 0.21, 95% CI 0.01 to 4.28). We found no clear difference in the number of participants with aggressive behaviour. However, in studies lasting seven to 12 months (drug 1% versus placebo 5%, 8 RCTs, n = 2146, RR 0.35, 95% CI 0.19 to 0.66, NNTB 50, 95% CI 20 to 100), and in all studies combined irrespective of their duration (drug 1% versus placebo 5%, 12 RCTs, n=2856, RR 0.37, 95% CI 0.24 to 0.59, Analysis 1.16) fewer participants in the drug group than in the placebo group were violent/aggressive.
1.8 Adverse effects
1.8.1 At least one adverse effect
One study in the up to three months category (drug 36% versus placebo 69%, 1 RCT, n = 49, RR 0.53, 95% CI 0.30 to 0.93, NNTB 3, 95% CI 2 to 25) showed a clear difference between groups. Four studies in the four to six months category (drug 49% versus placebo 52%, 4 RCTs, n = 1079, RR 0.98, 95% CI 0.85 to 1.12) studies lasting seven to 12 months (drug 42% versus placebo 34%, 12 RCTs, n = 2890, RR 1.15, 95% CI 0.99 to 1.33), and all studies combined irrespective of their duration (drug 44% versus placebo 38%, 18 RCTs, n = 4352, RR 1.10, 95% CI 0.98 to 1.25, Analysis 1.17) did not indicate a clear difference between groups. This was statistically significant, however, in one study lasting more than 12 months (drug 39% versus placebo 22%, 1 RCT, n = 334, RR 1.75, 95% CI 1.24 to 2.45). The results at 12 months (P = 0.004, I2 = 60%) and overall (P < 0.0001, I2 = 66%) were heterogeneous. Similarly to the outcome 'leaving the study early due to adverse events' (see Section 1.2.2 above) it should be noted that in particular in recent trials efficacy‐related events can also be adverse events that may in part explain the heterogeneity. Haloperidol 1973 even showed clearly more adverse events in the placebo group. The authors discussed this finding as withdrawal effects after abrupt stopping of medication. However, excluding this outlying study did not change the results (all studies pooled: RR 1.13, 95% CI 1.00 to 1.27; heterogeneity test: P = 0.0002, I² = 64%).
1.8.2 Movement disorders
1.8.2.1 At least one movement disorder
Studies lasting up to three months (drug 29% versus placebo 10%, 4 RCTs, n = 158, RR 2.42, 95% CI 0.70 to 8.33) did not reveal any difference between groups. However, studies lasting four to six months (drug 18% versus placebo 11%, 8 RCTs, n = 1658, RR 1.45, 95% CI 1.06 to 1.99), seven to 12 months (drug 12% versus placebo 6%, 16 RCTs, n = 3126, RR 1.55, 95% CI 1.17 to 2.05), and all studies combined irrespective of their duration (drug 14% versus placebo 8%, 29 RCTs, n =5276, RR 1.52, 95% CI 1.25 to 1.85, number needed to treat for an additional harmful outcome (NNTH) 20, 95% CI 14 to 50, Analysis 1.18) showed a clear and statistically significant difference in favour of placebo. In one study lasting more than 12 months the difference between groups did not reach conventio nal levels of statistical significance (drug 9% versus placebo 7%, 1 RCT, n = 334, RR 1.21, 95% CI 0.58 to 2.54).
1.8.2.2 Akathisia
Studies in the up to three‐month category (drug 14% versus placebo 4%, 2 RCTs, n = 69, RR 2.68, 95% CI 0.49 to 14.82), in the four to six months category (drug 9% versus placebo 2%, 6 RCTs, n = 1191, RR 2.14, 95% CI 0.50 to 9.11), in the seven to 12 months category (drug 5% versus placebo 3%, 12 RCTs, n = 2620, RR 1.07, 95% CI 0.71 to 1.61), one study in the more than 12 months category (drug 3% versus placebo 2%, 1 RCT, n = 334, RR 1.73, 95% CI 0.42 to 7.11), and all studies combined irrespective of their duration (drug 6% versus placebo 3%, 21 RCTs, n = 4214, RR 1.49, 95% CI 0.93 to 2.38, Analysis 1.19) did not show clear differences. Results at six months (P = 0.009, I2 = 67%) were heterogeneous due to one outlying trial (Various drugs 1975) in which more participants in the placebo group had akathisia. Re‐inspection of this study did not reveal an obvious explanation. Removing this study reduced heterogeneity and then statistically significantly more participants in the drug group suffered from this adverse effect (RR 4.07, 95% CI 1.46 to 11.33; heterogeneity test: P = 0.24, I2 = 27%).
1.8.2.3 Akinesia
There was no clear difference in the one small study in the up to three months category (drug 6% versus placebo 6%, 1 RCT, n = 49, RR 0.97, 95% CI 0.09 to 9.92), nor in two studies lasting between seven and 12 months (drug 0% versus placebo 0,01%, 2 RCTs, n = 348, RR 0.16, 95% CI 0.01 to 3.98), nor in all the three studies combined (drug 1% versus placebo 1%, 3 RCTs, n = 397, RR 0.52, 95% CI 0.08 to 3.42, Analysis 1.20).
1.8.2.4 Dyskinesia
Three studies in the four to six months category (drug 2% versus placebo 13%, 3 RCTs, n = 418, RR 0.31, 95% CI 0.11 to 0.84), and all studies combined (drug 1% versus placebo 4%, 18 RCTs, n = 3200, RR 0.55, 95% CI 0.33 to 0.91, Analysis 1.21) showed a clear difference in favour of antipsychotic medication. There was no difference in one study in the up to three months category (drug 3% versus placebo 0%, 1 RCT, n = 49, RR 1.50, 95% CI 0.06 to 34.91), in studies in the seven to 12 months category (drug 2% versus placebo 2%, 13 RCTs, n = 2399, RR 0.69, 95% CI 0.37 to 1.27), and in one study lasting more than 12 months (drug 1% versus placebo 2%, 1 RCT, n = 334, RR 0.35, 95% CI 0.04 to 3.29).
1.8.2.5 Dystonia
For dystonia there was no clear difference in the one study in the up to three months category (drug 6% versus placebo 0%, 1 RCT, n = 49, RR 2.50, 95% CI 0.13 to 49.22), two studies in the four to six months category (drug 16% versus placebo 9%, 2 RCTs, n = 382, RR 1.75, 95% CI 0.94 to 3.29), studies in the seven to 12 months category (drug 1% versus placebo 1%, 9 RCTs, n = 2002, RR 1.63, 95% CI 0.65 to 4.09), and one study in the more than 12 months category (drug 0% versus placebo 1%, 1 RCT, n = 334, RR 0.21, 95% CI 0.01 to 4.28). When all studies were pooled irrespective of their duration, there was a suggestion of superiority of placebo but this did not quite reach conventional levels of statistical significance (drug 4% versus placebo 2%, 13 RCTs, n = 2767, RR 1.63, 95% CI 0.99 to 2.7, Analysis 1.22).
1.8.2.6 Rigor
There was never any clear difference between groups in terms of rigor. Two studies in the up to three months category (drug 19% versus placebo 15%, 2 RCTs, n = 69, RR 1.2, 95% CI 0.22 to 6.62), three studies in the four to six months category (drug 17% versus placebo 8%, 3 RCTs, n = 160, RR 1.98, 95% CI 0.67 to 5.85), four studies in the seven to 12 months category (drug 1% versus placebo 0%, 4 RCTs, n = 693, RR 1.80, 95% CI 0.29‐2.79), and all studies combined (drug 6% versus placebo 2%, 9 RCTs, n = 922, RR 1.39, 95% CI 0.70 to 2.79, Analysis 1.23) did not suggest a clear difference between groups.
1.8.2.7 Tremor
Two studies in the up to three months category (drug 23% versus placebo 15%, 2 RCTs, n=69, RR 1.20, 95% CI 0.46 to 3.16), three studies in the four to six months category (drug 8% versus placebo 10%, 3 RCTs, n = 160, RR 0.92, 95% CI 0.33 to 2.61), one study in the more than 12 months category (drug 1% versus placebo 2%, 1 RCT, n = 334, RR 0.52, 95% CI 0.10 to 2.79), and all studies combined (drug 5% versus placebo 3%, 18 RCTs, n = 3353, RR 1.37, 95% CI 0.95 to 1.98, Analysis 1.24) did not reveal clear differences in terms of tremor. Only the 12 studies in the seven to 12 months category showed a clear superiority for placebo (drug 5% versus placebo 2%, 12 RCTs, n = 2790, RR 1.62, 95% CI 1.04 to 2.54).
1.8.2.8 Use of antiparkinson medication
No clear differences were found in the four to six months category (drug 22% versus placebo 13%, 3 RCTs, n = 841, RR 1.53, 95% CI 0.90 to 2.61) and in one study in the more than 12 months category (drug 19% versus placebo 19%, 1 RCT, n = 334, RR 1.00, 95% CI 0.64 to 1.57). In the seven to 12 months category (drug 23% versus placebo 17%, 9 RCTs, n = 1733, RR 1.37, 95% CI 1.06 to 1.78, NNTH 11, 95% CI 7 to 33) and overall, there was a clear difference in favour of placebo (drug 22% versus placebo 16%, 13 RCTs, n = 2908, RR 1.35, 95% CI 1.10 to 1.65, NNTH 13, 95% CI 8 to 33, Analysis 1.25).
1.8.3 Sedation
One small study in the up to three months category (drug 0% versus placebo 20%, 1 RCT, n = 20, RR 0.20, 95% CI 0.01 to 3.70), showed no clear difference. This also applied to studies lasting between four to six months (drug 6% versus placebo 3%, 7 RCTs, n = 1880, RR 1.37, 95% CI 0.89 to 2.12), and one study lasting more than 12 months (drug 1% versus placebo 1%, 1 RCT, n = 334, RR 1.04, 95% CI 0.15 to 7.27). Studies lasting between seven and 12 months (drug 11% versus placebo 7%, 9 RCTs, n = 1844, RR 1.78, 95% CI 1.25 to 2.53), and all studies combined (drug 8% versus placebo 5%, 18 RCTs, n = 4078, RR 1.52, 95% CI 1.24 to 1.86, NNTH 50, 95% CI not significant, Analysis 1.26) showed a clear difference in favour of placebo.
1.8.4 Weight gain
Four studies in the four to six months category showed no clear difference (drug 5% versus placebo 3%, 4 RCTs, n = 1039, RR 1.49, 95% CI 0.81 to 2.73). However, studies lasting seven to 12 months (drug 10% versus placebo 7%, 14 RCTs, n = 3394, RR 1.80, 95% CI 1.17 to 2.77, NNTH 25, 5% CI 17 to 50), one study lasting more than 12 months (drug 13% versus placebo 6%, 1 RCT, n = 334, RR 2.18, 95% CI 1.06 to 4.48), and all studies combined (drug 9% versus placebo 6%, 19 RCTs, n = 4767, RR 1.69, 95% CI 1.21 to 2.35, NNTH 25, 95% CI 20 to 50, Analysis 1.27) did suggest a clear difference in favour of placebo. There was some heterogeneity in the 12 months results (P=0.006, I2=56%) and pooling all the studies (P=0.02, I2=45%). Removing the clearest outliers (Cariprazine 2016, Lurasidone 2016, Iloperidone 2016), which showed greater weight gain in the placebo group, reduced heterogeneity, but only to some degree and, overall, antipsychotic drugs did seem to cause more weight gain (all studies combined: RR 2.01, 95% CI 1.43 to 2.81, heterogeneity test: P = 0.12, I2 = 30%) The heterogeneity expressed differences more in the degree of weight gain rather than in the direction of effect. This may be partially explained by the use of different criteria to define and report weight gain among the original studies.
1.9 Satisfaction with care (any published rating scale)
1.9.1 Number of participants satisfied
No data on this outcome were available in the original review. In this update, drug was clearly superior to placebo in one study in the seven to 12 months category (drug 74% versus placebo 63%, 1 RCT, n = 403, RR 1.19, 95% CI 1.02 to 1.38), and in one study lasting more than 12 months (drug 84% versus placebo 69%, 1 RCT, n = 334, RR 1.22, 95% CI 1.08 to 1.38). When the two studies were combined, the difference remained statistically (drug 78% versus placebo 66%, 2 RCTs, n = 737, RR 1.21, 95% CI 1.10 to 1.33; Analysis 1.28). No heterogeneity was identified (P=0.75, I2 = 0%).
1.9.2 Number of carers satisfied
No data were available for this outcome.
1.10 Quality of life (any published rating scale)
Studies were divided in subgroups according to time points and rating scales used; endpoint and change data were presented in separate subgroups. Seven studies provided data on this outcome (two studies lasting up to 3 months, four studies in the seven to 12 months category and one study lasting more than 12 months). Across different subgroups, the superiority of drugs was not always clear, with effect sizes ranging from minimum mean difference (MD) ‐2.00 (2 RCTs, 379 participants, 95% CI ‐5.80 to 1.80) to maximum MD ‐ 11.36 (1 RCT, 304 participants, 95% CI ‐14.67 to ‐8.05) (Analysis 1.29). As an additional analysis, all the studies (across different time points and scales) were combined and a standardised mean difference (SMD) was calculated: antipsychotic drugs were found clearly and statistically significantly superior to placebo (7 RCTs, n = 1573, SMD ‐0.32 95% CI ‐0.57 to ‐0.07, Analysis 1.30). Tentative back‐calculation to the Schizophrenia Quality of Life Scale (used in Paliperidone 2007 and Paliperidone depot1M 2010) yielded a MD of 4.4 points. When pooling all the studies, there was significant heterogeneity (P =.01, I2 = 64%), which may be in part due to the use of different scales (see Discussion, 2.9 below), but the direction of effect was the same in all studies.
1.11 Number of participants in employment
There was no clear difference in terms of number of people employed in two studies in the seven to 12 months category (drug 48% versus placebo 50%, 2 RCTs, n = 259, RR 0.96, 95% CI 0.75 to 1.23), nor in the one study lasting more than 12 months (drug 31% versus placebo 22%, 1 RCT, n = 334, RR 1.39, 95% CI 0.97 to 2.00), nor in all the studies combined (drug 39% versus placebo 34%, 3 RCTs, n = 593, RR 1.08, 95% CI 0.82 to 1.41, Analysis 1.31).
1.12 Social functioning (any published rating scale)
This outcome was added to the list of outcomes for the present update. Studies were divided in subgroups according to time points and rating scales used. Endpoint and change data were presented separately in subgroups. Antipsychotic medication was clearly rated as superior to placebo in terms of participants´ social functioning in studies in the up to three months category (3 RCTs, n = 499, MD ‐4.32, 95% CI ‐6.69 to ‐1.94), in the four to six months category (1 RCT, n = 270, MD ‐2.00, 95% CI ‐3.60 to ‐0.40), in studies lasting seven to 12 months (10 RCTs, n = 2490, MD ‐4.89 95% CI ‐6.00 to ‐3.79), and in the one study lasting more than 12 months (1 RCT, n = 334, MD ‐3.60 CI ‐6.76 to ‐0.44) (Analysis 1.32). As an additional analysis, all studies were combined irrespective of their duration and the scale used, and a standardised mean difference calculated. This analysis also showed superiority of active drugs to placebo (15 RCTs, n=3588, SMD ‐0.43 CI ‐0.53 to ‐0.34,moderate‐certainty evidence; Analysis 1.33). Tentative back‐calculation to the Personal and Social Performance schedule (used in 10 out of 15 studies) yielded an MD of 5.2 points. There was heterogeneity when pooling all the studies (P=.03, I2 = 45%) which may be partially explained by the use of different scales (see Discussion 2.11 below), but all the studies showed a result tending to favour antipsychotic drugs.
2. Subgroup analyses (relapse at 12 months)
All subgroup analyses were conducted only on the primary outcome 'relapse at sevevn to 12 months'.
2.1 Participants with a first episode of psychosis
There was no clear difference between studies that included only people with a first episode (drug 26% versus placebo 61%, 8 RCTs, n = 528, RR 0.47, 95% CI 0.38 to 0.58) and studies in people who had already experienced several episodes (drug 23% versus placebo 59%, 24 RCTs, n = 3585, RR 0.38, 95% CI 0.31 to 0.46); (test for subgroup differences: Chi2 =2.12, df = 1 (P = 0.15), I2 = 52.8%, Analysis 2.1).
2.2 Participants in remission at baseline
There was also no difference between the results of studies that included only participants who were in remission at baseline (drug 27% versus placebo 52%, 10 RCTs, n = 1050, RR 0.44, 95% CI 0.33 to 0.60) and the rest of the studies (drug 22% versus placebo 62%, 19 RCTs, n = 3063, RR 0.36, 95% CI 0.30 to 0.44); (test for subgroup differences: Chi2 = 1.25, df =1 (P = 0.26), I2 = 20%, Analysis 2.2).
2.3 Participants who had been stable for various periods before entering the trials
Five studies included only participants who were stable for at least one month. Antipsychotic drugs significantly reduced relapse rates compared to placebo (drug 22% versus placebo 65%, 6 RCTs, n = 574, RR 0.32, 95% CI 0.20 to 0.50). The same pattern was found for studies with participants stable at least three months (drug 1% versus placebo 54%, 10 RCTS, n = 2250, RR 0.34, 95% CI 0.26 to 0.43), stable at least 12 months (drug 21% versus placebo 60%, 5 RCTs, n = 326, RR 0.31, 95% CI 0.17 to 0.57), and at least three to six years (drug 22% versus placebo 63%, 2 RCTs, n = 54, RR 0.38, 95% CI 0.18 to 0.78). One small study included participants who were stable for at least six months and the difference between drug and placebo was not statistically significant (drug 10% versus placebo 30%, 1 RCT, n = 20, RR 0.33, 95% CI 0.04 to 2.69). Overall, there was no clear difference between the different durations of pre‐trial stability (test for subgroup differences: Chi² = 0.21, df = 4 (P =1.00), I² = 0%, Analysis 2.3).
2.4 Abrupt withdrawal versus tapering
There was no clear difference between studies in which antipsychotics were abruptly withdrawn (drug 27% versus placebo 62%, 18 RCTs, n = 2348, RR 0.43, 95% CI 0.35 to 0.53) or slowly tapered (drug 18% versus placebo 56%, 11 RCTs, n = 1765, RR 0.33, 95% CI 0.24 to 0.44); (test for subgroup differences: Chi2 = 2.37, df = 1 (P = 0.12), I2 = 57.8%, Analysis 2.4).
2.5 to 2.6 Single antipsychotic drugs and depot versus oral medication
The test for subgroups differences between single antipsychotics was not statistically significant( Chi2 =15.08, df =9 (P = 0.09), I² = 40.3%, Analysis 2.5). When the subgroup of studies using depot antipsychotics (drug 17% versus placebo 55%, 10 RCTs, n = 1705, RR 0.30, 95% CI 0.23 to 0.39) was compared with the subgroup of studies using oral antipsychotics (drug 29% versus placebo 63%, 16 RCTs, n = 2187, RR 0.46, 95% CI 0.38 to 0.55) a clear, statistically significant superiority of the depot formulations emerged (test for subgroup differences: Chi2 =6.87, df =1 (P =0.009), I2 =85.4%, Analysis 2.6).
2.7 First‐ versus second‐generation antipsychotic drugs
There was no clear difference in reduction of relapse risk between first‐generation antipsychotics (drug 24% versus placebo 62%, 18 RCTs, n=1430, RR 0.35, 95% CI 0.25 to 0.48) and second‐generation antipsychotics (drug 23% versus placebo 58%, 11 RCTs, n = 2683, RR 0.39, 95% CI 0.32 to 0.48)(test for subgroup differences: Chi2 = 0.36, df = 1 (P = 0.55), I2 = 0%, Analysis 2.7).
2.8 Appropriate versus unclear allocation concealment
The degree of relapse reduction by antipsychotics was not different in studies that used appropriate allocation concealment (drug 22% versus placebo 59%, 13 RCTs, n = 2708, RR 0.37, 95% CI 0.30 to 0.45) and studies in which this was unclear (drug 25% versus placebo 61%, 16 RCTs, n = 1405, RR 0.41, 95% CI 0.30 to 0.54); (test for subgroup differences: Chi2 = 0.29, df = 1 (P = 0.59), I2 = 0%, Analysis 2.8).
2.9 Blinded versus open trials
The relapse risk reduction by antipsychotics was slightly larger in two open trials (drug 17% versus placebo 65%, 2 RCTs, n = 257, RR 0.26, 95% CI 0.17 to 0.39) than in the double‐blind studies (drug 24% versus placebo 59%, 27 RCTs, n = 3856, RR 0.40, 95% CI 0.33 to 0.48); (test for subgroup differences: Chi2 = 3.57, df = 1 (P = 0.06), I2 = 72%, Analysis 2.9).
2.10 Meta‐regressions
All meta‐regressions were conducted only on the primary outcome 'relapse at seven to 12 months', except for the meta‐regression on study duration, which was performed on all the studies reporting data on relapse (using the longest time point available).
2.10.1 Severity of illness at baseline (relapse at 12 months)
The studies used many different scales (e.g. Clinical Global Impression scale (CGI), Brief Psychiatric Rating Scale (BPRS), Positive and Negative Syndrome Scale (PANSS)) to assess participants' severity at baseline. Therefore, a meta‐regression based on a scale‐defined severity of the illness was impossible. The subgroup analysis comparing participants in remission at baseline with the rest of the studies did not yield a significant difference (see Section 2.2 above).
2.10.2 Duration the participants were stable before the start of the study (relapse at 12 months)
There was no clear effect on the difference in relapse risk at seven to 12 months based on the duration the participants had been stable before they entered the studies (slope 0.0002, CI ‐0.0029 to 0.0033, P = 0.904, see Figure 7).

Meta‐regression on duration of clinical stability before study start (relapse at 12 months)
The size of the bubbles is proportional to the inverse variance of the treatment effect.
2.10.3 Duration of taper in the placebo group (relapse at 12 months)
There was also no clear effect on the difference in relapse risk at seven to 12 months based on how rapidly the medication was withdrawn from the placebo group (slope ‐0.0005, CI ‐0.0120 to 0.0110, P =0.934, see Figure 8).

Meta‐regression on duration of taper in the placebo group (relapse at 12 months)
The size of the bubbles is proportional to the inverse variance of treatment effect.
2.10.4 Mean dose in chlorpromazine equivalents (relapse at 12 months)
When the mean dose in chlorpromazine equivalents used in the antipsychotic drug groups was taken into the meta‐regression, yet again there was no clear statistically significant effect on the difference in relapse risk at seven to 12 months (slope 0.0002, CI ‐0.0007 to 0.0011, P = 0.703, see Figure 9).
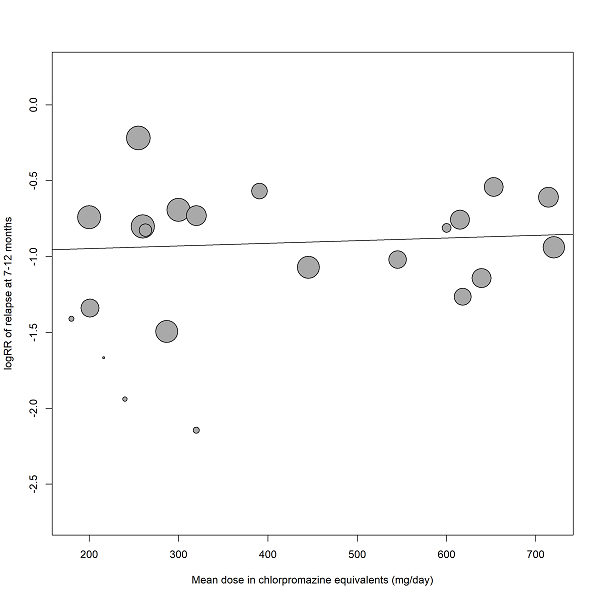
Meta‐regression on mean dose in chlorpromazine equivalents (relapse at 12 months)
The size of the bubbles is proportional to the inverse variance of treatment effect.
2.10.5 Study duration (relapse, all studies included)
There was, however, a clear statistically significant association in study duration with the difference relapse risk between antipsychotic drugs and placebo. The superiority of antipsychotic drugs was smaller in longer trials than in shorter studies (slope =0.0065 95% CI 0.0026 to 0.0104, P =0.001, see Figure 10).

Meta‐regression on study duration (relapse, all studies included).
The size of the bubbles is proportional to the inverse variance of treatment effect.
3. Sensitivity analyses (relapse at 12 months)
All sensitivity analyses were conducted only for the primary outcome 'relapse at seven to 12 months'.
3.1 Exclusion of studies for which randomisation was implied because they were double‐blind
There was one study (Various drugs 1989) for the primary outcome relapse seven to 12 months that was not explicitly described as randomised, although randomisation was likely because it was double blind. Excluding this study did not change the overall results (drug 23% versus placebo 59%, 28 RCTs, n=4098, RR 0.39, 95% CI 0.33 to 0.46, NNTB 3, 95% CI 2 to 3, Analysis 3.1).
3.2 Exclusion of randomised, open studies
There were two randomised, open studies (Various drugs 1993; Various drugs 2011). Excluding these studies did not change the overall results (drug 24% versus placebo 59%, 27 RCTs, n = 3856, RR 0.40, 95% CI 0.33 to 0.48, NNTB 3, 95% CI 2 to 3, Analysis 3.2).
3.3 Fixed‐effect model
When a fixed‐effect model was applied, antipsychotic medication remained significantly more effective than placebo in preventing relapse (drug 23% versus placebo 59%, 29 RCTs, n = 4113, RR 0.38, 95% CI 0.35 to 0.41, NNTB 3, 95% CI 3 to 3, Analysis 3.3).
3.4 Original authors' assumptions on attrition
There was no important difference if the original data of the authors' rather than our assumption on participants who had discontinued the studies was applied (drug 23% versus placebo 59%, 29 RCTs, n = 4113, RR 0.39, 95% CI 0.32 to 0.46, NNTB 3, 95% CI 2 to 3, Analysis 3.4).
3.5 Inclusion of large studies only (>200 participants)
Including only large studies did not markedly change the effect size (see publication bias above, Analysis 3.5).
3.6 Exclusion of studies that used clinical criteria to diagnose the participants
Excluding studies that did not use standardised diagnostic criteria did not change the overall results (drug 25% versus placebo 60%, 22 RCTs, n = 4054, RR 0.41, 95% CI 0.34 to 0.48, NNTB 3, 95% CI 2 to 3, Analysis 3.6).
3.7 to 3.9 Inclusion of only those participants who had been in the trials without a relapse for three, six and nine months
Even when only participants who had not relapsed for three (drug 13% versus placebo 43%, 29 RCTs, n = 4622, RR 0.32, 95% CI 0.24 to 0.42, NNTB 5, 95% CI 3 to 10, Analysis 3.7), six (drug 11% versus placebo 39%, 20 RCTs, n = 2549, RR 0.30, 95% CI 0.20 to 0.45, NNTB 3, 95% CI 2 to 3, Analysis 3.8), or nine months (drug 9% versus placebo 32%; 15 RCTs, n = 1806, RR 0.32, 95% CI 0.19 to 0.52, NNTB 3, 95% CI 2 to 3, Analysis 3.9), after study start were included in the analysis, antipsychotic drugs were still clearly more effective than placebo. In the review update, data concerning this analysis were extracted from the start, due to a systematic error in the imputation of non‐relapsed patients in the original review, but the original findings were comparable to the current ones (Leucht 2012a, Leucht 2012b).
3.10 Exclusion of studies with unclear randomisation methods
Excluding studies with unclear randomisation methods did not markedly change the overall results (drug 22% versus placebo 59%, 11 RCTs, n = 2644, RR 0.36, 95% CI 0.29 to 0.43, Analysis 3.10).
3.11 Exclusion of studies with unclear allocation concealment methods
Excluding studies with unclear allocation concealment methods did not markedly change the overall results (drug 22% versus placebo 59%, 13 RCTs, n = 2708, RR 0.37, 95% CI 0.30 to 0.45, Analysis 3.11).
'Summary of findings' table
The results of seven a priori chosen outcomes ‐ relapse (seven to 12 months), leaving the study early due to any reason, service use (number of patients hospitalised), death due to suicide, quality of life, number of patients in employment and social functioning ‐ were considered more closely in a 'Summary of findings' table (see summary of findings Table 1). Based on this tool, we considered the results for the outcomes relapse, leaving the studies early due to any reason and rehospitalisation to be high, for social functioning to be moderate, for suicide to be poor, and for quality of life and employment to be very poor. This is consistent with the judgements emerging from the original review data. The judgements derived from this instrument were used for the discussion section of the review (see Summary of main results).
Discussion
Summary of main results
1. General
This review currently includes 75 studies involving 9145 participants that compared antipsychotic maintenance treatment with placebo. The included studies were published over a long period (from 1959 to 2017) and in different settings (e.g. inpatients and outpatients) and different countries. Despite this variety, the results consistently demonstrated a superiority of antipsychotic drugs in the primary outcome relapse at seven to 12 months. This superiority remained robust in a number of sensitivity analyses. However, many included studies were relatively small; 47 randomised fewer than 100 people and 34 fewer than 50 people. Many trials were of short duration, only four studies lasted two years and only one study had a duration of three years. Thus, nothing is known from trials about the effects of antipsychotic drugs compared with placebo after three years. Furthermore, while almost all studies reported on relapse and leaving the study early, all other outcomes were much more sparsely recorded (e.g. adverse effects, quality of life, employment status, subjective outcomes such as participants' satisfaction with care). As it is unfortunately typical for randomised trials in schizophrenia, the methods of randomisation, allocation concealment and blinding were frequently not reported. However, as those studies that reported appropriate allocation methods yielded similar results, this potential source of bias should not challenge the overall findings.
All the results emerging from the review update are in line with those of the original review (Leucht 2012a, Leucht 2012b). For the current review update, some additional outcomes were investigated: antipsychotic drugs were found to be significantly superior to placebo in terms of promoting clinical remission status and better social functioning. No data were available on the efficacy of these drugs in terms of promoting recovery.
2. Treatment effects
2.1 Relapse
The results demonstrate that antipsychotic drugs reduce relapse rates more effectively than placebo. This effect was apparent as early as three months after discontinuation of antipsychotic drugs and remained significant in studies between 13 and 36 months. However, studies lasting longer than 12 months were scarce. This is even more important since the meta‐regression on study duration showed that the difference in patients with a relapse between drug and placebo gets smaller over time (Figure 7). There were frequent instances of significant heterogeneity, which may be due to differences in drugs, participants (e.g. degree of severity at baseline), or definitions of relapse. Nevertheless, almost all individual studies favoured antipsychotic drugs and therefore the heterogeneity reflected differences in the degree of superiority rather than differences in the direction of the effect. We continued to feel justified that this finding has a high degree of certainty.
2.2 Leaving the study early
Clearly fewer in the drug group than in the placebo group left the studies early because of 'any reason' or due to inefficacy of treatment. Leaving a study because of 'any reason' is often considered to be a measure of acceptability of treatment. We would be hesitant to apply this interpretation here because relapses were the most frequent reason for leaving the studies early and in many studies it was predefined by the protocol that participants had to discontinue once they had relapsed. Therefore, it was not really the participants' choice ('acceptability') to remain in a trial or not, and leaving the study early reflected efficacy rather than tolerability.
That more in the placebo group left the studies early due to 'inefficacy of treatment' supports the relapse‐preventing effect of antipsychotics.
There was no difference in the number of participants leaving the studies early 'due to adverse events'. It should be noted that events such as 'worsening of psychosis' are, by definition, also recorded as adverse events ‐ especially in more recent trials. In part, this may explain the significant heterogeneity of results. Moreover, this mix of tolerability‐ and efficacy‐related adverse events shows that 'leaving the studies early due to adverse events' is not an ideal measure of overall tolerability.
2.3 Global state
In the current update, the effect of antipsychotic drugs on the participants' clinical picture, when compared to placebo, was addressed in various ways.
When investigating the number of participants at least minimally improved at follow‐up (Clinical Global Impression ‐ Improvement score, or similar rating instruments), the results showed that antipsychotic drugs improved participants' global state more than placebo. But these findings also show that many participants were 'stable', but not in remission at study start. If they had all been in remission, further improvements would not have been possible. This demonstrates the importance of our subgroup analysis on people in remission at baseline.
The number of participants in symptomatic remission was addressed as an outcome for this update, along with the number of participants in sustained remission and in recovery. Symptomatic remission was defined following available criteria (e.g. Andreasen 2005 without time criterion) or considering being "at least mildly ill" (Clinical Global Impression ‐ Severity score or similar rating instruments) as a threshold. It could represent a cross‐sectional vision of the patients' severity of illness at various time points. Our results showed that antipsychotic drugs were significantly superior to placebo, even though only seven studies provided data on this outcome. All single studies showed at least a trend in favour of antipsychotic drugs, so that heterogeneity reflected differences in the degree of superiority rather than in the direction of the effect. Heterogeneity could also be explained by differences in the degree of severity at baseline, so that an unclear proportion of patients either achieved or maintained the remission level across the studies.
Eight studies lasting more than six months showed a significant superiority of antipsychotic drugs for sustained remission, which was defined as stabilised remission status for at least six months. Only a slight heterogeneity was found when pooling all the study results. Both symptomatic and sustained remission are important outcomes for schizophrenia patients, with the latter one being more linked to the possibility to fulfil a role in society and to achieve functional remission, but not representing it.
Among the included studies, no data were actually found on recovery, which can be multidimensionally conceptualised as comprising both objective (symptom severity and level of functioning) and subjective elements, such as quality of life and satisfaction with care (Vita 2018). We suggest that future long‐term studies should report at least sustained remission, or report data on both remission definitions separately: two studies included in the present review reported them separately (Aripiprazole 2017; Quetiapine 2007). Functional outcome is also a priority target for therapeutic interventions in schizophrenia; future trials should therefore focus on clinical remission, as well as social functioning and recovery data.
2.4 Service use
Fewer participants in the drug group had to be re‐hospitalised when compared with those allocated to placebo. Again, there was moderate heterogeneity, but all individual studies favoured to some degree the antipsychotic drugs. This finding is important, because in many industrialised countries hospitalisation contributes considerably to the direct cost of schizophrenia. Only 17 studies provided data on this outcome. Although it should be noted that only 34 trials were conducted in outpatients (in inpatients rehospitalisation cannot be an outcome), and although it depends on the setting how easily patients are admitted, this relatively hard and easy‐to‐measure outcome should be recorded in all future trials.
Many older trials were conducted in inpatient settings. Under these circumstances it was of interest to analyse whether the participants could be stabilised to such an extent that they could be discharged at the end of the trial. There was no clear difference between drug and placebo; however, only three trials contributed to this outcome and results are inconclusive.
2.5 Death and suicidal behaviour
There was no clear difference in the number of participants dying for any reason, natural causes or suicide. There was also no difference in the number of suicide attempts and suicidal ideation; however, in most studies the outcome death was not clearly reported. This is problematic, because there is some epidemiological evidence that long‐term treatment with antipsychotic drugs may increase mortality (Ray 2009; Weinmann 2009). Conversely, it is hoped that maintenance treatment with antipsychotic drugs might reduce suicides and another epidemiological study showed that treatment with antipsychotic drugs was associated with reduced mortality (Tiihonen 2009). We feel that future long‐term studies should consistently report this hard and important outcome.
2.6 Violent/aggressive behaviour
Fewer participants in the antipsychotic drug group had aggressive episodes. Although this finding is based on only 12 trials, it is an argument in favour of the use of antipsychotic drugs for maintenance treatment. Although the overall incidence is low, violence seems to be more frequent among people with schizophrenia compared to the general population contributing to the stigma of the disorder (Walsh 2002).
2.7 Adverse effects
Adverse effects were often poorly and incompletely reported. Nevertheless, antipsychotic drugs produced more movement disorders in terms of at least one movement disorder, akathisia (after removing an outlier) and use of antiparkinson medication. They also produced more sedation and weight gain. We highlight that we combined all antipsychotic drugs in the analysis, but antipsychotic drugs differ largely in their risk for these adverse events. For example, high‐potency conventional antipsychotic drugs, such as haloperidol, produce many movement disorders while many newer, so‐called second‐generation antipsychotic drugs, such as olanzapine, are associated with significant weight gain (Leucht 2009). Therefore, our tolerability findings are not generalisable to all compounds. Dyskinesia was the only outcome that occurred more frequently in the placebo group. At first glance this finding is peculiar. We speculate that these dyskinesias frequently were withdrawal dyskinesia after abrupt stopping of antipsychotic drugs rather than tardive dyskinesia. However, it was usually not clearly reported when this adverse event occurred. This is another example for a need of better side‐effect reporting in randomised schizophrenia trials (Papanikolaou 2004; Pope 2010).
2.8 Satisfaction with care
No data on either participant's or carer's satisfaction with care were available in the original review. However, in this update, two studies provided data on participant's satisfaction with care. Results were inconclusive due to the small number of participants included in the analysis; however, a significant superiority of drug to placebo was shown. We suggest that future trials should focus on this important outcome, in order to have the possibility to build reliable conclusions on this point.
2.9 Quality of life
Seven studies reported this outcome, which was evaluated using different rating instruments: two studies (Paliperidone 2007, Paliperidone depot1M 2010) used the Self‐report Quality of Life Scale (SQLS), two studies (Quetiapine 2009a, Quetiapine 2009b) used the Schizophrenia Quality of Life (S‐QoL); considering the other three studies, each one applied one different rating scale: Olanzapine 2003 used the Heinrichs Carpenter Quality of Life Scale (QLS), Lurasidone 2016 applied the EuroQOL Visual Analog Scale (EQ5D‐VAS) and Various drugs 1981b used the Symptom Questionnaire of Kellner and Sheffield. Four studies showed better quality of life in the antipsychotic drug groups and three studies showed no significant difference; when all the studies were combined, the superiority of active medication was statistically significant. Due to the small number of trials this finding is not robust and more evidence is needed. Furthermore, the seven trials applied different rating scales, providing heterogeneous conclusions in terms of statistical significance. However, the direction of effect was always consistent across the trials, tending to favour antipsychotic drugs. The relevance of the actual finding is, however, high, because we had assumed that due to their side effects antipsychotic drugs could worsen quality of life. If confirmed by further trials, improved quality of life would be another strong argument for maintenance treatment with antipsychotic drugs. As a limitation, it needs to be considered that patients with a relapse were typically included in this outcome. For evaluating the quality of life of patients while taking maintenance treatment (and experiencing side effects), the quality‐of‐life‐ratings before recurrence of psychotic symptoms would be of additional interest. However, these data were not typically 'not available'. A targeted update review performed by another team in 2016 (New Reference), found that maintenance treatment may make little or no difference to quality of life (standardised mean difference (SMD) ‐0.42 95% confidence interval (CI) ‐0.96 to 0.13, 4 RCTs, 804 participants). In that review, four studies (all included in the present review) were included (Lurasidone 2016, Olanzapine 2003, Paliperidone 2007 and Various drugs 1981b). Quality of life was measured using four different rating scales in the four studies and back‐estimated to SQLS. When inspecting the studies mentioned above, it was noted that in the targeted update the Lurasidone 2016 results were entered in the wrong direction of effect, with higher scores indicating improvement (the opposite as in the other studies). The analysis based on the four studies was performed again using the statistical method applied by the targeted update team, considering this mistake (SMD ‐0.46 95% CI ‐0.93 to 0.00, P = 0.05).
2.10 Number of participants in employment
Only three studies addressed this outcome and did not find a significant difference. This finding is inconclusive and highlights the limitations of the current evidence. It is clear that antipsychotic drugs suppress symptoms of schizophrenia, but whether this also leads to better functional outcomes is unclear. A review suggested that 80% to 90% of people with schizophrenia are not employed (Marvaha 2004). In this review update we therefore investigated the effects of antipsychotic drugs on social functioning (see next paragraph).
2.11 Social functioning
Fifteen studies reported this outcome. The studies applied different rating scales: 10 studies used Performance and Social Participation schedule (Aripiprazole depot 2012, Brexpiprazole 2017, Cariprazine 2016, Paliperidone 2007, Paliperidone 2014, Paliperidone depot1M 2010, Paliperidone depot1M 2015, Paliperidone depot3M 2015, Quetiapine 2009a; Quetiapine 2009b), while in the other five studies, different rating scales were applied in one study each: the Global Assessment of Functioning (Ziprasidone 2002), the Global Assessment Scale (Fluphenazine depot 1981) and its Children version (Aripiprazole 2017), the Specific Levels of Functioning (Lurasidone 2016) and the Sheehan Disability Schedule (Iloperidone 2016). For that reason, effects were analysed separately using MDs. At all time points and with all the scales used, the direction of effect was in favour of antipsychotic treatment, mostly (in 13 out of 15 studies) statistically significant. As an additional analysis, all studies were combined across different rating scales and time points using SMD. This analysis also showed statistically significant superiority of active medication. Analysing the studies using different statistical methods would probably not have changed the conclusions, since all the studies revealed at least a trend in favour of active drugs. As social functioning is regarded as one of the areas which should be taken into account for recovery beyond clinical remission, this is an important finding for clinical practice. It has been argued that functional remission is a more important criterion for recovery than being symptom free in order to be able to fulfil private and professional roles and to achieve social integration (Burns 2007, Vita 2018). Future trials should continue to consider social functioning as one of the outcomes, and, if our finding is confirmed, improved social functioning is another argument in favour of maintenance treatment with antipsychotic drugs in schizophrenia patients. As in the assessment of quality of life, it needs to be considered as a limitation that patients with a relapse were typically included in this outcome. For evaluating the social functioning of patients while taking maintenance treatment, the social‐functioning ratings before recurrence of psychotic symptoms would be of additional interest. However, tthese data were not typically not available.
3. Publication bias
The funnel plot was clearly asymmetrical suggesting the possibility of a publication bias. However, other reasons than unpublished studies can make funnel plots asymmetrical. For example, small studies are often conducted in single centres with very motivated investigators who make sure that drugs are compliantly taken. This may be more difficult in large, multi‐centre studies. To examine the impact of potentially undetected small studies we undertook a sensitivity analysis in which we only included larger studies (which we defined by a sample size of at least 200). In this group of studies there was still a clear reduction of the relapse risk at 12 months by antipsychotic drugs. Therefore, even if only the larger studies were considered, the finding of the superiority of antipsychotic drugs for relapse‐prevention is not threatened. Duval's and Tweedy's trim and fill method did also not suggest a substantial effect from missing small trials (Duval 2000).
4. Subgroup analyses and investigation of heterogeneity
The heterogeneity of many results was statistically significant, which was expected in a review that pooled different drugs and doses, that combined studies that used different relapse definitions, and that were published over a period of 50 years. Nevertheless, in most studies the direction of the effects was the same. Therefore, the heterogeneity reflected only differences in the degree of superiority in relapse prevention. Moreover, most subgroup analyses and meta‐regressions did not reveal any statistically significant differences. This finding is important, because it may be interpreted that the relapse‐preventing effects of antipsychotic drugs can be generalised to many patients.
4.1 People with a first episode of schizophrenia and people in remission
The effects of antipsychotic drugs were similar in first‐episode compared to multiple‐episode participants and if participants were in remission at baseline or not. First‐episode and remitted people with schizophrenia are thought to have a better prognosis, but our results suggest that theybenefit equally from antipsychotic relapse prevention. Approximately 20% of people with a first episode of schizophrenia will not have a second episode within five years (Robinson 1999), but identification of this subgroup in advance is more than problematic.
4.2 People who had been stable for various periods before entering the trials
The relapse‐preventing effects of antipsychotic drugs were independent from the duration that participants had been stable before entering the studies. Even in those participants who had been stable for up to three to six years (Fluphenazine depot 1992; Various drugs 1981b) relapse rates were higher among placebo‐treated than among drug‐treated individuals. This is important for the recommended duration of antipsychotic maintenance treatment in guidelines, because it can be argued that even patients who have taken antipsychotic drugs for such a duration still benefit from them. However, as only two small studies (Fluphenazine depot 1992; Various drugs 1981b) with a total of only 54 participants contributed to this finding, more evidence is clearly needed for solid recommendations.
4.3 Abrupt versus gradual withdrawal of antipsychotic drugs
There is a theory that long‐term treatment with antipsychotic drugs leads to a compensatory up‐regulation of dopamine receptors. If antipsychotic drugs are withdrawn abruptly, dopamine receptors are hypersensitive, leading to rebound psychosis (Moncrieff 2006). This phenomenon has been called 'supersensitivity psychosis'. In contrast to the now outdated report by Viguera 1997, we did not find a difference in relapse reduction between studies in which drugs were abruptly or gradually withdrawn, neither in a dichotomised subgroup analysis applying the same cut‐off as Viguera 1997 (who defined gradual withdrawal by a taper duration of at least three weeks or stopping depot antipsychotic drugs that have a long half‐life), nor in a meta‐regression with duration of taper as a continuous parameter. It should be noted that subgroup analysis and meta‐regression are observational, crude methods and can, therefore, not rule out this theory which needs thorough investigation. It is also possible that supersensitivity psychosis explains a part of the decreasing effect sizes in longer trials (see Figure 7 and below). We would therefore strongly recommend slow tapering of antipsychotic drugs, if withdrawal is needed.
4.4 Single antipsychotic drugs, depot versus oral medication and first‐generation versus second‐generation antipsychotic drugs
There were no differences between the single antipsychotic drugs used apart from depot antipsychotic drugs (in particular depot formulations of haloperidol and fluphenazine) being more effective than oral antipsychotic drugs. Although this result fits to the theory that depot antipsychotic drugs improve the adherence that is crucial for relapse prevention, subgroup analyses are of observational nature. Only head‐to‐head comparisons of oral and depot antipsychotic drugs can decide whether the latter are more effective. A recent update of our systematic review on this question (Leucht 2011) did not find a difference between oral and depot medication (Kishimoto 2014). As a group, so‐called second‐generation antipsychotic drugs did not differ in relapse reduction from first‐generation antipsychotic drugs. This supports previous suggestions that this classification should be abandoned, because there is no single definition that fits to all drugs that are considered to be second‐generation or atypical antipsychotic drugs (Leucht 2009).
4.5 Appropriate versus unclear allocation concealment methods
There was no difference between the effect estimates of studies that used appropriate and unclear allocation concealment methods. It should, however, be noted that the original analyses on this question found larger differences between studies with appropriate and inappropriate allocation concealment than between appropriate and unclear allocation concealment (e.g. Schulz 1995). Studies with inappropriate allocation concealment were excluded a priori from our review.
4.6 Open versus double‐blind studies
Open trials were associated with a stronger difference between drugs and placebo than blinded trials, but as there were only two open RCTs (Various drugs 1993; Various drugs 2011), the impact of this effect was small.
4.7 Meta‐regression on study duration
There was a statistically significant association between longer study duration and smaller relapse reduction by antipsychotic drugs compared with placebo. This result could indicate that antipsychotic drugs lose their efficacy over time. We emphasise that there are also other possible explanations for this counter‐intuitive finding. Participants' severity in shorter and longer trials could be different, and notably the decreasing relapse‐preventing effects could also be an effect of decreasing drug compliance over time. However, studies that last longer than two years and either use depot antipsychotic drugs or thoroughly monitor compliance are needed to investigate the long‐term effects of antipsychotic drugs. Moreover, as antipsychotics prevent relapses, more patients in the drug group stayed in the study as compared to placebo (see also Discussion, section 2.2. "Leaving the study early due to any reasons"). Consequentely, at later time points, there were more at risk for relapse in the drug group than in the placebo group, and the difference in relapses between drug and placebo may get smaller due to this imbalance for people at risk (Davis 1975). Such a phenomenon is indeed expected should antipsychotics not completely prevent but only delay the occurrence of relapses (at least for a proportion of patients).
5. Sensitivity analyses
The results of the primary outcome were not much different when studies that were not clearly described as randomised were excluded, when open studies were excluded, when a fixed‐effect model instead of a random‐effects model was applied, when we used the original authors' assumptions on dropouts instead of our approach, when studies with unclear randomisation or allocation concealment methods were excluded, when only large trials were included, and when studies that did not use operational criteria to diagnose the participants were excluded. These sensitivity analyses underline the robustness of the results.
A final sensitivity analysis in which we analysed only those participants who had not relapsed for various durations after study start again addressed supersensitivity psychosis. It revealed that even in those participants who had not relapsed for nine months, subsequent relapse rates were clearly lower in the drug group than in the placebo group. This finding opposes the theory that many relapses were merely rebound effects after rapid withdrawal (Moncrieff 2006).
Overall completeness and applicability of evidence
The 75 included studies were conducted in various settings (e.g. inpatients and outpatients, different countries, stable superiority antipsychotic drugs in trials from different years), populations (e.g. participants in remission at baseline or not), and methods (e.g. different definitions of relapse). Therefore, we believe that the evidence is quite complete and applicable to routine care. There are, however, several limitations. While almost all studies reported on relapse, there is much less evidence on other outcomes such as hospitalisation, remission, employment status and adverse events, which were often inadequately reported. There were very few studies that lasted longer than one year. Thus, the long‐term effects of maintenance treatment are less clear. Finally, in most studies antipsychotic drugs were withdrawn abruptly. There is a theory that long‐term treatment leads to changes in dopamine receptors ('hypersensitivity psychosis') and re‐emergence of symptoms after abrupt withdrawal (Moncrieff 2006). One study (Olanzapine 1999) was excluded from the original review due to the fact that it provided for a very short duration of follow‐up (three to five days) after abrupt withdrawal (tapering of three to 12 days), and it was therefore difficult to unequivocally distinguish between withdrawal/rebound phenomenon and illness recurrence. In the update we decided to include the study. Sensitivity analyses of the outcomes which the study contributed to were performed, and excluding the study did not change the results. Although our meta‐regression and sensitivity analysis did not detect an effect, future studies should withdraw antipsychotic drugs gradually rather than abruptly and to rule out or confirm this, supersensitivity psychosis should be an important research agenda.
Quality of the evidence
In the review update, judgements on the quality of evidence were consistent with those of the original review. Almost all studies were randomised and double‐blind but for most details were not presented. Therefore it is unclear whether the studies were adequately randomised, whether treatment allocation was really concealed and whether blinding worked. Concerning blinding this may be less important in objective outcomes such as death or weight gain. Concerning allocation concealment we at least found that there was no difference in the primary outcome between studies that used appropriate and unclear methods. Dropout rates were often high, partly because it was specified in many studies' methods that participants had to discontinue once they relapsed. This poses mainly a problem for outcomes other than relapse. While relapse and leaving the studies early was quite consistently reported, the evidence about other outcomes was much more scarce. Without original study protocols being available we cannot judge with absolute certainty whether these were not measured or whether there were cases of selective reporting. The current approach to report only those outcomes that occurred in at least 5% to 10% of the participants should be abandoned, because rare but important side effects might be overlooked.
The most recent studies were often terminated early after pre‐planned interim analyses: this kind of design is clearly useful for practical and ethical reasons, but in the context of meta‐analyses it could be linked to the risk of overestimating treatment effects, especially when the studies stopped early contribute substantial weight in the analysis of some outcomes. However, this potential source of bias was not judged to threaten the quality of the overall evidence, with only a few exceptions (e.g. quality of life data). In individual trials there were also other problems, such as too high or too low doses, early termination of studies, baseline imbalances etc. In summary, the overall quality of the studies according to these criteria is moderate. Nevertheless, due to the consistency of the results in subgroup and sensitivity analyses, the overall superiority of antipsychotic drugs in reducing relapse rates is not challenged.
Potential biases in the review process
Wedecided a priori to pool all antipsychotic drugs in this review. We feel that this is justified for efficacy‐related outcomes, because most antipsychotic drugs do not differ in efficacy and if differences exist between some antipsychotic drugs, these are not large (Leucht 2009; Leucht 2013). The decision to pool all studies irrespective of the antipsychotic drug used is more problematic for adverse effects, because antipsychotic drugs differ to a large extent in this regard. Thus, any differences in side effects compared to placebo cannot be generalised to all antipsychotic compounds. Similarly, we analysed only a selection of common and important adverse effects, but many others exist.
The study search was mainly based on the Cochrane Schizophrenia Group’s register of trials. This is largely made up of searches of published literature. It is possible that there are unpublished studies that we are not aware of and there is a possibility of publication bias, although the funnel plot may also be asymmetrical due to other factors.
As a minor point, the 2017 update‐search did not include all antipsychotic drugs but was restricted to 35 different antipsychotics (including all second‐generation antipsychotics and the most important first‐generation antipsychotics). Therefore, theoretically, studies on specific first‐generation drugs that were not listed, could have been missed. However, we deem it unlikely that many studies (if any at all) with these specific old drugs have been performed after 2008. More sensitive time‐to‐relapse data derived from survival analyses that are considered more appropriate measures were not available for most studies, and, therefore, we had to restrict ourselves to the number of participants relapsed.
We have chosen to use the random‐effects model for our analyses, which does not assume that the populations from which the different trials are derived are the same. This technique does emphasise the results from smaller trials and it is these studies that are likely to be most prone to bias. Nevertheless, the results of a fixed‐effect model in a sensitivity analysis of the primary outcome were similar.
Finally, we highlight that many subgroup and meta‐regression analyses were conducted in this review, many of which were added post‐hoc ‐ after requests from reviewers. This raises the problem of type I errors (i.e. chance findings due to multiple testing).
Agreements and disagreements with other studies or reviews
We are aware of five other reviews that compared maintenance treatment with any antipsychotic drug with placebo (Davis 1975; Baldessarini 1985; Gilbert 1995; Zhao 2016; Kishi 2019). All were consistent with our results because they found that people with schizophrenia who were withdrawn from antipsychotic drugs relapsed significantly more frequently than those who continued them. However, some of these reports did not meet modern criteria of systematic reviews, did not analyse relapse at different points in time and did not address any other outcome. A review by some members of the current review team was restricted to second‐generation antipsychotics (Leucht 2009b, an update of Leucht 2003). Second‐generation antipsychotic drugs clearly reduced relapse rates compared to placebo and the relative risk was similar to that in the current review (RR 0.41, 95% CI 0.28 to 0.59), but the absolute risk difference was smaller (RD 0.20, 95% CI 0.11 to 0.30). The previous review included only seven trials and the inclusion criteria were different (e.g. studies that only followed up acute‐phase responders (a design that corrupts randomisation) were also included and participants were not required to be stable on antipsychotic drugs or to be on antipsychotic drugs at all at study start).
In terms of Cochrane Reviews, Almerie 2007 examined withdrawal of chlorpromazine compared to placebo and also found a significant relapse risk reduction. In the targeted update of this review, which was performed in 2016 (see New Reference) and included 22 RCTs (4334 participants), data on the primary outcome (relapse at one year) were consistent in essence with our results (10 RCTs, RR 0.50, 95% CI 0.38 to 0.66), as well as data on violent/aggressive behaviour. The targeted update also provided data on remission (participants not in remission at one year; 4 RCTs, RR 0.75, 95% CI 0.66 to 0.86); no data on recovery were found, the same as in the present review. As specified before (see Discussion, section 2.9), basing on the targeted update, data maintenance treatment with antipsychotic drugs may make only little difference to quality of life in people with schizophrenia; however, the analysis was based on four studies, and data of one study were entered in the wrong direction of effect; in the present review the superiority of antipsychotic drugs was found to be statistically significant (data based on seven studies), although the certainty of evidence for this outcome was judged as poor due to limitations concerning study design, indirectness and imprecision.
Study flow diagram (results of the original search)
For the review update in 2018: 3 reports describing the 2 studies originally excluded from quantitative synthesis were moved to excluded studies (no usable data for outcomes of interest); 3 reports on 1 study, originally excluded (short duration of follow‐up), were moved to included studies; one report originally included as independent study was moved as secondary publication of another included study.
Study flow diagram (results of the 2017/2018/2019 update search and combined results of the original search and the update search)
'Risk of bias' graph: review authors' judgements about each risk of bias item presented as percentages across all included studies.
'Risk of bias' summary: review authors' judgements about each risk of bias item for each included study.
Funnel plot of comparison: 1 Maintenance treatment with antipsychotic drugs versus placebo/no treatment, outcome: Relapse
Meta‐regression on duration of clinical stability before study start (relapse at 12 months)
The size of the bubbles is proportional to the inverse variance of the treatment effect.
Meta‐regression on duration of taper in the placebo group (relapse at 12 months)
The size of the bubbles is proportional to the inverse variance of treatment effect.
Meta‐regression on mean dose in chlorpromazine equivalents (relapse at 12 months)
The size of the bubbles is proportional to the inverse variance of treatment effect.
Meta‐regression on study duration (relapse, all studies included).
The size of the bubbles is proportional to the inverse variance of treatment effect.

Comparison 1: Maintenance treatment with antipsychotic drugs versus placebo/no treatment, Outcome 1: Relapse: 1. Within pre‐specified time periods

Comparison 1: Maintenance treatment with antipsychotic drugs versus placebo/no treatment, Outcome 2: Relapse: 2. Independent of duration

Comparison 1: Maintenance treatment with antipsychotic drugs versus placebo/no treatment, Outcome 3: Leaving the study early: 1. Due to any reason (acceptability of treatment)

Comparison 1: Maintenance treatment with antipsychotic drugs versus placebo/no treatment, Outcome 4: Leaving the study early: 2. Due to adverse events (overall tolerability)

Comparison 1: Maintenance treatment with antipsychotic drugs versus placebo/no treatment, Outcome 5: Leaving the study early: 3. Due to inefficacy

Comparison 1: Maintenance treatment with antipsychotic drugs versus placebo/no treatment, Outcome 6: Global state: number of participants improved (at least minimally)

Comparison 1: Maintenance treatment with antipsychotic drugs versus placebo/no treatment, Outcome 7: Global state: number of participants in symptomatic remission

Comparison 1: Maintenance treatment with antipsychotic drugs versus placebo/no treatment, Outcome 8: Global state: number of participants in sustained remission

Comparison 1: Maintenance treatment with antipsychotic drugs versus placebo/no treatment, Outcome 9: Service use: number of participants hospitalised

Comparison 1: Maintenance treatment with antipsychotic drugs versus placebo/no treatment, Outcome 10: Service use: number of participants discharged

Comparison 1: Maintenance treatment with antipsychotic drugs versus placebo/no treatment, Outcome 11: Death: due to any reason

Comparison 1: Maintenance treatment with antipsychotic drugs versus placebo/no treatment, Outcome 12: Death: due to natural causes

Comparison 1: Maintenance treatment with antipsychotic drugs versus placebo/no treatment, Outcome 13: Death: due to suicide

Comparison 1: Maintenance treatment with antipsychotic drugs versus placebo/no treatment, Outcome 14: Number with suicide attempts

Comparison 1: Maintenance treatment with antipsychotic drugs versus placebo/no treatment, Outcome 15: Number with suicide ideation

Comparison 1: Maintenance treatment with antipsychotic drugs versus placebo/no treatment, Outcome 16: Violent/aggressive behaviour

Comparison 1: Maintenance treatment with antipsychotic drugs versus placebo/no treatment, Outcome 17: Adverse effects: at least one adverse event

Comparison 1: Maintenance treatment with antipsychotic drugs versus placebo/no treatment, Outcome 18: Adverse effects: movement disorders: at least one movement disorder

Comparison 1: Maintenance treatment with antipsychotic drugs versus placebo/no treatment, Outcome 19: Adverse effects: movement disorders: akathisia

Comparison 1: Maintenance treatment with antipsychotic drugs versus placebo/no treatment, Outcome 20: Adverse effects: movement disorders: akinesia

Comparison 1: Maintenance treatment with antipsychotic drugs versus placebo/no treatment, Outcome 21: Adverse effects: movement disorders: dyskinesia

Comparison 1: Maintenance treatment with antipsychotic drugs versus placebo/no treatment, Outcome 22: Adverse effects: movement disorders: dystonia

Comparison 1: Maintenance treatment with antipsychotic drugs versus placebo/no treatment, Outcome 23: Adverse effects: movement disorders: rigor

Comparison 1: Maintenance treatment with antipsychotic drugs versus placebo/no treatment, Outcome 24: Adverse effects: movement disorders: tremor

Comparison 1: Maintenance treatment with antipsychotic drugs versus placebo/no treatment, Outcome 25: Adverse effects: movement disorders: use of antiparkinson medication

Comparison 1: Maintenance treatment with antipsychotic drugs versus placebo/no treatment, Outcome 26: Adverse effects: sedation

Comparison 1: Maintenance treatment with antipsychotic drugs versus placebo/no treatment, Outcome 27: Adverse effects: weight gain

Comparison 1: Maintenance treatment with antipsychotic drugs versus placebo/no treatment, Outcome 28: Participant´s satisfaction with care

Comparison 1: Maintenance treatment with antipsychotic drugs versus placebo/no treatment, Outcome 29: Quality of life (various scales, different timepoints)

Comparison 1: Maintenance treatment with antipsychotic drugs versus placebo/no treatment, Outcome 30: Quality of life (across all scales and timepoints)

Comparison 1: Maintenance treatment with antipsychotic drugs versus placebo/no treatment, Outcome 31: Number of participants in employment

Comparison 1: Maintenance treatment with antipsychotic drugs versus placebo/no treatment, Outcome 32: Social Functioning (various scales, different timepoints)

Comparison 1: Maintenance treatment with antipsychotic drugs versus placebo/no treatment, Outcome 33: Social Functioning (across all scales and timepoints)

Comparison 2: Subgroup analysis (relapse at 12 months), Outcome 1: Subgroup analysis: participants with a first episode

Comparison 2: Subgroup analysis (relapse at 12 months), Outcome 2: Subgroup analysis: participants in remission at baseline

Comparison 2: Subgroup analysis (relapse at 12 months), Outcome 3: Subgroup analysis: various durations of stability before entering the study

Comparison 2: Subgroup analysis (relapse at 12 months), Outcome 4: Subgroup analysis: abrupt withdrawal versus tapering

Comparison 2: Subgroup analysis (relapse at 12 months), Outcome 5: Subgroup analysis: single antipsychotic drugs

Comparison 2: Subgroup analysis (relapse at 12 months), Outcome 6: Subgroup analysis: depot versus oral drugs

Comparison 2: Subgroup analysis (relapse at 12 months), Outcome 7: Subgroup analysis: first‐ versus second‐generation antipsychotic drugs

Comparison 2: Subgroup analysis (relapse at 12 months), Outcome 8: Subgroup analysis: appropriate versus unclear allocation concealment

Comparison 2: Subgroup analysis (relapse at 12 months), Outcome 9: Subgroup analysis: blinded versus open trials

Comparison 3: Sensitivity analysis (relapse at 12 months), Outcome 1: Exclusion of studies that were not explicitly described as randomised

Comparison 3: Sensitivity analysis (relapse at 12 months), Outcome 2: Exclusion of non‐double‐blind studies

Comparison 3: Sensitivity analysis (relapse at 12 months), Outcome 3: Fixed‐effects model

Comparison 3: Sensitivity analysis (relapse at 12 months), Outcome 4: Original authors' assumptions on dropouts

Comparison 3: Sensitivity analysis (relapse at 12 months), Outcome 5: Inclusion of only large studies (> 200 participants)

Comparison 3: Sensitivity analysis (relapse at 12 months), Outcome 6: Exclusion of studies with clinical diagnosis

Comparison 3: Sensitivity analysis (relapse at 12 months), Outcome 7: Three months stable

Comparison 3: Sensitivity analysis (relapse at 12 months), Outcome 8: Six months stable

Comparison 3: Sensitivity analysis (relapse at 12 months), Outcome 9: Nine months stable

Comparison 3: Sensitivity analysis (relapse at 12 months), Outcome 10: Exclusion of studies with unclear randomisation method

Comparison 3: Sensitivity analysis (relapse at 12 months), Outcome 11: Exclusion of studies with unclear allocation concealment method
| Methods | Allocation: randomised ‐ clearly described generation of sequence and concealment of allocation |
|---|---|
| Participants | People with schizophrenia or schizophrenia‐like disorder in remission for at least one month |
| Interventions | 1. Any antipsychotic drug (flexible dose within appropriate range) 2. Placebo (after gradual ‐ rather than abrupt ‐ withdrawal of the previous antipsychotic drug) |
| Outcomes | Relapse (primary outcome) Rehospitalisation for psychosis Global state (number of participants improved, in symptomatic and sustained remission) Global state (number of participants in recovery) Leaving the study early (including specific causes) Death (natural and unnatural causes) Violent behaviour Quality of life Satisfaction with care and other measures of subjective well‐being/recovery Side‐effects (well reported) Social functioning, employment and other measures of functioning |
| Maintenance treatment with antipsychotic drugs versus placebo/no treatment for schizophrenia | ||||||
| Patient or population: schizophrenia | ||||||
| Outcomes | Illustrative comparative risks (95% CI) | Relative effect | № of participants | Certainty of the evidence | Comments | |
|---|---|---|---|---|---|---|
| Assumed risk | Corresponding risk | |||||
| Control | Maintenance treatment with antipsychotic drugs versus placebo/no treatment | |||||
| Relapse: 7 to 12 months Follow‐up: 7‐12 months | 606 per 1.000 | 230 per 1.000 | RR 0.38 | 4249 | ⊕⊕⊕⊕ | |
| Leaving the study early: due to any reason (acceptability of treatment) Follow‐up: 1‐24 months | 541 per 1.000 | 292 per 1.000 | RR 0.54 | 7001 | ⊕⊕⊕⊕ | |
| Service use: number of participants hospitalised Follow‐up: 1‐36 months | 177 per 1.000 | 76 per 1.000 | RR 0.43 | 3558 | ⊕⊕⊕⊕ | |
| Death: due to suicide Follow‐up: 1‐15 months | 1 per 1.000 | 1 per 1.000 | RR 0.60 | 4634 | ⊕⊕⊝⊝ | |
| Quality of life (various scales; low score=better) Follow‐up: 3‐18 months | The mean quality of life in the intervention group was 0.32 standard deviations lower (from 0.57 to 0.07 standard deviations lower), with lower scores reflecting a better condition. | ‐ | 1573 | ⊕⊕⊝⊝ | SMD ‐0.32 (‐0.57 to ‐0.07) | |
| Number of participants in employment Follow‐up: 9‐15 months | 344 per 1.000 | 372 per 1.000 | RR 1.08 | 593 | ⊕⊕⊝⊝ | |
| Social functioning (various scales; low score=better) Follow‐up: 1‐15 months | The mean social functioning in the intervention group was 0.43 standard deviations lower (from 0.53 to 0.34 standard deviations lower), with lower scores reflecting a better condition. | ‐ | 3588 | ⊕⊕⊕⊝ | SMD ‐0.43 (‐0.53 to ‐0.34) | |
| *The corresponding risk (and its 95% confidence interval) is based on the assumed risk in the comparison group and the relative effect of the intervention (and its 95% CI). | ||||||
| GRADE Working Group grades of evidence | ||||||
| 1 Publication bias: rated 'undetected' ‐ although the funnel plot was asymmetrical, the trim and fill test did not change the point estimate and the point estimate was also similar when only large studies were included (Analysis 3.5). 2 Risk of bias: rated 'no' ‐ many studies did not report the methods for sequence generation and/or allocation concealment. However, in subgroup analysis (Analysis 2.8) studies reporting high standards of methods showed a similar effect size as compared to studies with unclear methods. Also, in a sensitivity analysis excluding studies with unclear methods (Analysis 3.10 and Analysis 3.11), the effect sizes did not change substantially. Early terminated studies were not judged to contribute substantial weight to this outcome. 3 Inconsistency: rated 'no' ‐ the P value for heterogeneity was statistically significant and the I2 higher than 50%. However, results of individual studies differed rather in magnitude of effect (which could be partly explained by subgroup analyses) rather than in direction of effect. Therefore, this inconsistency does not challenge the overall results. 4 No indirectness was found in terms of study population nor of interventions. In terms of outcome, we followed the original authors definitions of relapse. These definitions used different criteria, but all addressed symptomatic deterioration related to relapse. Therefore, this was not judged to lead to indirectness. 5 Inconsistency: rated 'no' ‐ the P value for heterogeneity was statistically significant and the I‐square higher than 50%. However, results of individual studies differed rather in magnitude of effect than in direction of effect, which was the same in almost all the studies. Therefore, this inconsistency does not challenge the overall results. 6 Publication bias: it is unlikely that a study was unpublished because of unfavourable data in a secondary outcome. As a possible publication bias had no effect on the results for the primary outcome (relapse at 7 to 12 months), we deem that there was no relevant publication bias for this secondary outcome. 7 Indirectness: hospitalisation due to relapse was our primary interest, but in some studies reasons for hospitalisation were unclearly reported. Overall, we do not deem that this uncertainty was an important source of indirectness. 8 Imprecision: rated 'very serious' ‐ only few studies with few events contributed data to this outcome. The CI was wide, ranging from substantial harm to substantial benefit. 9 Risk of bias: rated 'serious' ‐ five out of seven studies were terminated early after interim analyses, possibly leading to overestimation of effect. 10 Indirectness: some rating scales used in the studies have been criticised for eventually not measuring what people understand by quality of life. However, it was decided not to further lower the quality of evidence for this outcome after downgrading for other factors, despite some uncertainty. 11 Imprecise data ‐ only a few studies provided data for this outcome and the confidence interval was large. 12 Indirectness: rated 'serious' ‐ the only three studies included mixed groups of employed and non‐employed participants at baseline, and it is unclear whether employment was supported or competitive employment. 13 Imprecision: rated 'serious' ‐ only three studies contributed to this event which depends on various factors (e.g. the existence of supported employment, rural versus service economy etc). 14 Risk of bias: rated 'serious' ‐ eleven out of fifteen studies were terminated early after interim analyses, possibly leading to overestimation of effects. 15 Indirectness: rated 'no' ‐ different rating scales were used in the studies, but this was not judged to challenge the results. | ||||||
| Outcome or subgroup title | No. of studies | No. of participants | Statistical method | Effect size |
| 1.1 Relapse: 1. Within pre‐specified time periods Show forest plot | 71 | 19996 | Risk Ratio (M‐H, Random, 95% CI) | 0.37 [0.33, 0.40] |
| 1.1.1 up to 3 months | 44 | 6362 | Risk Ratio (M‐H, Random, 95% CI) | 0.34 [0.28, 0.40] |
| 1.1.2 4‐6 months | 49 | 7599 | Risk Ratio (M‐H, Random, 95% CI) | 0.36 [0.31, 0.42] |
| 1.1.3 7‐12 months | 30 | 4249 | Risk Ratio (M‐H, Random, 95% CI) | 0.38 [0.32, 0.45] |
| 1.1.4 > 12 months | 10 | 1786 | Risk Ratio (M‐H, Random, 95% CI) | 0.46 [0.33, 0.64] |
| 1.2 Relapse: 2. Independent of duration Show forest plot | 71 | 8666 | Risk Ratio (M‐H, Random, 95% CI) | 0.35 [0.30, 0.40] |
| 1.3 Leaving the study early: 1. Due to any reason (acceptability of treatment) Show forest plot | 56 | 7001 | Risk Ratio (M‐H, Random, 95% CI) | 0.54 [0.49, 0.61] |
| 1.3.1 up to 3 months | 11 | 517 | Risk Ratio (M‐H, Random, 95% CI) | 0.34 [0.17, 0.67] |
| 1.3.2 4 to 6 months | 18 | 1792 | Risk Ratio (M‐H, Random, 95% CI) | 0.49 [0.37, 0.65] |
| 1.3.3 7 to 12 months | 24 | 3951 | Risk Ratio (M‐H, Random, 95% CI) | 0.56 [0.48, 0.65] |
| 1.3.4 > 12 months | 5 | 741 | Risk Ratio (M‐H, Random, 95% CI) | 0.64 [0.51, 0.82] |
| 1.4 Leaving the study early: 2. Due to adverse events (overall tolerability) Show forest plot | 53 | 6627 | Risk Ratio (M‐H, Random, 95% CI) | 1.27 [0.85, 1.89] |
| 1.4.1 up to 3 months | 10 | 371 | Risk Ratio (M‐H, Random, 95% CI) | 2.84 [0.12, 65.34] |
| 1.4.2 4 to 6 months | 15 | 1852 | Risk Ratio (M‐H, Random, 95% CI) | 1.20 [0.63, 2.28] |
| 1.4.3 7 to 12 months | 23 | 3870 | Risk Ratio (M‐H, Random, 95% CI) | 1.16 [0.69, 1.97] |
| 1.4.4 > 12 months | 5 | 534 | Risk Ratio (M‐H, Random, 95% CI) | 5.70 [1.28, 25.33] |
| 1.5 Leaving the study early: 3. Due to inefficacy Show forest plot | 55 | 6537 | Risk Ratio (M‐H, Random, 95% CI) | 0.38 [0.32, 0.43] |
| 1.5.1 up to 3 months | 11 | 421 | Risk Ratio (M‐H, Random, 95% CI) | 0.21 [0.07, 0.64] |
| 1.5.2 4 to 6 months | 16 | 1661 | Risk Ratio (M‐H, Random, 95% CI) | 0.41 [0.31, 0.54] |
| 1.5.3 7 to 12 months | 24 | 3951 | Risk Ratio (M‐H, Random, 95% CI) | 0.37 [0.31, 0.44] |
| 1.5.4 > 12 months | 4 | 504 | Risk Ratio (M‐H, Random, 95% CI) | 0.43 [0.29, 0.64] |
| 1.6 Global state: number of participants improved (at least minimally) Show forest plot | 16 | 1878 | Risk Ratio (M‐H, Random, 95% CI) | 2.12 [1.58, 2.85] |
| 1.6.1 up to 3 months | 3 | 119 | Risk Ratio (M‐H, Random, 95% CI) | 4.76 [1.65, 13.68] |
| 1.6.2 4 to 6 months | 8 | 1037 | Risk Ratio (M‐H, Random, 95% CI) | 2.33 [1.69, 3.21] |
| 1.6.3 7 to 12 months | 4 | 388 | Risk Ratio (M‐H, Random, 95% CI) | 1.67 [0.89, 3.13] |
| 1.6.4 >12 months | 1 | 334 | Risk Ratio (M‐H, Random, 95% CI) | 1.36 [0.88, 2.09] |
| 1.7 Global state: number of participants in symptomatic remission Show forest plot | 7 | 867 | Risk Ratio (M‐H, Random, 95% CI) | 1.73 [1.20, 2.48] |
| 1.7.1 up to 3 months | 1 | 20 | Risk Ratio (M‐H, Random, 95% CI) | 2.50 [0.63, 10.00] |
| 1.7.2 4 to 6 months | 1 | 40 | Risk Ratio (M‐H, Random, 95% CI) | 1.75 [0.79, 3.87] |
| 1.7.3 7 to 12 months | 5 | 807 | Risk Ratio (M‐H, Random, 95% CI) | 1.70 [1.11, 2.59] |
| 1.8 Global state: number of participants in sustained remission Show forest plot | 8 | 1807 | Risk Ratio (M‐H, Random, 95% CI) | 1.67 [1.28, 2.19] |
| 1.8.1 7 to 12 months | 6 | 1443 | Risk Ratio (M‐H, Random, 95% CI) | 1.83 [1.49, 2.25] |
| 1.8.2 >12 months | 2 | 364 | Risk Ratio (M‐H, Random, 95% CI) | 1.29 [1.13, 1.47] |
| 1.9 Service use: number of participants hospitalised Show forest plot | 21 | 3558 | Risk Ratio (M‐H, Random, 95% CI) | 0.43 [0.32, 0.57] |
| 1.9.1 up to 3 months | 2 | 55 | Risk Ratio (M‐H, Random, 95% CI) | 0.42 [0.04, 4.06] |
| 1.9.2 4 to 6 months | 4 | 419 | Risk Ratio (M‐H, Random, 95% CI) | 0.19 [0.03, 1.32] |
| 1.9.3 7 to 12 months | 11 | 2119 | Risk Ratio (M‐H, Random, 95% CI) | 0.36 [0.23, 0.56] |
| 1.9.4 > 12 months | 4 | 965 | Risk Ratio (M‐H, Random, 95% CI) | 0.55 [0.44, 0.69] |
| 1.10 Service use: number of participants discharged Show forest plot | 3 | 404 | Risk Ratio (M‐H, Random, 95% CI) | 2.76 [0.69, 11.06] |
| 1.10.1 4 to 6 months | 3 | 404 | Risk Ratio (M‐H, Random, 95% CI) | 2.76 [0.69, 11.06] |
| 1.11 Death: due to any reason Show forest plot | 25 | 5181 | Risk Ratio (M‐H, Random, 95% CI) | 0.90 [0.39, 2.11] |
| 1.11.1 up to 3 months | 3 | 415 | Risk Ratio (M‐H, Random, 95% CI) | Not estimable |
| 1.11.2 4 to 6 months | 6 | 1159 | Risk Ratio (M‐H, Random, 95% CI) | 2.30 [0.59, 8.98] |
| 1.11.3 7 to 12 months | 15 | 3273 | Risk Ratio (M‐H, Random, 95% CI) | 0.35 [0.11, 1.12] |
| 1.11.4 >12 months | 1 | 334 | Risk Ratio (M‐H, Random, 95% CI) | 5.18 [0.25, 107.12] |
| 1.12 Death: due to natural causes Show forest plot | 25 | 5226 | Risk Ratio (M‐H, Random, 95% CI) | 1.35 [0.50, 3.60] |
| 1.12.1 up to 3 months | 2 | 379 | Risk Ratio (M‐H, Random, 95% CI) | Not estimable |
| 1.12.2 4 to 6 months | 6 | 1159 | Risk Ratio (M‐H, Random, 95% CI) | 2.30 [0.59, 8.98] |
| 1.12.3 7 to 12 months | 16 | 3354 | Risk Ratio (M‐H, Random, 95% CI) | 0.53 [0.11, 2.58] |
| 1.12.4 >12 months | 1 | 334 | Risk Ratio (M‐H, Random, 95% CI) | 3.11 [0.13, 75.78] |
| 1.13 Death: due to suicide Show forest plot | 19 | 4634 | Risk Ratio (M‐H, Random, 95% CI) | 0.60 [0.12, 2.97] |
| 1.13.1 up to 3 months | 3 | 415 | Risk Ratio (M‐H, Random, 95% CI) | Not estimable |
| 1.13.2 4 to 6 months | 3 | 1033 | Risk Ratio (M‐H, Random, 95% CI) | Not estimable |
| 1.13.3 7 to 12 months | 12 | 2852 | Risk Ratio (M‐H, Random, 95% CI) | 0.35 [0.06, 2.21] |
| 1.13.4 >12 months | 1 | 334 | Risk Ratio (M‐H, Random, 95% CI) | 3.11 [0.13, 75.78] |
| 1.14 Number with suicide attempts Show forest plot | 12 | 3123 | Risk Ratio (M‐H, Random, 95% CI) | 0.61 [0.19, 1.99] |
| 1.14.1 4 to 6 months | 3 | 776 | Risk Ratio (M‐H, Random, 95% CI) | 3.00 [0.13, 71.51] |
| 1.14.2 7 to 12 months | 9 | 2347 | Risk Ratio (M‐H, Random, 95% CI) | 0.48 [0.13, 1.69] |
| 1.15 Number with suicide ideation Show forest plot | 13 | 3255 | Risk Ratio (M‐H, Random, 95% CI) | 0.61 [0.33, 1.16] |
| 1.15.1 up to 3 months | 1 | 49 | Risk Ratio (M‐H, Random, 95% CI) | 0.17 [0.01, 3.88] |
| 1.15.2 4 to 6 months | 1 | 386 | Risk Ratio (M‐H, Random, 95% CI) | Not estimable |
| 1.15.3 7 to 12 months | 10 | 2486 | Risk Ratio (M‐H, Random, 95% CI) | 0.52 [0.24, 1.09] |
| 1.15.4 >12 months | 1 | 334 | Risk Ratio (M‐H, Random, 95% CI) | 1.30 [0.35, 4.74] |
| 1.16 Violent/aggressive behaviour Show forest plot | 12 | 2856 | Risk Ratio (M‐H, Random, 95% CI) | 0.37 [0.24, 0.59] |
| 1.16.1 up to 3 months | 1 | 26 | Risk Ratio (M‐H, Random, 95% CI) | 0.33 [0.01, 7.50] |
| 1.16.2 4 to 6 months | 2 | 350 | Risk Ratio (M‐H, Random, 95% CI) | 0.46 [0.20, 1.08] |
| 1.16.3 7 to 12 months | 8 | 2146 | Risk Ratio (M‐H, Random, 95% CI) | 0.35 [0.19, 0.66] |
| 1.16.4 >12 months | 1 | 334 | Risk Ratio (M‐H, Random, 95% CI) | 0.21 [0.01, 4.28] |
| 1.17 Adverse effects: at least one adverse event Show forest plot | 18 | 4352 | Risk Ratio (M‐H, Random, 95% CI) | 1.10 [0.98, 1.25] |
| 1.17.1 up to 3 months | 1 | 49 | Risk Ratio (M‐H, Random, 95% CI) | 0.53 [0.30, 0.93] |
| 1.17.2 4 to 6 months | 4 | 1079 | Risk Ratio (M‐H, Random, 95% CI) | 0.98 [0.85, 1.12] |
| 1.17.3 7 to 12 months | 12 | 2890 | Risk Ratio (M‐H, Random, 95% CI) | 1.15 [0.99, 1.33] |
| 1.17.4 >12 months | 1 | 334 | Risk Ratio (M‐H, Random, 95% CI) | 1.75 [1.24, 2.45] |
| 1.18 Adverse effects: movement disorders: at least one movement disorder Show forest plot | 29 | 5276 | Risk Ratio (M‐H, Random, 95% CI) | 1.52 [1.25, 1.85] |
| 1.18.1 up to 3 months | 4 | 158 | Risk Ratio (M‐H, Random, 95% CI) | 2.42 [0.70, 8.33] |
| 1.18.2 4 to 6 months | 8 | 1658 | Risk Ratio (M‐H, Random, 95% CI) | 1.45 [1.06, 1.99] |
| 1.18.3 7 to 12 months | 16 | 3126 | Risk Ratio (M‐H, Random, 95% CI) | 1.55 [1.17, 2.05] |
| 1.18.4 >12 months | 1 | 334 | Risk Ratio (M‐H, Random, 95% CI) | 1.21 [0.58, 2.54] |
| 1.19 Adverse effects: movement disorders: akathisia Show forest plot | 21 | 4214 | Risk Ratio (M‐H, Random, 95% CI) | 1.49 [0.93, 2.38] |
| 1.19.1 up to 3 months | 2 | 69 | Risk Ratio (M‐H, Random, 95% CI) | 2.68 [0.49, 14.82] |
| 1.19.2 4 to 6 months | 6 | 1191 | Risk Ratio (M‐H, Random, 95% CI) | 2.14 [0.50, 9.11] |
| 1.19.3 7 to 12 months | 12 | 2620 | Risk Ratio (M‐H, Random, 95% CI) | 1.07 [0.71, 1.61] |
| 1.19.4 >12 months | 1 | 334 | Risk Ratio (M‐H, Random, 95% CI) | 1.73 [0.42, 7.11] |
| 1.20 Adverse effects: movement disorders: akinesia Show forest plot | 3 | 397 | Risk Ratio (M‐H, Random, 95% CI) | 0.52 [0.08, 3.42] |
| 1.20.1 up to 3 months | 1 | 49 | Risk Ratio (M‐H, Random, 95% CI) | 0.97 [0.09, 9.92] |
| 1.20.2 7 to 12 months | 2 | 348 | Risk Ratio (M‐H, Random, 95% CI) | 0.16 [0.01, 3.98] |
| 1.21 Adverse effects: movement disorders: dyskinesia Show forest plot | 18 | 3200 | Risk Ratio (M‐H, Random, 95% CI) | 0.55 [0.33, 0.91] |
| 1.21.1 up to 3 months | 1 | 49 | Risk Ratio (M‐H, Random, 95% CI) | 1.50 [0.06, 34.91] |
| 1.21.2 4 to 6 months | 3 | 418 | Risk Ratio (M‐H, Random, 95% CI) | 0.31 [0.11, 0.84] |
| 1.21.3 7 to 12 months | 13 | 2399 | Risk Ratio (M‐H, Random, 95% CI) | 0.69 [0.37, 1.27] |
| 1.21.4 >12 months | 1 | 334 | Risk Ratio (M‐H, Random, 95% CI) | 0.35 [0.04, 3.29] |
| 1.22 Adverse effects: movement disorders: dystonia Show forest plot | 13 | 2767 | Risk Ratio (M‐H, Random, 95% CI) | 1.63 [0.99, 2.70] |
| 1.22.1 up to 3 months | 1 | 49 | Risk Ratio (M‐H, Random, 95% CI) | 2.50 [0.13, 49.22] |
| 1.22.2 4 to 6 months | 2 | 382 | Risk Ratio (M‐H, Random, 95% CI) | 1.75 [0.94, 3.29] |
| 1.22.3 7 to 12 months | 9 | 2002 | Risk Ratio (M‐H, Random, 95% CI) | 1.63 [0.65, 4.09] |
| 1.22.4 >12 months | 1 | 334 | Risk Ratio (M‐H, Random, 95% CI) | 0.21 [0.01, 4.28] |
| 1.23 Adverse effects: movement disorders: rigor Show forest plot | 9 | 922 | Risk Ratio (M‐H, Random, 95% CI) | 1.39 [0.70, 2.79] |
| 1.23.1 up to 3 months | 2 | 69 | Risk Ratio (M‐H, Random, 95% CI) | 1.20 [0.22, 6.62] |
| 1.23.2 4 to 6 months | 3 | 160 | Risk Ratio (M‐H, Random, 95% CI) | 1.98 [0.67, 5.85] |
| 1.23.3 7 to 12 months | 4 | 693 | Risk Ratio (M‐H, Random, 95% CI) | 1.80 [0.29, 11.24] |
| 1.24 Adverse effects: movement disorders: tremor Show forest plot | 18 | 3353 | Risk Ratio (M‐H, Random, 95% CI) | 1.37 [0.95, 1.98] |
| 1.24.1 up to 3 months | 2 | 69 | Risk Ratio (M‐H, Random, 95% CI) | 1.20 [0.46, 3.16] |
| 1.24.2 4 to 6 months | 3 | 160 | Risk Ratio (M‐H, Random, 95% CI) | 0.92 [0.33, 2.61] |
| 1.24.3 7 to 12 months | 12 | 2790 | Risk Ratio (M‐H, Random, 95% CI) | 1.62 [1.04, 2.54] |
| 1.24.4 >12 months | 1 | 334 | Risk Ratio (M‐H, Random, 95% CI) | 0.52 [0.10, 2.79] |
| 1.25 Adverse effects: movement disorders: use of antiparkinson medication Show forest plot | 13 | 2908 | Risk Ratio (M‐H, Random, 95% CI) | 1.35 [1.10, 1.65] |
| 1.25.1 4 to 6 months | 3 | 841 | Risk Ratio (M‐H, Random, 95% CI) | 1.53 [0.90, 2.61] |
| 1.25.2 7 to 12 months | 9 | 1733 | Risk Ratio (M‐H, Random, 95% CI) | 1.37 [1.06, 1.78] |
| 1.25.3 >12 months | 1 | 334 | Risk Ratio (M‐H, Random, 95% CI) | 1.00 [0.64, 1.57] |
| 1.26 Adverse effects: sedation Show forest plot | 18 | 4078 | Risk Ratio (M‐H, Random, 95% CI) | 1.52 [1.24, 1.86] |
| 1.26.1 up to 3 months | 1 | 20 | Risk Ratio (M‐H, Random, 95% CI) | 0.20 [0.01, 3.70] |
| 1.26.2 4 to 6 months | 7 | 1880 | Risk Ratio (M‐H, Random, 95% CI) | 1.37 [0.89, 2.12] |
| 1.26.3 7 to 12 months | 9 | 1844 | Risk Ratio (M‐H, Random, 95% CI) | 1.78 [1.25, 2.53] |
| 1.26.4 >12 months | 1 | 334 | Risk Ratio (M‐H, Random, 95% CI) | 1.04 [0.15, 7.27] |
| 1.27 Adverse effects: weight gain Show forest plot | 19 | 4767 | Risk Ratio (M‐H, Random, 95% CI) | 1.69 [1.21, 2.35] |
| 1.27.1 4 to 6 months | 4 | 1039 | Risk Ratio (M‐H, Random, 95% CI) | 1.49 [0.81, 2.73] |
| 1.27.2 7 to 12 months | 14 | 3394 | Risk Ratio (M‐H, Random, 95% CI) | 1.80 [1.17, 2.77] |
| 1.27.3 >12 months | 1 | 334 | Risk Ratio (M‐H, Random, 95% CI) | 2.18 [1.06, 4.48] |
| 1.28 Participant´s satisfaction with care Show forest plot | 2 | 737 | Risk Ratio (M‐H, Random, 95% CI) | 1.21 [1.10, 1.33] |
| 1.28.1 7 to 12 months | 1 | 403 | Risk Ratio (M‐H, Random, 95% CI) | 1.19 [1.02, 1.38] |
| 1.28.2 > 12 months | 1 | 334 | Risk Ratio (M‐H, Random, 95% CI) | 1.22 [1.08, 1.38] |
| 1.29 Quality of life (various scales, different timepoints) Show forest plot | 7 | Mean Difference (IV, Random, 95% CI) | Subtotals only | |
| 1.29.1 up to 3 months ‐ Schizophrenia Quality of Life at endpoint (low score=better) | 2 | 379 | Mean Difference (IV, Random, 95% CI) | ‐2.00 [‐5.80, 1.80] |
| 1.29.2 7 to 12 months ‐ Self‐report Quality of Life Scale change from baseline to endpoint (low score=better) | 2 | 595 | Mean Difference (IV, Random, 95% CI) | ‐4.10 [‐6.32, ‐1.88] |
| 1.29.3 7 to 12 months ‐ Heinrichs Carpenter Quality of Life Scale change from baseline to endpoint (low score=better) | 1 | 304 | Mean Difference (IV, Random, 95% CI) | ‐11.36 [‐14.67, ‐8.05] |
| 1.29.4 7 to 12 months ‐ European Quality of Life Visual Analog Scale at endpoint (low score=better) | 1 | 277 | Mean Difference (IV, Random, 95% CI) | ‐6.30 [‐23.41, 10.81] |
| 1.29.5 > 12 months ‐ Symptom Questionnaire of Kellner and Sheffield at endpoint (low score=better) | 1 | 18 | Mean Difference (IV, Random, 95% CI) | ‐4.90 [‐14.33, 4.53] |
| 1.30 Quality of life (across all scales and timepoints) Show forest plot | 7 | 1573 | Std. Mean Difference (IV, Random, 95% CI) | ‐0.32 [‐0.57, ‐0.07] |
| 1.31 Number of participants in employment Show forest plot | 3 | 593 | Risk Ratio (M‐H, Random, 95% CI) | 1.08 [0.82, 1.41] |
| 1.31.1 7 to 12 months | 2 | 259 | Risk Ratio (M‐H, Random, 95% CI) | 0.96 [0.75, 1.23] |
| 1.31.2 > 12 months | 1 | 334 | Risk Ratio (M‐H, Random, 95% CI) | 1.39 [0.97, 2.00] |
| 1.32 Social Functioning (various scales, different timepoints) Show forest plot | 15 | Mean Difference (IV, Random, 95% CI) | Subtotals only | |
| 1.32.1 up to 3 months ‐ Personal and Social Performance at endpoint (low score=better) | 2 | 379 | Mean Difference (IV, Random, 95% CI) | ‐5.66 [‐11.50, 0.18] |
| 1.32.2 up to 3 months ‐ Global Assessment Scale at endpoint (low score=better) | 1 | 120 | Mean Difference (IV, Random, 95% CI) | ‐3.61 [‐4.66, ‐2.56] |
| 1.32.3 4 to 6 months ‐ Sheehan Disability Schedule change from baseline to endpoint (low score=better) | 1 | 270 | Mean Difference (IV, Random, 95% CI) | ‐2.00 [‐3.60, ‐0.40] |
| 1.32.4 7 to 12 months ‐ Personal and Social Performance change from baseline to endpoint (low score=better) | 7 | 1823 | Mean Difference (IV, Random, 95% CI) | ‐4.92 [‐5.96, ‐3.89] |
| 1.32.5 7 to 12 months ‐ Global Assessment of Functioning at endpoint (low score=better) | 1 | 275 | Mean Difference (IV, Random, 95% CI) | ‐8.80 [‐13.22, ‐4.38] |
| 1.32.6 7 to 12 months ‐ Specific Levels of Functioning change from baseline to endpoint (low score=better) | 1 | 246 | Mean Difference (IV, Random, 95% CI) | ‐2.40 [‐4.85, 0.05] |
| 1.32.7 7 to 12 months ‐ Children Global Assessment Scale change from baseline to endpoint (low score=better) | 1 | 146 | Mean Difference (IV, Random, 95% CI) | ‐4.60 [‐9.84, 0.64] |
| 1.32.8 > 12 months ‐ Personal and Social Performance change from baseline to endpoint (low score=better) | 1 | 329 | Mean Difference (IV, Random, 95% CI) | ‐3.60 [‐6.76, ‐0.44] |
| 1.33 Social Functioning (across all scales and timepoints) Show forest plot | 15 | 3588 | Std. Mean Difference (IV, Random, 95% CI) | ‐0.43 [‐0.53, ‐0.34] |
| Outcome or subgroup title | No. of studies | No. of participants | Statistical method | Effect size |
| 2.1 Subgroup analysis: participants with a first episode Show forest plot | 29 | 4113 | Risk Ratio (M‐H, Random, 95% CI) | 0.39 [0.33, 0.46] |
| 2.1.1 first episode | 8 | 528 | Risk Ratio (M‐H, Random, 95% CI) | 0.47 [0.38, 0.58] |
| 2.1.2 not first episode | 24 | 3585 | Risk Ratio (M‐H, Random, 95% CI) | 0.38 [0.31, 0.46] |
| 2.2 Subgroup analysis: participants in remission at baseline Show forest plot | 29 | 4113 | Risk Ratio (M‐H, Random, 95% CI) | 0.39 [0.32, 0.46] |
| 2.2.1 in remission | 10 | 1050 | Risk Ratio (M‐H, Random, 95% CI) | 0.44 [0.33, 0.60] |
| 2.2.2 not in remission | 19 | 3063 | Risk Ratio (M‐H, Random, 95% CI) | 0.36 [0.30, 0.44] |
| 2.3 Subgroup analysis: various durations of stability before entering the study Show forest plot | 24 | Risk Ratio (M‐H, Random, 95% CI) | Subtotals only | |
| 2.3.1 stable at least 1 month | 6 | 574 | Risk Ratio (M‐H, Random, 95% CI) | 0.32 [0.20, 0.50] |
| 2.3.2 stable at least 3 months | 10 | 2250 | Risk Ratio (M‐H, Random, 95% CI) | 0.34 [0.26, 0.43] |
| 2.3.3 stable at least 6 months | 1 | 20 | Risk Ratio (M‐H, Random, 95% CI) | 0.33 [0.04, 2.69] |
| 2.3.4 stable at least 12 months | 5 | 326 | Risk Ratio (M‐H, Random, 95% CI) | 0.31 [0.17, 0.57] |
| 2.3.5 stable at least 3 to 6 years | 2 | 54 | Risk Ratio (M‐H, Random, 95% CI) | 0.38 [0.18, 0.78] |
| 2.4 Subgroup analysis: abrupt withdrawal versus tapering Show forest plot | 29 | Risk Ratio (M‐H, Random, 95% CI) | Subtotals only | |
| 2.4.1 Abrupt withdrawal | 18 | 2348 | Risk Ratio (M‐H, Random, 95% CI) | 0.43 [0.35, 0.53] |
| 2.4.2 Taper | 11 | 1765 | Risk Ratio (M‐H, Random, 95% CI) | 0.33 [0.24, 0.44] |
| 2.5 Subgroup analysis: single antipsychotic drugs Show forest plot | 29 | Risk Ratio (M‐H, Random, 95% CI) | Subtotals only | |
| 2.5.1 Chlorpromazine | 2 | 406 | Risk Ratio (M‐H, Random, 95% CI) | 0.44 [0.36, 0.55] |
| 2.5.2 Fluphenazine depot | 6 | 296 | Risk Ratio (M‐H, Random, 95% CI) | 0.23 [0.14, 0.39] |
| 2.5.3 Haloperidol depot | 1 | 43 | Risk Ratio (M‐H, Random, 95% CI) | 0.14 [0.04, 0.55] |
| 2.5.4 Various, mixed groups of antipsychotic drugs | 10 | 705 | Risk Ratio (M‐H, Random, 95% CI) | 0.42 [0.27, 0.65] |
| 2.5.5 Quetiapine | 1 | 178 | Risk Ratio (M‐H, Random, 95% CI) | 0.48 [0.34, 0.69] |
| 2.5.6 Paliperidone | 4 | 1256 | Risk Ratio (M‐H, Random, 95% CI) | 0.37 [0.31, 0.44] |
| 2.5.7 Aripiprazole | 2 | 549 | Risk Ratio (M‐H, Random, 95% CI) | 0.35 [0.14, 0.86] |
| 2.5.8 Brexpiprazole | 1 | 202 | Risk Ratio (M‐H, Random, 95% CI) | 0.36 [0.23, 0.56] |
| 2.5.9 Ziprasidone | 1 | 278 | Risk Ratio (M‐H, Random, 95% CI) | 0.50 [0.39, 0.64] |
| 2.5.10 Cariprazine | 1 | 200 | Risk Ratio (M‐H, Random, 95% CI) | 0.54 [0.38, 0.77] |
| 2.6 Subgroup analysis: depot versus oral drugs Show forest plot | 26 | Risk Ratio (M‐H, Random, 95% CI) | Subtotals only | |
| 2.6.1 depot | 10 | 1705 | Risk Ratio (M‐H, Random, 95% CI) | 0.30 [0.23, 0.39] |
| 2.6.2 oral | 16 | 2187 | Risk Ratio (M‐H, Random, 95% CI) | 0.46 [0.38, 0.55] |
| 2.7 Subgroup analysis: first‐ versus second‐generation antipsychotic drugs Show forest plot | 29 | Risk Ratio (M‐H, Random, 95% CI) | Subtotals only | |
| 2.7.1 First‐generation antipsychotic drugs | 18 | 1430 | Risk Ratio (M‐H, Random, 95% CI) | 0.35 [0.25, 0.48] |
| 2.7.2 Second‐generation antipsychotic drugs | 11 | 2683 | Risk Ratio (M‐H, Random, 95% CI) | 0.39 [0.32, 0.48] |
| 2.8 Subgroup analysis: appropriate versus unclear allocation concealment Show forest plot | 29 | 4113 | Risk Ratio (M‐H, Random, 95% CI) | 0.39 [0.32, 0.46] |
| 2.8.1 appropriate allocation concealment | 13 | 2708 | Risk Ratio (M‐H, Random, 95% CI) | 0.37 [0.30, 0.45] |
| 2.8.2 unclear allocation concealment | 16 | 1405 | Risk Ratio (M‐H, Random, 95% CI) | 0.41 [0.30, 0.54] |
| 2.9 Subgroup analysis: blinded versus open trials Show forest plot | 29 | 4113 | Risk Ratio (M‐H, Random, 95% CI) | 0.39 [0.32, 0.46] |
| 2.9.1 blinded trials | 27 | 3856 | Risk Ratio (M‐H, Random, 95% CI) | 0.40 [0.33, 0.48] |
| 2.9.2 unblinded trials | 2 | 257 | Risk Ratio (M‐H, Random, 95% CI) | 0.26 [0.17, 0.39] |
| Outcome or subgroup title | No. of studies | No. of participants | Statistical method | Effect size |
| 3.1 Exclusion of studies that were not explicitly described as randomised Show forest plot | 28 | 4098 | Risk Ratio (M‐H, Random, 95% CI) | 0.39 [0.33, 0.46] |
| 3.2 Exclusion of non‐double‐blind studies Show forest plot | 27 | 3856 | Risk Ratio (M‐H, Random, 95% CI) | 0.40 [0.33, 0.48] |
| 3.3 Fixed‐effects model Show forest plot | 29 | 4113 | Risk Ratio (M‐H, Fixed, 95% CI) | 0.38 [0.35, 0.41] |
| 3.4 Original authors' assumptions on dropouts Show forest plot | 29 | 4113 | Risk Ratio (M‐H, Random, 95% CI) | 0.39 [0.32, 0.46] |
| 3.5 Inclusion of only large studies (> 200 participants) Show forest plot | 10 | 2950 | Risk Ratio (M‐H, Random, 95% CI) | 0.37 [0.31, 0.45] |
| 3.6 Exclusion of studies with clinical diagnosis Show forest plot | 22 | 4054 | Risk Ratio (M‐H, Random, 95% CI) | 0.41 [0.34, 0.48] |
| 3.7 Three months stable Show forest plot | 29 | 4622 | Risk Ratio (M‐H, Random, 95% CI) | 0.32 [0.24, 0.42] |
| 3.8 Six months stable Show forest plot | 20 | 2549 | Risk Ratio (M‐H, Random, 95% CI) | 0.30 [0.20, 0.45] |
| 3.9 Nine months stable Show forest plot | 15 | 1806 | Risk Ratio (M‐H, Random, 95% CI) | 0.32 [0.19, 0.52] |
| 3.10 Exclusion of studies with unclear randomisation method Show forest plot | 11 | 2644 | Risk Ratio (IV, Random, 95% CI) | 0.36 [0.29, 0.43] |
| 3.11 Exclusion of studies with unclear allocation concealment method Show forest plot | 13 | 2708 | Risk Ratio (IV, Random, 95% CI) | 0.37 [0.30, 0.45] |