Clinically‐indicated replacement versus routine replacement of peripheral venous catheters
Information
- DOI:
- https://doi.org/10.1002/14651858.CD007798.pub4Copy DOI

- Database:
-
- Cochrane Database of Systematic Reviews
- Version published:
-
- 14 August 2015see what's new
- Type:
-
- Intervention
- Stage:
-
- Review
- Cochrane Editorial Group:
-
Cochrane Vascular Group
- Copyright:
-
- Copyright © 2015 The Cochrane Collaboration. Published by John Wiley & Sons, Ltd.
Article metrics
Altmetric:
Cited by:
Authors
Contributions of authors
JW conceived the idea for the review. JW and SO wrote the protocol. CR critically reviewed the protocol before final submission.
JW selected trials for inclusion, assessed methodological quality of trials and extracted data. JW entered the data, developed the analysis plan for the update and drafted the review update.
SO arbitrated on the selection of trials, assisted with data extraction, assessed methodological quality and assisted in drafting the final review.
CR selected trials for inclusion, assessed methodological quality of trials, extracted data, assisted with interpreting results and drafting of the final review.
KN assessed methodological quality of trials, extracted data, and commented on the review update.
Sources of support
Internal sources
-
No sources of support supplied
External sources
-
Chief Scientist Office, Scottish Government Health Directorates, The Scottish Government, UK.
The Cochrane Vascular editorial base is supported by the Chief Scientist Office.
Declarations of interest
JW: none known
SO: none known
CMR: CMR's employer has received unrestricted grants in aid from manufacturers of peripheral intravenous catheters and products, on her behalf for academic research projects. These sponsor had no involvement in the study design, execution, analysis or publication of these projects and they were unrelated to the topic of this review. CMR is an academic researcher and her employer has received funding on her behalf for her to provide expert advice, or educational lectures on her research at professional symposia and other events. CMR's employer has received payments on her behalf, for consultancy research projects which have been commissioned by manufacturers of vascular catheters and equipment, these were not on the topic of this review.
KN: KN, as Professional Officer of the Australian College of Neonatal Nurses, has received payment from Johnson and Johnson Consumer Companies and Johnson and Johnson Pacific to a conference to present on the experience of undertaking an educational road show and rollout of the AWHONN skin care guidelines around Australia; and to attend a baby advisory meeting.
Some of the review authors were also the investigators on several of the included trials, To eliminate any potential for a conflict of interest, assessment was allocated to a review author who was not an investigator.
Acknowledgements
We are grateful to Marlene Stewart, Cochrane Vascular Managing Editor, for her support and speedy responses, and to the editors Mr Paul Tisi and Dr Jackie Price for their useful comments.
Version history
| Published | Title | Stage | Authors | Version |
| 2019 Jan 23 | Clinically‐indicated replacement versus routine replacement of peripheral venous catheters | Review | Joan Webster, Sonya Osborne, Claire M Rickard, Nicole Marsh | |
| 2015 Aug 14 | Clinically‐indicated replacement versus routine replacement of peripheral venous catheters | Review | Joan Webster, Sonya Osborne, Claire M Rickard, Karen New | |
| 2013 Apr 30 | Clinically‐indicated replacement versus routine replacement of peripheral venous catheters | Review | Joan Webster, Sonya Osborne, Claire M Rickard, Karen New | |
| 2010 Mar 17 | Clinically‐indicated replacement versus routine replacement of peripheral venous catheters | Review | Joan Webster, Sonya Osborne, Claire Rickard, Jennifer Hall | |
| 2009 Apr 15 | Clinically indicated replacement versus routine replacement of peripheral venous catheters | Protocol | Joan Webster, Sonya Osborne, Jennifer Hall, Claire Rickard | |
Differences between protocol and review
The primary outcome was changed to catheter‐related bloodstream infection; all‐cause bloodstream infection was added as a separate primary outcome. This was done to more closely differentiate between the two outcomes.
The methodological quality assessment of the included studies has been updated to the Cochrane Collaboration tool for assessing risk of bias (Higgins 2011a).
Keywords
MeSH
Medical Subject Headings (MeSH) Keywords
- Catheter‐Related Infections [*prevention & control];
- Catheterization, Peripheral [adverse effects, economics, *instrumentation];
- Catheters, Indwelling [adverse effects];
- Device Removal [*standards];
- Guideline Adherence;
- Incidence;
- Phlebitis [epidemiology, etiology];
- Randomized Controlled Trials as Topic;
- Time Factors;
Medical Subject Headings Check Words
Humans;
PICOs

Risk of bias graph: review authors' judgements about each risk of bias item presented as percentages across all included studies.

Risk of bias summary: review authors' judgements about each risk of bias item for each included study.

Forest plot of comparison: 1 Clinically‐indicated versus routine change, outcome: 1.1 Catheter‐related bloodstream infection.
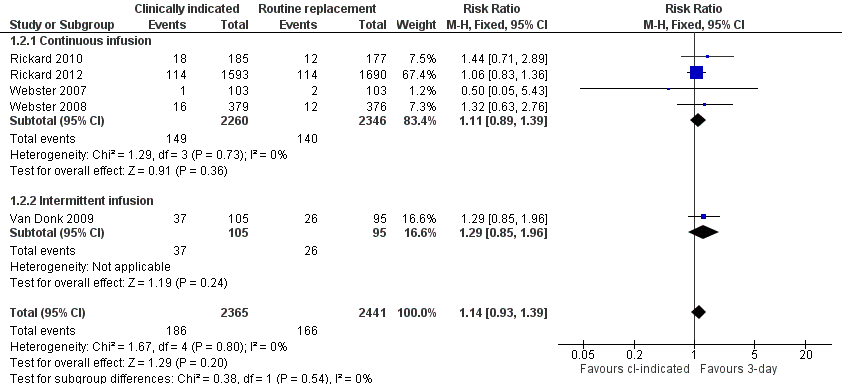
Forest plot of comparison: 1 Clinically‐indicated versus routine change, outcome: 1.2 Phlebitis.
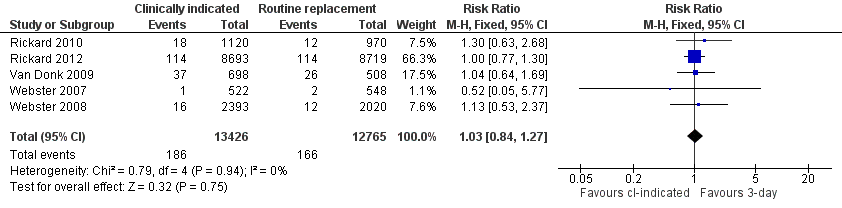
Forest plot of comparison: 1 Clinically‐indicated versus routine change, outcome: 1.3 Phlebitis per device days.

Forest plot of comparison: 1 Clinically‐indicated versus routine change, outcome: 1.4 All‐cause bloodstream infection.

Forest plot of comparison: 1 Clinically‐indicated versus routine change, outcome: 1.5 Cost.

Forest plot of comparison: 1 Clinically‐indicated versus routine change, outcome: 1.6 Infiltration.
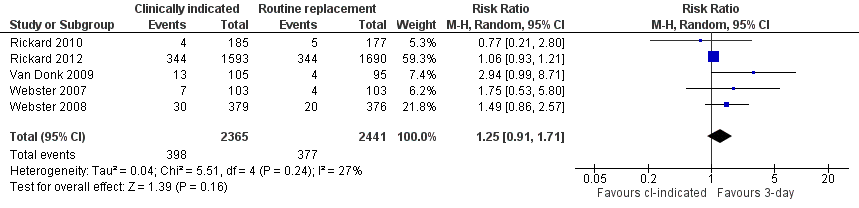
Forest plot of comparison: 1 Clinically‐indicated versus routine change, outcome: 1.7 Catheter blockage.
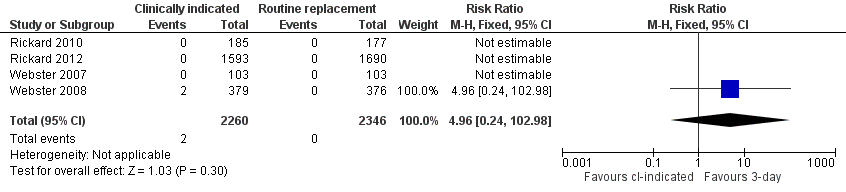
Forest plot of comparison: 1 Clinically‐indicated versus routine change, outcome: 1.8 Local infection.

Forest plot of comparison: 1 Clinically‐indicated versus routine change, outcome: 1.9 Mortality.

Comparison 1 Clinically‐indicated versus routine change, Outcome 1 Catheter‐related blood stream infection.

Comparison 1 Clinically‐indicated versus routine change, Outcome 2 Phlebitis.
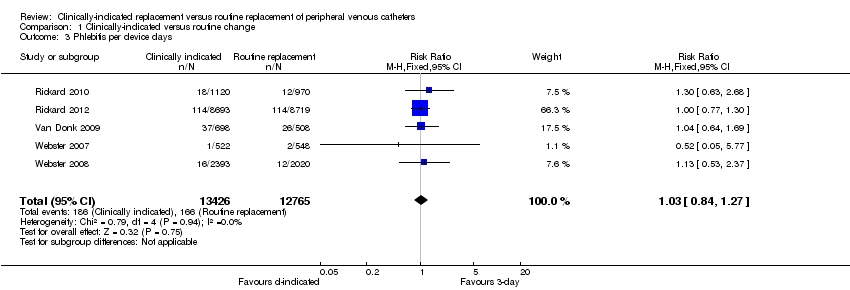
Comparison 1 Clinically‐indicated versus routine change, Outcome 3 Phlebitis per device days.
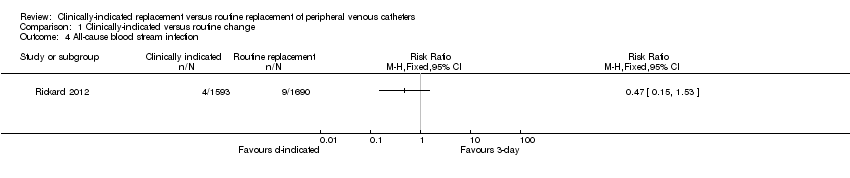
Comparison 1 Clinically‐indicated versus routine change, Outcome 4 All‐cause blood stream infection.
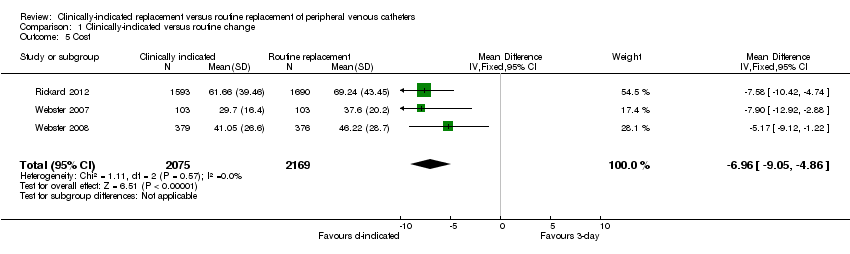
Comparison 1 Clinically‐indicated versus routine change, Outcome 5 Cost.
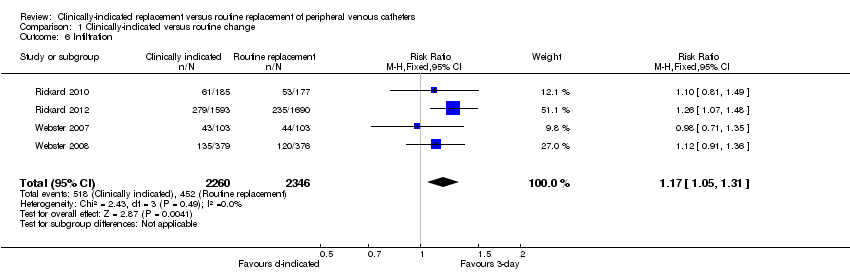
Comparison 1 Clinically‐indicated versus routine change, Outcome 6 Infiltration.
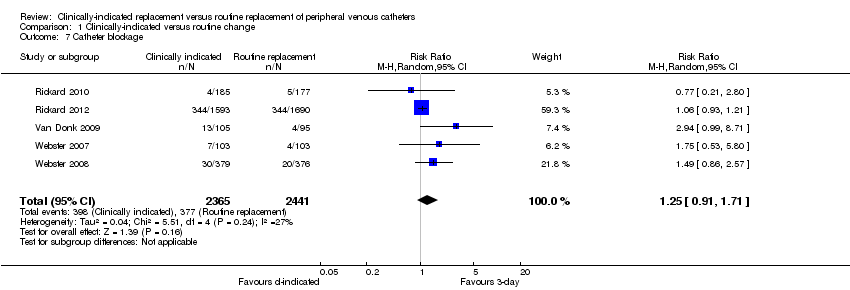
Comparison 1 Clinically‐indicated versus routine change, Outcome 7 Catheter blockage.
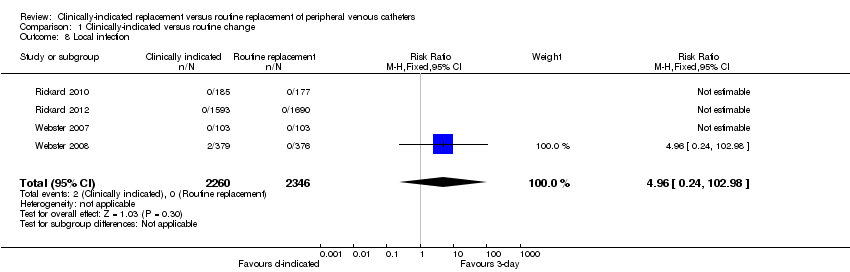
Comparison 1 Clinically‐indicated versus routine change, Outcome 8 Local infection.
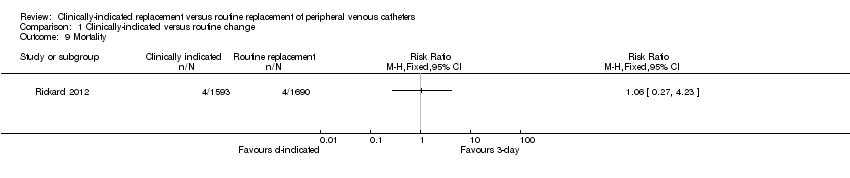
Comparison 1 Clinically‐indicated versus routine change, Outcome 9 Mortality.
| Clinically‐indicated versus routine changes for peripheral venous catheter‐related complications | ||||||
| Patient or population: patients with peripheral venous catheter‐related complications | ||||||
| Outcomes | Illustrative comparative risks* (95% CI) | Relative effect | No of Participants | Quality of the evidence | Comments | |
| Assumed risk | Corresponding risk | |||||
| Control | Clinically indicated versus routine changes | |||||
| Catheter‐related bloodstream infection | Study population | RR 0.61 | 4806 | ⊕⊕⊕⊖ | ||
| 1 per 1000 | 1 per 1000 | |||||
| Moderate | ||||||
| 0 per 1000 | 0 per 1000 | |||||
| Phlebitis | Study population | RR 1.14 | 4806 | ⊕⊕⊕⊕ | ||
| 68 per 1000 | 78 per 1000 | |||||
| Moderate | ||||||
| 68 per 1000 | 78 per 1000 | |||||
| All‐cause bloodstream infection | Study population | RR 0.47 | 3283 | ⊕⊕⊕⊕ | ||
| 5 per 1000 | 3 per 1000 | |||||
| Moderate | ||||||
| 5 per 1000 | 2 per 1000 | |||||
| Cost | The mean cost in the intervention groups was | 4244 | ⊕⊕⊕⊕ | |||
| *The basis for the assumed risk (e.g. the median control group risk across studies) is provided in footnotes. The corresponding risk (and its 95% confidence interval) is based on the assumed risk in the comparison group and the relative effect of the intervention (and its 95% CI). | ||||||
| GRADE Working Group grades of evidence | ||||||
| 1 Although patients and those recording outcomes were aware of group allocation, it seems unlikely that this knowledge would have affected results. None of those recording outcomes were investigators and the diagnosis was based on verifiable data in patients medical records. | ||||||
| Outcome or subgroup title | No. of studies | No. of participants | Statistical method | Effect size |
| 1 Catheter‐related blood stream infection Show forest plot | 5 | 4806 | Risk Ratio (M‐H, Fixed, 95% CI) | 0.61 [0.08, 4.68] |
| 2 Phlebitis Show forest plot | 5 | 4806 | Risk Ratio (M‐H, Fixed, 95% CI) | 1.14 [0.93, 1.39] |
| 2.1 Continuous infusion | 4 | 4606 | Risk Ratio (M‐H, Fixed, 95% CI) | 1.11 [0.89, 1.39] |
| 2.2 Intermittent infusion | 1 | 200 | Risk Ratio (M‐H, Fixed, 95% CI) | 1.29 [0.85, 1.96] |
| 3 Phlebitis per device days Show forest plot | 5 | 26191 | Risk Ratio (M‐H, Fixed, 95% CI) | 1.03 [0.84, 1.27] |
| 4 All‐cause blood stream infection Show forest plot | 1 | Risk Ratio (M‐H, Fixed, 95% CI) | Totals not selected | |
| 5 Cost Show forest plot | 3 | 4244 | Mean Difference (IV, Fixed, 95% CI) | ‐6.96 [‐9.05, ‐4.86] |
| 6 Infiltration Show forest plot | 4 | 4606 | Risk Ratio (M‐H, Fixed, 95% CI) | 1.17 [1.05, 1.31] |
| 7 Catheter blockage Show forest plot | 5 | 4806 | Risk Ratio (M‐H, Random, 95% CI) | 1.25 [0.91, 1.71] |
| 8 Local infection Show forest plot | 4 | 4606 | Risk Ratio (M‐H, Fixed, 95% CI) | 4.96 [0.24, 102.98] |
| 9 Mortality Show forest plot | 1 | Risk Ratio (M‐H, Fixed, 95% CI) | Totals not selected | |