Blood pressure lowering efficacy of coenzyme Q10 for primary hypertension
Appendices
Appendix 1. MEDLINE search strategy
Database: Ovid MEDLINE(R) 1946 to Present with Daily Update
Search Date: 10 November 2015
‐‐‐‐‐‐‐‐‐‐‐‐‐‐‐‐‐‐‐‐‐‐‐‐‐‐‐‐‐‐‐‐‐‐‐‐‐‐‐‐‐‐‐‐‐‐‐‐‐‐‐‐‐‐‐‐‐‐‐‐‐‐‐‐‐‐‐‐‐‐‐‐‐‐‐‐‐‐‐‐
1 ubiquinone.mp.
2 ((bioquinone or bio‐quinone or coenzyme or co‐enzyme or quinone) adj (q$ or "910")).mp.
3 (coq10 or q10).mp.
4 (caomet or decorenone or mitocor or neuquinon$ or ubidecarenone or ubimaior or ubiquinol or ubiten).mp.
5 or/1‐4
6 hypertension/
7 hypertens$.tw.
8 exp blood pressure/
9 (blood pressure or bloodpressure).mp.
10 or/6‐9
11 randomized controlled trial.pt.
12 controlled clinical trial.pt.
13 randomi?ed.ab.
14 placebo.ab.
15 drug therapy.fs.
16 randomly.ab.
17 trial.ab.
18 groups.ab.
19 or/11‐18
20 animals/ not (humans/ and animals/)
21 19 not 20
22 5 and 10 and 21
Appendix 2. Hypertension Group Specialised Register search strategy
Database: Hypertension Group Specialised Register <1946 to November 2015> via CRS
Search Date: 10 November 2015
‐‐‐‐‐‐‐‐‐‐‐‐‐‐‐‐‐‐‐‐‐‐‐‐‐‐‐‐‐‐‐‐‐‐‐‐‐‐‐‐‐‐‐‐‐‐‐‐‐‐‐‐‐‐‐‐‐‐‐‐‐‐‐‐‐‐‐‐‐‐‐‐‐‐‐‐‐‐‐‐
#1 ((coenzyme q OR coq10 or q10 OR ubidecarenone OR ubiquinone)) AND ((RCT OR Review OR Meta‐Analysis)):DE
Appendix 3. CENTRAL search strategy
Database: Cochrane Central Register of Controlled Trials <2015 Issue 10>
Search Date: 10 November 2015
‐‐‐‐‐‐‐‐‐‐‐‐‐‐‐‐‐‐‐‐‐‐‐‐‐‐‐‐‐‐‐‐‐‐‐‐‐‐‐‐‐‐‐‐‐‐‐‐‐‐‐‐‐‐‐‐‐‐‐‐‐‐‐‐‐‐‐‐‐‐‐‐‐‐‐‐‐‐‐‐
ID Search
#1 (ubiquinone):ti,ab,kw
#2 ((bioquinone or bio‐quinone or coenzyme or co‐enzyme or quinone) near (q* or "910")):ti,ab,kw
#3 (caomet or coq10 or decorenone or mitocor or neuquinon$ or "q10" or ubidecarenone or ubimaior or ubiquinol or ubiten):ti,ab,kw
#4 #1 or #2 or #3
#5 MeSH descriptor: [Hypertension] this term only
#6 hypertens*:ti,ab
#7 MeSH descriptor: [Blood Pressure] explode all trees
#8 ("blood pressure" or bloodpressure):ti,ab,kw
#9 #5 or #6 or #7 or #8
#10 #4 and #9
Appendix 4. EMBASE search strategy
Database: Embase <1974 to 2015 Week 46>
Search Date: 10 November 2015
‐‐‐‐‐‐‐‐‐‐‐‐‐‐‐‐‐‐‐‐‐‐‐‐‐‐‐‐‐‐‐‐‐‐‐‐‐‐‐‐‐‐‐‐‐‐‐‐‐‐‐‐‐‐‐‐‐‐‐‐‐‐‐‐‐‐‐‐‐‐‐‐‐‐‐‐‐‐‐‐
1 ubidecarenone/
2 ((bioquinone or bio‐quinone or coenzyme or co‐enzyme or quinone) adj (q$ or "910")).mp.
3 (coq10 or q10).mp.
4 (caomet or decorenone or mitocor or neuquinon$ or ubimaior or ubiquinol or ubiquinone or ubiten).mp.
5 or/1‐4
6 exp hypertension/
7 hypertens$.tw.
8 exp blood pressure/
9 (blood pressure or bloodpressure).mp.
10 or/6‐9
11 randomized controlled trial/
12 crossover procedure/
13 double‐blind procedure/
14 (randomi?ed or randomly).tw.
15 (crossover$ or cross‐over$).tw.
16 placebo.ab.
17 (doubl$ adj blind$).tw.
18 assign$.ab.
19 allocat$.ab.
20 or/11‐19
21 (exp animal/ or animal.hw. or nonhuman/) not (exp human/ or human cell/ or (human or humans).ti.)
22 20 not 21
23 5 and 10 and 22
Appendix 5. CINAHL search strategy
Database: EBSCO CINAHL <1970 to November 2015>
Search Date: 10 November 2015
‐‐‐‐‐‐‐‐‐‐‐‐‐‐‐‐‐‐‐‐‐‐‐‐‐‐‐‐‐‐‐‐‐‐‐‐‐‐‐‐‐‐‐‐‐‐‐‐‐‐‐‐‐‐‐‐‐‐‐‐‐‐‐‐‐‐‐‐‐‐‐‐‐‐‐‐‐‐‐‐
S23 S4 and S10 and S22
S22 (S11 or S12 or S13 or S14 or S15 or S16 or S17 or S18 or S19 or S20 or S21)
S21 TI double blind* or AB double blind*
S20 AB groups
S19 TI trial or AB trial
S18 (MH "Quantitative Studies")
S17 TI placebo or AB placebo
S16 MH Placebos
S15 TI random* or AB random*
S14 (MH "Random Assignment")
S13 TI (clinic* n1 trial*) or AB (clinic* n1 trial*)
S12 PT Clinical trial
S11 (MH "Clinical Trials+")
S10 S5 OR S6 OR S7 OR S8 OR S9
S9 TX bloodpressure
S8 TX blood or arterial or diastolic or systolic N2 pressure
S7 (MH "Blood Pressure+")
S6 TI hypertens* or AB hypertens*
S5 (MH "Hypertension+")
S4 S1 OR S2 OR S3
S3 TX (caomet or coq10 or decorenone or mitocor or neuquinone or ubidecarenone or ubimaior or ubiquinol or ubiquinone or ubiten)
S2 TX (coenzyme q* or co‐enzyme q* or coq10 or q10 or quinone q*)
S1 (MH "Coenzyme Q")
Appendix 6. Web of Science search strategy
Database: Web of Science (Science Citation Index Expanded and CPCI‐Science)
Search Date: 10 November 2015
‐‐‐‐‐‐‐‐‐‐‐‐‐‐‐‐‐‐‐‐‐‐‐‐‐‐‐‐‐‐‐‐‐‐‐‐‐‐‐‐‐‐‐‐‐‐‐‐‐‐‐‐‐‐‐‐‐‐‐‐‐‐‐‐‐‐‐‐‐‐‐‐‐‐‐‐‐‐‐‐
# 4 #3 AND #2 AND #1
# 3 TS=(randomized or randomised or randomly or control* or placebo* or double blind* or trial*)
# 2 TS=((hypertens* or bloodpressure or blood pressure or arterial pressure or diastolic pressure or systolic pressure))
# 1 TS=(caomet or coenzyme q or coenzyme q10 or co‐enzyme q or co‐enzyme q10 or coq10 or decorenone or mitocor or neuquinone or quinone or ubidecarenone or ubimaior or ubiquinone or ubiten)

Risk of bias summary: review authors' judgements about each risk of bias item for each included study.

Forest plot of comparison: 1 Coenzyme Q10 vs Placebo: Clinic data, outcome: 1.1 Mean difference in SBP.

Forest plot of comparison: 1 Coenzyme Q10 vs Placebo: Clinic data, outcome: 1.2 Mean difference in DBP.

Comparison 1 Coenzyme Q10 vs Placebo: Clinic data, Outcome 1 Mean difference in SBP.
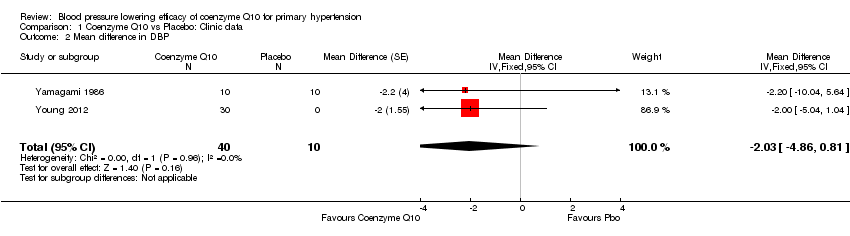
Comparison 1 Coenzyme Q10 vs Placebo: Clinic data, Outcome 2 Mean difference in DBP.

Comparison 1 Coenzyme Q10 vs Placebo: Clinic data, Outcome 3 Mean difference in HR.

Comparison 2 Coenzyme Q10 vs Placebo: 24 hr BP measurements, Outcome 1 Mean Difference in SBP.
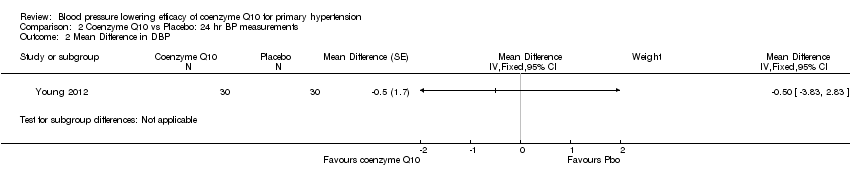
Comparison 2 Coenzyme Q10 vs Placebo: 24 hr BP measurements, Outcome 2 Mean Difference in DBP.

Comparison 2 Coenzyme Q10 vs Placebo: 24 hr BP measurements, Outcome 3 Mean Difference in HR.
| Coenzyme Q10 compared with placebo for primary hypertension | ||||
| Patient population: patients with primary hypertension Settings: primary care in Japan and New Zealand Intervention: coenzyme Q10 100 to 200 mg daily Comparison: placebo | ||||
| Outcomes | Mean difference in BP mmHg [95% CI] | No of Participants | Quality of the evidence | Comments |
| End of treatment SBP (over 12 weeks) | ‐3.7 mm Hg (‐8.9 to 1.5) | 50 (2) | ⊕⊕⊕⊝ | |
| End of treatment DBP (over 12 weeks) | ‐2.0 mm Hg (‐4.8 to 0.8) | 50 (2) | ⊕⊕⊕⊝ | |
| Withdrawals due to adverse effects | 30 (1) | Effect estimate not available; only one study reported this outcome but had no events in either study arm. | ||
| GRADE Working Group grades of evidence | ||||
| 1. Downgraded due to large confidence intervals from a small sample size and small number of included studies. | ||||
| Outcome or subgroup title | No. of studies | No. of participants | Statistical method | Effect size |
| 1 Mean difference in SBP Show forest plot | 2 | 50 | Mean Difference (Fixed, 95% CI) | ‐3.68 [‐8.86, 1.49] |
| 2 Mean difference in DBP Show forest plot | 2 | 50 | Mean Difference (Fixed, 95% CI) | ‐2.03 [‐4.86, 0.81] |
| 3 Mean difference in HR Show forest plot | 1 | Mean Difference (Fixed, 95% CI) | Subtotals only | |
| Outcome or subgroup title | No. of studies | No. of participants | Statistical method | Effect size |
| 1 Mean Difference in SBP Show forest plot | 1 | Mean Difference (Fixed, 95% CI) | Subtotals only | |
| 2 Mean Difference in DBP Show forest plot | 1 | Mean Difference (Fixed, 95% CI) | Subtotals only | |
| 3 Mean Difference in HR Show forest plot | 1 | Mean Difference (Fixed, 95% CI) | Subtotals only | |