Early additional food and fluids for healthy breastfed full‐term infants
References
References to studies included in this review
References to studies excluded from this review
References to ongoing studies
Additional references
References to other published versions of this review
Characteristics of studies
Characteristics of included studies [ordered by study ID]
Jump to:
| Methods | RCT. 3‐arm trial. Parallel design. | |
| Participants | Low‐income communities in San Pedro Sula, Honduras. Primiparous, breastfeeding mothers and their infants (n = 152) recruited from public maternity hospitals. | |
| Interventions | Trial from 4 to 6 months and longitudinal study of infants from birth to 12 months. At 16 weeks, infants assigned to:
After 6 months, mothers continued to breastfeed and also fed their infants. | |
| Outcomes | Infant weight measured weekly between 16 and 26 weeks and monthly from 7 to 12 months. Infant length measured at 16, 21 and 26 weeks and monthly from 4 to 12 months. Infant motor development following 10 motor milestones. Maternal height and weight measured at birth of infant and weight was re‐measured according to the infant weight measurement schedule. Maternal supra‐iliac and thigh skinfold thickness and circumference at the bust, below the bust, waist and hip were measured at 16, 21 and 26 weeks. Maternal % body fat measured at each timepoint. Breast milk intake measured by test weighing for 48 hours at 4, 5 and 6 months. After this period, breast milk samples were collected for 24 hours and samples were pooled and frozen for later lipid and lactose analysis. For the solid food groups, solid food intake measured at 19, 24 and 26 weeks. Infant morbidity was tabulated at 4‐6 months and 6‐12 months. Morbidity prevalence was calculated as % of days ill in each category of illness (diarrhoea, fever and upper‐respiratory illness). | |
| Notes | ||
| Risk of bias | ||
| Bias | Authors' judgement | Support for judgement |
| Random sequence generation (selection bias) | High risk | By week of birth (i.e. all infants born in the same week were randomly assigned to the same group). |
| Allocation concealment (selection bias) | High risk | Participants were not informed of their assignment until they had completed the first (non‐RCT) section of the study. |
| Blinding of outcome assessment (detection bias) | Unclear risk | No information available. |
| Incomplete outcome data (attrition bias) | Unclear risk | 152 women entered the intervention trial, 11 (7%) dropped out prior to 26 weeks (9, 1, and 1 in the EBF, SF, and SF‐M groups, respectively; P < 0.01). Reasons for leaving the study between 16 weeks and 26 weeks were reported: 2 had to return to work (both in EBF) and 5 were refused permission to continue participating (4 EBF and 1 SF‐M). The other 4 (3 EBF and 1 SF) were excluded because they did not exclusively breastfeed (or introduced other milks in the SF group). Characteristics of non‐participants who dropped out at commencement of the intervention trial were similar to those of participants. 141 participants completed the study (50 EBF, 47 SF, 44 SF‐M). 20% of infants weighed less than 2500 g at birth. The groups were similar in infant birthweight and sex; maternal age, weight, BMI, education, and marital status; and household income. Mothers in the SF‐M group were less likely to have received prenatal care than mothers in the 2 other groups. |
| Selective reporting (reporting bias) | Unclear risk | Data on all the outcomes mentioned in the 'Methods' section of the published papers were reported. We did not retrieve the protocol or raw data of the trial and thus did not identify whether outcomes other than those reported within the published papers were collected but not reported on. |
| Other bias | Low risk | No issues. |
| Methods | Prospective observational study followed by a randomised intervention trial (from 4 to 6 months). 2‐arm. Parallel design. | |
| Participants | 222 (of which 128 were eligible for the intervention phase of the study) full‐term (≧ to 37 weeks' gestation) low birthweight infants (weighing 1500‐2500 g at birth) from 2 maternity hospitals in San Pedro Sula, Honduras whose mothers (aged ≧ 15 years of age) were willing to exclusively breastfeed for 6 months and were not planning to work outside the home. | |
| Interventions | At 16 weeks of age, infants who were still exclusively breastfed were randomly assigned to 1 of 2 groups: (1) continued exclusive breastfeeding to 6 months, or (2) complementary feeding (solid foods) plus breastfeeding from 4 to 6 months, with mothers encouraged to maintain baseline (16 week) breastfeeding frequency. | |
| Outcomes | Growth and morbidity from 16 to 26 weeks were assessed for all infants. Morbidity data collected by maternal recall of illness symptoms (weekly). Blood samples collected at 2, 4, 6 months of age. Any infants identified as anaemic, i.e. Hb < 100 g/L, were given iron supplements and re‐tested 2 weeks later. Daily diary of infants stool frequency and consistency were recorded by the mothers. For a sub‐sample (n = 63) measurements of breast milk intake and composition and total energy intake at 16 and 26 weeks were completed. At 26 weeks, intake of solid foods by infants in the complementary feeding plus breastfeeding group was also determined. Infant motor development following 10 motor milestones. Maternal height (at time of birth) and weight (weekly). Maternal consumption of any vitamin and mineral supplements were recorded. Duration of lactational amenorrhoea. Assessment of attitudes of mothers to exclusive breastfeeding. After the intervention phase, infant growth was measured monthly until 12 months of age. | |
| Notes | ||
| Risk of bias | ||
| Bias | Authors' judgement | Support for judgement |
| Random sequence generation (selection bias) | High risk | Assigned by week of birth (i.e. all infants born in the same week were assigned to the same group). |
| Allocation concealment (selection bias) | High risk | Participants were not informed of their assignment until they had completed the first (non‐RCT) section of the study. |
| Blinding of outcome assessment (detection bias) | Unclear risk | Not stated for outcome assessors, although appears to be same researchers at all points. |
| Incomplete outcome data (attrition bias) | Unclear risk | For RCT part of study n = 128 at 4 months (study commencement). By the end of study 9 (8 in the EBF group) had dropped out with 119 completing study to 6 months. Mothers in the EBF group dropped out because: they moved away (n = 3), they went back to work (n = 2), they never intended to exclusively breastfeed (n = 1), they felt they were losing too much weight (n = 1). The 1 participant who dropped out of the SF group did so because she did not want to continue. There were no significant differences between the 119 participants and the 9 dropouts in infant sex, gestational age, ponderal index, or weight and length gains from birth to 16 weeks, nor in maternal height, BMI, income or prenatal care. However, dropouts had significantly lower birthweights, head circumferences, Apgar scores at 5 min, and maternal ages. Of those who remained in the study through 6 months, 44% were male, and mean values were 2364 +/‐ 137 g for birthweight, 23.3 +/‐ 3.3 kg/m2 for maternal BMI, and 5.7 +/‐ 2.7 years for maternal education. The sample sizes at 4 and 6 months for the blood indices analysed using frozen samples were smaller than those analysed immediately (Hb, Hct and MCV) because of a robbery (of the freezer with contents) at the Honduras facility near the end of data collection. This resulted in a loss of approximately 30% of the 4‐month samples and approximately 30% of the 6‐month samples. To determine whether these losses introduced bias, the authors evaluated whether the characteristics of those with lost samples at 4 or 6 months differed from those with complete data in either intervention group. There was little indication that the loss of samples introduced bias in interpreting the effect of the intervention. Nevertheless, data were analysed in 2 ways: considering only those with information available at both 4 and 6 months, and considering all samples available at 6 months. |
| Selective reporting (reporting bias) | Unclear risk | Data on all the outcomes mentioned in the 'Methods' section of the published papers were reported. We did not retrieve the protocol or raw data of the trial and thus did not identify whether outcomes other than those reported within the published papers were collected but not reported on. |
| Other bias | Low risk | No issues. |
| Methods | RCT, 2‐arm, parallel design. 2‐4 days in first week after birth with follow‐up to 3 months. Designed to be a pilot to test feasibility. | |
| Participants | 40 exclusively breastfeeding healthy term infants > 37 weeks' gestation, 24 to 48 hours old, who had lost > 5% birthweight before 36 hours of age were randomly assigned to continue exclusive breastfeeding n = 20 (control) or to receive formula supplementation n = 20 (intervention). "Infants were excluded if [at time of enrolment] they had lost > 10% of their birthweight, had received formula or water, required a higher level of care than a Level 1 nursery or had mothers who were ,18 years old, could not speak English or Spanish, or were making mature milk as assessed by a previously validated technique". 2 hospitals California, USA. | |
| Interventions | “Early limited formula (ELF) intervention (10 mL formula by syringe after each breastfeeding and discontinued when mature milk production began) or control (continued exclusive breastfeeding).” Nutramigen infant formula (stated as “extensively hydrolyzed"). | |
| Outcomes | Breastfeeding and formula use at 1 week and 1, 2, and 3 months. (Duration of breastfeeding). Weight nadir in protocol, only weight loss reported (at age not stated). Maternal breastfeeding self‐efficacy at 1 week. Incidence of febrile illness. | |
| Notes | Further details sought from trialist with some response. | |
| Risk of bias | ||
| Bias | Authors' judgement | Support for judgement |
| Random sequence generation (selection bias) | Low risk | “The allocation sequence for randomisation was generated by an independent bio‐ statistician stratified on location; assignments were placed into sealed opaque envelopes by an independent administrative assistant." |
| Allocation concealment (selection bias) | Low risk | "Immediately after enrolment, a study investigator opened the sequential envelope in the presence of a second investigator and revealed the randomisation arm.” |
| Blinding of outcome assessment (detection bias) | Low risk | “A blinded research assistant assessed outcomes at 1 week and 1, 2, and 3 months.” Unfeasible to blind participant or personnel. |
| Incomplete outcome data (attrition bias) | Unclear risk | 1‐3 infants were missing data at various follow‐up time points according to the published table with no information regarding which group, or if the same participants were missing data at multiple points, or different participants at each point. Information requested from trialist but was not available. |
| Selective reporting (reporting bias) | High risk | Lack of definition of breastfeeding and particularly of exclusive breastfeeding. The rates of exclusive breastfeeding dropped from week 1 to 1 month then increased in the both groups in month 2 and dropped in month 3. This implies the definition of exclusive breastfeeding was not in accordance with WHO guidelines. The control group of exclusive breastfeeding may have received infant formula as only 53% of this group were exclusively breastfeeding by the end of week 1 and the amount of formula used in the control group in the first week was over double the amount used in the intervention group. |
| Other bias | High risk | Protocol as ClinicalTrials.gov Identifier NCT00952328 listed primary outcome as: Is infant receiving exclusively breast milk at 8 days of life, published paper refers to “1 week”. Protocol “Both groups will receive intensive lactation support” – published report does not mention “intensive” support. Small sample size. Only 62% of those replying (6 out of 40 did not reply) at the start of the intervention had planned to exclusively breastfeed which may have affected their motivation to comply with the allocation. There were more multiparous women in the intervention group than the control group (70% vs 50%) and previous experience of breastfeeding is a well established predictor of subsequent feeding. Effect on weight was an outcome however, the study did not specifically weigh infants; used hospital routine weights, and only reported loss, not gain. Inclusion criteria was weight loss of ≥ 5% though this is well within the range of normality, and no infant in the study had a medical reason for supplementation. Unclear what was the support provided for breastfeeding, if mothers were instructed regarding how often to feed, to express milk if infant was not feeding well etc. No information on birth practices that may have affected commencing breastfeeding. No definition of a “feed” thus the instruction to give the 10 mL of supplement “after each feed” could be 8 times, 12 times or more and thus variable quantities consumed. As supplement was given by syringe the infant was not able to refuse the supplement if already content with the amount of breast milk received. Funding: Supported by grants 5 K12 HD052 and 1K23HD059818‐01A1 from the National Institute of Children Health and Human Development. 1 of the trialists has served as a paid consultant to 4 companies in the formula industry including the company producing the supplemental formula used in the intervention. Report does not state if formula was supplied by the company or purchased; some participants were provided with small amounts of the formula to continue supplementation for a short time after discharge from hospital ("about 12 ounces" from additional information from trialists). |
| Methods | RCT. 2‐arm. Parallel design. | |
| Participants | 119 randomly assigned at 4 months. Full‐term (≥ to 37 weeks' gestation). 61 were allocated to the CF group and 58 to the EBF group. Although 1 mother‐infant pair was incorrectly instructed to group EBF and was therefore analysed in the EBF group, so N = 60 for CF; N = 59 for EBF. At a screening visit all mothers stated willing to continue to exclusively breastfeed to 6 months. | |
| Interventions | At 4 months of age, infants who were still exclusively breastfed were randomly assigned to 1 of 2 groups: (1) continued exclusive breastfeeding to 6 months, or (2) CF (solid foods) plus breastfeeding from 4 to 6 months. Exclusive breastfeeding was defined as breastfeeding with no additional liquid or solid foods other than vitamins and medications, | |
| Outcomes | For the CF group, mothers kept a diary to indicate the date that every new food item was added to the infant's diet from the time of enrolment into the study until 6 months of age. A 3‐day weighted food record was obtained when the infant reached approximately 5 months and 1 week of age. Energy and nutrient information were calculated. For both groups Anthropometric assessment: included infant's weight, length and head circumference. Measured at birth, 6 weeks, and 3, 4, 5 and 6 months of age (converted to z scores using the WHO Infant Growth Standards). Blood samples: obtained to determine iron status. Obtained at 6 months of age ‐ blood for Hb, MCV, RDW, serum ferritin, and TIBC. Breast‐milk intake: determined by the deuterium dose‐to‐the‐mother method. Measures of developmental and behavioural status: assessed at both 18 months and 30 ‐ 35 months with the Parent's Evaluation of Developmental Status (PEDS) questionnaire and the Brigance Screens‐II. The Jonsdottir trial retrospectively collected information on total duration of breastfeeding for all infants. However, we are unable to present these data as they were combined with data from an additional cohort of infants from a separate national prospective study. | |
| Notes | EBF: the use of up to 10 feedings of formula or water during the first 6 months was allowed to avoid having to exclude infants who were otherwise exclusively breastfed. Clinical Trial Registration: ISRCTN41946519. Study was supported by the Primary Health Care organizations in the Reykavik Capital area, Akranes, and Sudurnes, and by the Directors of the participating health centres. The study was supported by Mead Johnson and the Eimskip Fund for the University of Iceland. The sponsors of the study had no role in the study design, data collection, data analysis or interpretation, preparation of the report or the decision to submit for publication. None of the authors received honoraria, grants or other forms of payment to produce the manuscript. | |
| Risk of bias | ||
| Bias | Authors' judgement | Support for judgement |
| Random sequence generation (selection bias) | Low risk | The randomisation method was prepared using Jerry Dallal's Tufts‐based software, and the trial statistician prepared the provided a computer‐generated randomisation code. Assignments were generated by using permuted blocks of 2 and 4, with the sequence presented in random order. |
| Allocation concealment (selection bias) | Low risk | Assignments were accessed by using a password‐protected web‐based application, after eligibility criteria were confirmed. Assignments were generated by 1 person (a nurse) who was not involved in any other aspect of the study. |
| Blinding of outcome assessment (detection bias) | Low risk | Nurses who collected data on complementary food intakes and anthropometric outcomes were not blinded to participant group status, but all mass spectrometric analyses and isotopic modelling were blinded. |
| Incomplete outcome data (attrition bias) | Low risk | A total of 119 (n = 61 in CF group, n = 58 in EBF group) mother‐infant pairs were recruited, of whom 100 completed the trial protocol. CF Group 10 pairs discontinued the intervention (n = 3 infant did not receive complementary foods; n = 3 infant did not want solid food; n = 1 mother stopped breastfeeding; n = 2 mother did not have time to finish study; n = 1 mother not contacted after randomisation). EBF Group 9 pairs discontinued the intervention (n = 7 infant received complementary foods before 6 months; n = 1 mother wanted to leave study; n = 1 illness in family. Also, after randomisation, 1 mother who was randomly assigned to the CF group was incorrectly instructed to the EBF group. The primary analysis was conducted with this mother included in the EBF group (n = 50 EBF, 50 CF) but reported outcomes for the baseline analyses with the participant in the CF group (n = 49 EBF, 51 CF). The authors state that they were not able to test whether those who dropped out of the study were those with lower breast milk intakes ‐ i.e. potentially a self‐selected group. |
| Selective reporting (reporting bias) | High risk | In protocol states under secondary outcomes: "3. Occurrence of upper respiratory infections and diarrhoea episodes (dichotomous variables)". But in Wells paper states "Finally, our study was designed to evaluate growth and energy intake and not other issues such as development of dietary preferences, mineral status, or effects on health such as diarrhea and allergy". |
| Other bias | Low risk | Stated that the study sponsors (Mead Johnson and the Eimskip Fund of the University of Iceland) had no role in the study design; in the collection, analysis, and interpretation of data; in the writing of the report; or in the decision to submit the manuscript for publication. None of the authors declared a conflict of interest. |
| Methods | RCT. 2‐arm trial. Parallel design. | |
| Participants | Full‐term newborns weighing between 2599 g to 4000 g (n = 180). Vaginal deliveries only, who had no congenital abnormalities and who represented no risk factors for hypo‐ or hyperglycaemia. General Hospital, Teruel, Spain. | |
| Interventions | Group 1 called "glucose water" group (GW), received 5% glucose ad libitum from a bottle for the first 3 days of life in addition to breastfeeding. Group 2, the "non glucose water" group, was not given glucose water or any other type of alternative solution to human milk. | |
| Outcomes | Weight change (6, 12, 24, 48 and 72 hours of life). Serum glucose levels (6, 12, 24 and 48 hours of life). Rectal temperature (every 6 hours for the first 72 hours of life). The maximum and minimum values during period of observation were used in the final analysis). After discharge no contact for 5 months. Then telephone interview determined duration of exclusive breastfeeding, duration until introduction of infant formula, and duration until complete weaning were recorded. Time points of 4, 8, 12, 16 and 20 weeks were used. | |
| Notes | ||
| Risk of bias | ||
| Bias | Authors' judgement | Support for judgement |
| Random sequence generation (selection bias) | Unclear risk | "Divided randomly into 2 groups." |
| Allocation concealment (selection bias) | Unclear risk | Not discussed. |
| Blinding of outcome assessment (detection bias) | Unclear risk | No information available |
| Incomplete outcome data (attrition bias) | Low risk | N = 180 (90 in each group). 3 children from the non glucose water group and 7 from the glucose water group were ineligible because of missing data or because it was impossible to assure correct transcription of data. Therefore 10 excluded = 5.5%. |
| Selective reporting (reporting bias) | Unclear risk | Data on all the outcomes mentioned in the 'Methods' section of the published papers were reported. We did not retrieve the protocol or raw data of the trial and thus did not identify whether outcomes other than those reported within the published papers were collected but not reported on. |
| Other bias | Unclear risk | Some information on partial or exclusive breastfeeding was obtained via telephone conversations (maternal recall of illness symptoms) and this is open to recall bias. |
| Methods | RCT. 3‐arm trial. Parallel design. | |
| Participants | Primiparous mothers intending to breastfeed their full‐term infants. Intending to be in hospital (London, UK) for 5 days after delivery. 49 originally randomised. | |
| Interventions | 3 groups: water supplement (n = 14); glucose supplement (n = 17); no supplement (n = 16). | |
| Outcomes | Infant weight (day 1, 3 and 5). Plasma bilirubin (day 6). Volume of supplement taken per day per kilo of baby's birthweight (ml/kg/day). Average weight gain per breastfeed (mg/kg of baby's birthweight). | |
| Notes | ||
| Risk of bias | ||
| Bias | Authors' judgement | Support for judgement |
| Random sequence generation (selection bias) | Unclear risk | Described as "randomly allocated" to 1 of 3 groups (no supplement (n = 17); glucose supplement (n = 17), water supplement (n = 15)). |
| Allocation concealment (selection bias) | Unclear risk | Not discussed. |
| Blinding of outcome assessment (detection bias) | Unclear risk | No information available. |
| Incomplete outcome data (attrition bias) | Unclear risk | 4 mother/baby pairs defaulted from the 'no supplement' group because their babies were "too hungry" and were replaced by further randomised pairs. 2 infants were later excluded from the study because of: rhesus incompatibility (n = 1) and ABO incompatibility with positive haemolysins (n = 1). This reduced numbers in each group to: no supplement (n = 16); glucose supplement (n = 17); water supplement (n = 14). |
| Selective reporting (reporting bias) | Unclear risk | Data on all the outcomes mentioned in the 'Methods' section of the published papers were reported. We did not retrieve the protocol or raw data of the trial and thus did not identify whether outcomes other than those reported within the published papers were collected but not reported on. |
| Other bias | Low risk | No issues. |
| Methods | RCT. 2‐arm trial. Parallel design. | |
| Participants | 180 neonates delivered between October 1980 and January 1981 in 2 local maternity centres in Ile‐Ife, Oyo State, Nigeria were randomised. Criteria for selection were that birthweight be above 2.50 kg, no sign of congenital malformation, that mothers experienced uncomplicated birth with membrane rupture less than 24h prior to delivery, and no manifest sign of physical exhaustion or sickness after delivery to prevent them from performing their maternal responsibilities to the neonates. 105 kept strictly to instructions (60 (57%) on colostrum regimen and 45 (43%) on glucose water). | |
| Interventions | 1 group received glucose water feedings and the other colostrum. The mothers were told to keep strictly to these feeding regimens for the entire 3‐day stay at the maternity centre. | |
| Outcomes | Stool specimens (2 daily) analysed for bacterial counts. Bacterial counts in samples of colostrum and glucose water. | |
| Notes | Did not report any data that were eligible for inclusion in the review | |
| Risk of bias | ||
| Bias | Authors' judgement | Support for judgement |
| Random sequence generation (selection bias) | Unclear risk | "Randomly assigned at birth to two groups....". |
| Allocation concealment (selection bias) | Unclear risk | Not discussed. |
| Blinding of outcome assessment (detection bias) | Unclear risk | No information available |
| Incomplete outcome data (attrition bias) | High risk | Participation was voluntary, and those mothers who failed to adhere were excluded from the study. Of the 180 mothers chosen for the study, 105 kept strictly to the instructions. 60/105 were on the colostrum regimen (57%) and 45 were on glucose water (43%). |
| Selective reporting (reporting bias) | Unclear risk | Data on all the outcomes mentioned in the 'Methods' section of the published papers were reported. We did not retrieve the protocol or raw data of the trial and thus did not identify whether outcomes other than those reported within the published papers were collected but not reported on. |
| Other bias | Low risk | No issues. |
| Methods | RCT. 2‐arm trial. Parallel design. | |
| Participants | Healthy term neonates (n = 136) in the first 3 days after birth. 78 babies nursed exclusively on demand, and 58 babies received supplemental water in addition to on‐demand nursing. This study was performed in a maternity hospital in Philadelphia, Pennsylvania at which the patient population is highly motivated to breastfeed. | |
| Interventions | Exclusive on‐demand breastfeeding versus on‐demand nursing plus supplemental water. The choice of sterile water or 5 % glucose water was left to the mother. | |
| Outcomes | Mean total amount of water ingested by the supplemented group prior to the arrival of true milk. The time in hours when true milk first "came in" was recorded for each mother as it occurred. | |
| Notes | Did not report any data that were eligible for inclusion in the review | |
| Risk of bias | ||
| Bias | Authors' judgement | Support for judgement |
| Random sequence generation (selection bias) | Unclear risk | Not discussed. |
| Allocation concealment (selection bias) | Unclear risk | Not discussed. |
| Blinding of outcome assessment (detection bias) | Unclear risk | No information available. |
| Incomplete outcome data (attrition bias) | Unclear risk | No reference to dropouts reported. |
| Selective reporting (reporting bias) | Unclear risk | Data on all the outcomes mentioned in the 'Methods' section of the published papers were reported. We did not retrieve the protocol or raw data of the trial and thus did not identify whether outcomes other than those reported within the published papers were collected but not reported on. |
| Other bias | Low risk | No issues. |
BMI: body mass index
CF: complementary foods
EBF: exclusive breastfeeding
Hb: haemoglobin
Hct: haematocrit
MCV: mean corpuscular volume
min: minutes
RCT: randomised controlled trial
RDW: red blood cell distribution width
SF: solid food
SF‐M: solid foods and maintenance
TIBC: total iron‐binding capacity
Characteristics of excluded studies [ordered by study ID]
Jump to:
| Study | Reason for exclusion |
| No exclusively breastfed group. | |
| Pre‐term infants only (23 to 33 weeks). | |
| No exclusively breastfed group. | |
| No exclusively breastfed group. | |
| Not randomised or quasi‐randomised. Babies on 1 ward received water supplementation and those on another 2 wards did not. The admission of babies and mothers to the 3 wards was dependent upon availability, but not regarded as random allocation. | |
| Intervention was not the addition of foods/fluids. It was "to evaluate the efficacy of counselling about breastfeeding and complementary feeding in preventing the introduction of non‐breast milk and complementary foods in the first 6 months”. | |
| Mix of breastfeeding and artificial feeding. No exclusively breastfeeding group. Evaluating guidance on infant feeding behaviours. | |
| No exclusively breastfed group. | |
| Treatment group included pre‐term babies (36 to 42 weeks). | |
| No exclusively breastfed group. | |
| Infants were assigned at 5 months to receive 1 of 3 types of complementary foods. Not comparing exclusively breastfeeding under 6 months. | |
| No exclusively breastfed group. | |
| Preterm infants only (34 weeks or less). | |
| Treatment group included preterm babies (32 to 37 weeks). | |
| Infants were assigned at 6 months to receive 1 of 2 types of complementary feeding. Not comparing exclusively breastfeeding under 6 months. | |
| No exclusively breastfed group. | |
| No exclusively breastfed group. | |
| No exclusively breastfed group. | |
| Observational study comparing 2 formula groups. | |
| No exclusively breastfed group. | |
| No exclusively breastfed group. | |
| No exclusively breastfed group. | |
| Review of three studies of the research group comparing 2 types a cereal introduced at 4 months. No exclusive breastfeeding group. |
Characteristics of ongoing studies [ordered by study ID]
Jump to:
| Trial name or title | Randomised controlled trial of early introduction of allergenic foods to induce tolerance in infants (EAT Trial). |
| Methods | Randomised controlled multi‐centre trial. |
| Participants | Target: 3000 pregnant women (2500 infants). Inclusion: 1. Pregnant mothers attending their 12/20 week ultrasound scans. Exclusion: 1. Significant antenatal anomaly at 20 week ultrasound scan. |
| Interventions | The intervention arm consists of the dietetic controlled introduction of allergenic foods from 3 months of age. Baby rice mixed with breast milk or water will be commenced first, followed by cow's milk based yogurt. Subsequently egg, wheat, sesame, fish and peanut will be sequentially introduced into the diet in high doses with each food being ingested 2 times a week achieving a total ingestion of 4 g or more per week of each food protein by 5 months of age. |
| Outcomes | Primary: the period prevalence of IgE mediated food allergy to the 6 intervention foods between 1 and 3 years of age in both arms. Secomdary: many, related to allergic disease outcomes. |
| Starting date | Anticipated start 02 February 2009, end 31 July 2014. |
| Contact information | Prof Gideon Lack, Children's Allergies Department |
| Notes | ISRCTN14254740 Last edited 29 July 2009 |
| Trial name or title | Effect of early limited formula on total serum bilirubin among newborns with hyperbilirubinaemia. |
| Methods | Allocation: randomised. |
| Participants | Estimated enrolment : 30. Inclusion criteria
Exclusion Criteria: infants who have already received formula Infants who have received or are receiving Level II or Level III Infants who have already lost ≥ 10% birthweight infants with glucose‐6‐phosphate dehydrogenase deficiency, positive direct antigen testing, cephalohematoma or other extensive bruising. |
| Interventions | Experimental: formula supplementation. Participants will supplement feedings with early limited formula following nursing. Intervention: dietary supplement: Nutramigen Infant Formula. No Intervention: control. Participants will be instructed to continue exclusively breastfeeding with no formula supplementation. |
| Outcomes | Primary outcome: total serum bilirubin. Secondary clinical outcomes: phototherapy, hospital readmission, exclusive and partial breastfeeding at 1 week, 1 month, 2 months, and 3 months; breastfeeding self‐efficacy. |
| Starting date | |
| Contact information | Flaherman V. University of California, San Francisco. |
| Notes | NCT01330667. Last updated May 21, 2013, due to start recruitment December 2013. |
AAO: American Academy of Pediatrics
PT: phototherapy
TSB: total serum bilirubin
Data and analyses
| Outcome or subgroup title | No. of studies | No. of participants | Statistical method | Effect size |
| 1 Breastfeeding duration Show forest plot | 1 | Risk Ratio (M‐H, Fixed, 95% CI) | Subtotals only | |
| Analysis 1.1  Comparison 1 Exclusive breastfed infants versus non‐exclusive breastfed infants (artificial milk), Outcome 1 Breastfeeding duration. | ||||
| 1.1 Exclusive breastfeeding at 1 week | 1 | 39 | Risk Ratio (M‐H, Fixed, 95% CI) | 0.58 [0.37, 0.92] |
| 1.2 Exclusive breastfeeding at 3 months | 1 | 38 | Risk Ratio (M‐H, Fixed, 95% CI) | 0.44 [0.26, 0.76] |
| 1.3 Any breastfeeding at 3 months | 1 | 37 | Risk Ratio (M‐H, Fixed, 95% CI) | 0.76 [0.56, 1.03] |
| 2 Incidence of fever Show forest plot | 1 | 38 | Risk Ratio (M‐H, Fixed, 95% CI) | 1.5 [0.28, 7.99] |
| Analysis 1.2 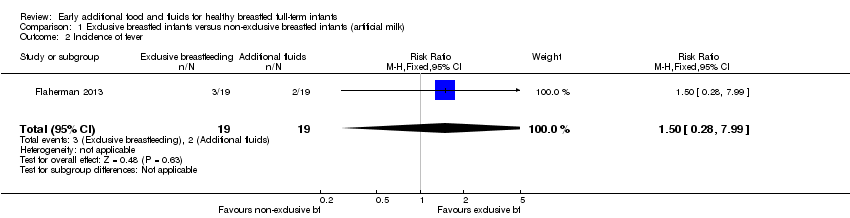 Comparison 1 Exclusive breastfed infants versus non‐exclusive breastfed infants (artificial milk), Outcome 2 Incidence of fever. | ||||
| 3 Maternal self‐confidence Show forest plot | 1 | 39 | Mean Difference (IV, Fixed, 95% CI) | 0.10 [‐0.34, 0.54] |
| Analysis 1.3 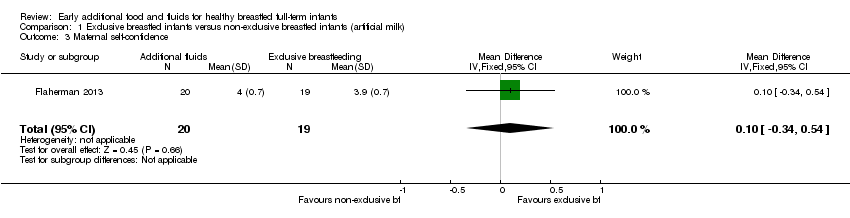 Comparison 1 Exclusive breastfed infants versus non‐exclusive breastfed infants (artificial milk), Outcome 3 Maternal self‐confidence. | ||||
| Outcome or subgroup title | No. of studies | No. of participants | Statistical method | Effect size |
| 1 Breastfeeding duration Show forest plot | 1 | Risk Ratio (M‐H, Fixed, 95% CI) | Subtotals only | |
| Analysis 2.1  Comparison 2 Exclusive breastfed infants versus non‐exclusive breastfed infants (water), Outcome 1 Breastfeeding duration. | ||||
| 1.1 At 4 weeks | 1 | 170 | Risk Ratio (M‐H, Fixed, 95% CI) | 1.21 [1.06, 1.38] |
| 1.2 At 8 weeks | 1 | 170 | Risk Ratio (M‐H, Fixed, 95% CI) | 1.26 [1.04, 1.53] |
| 1.3 At 12 weeks | 1 | 170 | Risk Ratio (M‐H, Fixed, 95% CI) | 1.48 [1.16, 1.89] |
| 1.4 At 16 weeks | 1 | 170 | Risk Ratio (M‐H, Fixed, 95% CI) | 1.54 [1.15, 2.05] |
| 1.5 At 20 weeks | 1 | 170 | Risk Ratio (M‐H, Fixed, 95% CI) | 1.45 [1.05, 1.99] |
| 2 Maximum temperature (ºC) Show forest plot | 1 | Mean Difference (IV, Fixed, 95% CI) | Subtotals only | |
| Analysis 2.2  Comparison 2 Exclusive breastfed infants versus non‐exclusive breastfed infants (water), Outcome 2 Maximum temperature (ºC). | ||||
| 2.1 At 72 hours | 1 | 170 | Mean Difference (IV, Fixed, 95% CI) | 0.10 [0.01, 0.19] |
| 3 Minimum temperature (ºC) Show forest plot | 1 | Mean Difference (IV, Fixed, 95% CI) | Subtotals only | |
| Analysis 2.3  Comparison 2 Exclusive breastfed infants versus non‐exclusive breastfed infants (water), Outcome 3 Minimum temperature (ºC). | ||||
| 3.1 At 72 hours | 1 | 170 | Mean Difference (IV, Fixed, 95% CI) | 0.10 [0.02, 0.18] |
| 4 Episodes of hypoglycaemia (glycaemia < 2.2 mmol/l) Show forest plot | 1 | Risk Ratio (M‐H, Fixed, 95% CI) | Subtotals only | |
| Analysis 2.4 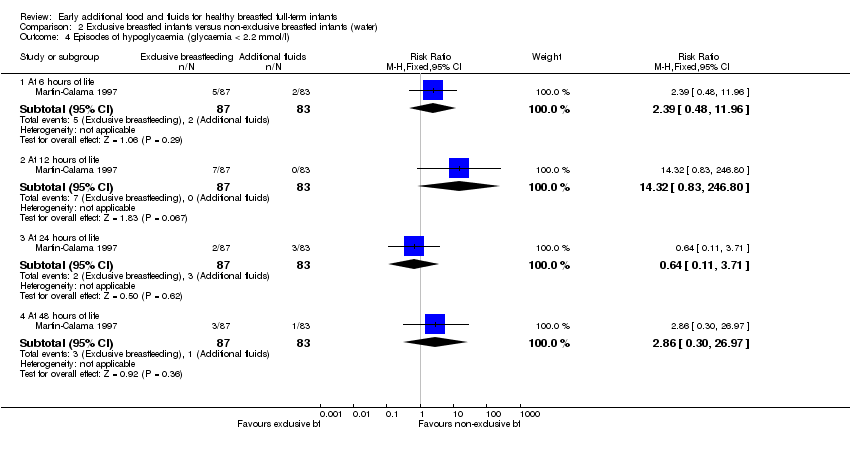 Comparison 2 Exclusive breastfed infants versus non‐exclusive breastfed infants (water), Outcome 4 Episodes of hypoglycaemia (glycaemia < 2.2 mmol/l). | ||||
| 4.1 At 6 hours of life | 1 | 170 | Risk Ratio (M‐H, Fixed, 95% CI) | 2.39 [0.48, 11.96] |
| 4.2 At 12 hours of life | 1 | 170 | Risk Ratio (M‐H, Fixed, 95% CI) | 14.32 [0.83, 246.80] |
| 4.3 At 24 hours of life | 1 | 170 | Risk Ratio (M‐H, Fixed, 95% CI) | 0.64 [0.11, 3.71] |
| 4.4 At 48 hours of life | 1 | 170 | Risk Ratio (M‐H, Fixed, 95% CI) | 2.86 [0.30, 26.97] |
| 5 Mean capillary blood glucose levels of infants (mmol/l) Show forest plot | 1 | Mean Difference (IV, Fixed, 95% CI) | Subtotals only | |
| Analysis 2.5  Comparison 2 Exclusive breastfed infants versus non‐exclusive breastfed infants (water), Outcome 5 Mean capillary blood glucose levels of infants (mmol/l). | ||||
| 5.1 At 6 hours of life | 1 | 170 | Mean Difference (IV, Fixed, 95% CI) | ‐0.29 [‐0.56, ‐0.02] |
| 5.2 At 12 hours of life | 1 | 170 | Mean Difference (IV, Fixed, 95% CI) | ‐0.47 [‐0.70, ‐0.24] |
| 5.3 At 24 hours of life | 1 | 170 | Mean Difference (IV, Fixed, 95% CI) | ‐0.34 [‐0.60, ‐0.08] |
| 5.4 At 48 hours of life | 1 | 170 | Mean Difference (IV, Fixed, 95% CI) | ‐0.24 [‐0.51, 0.03] |
| 6 Weight change (g) Show forest plot | 1 | Mean Difference (IV, Fixed, 95% CI) | Subtotals only | |
| Analysis 2.6  Comparison 2 Exclusive breastfed infants versus non‐exclusive breastfed infants (water), Outcome 6 Weight change (g). | ||||
| 6.1 At 6 hours of life | 1 | 170 | Mean Difference (IV, Fixed, 95% CI) | 7.0 [0.76, 13.24] |
| 6.2 At 12 hours of life | 1 | 170 | Mean Difference (IV, Fixed, 95% CI) | 11.5 [1.71, 21.29] |
| 6.3 At 24 hours of life | 1 | 170 | Mean Difference (IV, Fixed, 95% CI) | 13.40 [0.43, 26.37] |
| 6.4 At 48 hours of life | 1 | 170 | Mean Difference (IV, Fixed, 95% CI) | 32.5 [12.91, 52.09] |
| 6.5 At 72 hours of life | 1 | 170 | Mean Difference (IV, Fixed, 95% CI) | ‐3.0 [‐26.83, 20.83] |
| 7 Weight loss (%) Show forest plot | 1 | Mean Difference (IV, Fixed, 95% CI) | Subtotals only | |
| Analysis 2.7 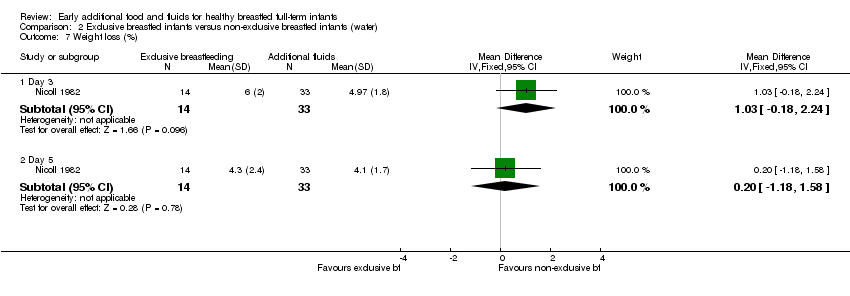 Comparison 2 Exclusive breastfed infants versus non‐exclusive breastfed infants (water), Outcome 7 Weight loss (%). | ||||
| 7.1 Day 3 | 1 | 47 | Mean Difference (IV, Fixed, 95% CI) | 1.03 [‐0.18, 2.24] |
| 7.2 Day 5 | 1 | 47 | Mean Difference (IV, Fixed, 95% CI) | 0.20 [‐1.18, 1.58] |
| 8 Maximum serum bilirubin levels umol/L Show forest plot | 1 | Mean Difference (IV, Fixed, 95% CI) | Subtotals only | |
| Analysis 2.8 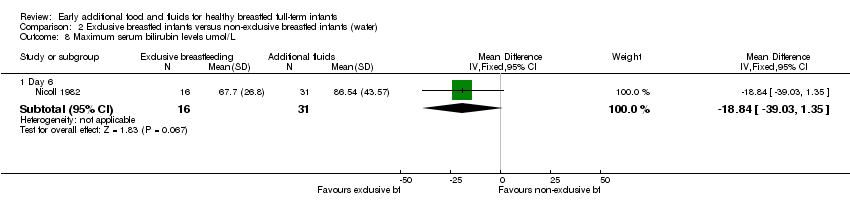 Comparison 2 Exclusive breastfed infants versus non‐exclusive breastfed infants (water), Outcome 8 Maximum serum bilirubin levels umol/L. | ||||
| 8.1 Day 6 | 1 | 47 | Mean Difference (IV, Fixed, 95% CI) | ‐18.84 [‐39.03, 1.35] |
| Outcome or subgroup title | No. of studies | No. of participants | Statistical method | Effect size |
| 1 Fever (% of days) Show forest plot | 1 | Mean Difference (IV, Fixed, 95% CI) | Totals not selected | |
| Analysis 3.1  Comparison 3 Exclusive breastfed infants versus non‐exclusive breastfed infants (foods), Outcome 1 Fever (% of days). | ||||
| 1.1 4 to 6 months | 1 | Mean Difference (IV, Fixed, 95% CI) | 0.0 [0.0, 0.0] | |
| 2 Cough (% of days) Show forest plot | 1 | Mean Difference (IV, Fixed, 95% CI) | Totals not selected | |
| Analysis 3.2  Comparison 3 Exclusive breastfed infants versus non‐exclusive breastfed infants (foods), Outcome 2 Cough (% of days). | ||||
| 2.1 At 4 to 6 months | 1 | Mean Difference (IV, Fixed, 95% CI) | 0.0 [0.0, 0.0] | |
| 3 Congestion (% of days) Show forest plot | 1 | Mean Difference (IV, Fixed, 95% CI) | Totals not selected | |
| Analysis 3.3  Comparison 3 Exclusive breastfed infants versus non‐exclusive breastfed infants (foods), Outcome 3 Congestion (% of days). | ||||
| 3.1 At 4 to 6 months | 1 | Mean Difference (IV, Fixed, 95% CI) | 0.0 [0.0, 0.0] | |
| 4 Nasal discharge (% of days) Show forest plot | 1 | Mean Difference (IV, Fixed, 95% CI) | Totals not selected | |
| Analysis 3.4  Comparison 3 Exclusive breastfed infants versus non‐exclusive breastfed infants (foods), Outcome 4 Nasal discharge (% of days). | ||||
| 4.1 At 4 to 6 months | 1 | Mean Difference (IV, Fixed, 95% CI) | 0.0 [0.0, 0.0] | |
| 5 Hoarseness (% of days) Show forest plot | 1 | Mean Difference (IV, Fixed, 95% CI) | Totals not selected | |
| Analysis 3.5  Comparison 3 Exclusive breastfed infants versus non‐exclusive breastfed infants (foods), Outcome 5 Hoarseness (% of days). | ||||
| 5.1 At 4 to 6 months | 1 | Mean Difference (IV, Fixed, 95% CI) | 0.0 [0.0, 0.0] | |
| 6 Weight change (g) Show forest plot | 2 | 260 | Mean Difference (IV, Fixed, 95% CI) | 39.48 [‐49.48, 128.43] |
| Analysis 3.6 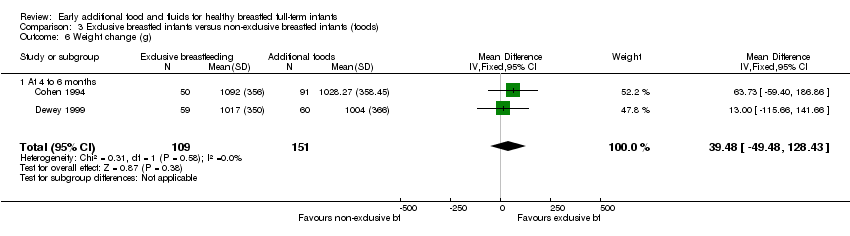 Comparison 3 Exclusive breastfed infants versus non‐exclusive breastfed infants (foods), Outcome 6 Weight change (g). | ||||
| 6.1 At 4 to 6 months | 2 | 260 | Mean Difference (IV, Fixed, 95% CI) | 39.48 [‐49.48, 128.43] |
| 7 Weight change (z score) Show forest plot | 1 | Mean Difference (IV, Fixed, 95% CI) | Totals not selected | |
| Analysis 3.7  Comparison 3 Exclusive breastfed infants versus non‐exclusive breastfed infants (foods), Outcome 7 Weight change (z score). | ||||
| 7.1 4 to 6 months | 1 | Mean Difference (IV, Fixed, 95% CI) | 0.0 [0.0, 0.0] | |

Methodological quality graph: review authors' judgements about each methodological quality item presented as percentages across all included studies.

'Risk of bias' summary: review authors' judgements about each risk of bias item for each included study.
Comparison 1 Exclusive breastfed infants versus non‐exclusive breastfed infants (artificial milk), Outcome 1 Breastfeeding duration.
Comparison 1 Exclusive breastfed infants versus non‐exclusive breastfed infants (artificial milk), Outcome 2 Incidence of fever.
Comparison 1 Exclusive breastfed infants versus non‐exclusive breastfed infants (artificial milk), Outcome 3 Maternal self‐confidence.
Comparison 2 Exclusive breastfed infants versus non‐exclusive breastfed infants (water), Outcome 1 Breastfeeding duration.
Comparison 2 Exclusive breastfed infants versus non‐exclusive breastfed infants (water), Outcome 2 Maximum temperature (ºC).
Comparison 2 Exclusive breastfed infants versus non‐exclusive breastfed infants (water), Outcome 3 Minimum temperature (ºC).
Comparison 2 Exclusive breastfed infants versus non‐exclusive breastfed infants (water), Outcome 4 Episodes of hypoglycaemia (glycaemia < 2.2 mmol/l).
Comparison 2 Exclusive breastfed infants versus non‐exclusive breastfed infants (water), Outcome 5 Mean capillary blood glucose levels of infants (mmol/l).
Comparison 2 Exclusive breastfed infants versus non‐exclusive breastfed infants (water), Outcome 6 Weight change (g).
Comparison 2 Exclusive breastfed infants versus non‐exclusive breastfed infants (water), Outcome 7 Weight loss (%).
Comparison 2 Exclusive breastfed infants versus non‐exclusive breastfed infants (water), Outcome 8 Maximum serum bilirubin levels umol/L.
Comparison 3 Exclusive breastfed infants versus non‐exclusive breastfed infants (foods), Outcome 1 Fever (% of days).
Comparison 3 Exclusive breastfed infants versus non‐exclusive breastfed infants (foods), Outcome 2 Cough (% of days).
Comparison 3 Exclusive breastfed infants versus non‐exclusive breastfed infants (foods), Outcome 3 Congestion (% of days).
Comparison 3 Exclusive breastfed infants versus non‐exclusive breastfed infants (foods), Outcome 4 Nasal discharge (% of days).
Comparison 3 Exclusive breastfed infants versus non‐exclusive breastfed infants (foods), Outcome 5 Hoarseness (% of days).
Comparison 3 Exclusive breastfed infants versus non‐exclusive breastfed infants (foods), Outcome 6 Weight change (g).
Comparison 3 Exclusive breastfed infants versus non‐exclusive breastfed infants (foods), Outcome 7 Weight change (z score).
| % of mothers who continued either exclusive or partial breastfeeding | Exclusive breastfeeding on day 1‐3 group (non‐glucose water) (n = 87) | Glucose water on day 1‐3 (n = 83) |
| At 4 weeks | 93% | 77% |
| At 8 weeks | 81% | 64% |
| At 12 weeks | 75% | 51% |
| At 16 weeks | 67% | 43% |
| At 20 weeks | 57% | 40% |
| These figures were estimated from a graph (Figure 2) on page 212 of the Martin‐Calama 1997 paper. | ||
| Outcome or subgroup title | No. of studies | No. of participants | Statistical method | Effect size |
| 1 Breastfeeding duration Show forest plot | 1 | Risk Ratio (M‐H, Fixed, 95% CI) | Subtotals only | |
| 1.1 Exclusive breastfeeding at 1 week | 1 | 39 | Risk Ratio (M‐H, Fixed, 95% CI) | 0.58 [0.37, 0.92] |
| 1.2 Exclusive breastfeeding at 3 months | 1 | 38 | Risk Ratio (M‐H, Fixed, 95% CI) | 0.44 [0.26, 0.76] |
| 1.3 Any breastfeeding at 3 months | 1 | 37 | Risk Ratio (M‐H, Fixed, 95% CI) | 0.76 [0.56, 1.03] |
| 2 Incidence of fever Show forest plot | 1 | 38 | Risk Ratio (M‐H, Fixed, 95% CI) | 1.5 [0.28, 7.99] |
| 3 Maternal self‐confidence Show forest plot | 1 | 39 | Mean Difference (IV, Fixed, 95% CI) | 0.10 [‐0.34, 0.54] |
| Outcome or subgroup title | No. of studies | No. of participants | Statistical method | Effect size |
| 1 Breastfeeding duration Show forest plot | 1 | Risk Ratio (M‐H, Fixed, 95% CI) | Subtotals only | |
| 1.1 At 4 weeks | 1 | 170 | Risk Ratio (M‐H, Fixed, 95% CI) | 1.21 [1.06, 1.38] |
| 1.2 At 8 weeks | 1 | 170 | Risk Ratio (M‐H, Fixed, 95% CI) | 1.26 [1.04, 1.53] |
| 1.3 At 12 weeks | 1 | 170 | Risk Ratio (M‐H, Fixed, 95% CI) | 1.48 [1.16, 1.89] |
| 1.4 At 16 weeks | 1 | 170 | Risk Ratio (M‐H, Fixed, 95% CI) | 1.54 [1.15, 2.05] |
| 1.5 At 20 weeks | 1 | 170 | Risk Ratio (M‐H, Fixed, 95% CI) | 1.45 [1.05, 1.99] |
| 2 Maximum temperature (ºC) Show forest plot | 1 | Mean Difference (IV, Fixed, 95% CI) | Subtotals only | |
| 2.1 At 72 hours | 1 | 170 | Mean Difference (IV, Fixed, 95% CI) | 0.10 [0.01, 0.19] |
| 3 Minimum temperature (ºC) Show forest plot | 1 | Mean Difference (IV, Fixed, 95% CI) | Subtotals only | |
| 3.1 At 72 hours | 1 | 170 | Mean Difference (IV, Fixed, 95% CI) | 0.10 [0.02, 0.18] |
| 4 Episodes of hypoglycaemia (glycaemia < 2.2 mmol/l) Show forest plot | 1 | Risk Ratio (M‐H, Fixed, 95% CI) | Subtotals only | |
| 4.1 At 6 hours of life | 1 | 170 | Risk Ratio (M‐H, Fixed, 95% CI) | 2.39 [0.48, 11.96] |
| 4.2 At 12 hours of life | 1 | 170 | Risk Ratio (M‐H, Fixed, 95% CI) | 14.32 [0.83, 246.80] |
| 4.3 At 24 hours of life | 1 | 170 | Risk Ratio (M‐H, Fixed, 95% CI) | 0.64 [0.11, 3.71] |
| 4.4 At 48 hours of life | 1 | 170 | Risk Ratio (M‐H, Fixed, 95% CI) | 2.86 [0.30, 26.97] |
| 5 Mean capillary blood glucose levels of infants (mmol/l) Show forest plot | 1 | Mean Difference (IV, Fixed, 95% CI) | Subtotals only | |
| 5.1 At 6 hours of life | 1 | 170 | Mean Difference (IV, Fixed, 95% CI) | ‐0.29 [‐0.56, ‐0.02] |
| 5.2 At 12 hours of life | 1 | 170 | Mean Difference (IV, Fixed, 95% CI) | ‐0.47 [‐0.70, ‐0.24] |
| 5.3 At 24 hours of life | 1 | 170 | Mean Difference (IV, Fixed, 95% CI) | ‐0.34 [‐0.60, ‐0.08] |
| 5.4 At 48 hours of life | 1 | 170 | Mean Difference (IV, Fixed, 95% CI) | ‐0.24 [‐0.51, 0.03] |
| 6 Weight change (g) Show forest plot | 1 | Mean Difference (IV, Fixed, 95% CI) | Subtotals only | |
| 6.1 At 6 hours of life | 1 | 170 | Mean Difference (IV, Fixed, 95% CI) | 7.0 [0.76, 13.24] |
| 6.2 At 12 hours of life | 1 | 170 | Mean Difference (IV, Fixed, 95% CI) | 11.5 [1.71, 21.29] |
| 6.3 At 24 hours of life | 1 | 170 | Mean Difference (IV, Fixed, 95% CI) | 13.40 [0.43, 26.37] |
| 6.4 At 48 hours of life | 1 | 170 | Mean Difference (IV, Fixed, 95% CI) | 32.5 [12.91, 52.09] |
| 6.5 At 72 hours of life | 1 | 170 | Mean Difference (IV, Fixed, 95% CI) | ‐3.0 [‐26.83, 20.83] |
| 7 Weight loss (%) Show forest plot | 1 | Mean Difference (IV, Fixed, 95% CI) | Subtotals only | |
| 7.1 Day 3 | 1 | 47 | Mean Difference (IV, Fixed, 95% CI) | 1.03 [‐0.18, 2.24] |
| 7.2 Day 5 | 1 | 47 | Mean Difference (IV, Fixed, 95% CI) | 0.20 [‐1.18, 1.58] |
| 8 Maximum serum bilirubin levels umol/L Show forest plot | 1 | Mean Difference (IV, Fixed, 95% CI) | Subtotals only | |
| 8.1 Day 6 | 1 | 47 | Mean Difference (IV, Fixed, 95% CI) | ‐18.84 [‐39.03, 1.35] |
| Outcome or subgroup title | No. of studies | No. of participants | Statistical method | Effect size |
| 1 Fever (% of days) Show forest plot | 1 | Mean Difference (IV, Fixed, 95% CI) | Totals not selected | |
| 1.1 4 to 6 months | 1 | Mean Difference (IV, Fixed, 95% CI) | 0.0 [0.0, 0.0] | |
| 2 Cough (% of days) Show forest plot | 1 | Mean Difference (IV, Fixed, 95% CI) | Totals not selected | |
| 2.1 At 4 to 6 months | 1 | Mean Difference (IV, Fixed, 95% CI) | 0.0 [0.0, 0.0] | |
| 3 Congestion (% of days) Show forest plot | 1 | Mean Difference (IV, Fixed, 95% CI) | Totals not selected | |
| 3.1 At 4 to 6 months | 1 | Mean Difference (IV, Fixed, 95% CI) | 0.0 [0.0, 0.0] | |
| 4 Nasal discharge (% of days) Show forest plot | 1 | Mean Difference (IV, Fixed, 95% CI) | Totals not selected | |
| 4.1 At 4 to 6 months | 1 | Mean Difference (IV, Fixed, 95% CI) | 0.0 [0.0, 0.0] | |
| 5 Hoarseness (% of days) Show forest plot | 1 | Mean Difference (IV, Fixed, 95% CI) | Totals not selected | |
| 5.1 At 4 to 6 months | 1 | Mean Difference (IV, Fixed, 95% CI) | 0.0 [0.0, 0.0] | |
| 6 Weight change (g) Show forest plot | 2 | 260 | Mean Difference (IV, Fixed, 95% CI) | 39.48 [‐49.48, 128.43] |
| 6.1 At 4 to 6 months | 2 | 260 | Mean Difference (IV, Fixed, 95% CI) | 39.48 [‐49.48, 128.43] |
| 7 Weight change (z score) Show forest plot | 1 | Mean Difference (IV, Fixed, 95% CI) | Totals not selected | |
| 7.1 4 to 6 months | 1 | Mean Difference (IV, Fixed, 95% CI) | 0.0 [0.0, 0.0] | |