Interventions to prevent injuries in construction workers
Information
- DOI:
- https://doi.org/10.1002/14651858.CD006251.pub4Copy DOI

- Database:
-
- Cochrane Database of Systematic Reviews
- Version published:
-
- 05 February 2018see what's new
- Type:
-
- Intervention
- Stage:
-
- Review
- Cochrane Editorial Group:
-
Cochrane Work Group
- Copyright:
-
- Copyright © 2018 The Cochrane Collaboration. Published by John Wiley & Sons, Ltd.
Article metrics
Altmetric:
Cited by:
Authors
Contributions of authors
Henk van der Molen was involved in designing the study protocol, inclusion of studies, data extraction and writing the review.
Jos Verbeek designed and performed the data‐analysis and was involved in writing the review.
Prativa Basnet was involved in screening the references, inclusion of studies, data extraction and writing of the second update of this review.
Peter Hoonakker, Marika Lehtola, Jorma Lappalainen, Roger Haslam commented on all drafts of the review and assisted with the data collection. In the first review, Marika Lehtola was involved in the conception of the protocol, designing and running the searches, the inclusion of studies and the data extraction.
Monique Frings‐Dresen commented on the draft of the the two updates of the review.
Andrew Hale and Hongwei Hsiao are acknowledged for their contributions up to the first update of the review.
Sources of support
Internal sources
-
Cochrane Work, Finland.
-
Finnish Institute of Occupational Health, Finland.
-
Coronel Institute of Occupational Health, Academic Medical Centre, Universiteit van Amsterdam, Netherlands.
External sources
-
The office of the Australian Federal Safety Commissioner of the Commonwealth of Australia, Australia.
Financial support for the first version of the review
-
Stichting Arbouw, Netherlands.
Financial support for the update of the review
Declarations of interest
Henk F van der Molen: None known.
Prativa Basnet: None known.
Peter LT Hoonakker: None known.
Marika M Lehtola: None known.
Jorma Lappalainen: None known.
Monique HW Frings‐Dresen: None known.
Roger Haslam: None known.
Jos H Verbeek: None known.
Acknowledgements
We thank the Commonwealth of Australia, as represented by the Office of the Australian Federal Safety Commissioner is the direct supporter at the Department of Employment and Workplace Relations (DEWR), for their financial support for the first version of this review. The Federal Safety Commissioner is responsible for promoting and improving occupational health and safety on Australian Government construction projects.
For the 2012 update, we would like to acknowledge the financial support received from Stichting Arbouw in the Netherlands.
Merja Jauhiainen and Leena Isotalo from Cochrane Work developed the systematic search strategies and ran them in electronic databases up to the 2012 update. In 2017 Heikki Laitinen and Kaisa Hartikainen from the library of the University of Eastern Finland adjusted and reran the systematic search strategies. The Cochrane Injuries Group Managing Editor Katharine Ker helped with the injury definitions, and the Trials Search Co‐ordinator, Karen Blackhall, with the development of the first search strategy. Vasiliy V Vlassov, Stefano Mattioli and Donatella Placidi helped by assessing the eligibility of the foreign language articles.
We thank Meggan Harris and Jani Ruotsalainen for copy editing the text.
Version history
| Published | Title | Stage | Authors | Version |
| 2018 Feb 05 | Interventions to prevent injuries in construction workers | Review | Henk F van der Molen, Prativa Basnet, Peter LT Hoonakker, Marika M Lehtola, Jorma Lappalainen, Monique HW Frings‐Dresen, Roger Haslam, Jos H Verbeek | |
| 2012 Dec 12 | Interventions to prevent injuries in construction workers | Review | Henk F van der Molen, Marika M Lehtola, Jorma Lappalainen, Peter LT Hoonakker, Hongwei Hsiao, Roger Haslam, Andrew R Hale, Monique HW Frings‐Dresen, Jos H Verbeek | |
| 2007 Oct 17 | Interventions for preventing injuries in the construction industry | Review | Henk F van der Molen, Marika M Lehtola, Jorma Lappalainen, Peter LT Hoonakker, Hongwei Hsiao, Roger Haslam, Andrew R Hale, Jos H Verbeek | |
| 2006 Oct 18 | Interventions for preventing injuries in the construction industry | Protocol | Henk van der Molen, Marika M Lehtola, Jorma Lappalainen, Peter LT Hoonakker, Hongwei Hsiao, Roger Haslam, Andrew R Hale, Jos H Verbeek | |
Differences between protocol and review
In the first update of this review we refrained from using the levels of evidence system for synthesising study results because we could use all results for meta‐analysis, and the levels of evidence system can produce misleading results, especially in the event of non‐significant results (Verbeek 2011).
Keywords
MeSH
Medical Subject Headings (MeSH) Keywords
- *Construction Industry [legislation & jurisprudence, statistics & numerical data];
- Accidents, Occupational [legislation & jurisprudence, mortality, *prevention & control];
- Controlled Before‐After Studies;
- Interrupted Time Series Analysis;
- Occupational Health [legislation & jurisprudence];
- Occupational Injuries [mortality, *prevention & control];
Medical Subject Headings Check Words
Humans;
PICOs

PRISMA Study flow diagram (* numbers of 2017 update)

Comparison 1 Introduction of regulation (ITS), Outcome 1 Level.
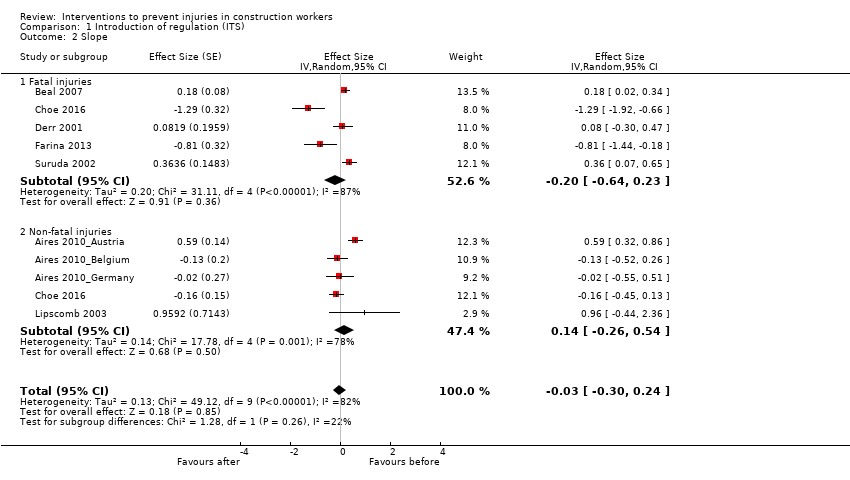
Comparison 1 Introduction of regulation (ITS), Outcome 2 Slope.

Comparison 2 Inspections (ITS), Outcome 1 Level: non‐fatal injuries.
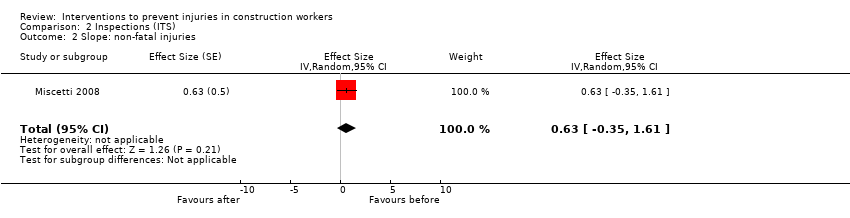
Comparison 2 Inspections (ITS), Outcome 2 Slope: non‐fatal injuries.
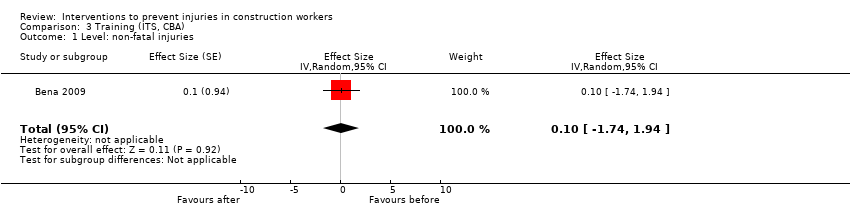
Comparison 3 Training (ITS, CBA), Outcome 1 Level: non‐fatal injuries.

Comparison 3 Training (ITS, CBA), Outcome 2 Slope: non‐fatal injuries.
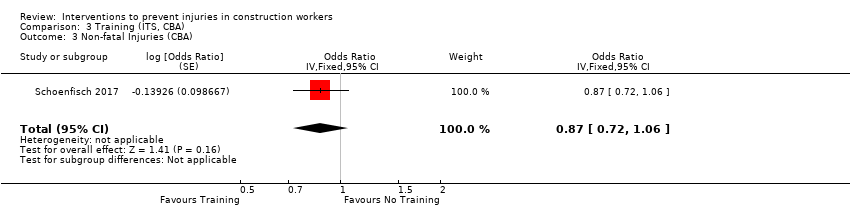
Comparison 3 Training (ITS, CBA), Outcome 3 Non‐fatal Injuries (CBA).
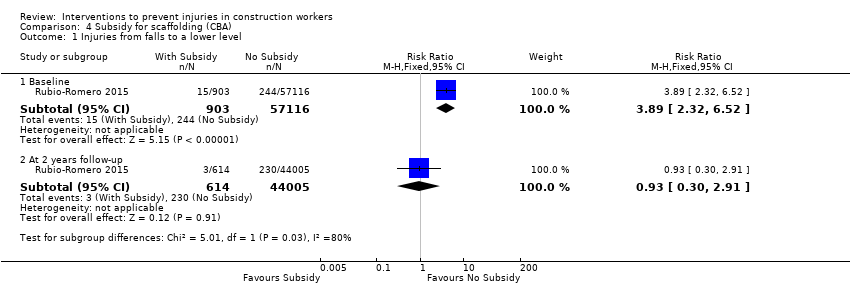
Comparison 4 Subsidy for scaffolding (CBA), Outcome 1 Injuries from falls to a lower level.

Comparison 5 Safety campaign (ITS), Outcome 1 Level: non‐fatal injuries.
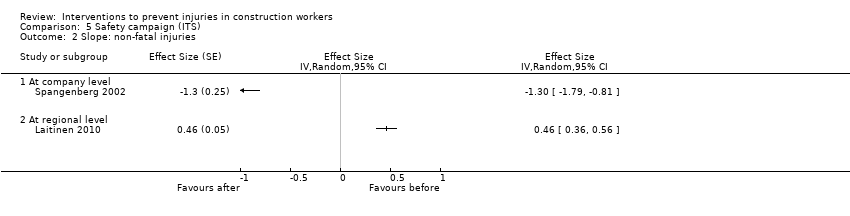
Comparison 5 Safety campaign (ITS), Outcome 2 Slope: non‐fatal injuries.
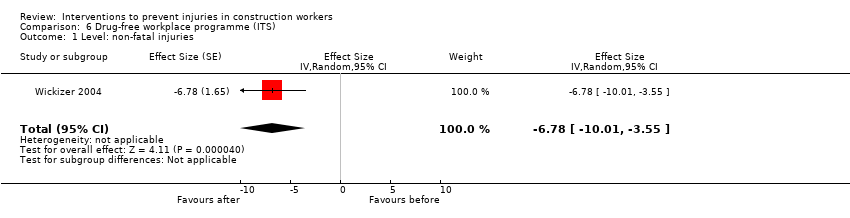
Comparison 6 Drug‐free workplace programme (ITS), Outcome 1 Level: non‐fatal injuries.

Comparison 6 Drug‐free workplace programme (ITS), Outcome 2 Slope: non‐fatal injuries.
| Regulations versus no regulations for reducing injuries in the construction industry | |||
| Patient or population: workers in various occupations Settings: construction Industry Intervention: legislation Comparison: no legislation | |||
| Outcomes | Impact a (95% CI) | No. of studies | Quality of the evidence |
| Fatal injuries Change in level | Effect size −0.13 (−1.51 to 1.25) | 5 ITS | ⊕⊝⊝⊝ |
| Fatal injuries Change in slope | Effect size −0.20 (−0.64 to 0.23) | 5 ITS | ⊕⊝⊝⊝ |
| Non‐fatal injuries Change in level | Effect size −0.44 (−3.70 to 2.83) | 5 ITS | ⊕⊝⊝⊝ |
| Non‐fatal injuries Change in slope | Effect size 0.14 (−0.26 to 0.54) | 5 ITS | ⊕⊝⊝⊝ |
| CI: confidence interval;ITS: interrupted time series. GRADE Working Group grades of evidence | |||
| aEffect size can be interpreted as follows: < 0.2: small effect, 0.2‐0.8 moderate effect, > 0.8: large effect; negative sign means decrease in injuries. | |||
| Safety campaign versus no campaign for reducing injuries in construction industry | |||
| Patient or population: workers in various occupations Settings: construction Industry Intervention: safety campaign Comparison: no campaign | |||
| Outcomes | Impacta (95% CI) | No. of studies | Quality of the evidence |
| Fatal injuries | No available data | ||
| Non‐fatal injuries Change in level (company) | Effect size −1.82 (−2.90 to 0.74) | 1 ITS | ⊕⊝⊝⊝ |
| Non‐fatal injuries Change in slope (company) | Effect size −1.30 (−1.79 to −0.81) | 1 ITS | ⊕⊝⊝⊝ |
| Non‐fatal injuries Change in level (regional) | Effect size 0.47 (−0.04 to 0.98) | 1 ITS | ⊕⊝⊝⊝ |
| Non‐fatal injuries Change in slope (regional) | Effect size 0.46 (0.36 to 0.56) | 1 ITS | ⊕⊝⊝⊝ |
| CI: confidence interval;ITS: interrupted time series. GRADE Working Group grades of evidence | |||
| aEffect size can be interpreted as follows: < 0.2: small effect, 0.2‐0.8 moderate effect, > 0.8: Large effect; negative sign means decrease in injuries. | |||
| Drug‐free workplace programme versus no programme for reducing the risk of occupational injuries | |||
| Patient or population: employees of the companies with Washington Drug‐Free Workplace (WDFW) Program Settings: various construction companies Intervention: drug‐free campaign programme Comparison: non‐WDFW programme | |||
| Outcomes | Impacta (95% CI) | No. of studies | Quality of the evidence |
| Fatal injuries | No available data | ||
| Non‐fatal injuries Change in level | Effect size −6.78 (‐10.01 to −3.55) | 1 ITS | ⊕⊝⊝⊝ |
| Non‐fatal injuries Change in slope | Effect size −1.76 (−3.11 to −0.41) | 1 ITS | ⊕⊝⊝⊝ |
| CI: confidence interval;ITS: interrupted time series. GRADE Working Group grades of evidence | |||
| aEffect size can be interpreted as follows: < 0.2: small effect, 0.2‐0.8 moderate effect, > 0.8: large effect; negative sign means decrease in injuries. | |||
| Training versus no training for reducing work‐related injuries | |||
| Patient or population: workers in the construction industry Settings: union members in the USA and construction workers in railway construction project Intervention: OSHA outreach training; safety and health training for railway workers Comparison: no training | |||
| Outcomes | Impacta (95% CI) | No. of studies | Quality of the evidence |
| Fatal injuries | No available data | ||
| Non‐fatal injuries | OR 0.87 (0.72 to 1.06 ) | 1 CBA study | ⊕⊝⊝⊝ |
| Non‐fatal injuries Change in level | Effect size 0.10 (−1.74 to 1.94) | 1 ITS | ⊕⊝⊝⊝ |
| Non‐fatal injuries Change in slope | Effect size −0.43 (−0.96 to 0.10) | 1 ITS | ⊕⊝⊝⊝ |
| CI: confidence interval;OR: odds ratio; ITS: interrupted time series. GRADE Working Group grades of evidence | |||
| aEffect size can be interpreted as follows: < 0.2: small effect, 0.2‐0.8 moderate effect, > 0.8: large effect; negative sign means decrease in injuries. | |||
| Inspection versus no inspection of construction site | |||
| Patient or population: workers of reconstruction site Settings: reconstruction site after earthquake Intervention: accidents in building site Comparison: no inspection | |||
| Outcomes | Impacta (95% CI) | No of Studies | Quality of the evidence |
| Fatal injuries | No available data | ||
| Non‐fatal injuries Change in level | Effect size 0.07 (−2.83 to 2.97) | 1 ITS | ⊕⊕⊝⊝ |
| Non‐fatal injuries Change in slope | Effect size 0.63 (−0.35 to 1.61) | 1 ITS | ⊕⊕⊝⊝ |
| CI: confidence interval;ITS: interrupted time series. GRADE Working Group grades of evidence | |||
| aEffect size can be interpreted as follows: < 0.2: small effect, 0.2‐0.8 moderate effect, > 0.8: large effect; negative sign means decrease in injuries. | |||
| Subsidy for scaffolding versus no subsidy for injuries due to falls to a lower level | |||
| Patient or population: population working in construction companies Settings: construction company Intervention:subsidy for scaffolds Comparison: no subsidy for scaffolds | |||
| Outcomes | Impact (95% CI) | No of participants | Quality of the evidence |
| Fatal injuries | No available data | ||
| At baseline | RR 3.89 (2.32 to 6.52) | (1 CBA Study) | ⊕⊝⊝⊝ |
| At follow‐up (2 years) | RR 0.93 (0.30 to 2.91) | (1 CBA Study) | ⊕⊝⊝⊝ |
| CBA: controlled before‐after; CI: confidence interval; RR: risk ratio. GRADE Working Group grades of evidence | |||
| a Observational studies start with low‐quality evidence; we downgraded 2 levels: 1 for risk of bias, 1 for imprecision (1 study). | |||
| Study ID | Methods | Participants | Interventions | Outcome per 100 person‐years |
| Before‐after study | Construction workers (31 companies, no control group) | Drug testing programmes issued from 1985 to 1988 in USA | Number of injuries: before: 11.2; after: 9.1; absolute change: 2.1 | |
| Before‐after study | Residential construction workers (97 companies, no control group) | Safety education and training programme, issued in 1997 in USA (also booklet, focused inspection and financial incentives were used) | Number of injuries: before: 17.4; after: 14.7; absolute change: 2.7 Number of LWDI: before: 5.8; after: 3.5; absolute change: 2.3 Number of LWDI and medical cost: before: 3.8; after: 2.2; absolute change: 1.6 | |
| Before‐after study | 1018 apprentice carpenters in residential construction (no control group) | Educational intervention: training utilised hands‐on, participatory training methods preferred by the learners to address the safety gaps in the curriculum, including ladder use, leading edge work, truss setting, and use of scaffolding and personal fall arrest. Rolled out in USA in 2007 | Number of self‐reported falls: before 18.2; after: 14.5; absolute change 3.7 | |
| Before‐after study | Construction workers (49 companies, no control group) | Drug‐testing programmes issued from 1985 to 1999 in USA | Number of injuries: before: 8.9; after: 4.4; absolute change: 4.5 | |
| Before‐after study (not enough data points) | Construction workers (142,100 in 1999 to 206,000 in 2004) | Construction regulations for safe work environments issued in 2001 in Ireland | Number of injuries: in 1999: 0.4; in 2004: 0.7; absolute change: 0.3 Number of fatal injuries per 1,000,000 person‐years: in 1999: 113; in 2004: 73; absolute change: 40 | |
| Before‐after study | Carpenters and drywall tapers from variety of ethnic backgrounds (5 administrators plus 50 workers, no control group) | A job safety programme (toolbox, training, stress management techniques) issued in 1998 in USA | Number of injuries: before: 26.8; after: 12.9; absolute change: 13.9 Number of lost days: before: 23.5; after: 2.4; absolute change: 21.1 | |
| Retrospective cohort study | 1298 patients who suffered work‐related fall injuries. | Preventive effects of safety helmets: emergency‐department based occupational injury database with work‐related injury patients who visited 10 emergency departments between July 2010 and October 2012 in Korea. Surveillance database was used to evaluate the extent to which safety helmets have an effect on reducing the risk of traumatic brain injury resulting from work related fall injuries by comparing the effect across different heights. | Usage of helmets: 45% work‐related fall injured patients were wearing safety helmets. Intracranial injury was high at 8.7% in the no safety helmet group and 4.6% in the safety helmet group. There was significant preventive effects of safety helmet on intracranial injury when the height of fall was less than 4 m. OR 0.42 (95% CI 0.24 to 0.73) | |
| Before‐after study | Electricians in Ontario, Canada | Multifaceted electrical burn prevention programme (starting in 2004) consisting of education, facilitation:
| No denominator reported Non‐fatal injuries, i.e. electrical burns through multimeters Before (1998 to 2005): 26 electrical burn injuries caused by multimeters After (2006 to 2008): 0 electrical burn injuries caused by multimeters | |
| Retrospective cohort study | Construction workers (784 employers, control group of 8301 employers) | Washington State fall protection standard, violation during 1991 to 1992 in USA | Number of fall injuries: before intervention group: 1.8; before control group: 1.0; after intervention group: 1.4; after control group: 1.0; absolute change difference between intervention and control group: 0.4 | |
| Before‐after study | — | Amended occupational safety and health regulations in Japan in 2009: installation of mid‐rails, lower bars and other similar structures to prevent falls from the space between a guardrail and the work platform erected on scaffolds | Scaffold‐related fall accidents: Decrease over years 1552 (2007), 1227 (2008), 828 (2009), 718 (2010), 871 (2011) | |
| Before‐after study | Company 1: 172 drivers/electricity workers Company 2: 179 drivers/electricity workers | Company 1: 3, 45‐60 min group discussions Company 2: 1‐day course in anticipatory driving | Company 1 Number of work‐related road injuries: before: 10.5; after: 2.9; absolute change: 7.6 Number of other occupational injuries: before: 42.4; after: 48.8; absolute change: 6.4 Company 2 Number of work‐related road injuries: before: 2.2; after: 3.4; absolute change: 1.2 Number of other occupational injuries: before: 23.5; after: 28.5; absolute change: 5.0 | |
| Before–after study | Latino day labourers in USA | Training safety and health awareness of 1 day based on active learning and problem solving through peer trainers. Training materials adapted from OSHA curriculum and pilot | No denominator reported Non‐fatal injuries leading to stop with work Any serious injury last 6 months: before: 21% (N = 64); after: 24% (N = 16) At least 2 serious injuries last 6 months: before: 16% (N = 36); after: 1.5% (N = 1) | |
| CI: confidence interval;LWDI: lost work day injuries; OR: odds ratio; OSHA: Occupational Safety and Health Administration. | ||||
| Study | Pre‐int level (SD) | Change level (SE) | Pre‐int slope (SE) | Change slope (SE) | Autocorrelation |
| Fatal injuries/1 million person‐years | |||||
| 45.80 (3.42) | 8.16 (2.18) | −1.97 (0.51) | 0.28 (0.67) | −0.64 | |
| 14.01 (2.09) | −2.18 (1.17) | −1.10 (0.23) | 0.76 (0.31) | −0.37 | |
| 73.60 (15.31) | 4.21 (6.61) | −4.52 (0.84) | 2.79 (1.23) | 0.22 | |
| 40.2 (4.92) | −9.05 (5.19) | 1.96 (1.22) | −6.34 (1.60) | −0.74 | |
| 4.94 (0.37) | −0.38 (0.38) | −0.10 (0.08) | −0.29 (0.12) | 0.17 | |
| Non‐fatal injuries/100 person‐years | |||||
| 3.34 (2.06) | −3.75 (1.13) | 2.17 (0.43) | −2.67 (0.52) | −0.82 | |
| 3.50 (0.49) | 0.39 (0.57) | −0.70 (0.35) | 0.47 (0.35) | −0.08 | |
| Wickizer 2004: intervention | 27.80 (1.40) | −4.62 (2.43) | −0.79 (0.98) | 0.13 (1.01) | −0.70 |
| Wickizer 2004: control | 28.06 (2.35) | 2.93 (0.61) | −2.25 (0.24) | 2.01 (0.25) | −1.25 |
| Wickizer 2004: int‐con | −0.26 (1.12) | −7.59 (1.85) | −1.50 (0.75) | −1.97 (0.77) | −0.83 |
| 10.92 (1.44) | 0.11 (2.13) | −0.94 (0.62) | 0.90 (0.72) | 0.46 | |
| 23.6 (4.58) | 0.46 (4.33) | −0.57 (0.98) | −1.97 (1.22) | −0.14 | |
| 8.10 (2.08) | 1.33 (0.86) | −1.44 (0.27) | 1.22 (0.29) | −0.13 | |
| 9.20 (0.87) | 1.08 (0.52) | −0.50 (0.17) | −0.11 (0.17) | −0.40 | |
| 10.28 (0.73) | 1.13 (0.45) | −0.57 (0.20) | −0.01 (0.20) | −0.63 | |
| 43.58 (3.47) | −21.78(1.71) | −0.76 (0.4) | −2.07(0.53) | −0.88 | |
| Non‐fatal injuries/million m³construction volume | |||||
| Laitinen 2010: intervention | 792.29 (195.12) | 105.15 (50.18) | ‐86.75 (9.12) | 87.39 (10.18) | −0.35 |
| Laitinen 2010: control | 372.1 (21.57) | 17.58 (23.54) | −3.43 (4.35) | 3.52 (5.09) | 0.06 |
| Laitinen 2010: int‐con | 420.14 (187.75) | 87.57 (49.28) | ‐84.11 (8.97) | 85.43 (9.96) | −0.46 |
| Pre‐int: pre‐intervention; SD: standard deviation; SE: standard error. | |||||
| Outcome or subgroup title | No. of studies | No. of participants | Statistical method | Effect size |
| 1 Level Show forest plot | 9 | Effect Size (Random, 95% CI) | ‐0.33 [‐2.08, 1.41] | |
| 1.1 Fatal injuries | 5 | Effect Size (Random, 95% CI) | ‐0.13 [‐1.51, 1.25] | |
| 1.2 Non‐fatal injuries | 5 | Effect Size (Random, 95% CI) | ‐0.44 [‐3.70, 2.83] | |
| 2 Slope Show forest plot | 9 | Effect Size (Random, 95% CI) | ‐0.03 [‐0.30, 0.24] | |
| 2.1 Fatal injuries | 5 | Effect Size (Random, 95% CI) | ‐0.20 [‐0.64, 0.23] | |
| 2.2 Non‐fatal injuries | 5 | Effect Size (Random, 95% CI) | 0.14 [‐0.26, 0.54] | |
| Outcome or subgroup title | No. of studies | No. of participants | Statistical method | Effect size |
| 1 Level: non‐fatal injuries Show forest plot | 1 | Effect Size (Random, 95% CI) | 0.07 [‐2.83, 2.97] | |
| 2 Slope: non‐fatal injuries Show forest plot | 1 | Effect Size (Random, 95% CI) | 0.63 [‐0.35, 1.61] | |
| Outcome or subgroup title | No. of studies | No. of participants | Statistical method | Effect size |
| 1 Level: non‐fatal injuries Show forest plot | 1 | Effect Size (Random, 95% CI) | 0.1 [‐1.74, 1.94] | |
| 2 Slope: non‐fatal injuries Show forest plot | 1 | Effect Size (Random, 95% CI) | ‐0.43 [‐0.96, 0.10] | |
| 3 Non‐fatal Injuries (CBA) Show forest plot | 1 | Odds Ratio (Fixed, 95% CI) | 0.87 [0.72, 1.06] | |
| Outcome or subgroup title | No. of studies | No. of participants | Statistical method | Effect size |
| 1 Injuries from falls to a lower level Show forest plot | 1 | Risk Ratio (M‐H, Fixed, 95% CI) | Subtotals only | |
| 1.1 Baseline | 1 | 58019 | Risk Ratio (M‐H, Fixed, 95% CI) | 3.89 [2.32, 6.52] |
| 1.2 At 2 years follow‐up | 1 | 44619 | Risk Ratio (M‐H, Fixed, 95% CI) | 0.93 [0.30, 2.91] |
| Outcome or subgroup title | No. of studies | No. of participants | Statistical method | Effect size |
| 1 Level: non‐fatal injuries Show forest plot | 2 | Effect Size (Random, 95% CI) | Totals not selected | |
| 1.1 At company level | 1 | Effect Size (Random, 95% CI) | 0.0 [0.0, 0.0] | |
| 1.2 At regional level | 1 | Effect Size (Random, 95% CI) | 0.0 [0.0, 0.0] | |
| 2 Slope: non‐fatal injuries Show forest plot | 2 | Effect Size (Random, 95% CI) | Totals not selected | |
| 2.1 At company level | 1 | Effect Size (Random, 95% CI) | 0.0 [0.0, 0.0] | |
| 2.2 At regional level | 1 | Effect Size (Random, 95% CI) | 0.0 [0.0, 0.0] | |
| Outcome or subgroup title | No. of studies | No. of participants | Statistical method | Effect size |
| 1 Level: non‐fatal injuries Show forest plot | 1 | Effect Size (Random, 95% CI) | ‐6.78 [‐10.01, ‐3.55] | |
| 2 Slope: non‐fatal injuries Show forest plot | 1 | Effect Size (Random, 95% CI) | ‐1.76 [‐3.11, ‐0.41] | |