Scolaris Content Display Scolaris Content Display

PRISMA Study flow diagram (* numbers of 2017 update)
Figures and Tables -
Figure 1

PRISMA Study flow diagram (* numbers of 2017 update)

Comparison 1 Introduction of regulation (ITS), Outcome 1 Level.
Figures and Tables -
Analysis 1.1

Comparison 1 Introduction of regulation (ITS), Outcome 1 Level.

Comparison 1 Introduction of regulation (ITS), Outcome 2 Slope.
Figures and Tables -
Analysis 1.2

Comparison 1 Introduction of regulation (ITS), Outcome 2 Slope.

Comparison 2 Inspections (ITS), Outcome 1 Level: non‐fatal injuries.
Figures and Tables -
Analysis 2.1

Comparison 2 Inspections (ITS), Outcome 1 Level: non‐fatal injuries.

Comparison 2 Inspections (ITS), Outcome 2 Slope: non‐fatal injuries.
Figures and Tables -
Analysis 2.2

Comparison 2 Inspections (ITS), Outcome 2 Slope: non‐fatal injuries.

Comparison 3 Training (ITS, CBA), Outcome 1 Level: non‐fatal injuries.
Figures and Tables -
Analysis 3.1

Comparison 3 Training (ITS, CBA), Outcome 1 Level: non‐fatal injuries.

Comparison 3 Training (ITS, CBA), Outcome 2 Slope: non‐fatal injuries.
Figures and Tables -
Analysis 3.2

Comparison 3 Training (ITS, CBA), Outcome 2 Slope: non‐fatal injuries.

Comparison 3 Training (ITS, CBA), Outcome 3 Non‐fatal Injuries (CBA).
Figures and Tables -
Analysis 3.3

Comparison 3 Training (ITS, CBA), Outcome 3 Non‐fatal Injuries (CBA).

Comparison 4 Subsidy for scaffolding (CBA), Outcome 1 Injuries from falls to a lower level.
Figures and Tables -
Analysis 4.1

Comparison 4 Subsidy for scaffolding (CBA), Outcome 1 Injuries from falls to a lower level.

Comparison 5 Safety campaign (ITS), Outcome 1 Level: non‐fatal injuries.
Figures and Tables -
Analysis 5.1

Comparison 5 Safety campaign (ITS), Outcome 1 Level: non‐fatal injuries.

Comparison 5 Safety campaign (ITS), Outcome 2 Slope: non‐fatal injuries.
Figures and Tables -
Analysis 5.2

Comparison 5 Safety campaign (ITS), Outcome 2 Slope: non‐fatal injuries.

Comparison 6 Drug‐free workplace programme (ITS), Outcome 1 Level: non‐fatal injuries.
Figures and Tables -
Analysis 6.1

Comparison 6 Drug‐free workplace programme (ITS), Outcome 1 Level: non‐fatal injuries.

Comparison 6 Drug‐free workplace programme (ITS), Outcome 2 Slope: non‐fatal injuries.
Figures and Tables -
Analysis 6.2

Comparison 6 Drug‐free workplace programme (ITS), Outcome 2 Slope: non‐fatal injuries.

Summary of findings for the main comparison. Summary of findings: introduction of regulations

Regulations versus no regulations for reducing injuries in the construction industry

Patient or population: workers in various occupations

Settings: construction Industry

Intervention: legislation

Comparison: no legislation

Outcomes

Impact a (95% CI)

No. of studies

Quality of the evidence
(GRADE)

Fatal injuries

Change in level

Effect size −0.13 (−1.51 to 1.25)

5 ITS

⊕⊝⊝⊝
Very lowb

Fatal injuries

Change in slope

Effect size −0.20 (−0.64 to 0.23)

5 ITS

⊕⊝⊝⊝
Very lowb

Non‐fatal injuries

Change in level

Effect size −0.44 (−3.70 to 2.83)

5 ITS

⊕⊝⊝⊝
Very lowb

Non‐fatal injuries

Change in slope

Effect size 0.14 (−0.26 to 0.54)

5 ITS

⊕⊝⊝⊝
Very lowb

CI: confidence interval;ITS: interrupted time series.

GRADE Working Group grades of evidence
High quality: further research is very unlikely to change our confidence in the estimate of effect.
Moderate quality: further research is likely to have an important impact on our confidence in the estimate of effect and may change the estimate.
Low quality: further research is very likely to have an important impact on our confidence in the estimate of effect and is likely to change the estimate.
Very low quality: we are very uncertain about the estimate.

aEffect size can be interpreted as follows: < 0.2: small effect, 0.2‐0.8 moderate effect, > 0.8: large effect; negative sign means decrease in injuries.
bObservational studies start with low‐quality evidence; we downgraded 2 levels: 1 for risk of bias and 1 for heterogeneity.

Figures and Tables -
Summary of findings for the main comparison. Summary of findings: introduction of regulations
Summary of findings 2. Summary of findings: safety campaign

Safety campaign versus no campaign for reducing injuries in construction industry

Patient or population: workers in various occupations

Settings: construction Industry

Intervention: safety campaign

Comparison: no campaign

Outcomes

Impacta (95% CI)

No. of studies

Quality of the evidence
(GRADE)

Fatal injuries

No available data

Non‐fatal injuries

Change in level (company)

Effect size −1.82 (−2.90 to 0.74)

1 ITS

⊕⊝⊝⊝
Very lowb

Non‐fatal injuries

Change in slope (company)

Effect size −1.30 (−1.79 to −0.81)

1 ITS

⊕⊝⊝⊝
Very lowb

Non‐fatal injuries

Change in level (regional)

Effect size 0.47 (−0.04 to 0.98)

1 ITS

⊕⊝⊝⊝
Very lowb

Non‐fatal injuries

Change in slope (regional)

Effect size 0.46 (0.36 to 0.56)

1 ITS

⊕⊝⊝⊝
Very lowb

CI: confidence interval;ITS: interrupted time series.

GRADE Working Group grades of evidence
High quality: further research is very unlikely to change our confidence in the estimate of effect.
Moderate quality: further research is likely to have an important impact on our confidence in the estimate of effect and may change the estimate.
Low quality: further research is very likely to have an important impact on our confidence in the estimate of effect and is likely to change the estimate.
Very low quality: we are very uncertain about the estimate.

aEffect size can be interpreted as follows: < 0.2: small effect, 0.2‐0.8 moderate effect, > 0.8: Large effect; negative sign means decrease in injuries.
b Observational studies start with low‐quality evidence; we downgraded 2 levels: 1 for risk of bias, 1 for imprecision (1 study).

Figures and Tables -
Summary of findings 2. Summary of findings: safety campaign
Summary of findings 3. Summary of findings: drug‐free campaign programme

Drug‐free workplace programme versus no programme for reducing the risk of occupational injuries

Patient or population: employees of the companies with Washington Drug‐Free Workplace (WDFW) Program

Settings: various construction companies

Intervention: drug‐free campaign programme

Comparison: non‐WDFW programme

Outcomes

Impacta (95% CI)

No. of studies

Quality of the evidence
(GRADE)

Fatal injuries

No available data

Non‐fatal injuries

Change in level

Effect size −6.78 (‐10.01 to −3.55)

1 ITS

⊕⊝⊝⊝
Very lowb

Non‐fatal injuries

Change in slope

Effect size −1.76 (−3.11 to −0.41)

1 ITS

⊕⊝⊝⊝
Very lowb

CI: confidence interval;ITS: interrupted time series.

GRADE Working Group grades of evidence
High quality: further research is very unlikely to change our confidence in the estimate of effect.
Moderate quality: further research is likely to have an important impact on our confidence in the estimate of effect and may change the estimate.
Low quality: further research is very likely to have an important impact on our confidence in the estimate of effect and is likely to change the estimate.
Very low quality: we are very uncertain about the estimate.

aEffect size can be interpreted as follows: < 0.2: small effect, 0.2‐0.8 moderate effect, > 0.8: large effect; negative sign means decrease in injuries.
b Observational studies start with low‐quality evidence; we downgraded 2 levels: 1 for risk of bias and 1 for imprecision (1 study) and upgraded with 1 for large effect size.

Figures and Tables -
Summary of findings 3. Summary of findings: drug‐free campaign programme
Summary of findings 4. Summary of findings: training

Training versus no training for reducing work‐related injuries

Patient or population: workers in the construction industry

Settings: union members in the USA and construction workers in railway construction project

Intervention: OSHA outreach training; safety and health training for railway workers

Comparison: no training

Outcomes

Impacta (95% CI)

No. of studies

Quality of the evidence
(GRADE)

Fatal injuries

No available data

Non‐fatal injuries

OR 0.87 (0.72 to 1.06 )

1 CBA study

⊕⊝⊝⊝
Very lowb

Non‐fatal injuries

Change in level

Effect size 0.10 (−1.74 to 1.94)

1 ITS

⊕⊝⊝⊝
Very lowb

Non‐fatal injuries

Change in slope

Effect size −0.43 (−0.96 to 0.10)

1 ITS

⊕⊝⊝⊝
Very lowb

CI: confidence interval;OR: odds ratio; ITS: interrupted time series.

GRADE Working Group grades of evidence
High quality: further research is very unlikely to change our confidence in the estimate of effect.
Moderate quality: further research is likely to have an important impact on our confidence in the estimate of effect and may change the estimate.
Low quality: further research is very likely to have an important impact on our confidence in the estimate of effect and is likely to change the estimate.
Very low quality: we are very uncertain about the estimate.

aEffect size can be interpreted as follows: < 0.2: small effect, 0.2‐0.8 moderate effect, > 0.8: large effect; negative sign means decrease in injuries.
b Observational studies start with low‐quality evidence; we downgraded 2 levels: 1 for risk of bias and 1 for imprecision (1 study).

Figures and Tables -
Summary of findings 4. Summary of findings: training
Summary of findings 5. Summary of findings: inspection

Inspection versus no inspection of construction site

Patient or population: workers of reconstruction site

Settings: reconstruction site after earthquake

Intervention: accidents in building site

Comparison: no inspection

Outcomes

Impacta (95% CI)

No of Studies

Quality of the evidence
(GRADE)

Fatal injuries

No available data

Non‐fatal injuries

Change in level

Effect size 0.07 (−2.83 to 2.97)

1 ITS

⊕⊕⊝⊝
Very lowb

Non‐fatal injuries

Change in slope

Effect size 0.63 (−0.35 to 1.61)

1 ITS

⊕⊕⊝⊝
Very lowb

CI: confidence interval;ITS: interrupted time series.

GRADE Working Group grades of evidence
High quality: further research is very unlikely to change our confidence in the estimate of effect.
Moderate quality: further research is likely to have an important impact on our confidence in the estimate of effect and may change the estimate.
Low quality: further research is very likely to have an important impact on our confidence in the estimate of effect and is likely to change the estimate.
Very low quality: we are very uncertain about the estimate.

aEffect size can be interpreted as follows: < 0.2: small effect, 0.2‐0.8 moderate effect, > 0.8: large effect; negative sign means decrease in injuries.
b Observational studies start with low‐quality evidence; we downgraded with two levels: 1 for risk of bias and 1 for imprecision (1 study).

Figures and Tables -
Summary of findings 5. Summary of findings: inspection
Summary of findings 6. Summary of findings (Subsidy for Scaffolding)

Subsidy for scaffolding versus no subsidy for injuries due to falls to a lower level

Patient or population: population working in construction companies

Settings: construction company

Intervention:subsidy for scaffolds

Comparison: no subsidy for scaffolds

Outcomes

Impact (95% CI)

No of participants
(studies)

Quality of the evidence
(GRADE)

Fatal injuries

No available data

At baseline

RR 3.89 (2.32 to 6.52)

(1 CBA Study)

⊕⊝⊝⊝
Very lowa

At follow‐up (2 years)

RR 0.93 (0.30 to 2.91)

(1 CBA Study)

⊕⊝⊝⊝
Very lowa

CBA: controlled before‐after; CI: confidence interval; RR: risk ratio.

GRADE Working Group grades of evidence
High quality: further research is very unlikely to change our confidence in the estimate of effect.
Moderate quality: further research is likely to have an important impact on our confidence in the estimate of effect and may change the estimate.
Low quality: further research is very likely to have an important impact on our confidence in the estimate of effect and is likely to change the estimate.
Very low quality: we are very uncertain about the estimate.

a Observational studies start with low‐quality evidence; we downgraded 2 levels: 1 for risk of bias, 1 for imprecision (1 study).

Figures and Tables -
Summary of findings 6. Summary of findings (Subsidy for Scaffolding)
Table 1. Characteristics of excluded before‐after and retrospective studies

Study ID

Methods

Participants

Interventions

Outcome per 100 person‐years

Altayeb 1992

Before‐after study

Construction workers (31 companies, no control group)

Drug testing programmes issued from 1985 to 1988 in USA

Number of injuries: before: 11.2; after: 9.1; absolute change: 2.1

Darragh 2004

Before‐after study

Residential construction workers (97 companies, no control group)

Safety education and training programme, issued in 1997 in USA (also booklet, focused inspection and financial incentives were used)

Number of injuries: before: 17.4; after: 14.7; absolute change: 2.7

Number of LWDI: before: 5.8; after: 3.5; absolute change: 2.3

Number of LWDI and medical cost: before: 3.8; after: 2.2; absolute change: 1.6

Evanoff 2016

Before‐after study

1018 apprentice carpenters in residential construction (no control group)

Educational intervention: training utilised hands‐on, participatory training methods preferred by the learners to address the safety gaps in the curriculum, including ladder use,

leading edge work, truss setting, and use of scaffolding and personal fall arrest. Rolled out in USA in 2007

Number of self‐reported falls: before 18.2; after: 14.5; absolute change 3.7

Gerber 2002

Before‐after study

Construction workers (49 companies, no control group)

Drug‐testing programmes issued from 1985 to 1999 in USA

Number of injuries: before: 8.9; after: 4.4; absolute change: 4.5
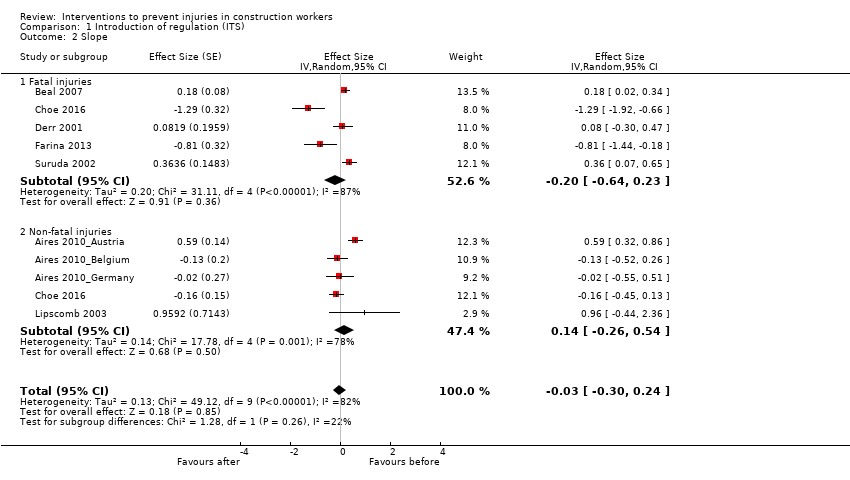
HSA 2006

Before‐after study (not enough data points)

Construction workers (142,100 in 1999 to 206,000 in 2004)

Construction regulations for safe work environments issued in 2001 in Ireland

Number of injuries: in 1999: 0.4; in 2004: 0.7; absolute change: 0.3

Number of fatal injuries per 1,000,000 person‐years: in 1999: 113; in 2004: 73; absolute change: 40

Johnson 2002

Before‐after study

Carpenters and drywall tapers from variety of ethnic backgrounds (5 administrators plus 50 workers, no control group)

A job safety programme (toolbox, training, stress management techniques) issued in 1998 in USA

Number of injuries: before: 26.8; after: 12.9; absolute change: 13.9

Number of lost days: before: 23.5; after: 2.4; absolute change: 21.1

Kim 2016

Retrospective cohort study

1298 patients who suffered work‐related fall injuries.

Preventive effects of safety helmets: emergency‐department based occupational injury database with work‐related injury patients who visited 10 emergency departments between July 2010 and October 2012 in Korea. Surveillance database was used to evaluate the extent to which safety helmets have an effect on reducing the risk of traumatic brain injury resulting from work related fall injuries by comparing the effect across different heights.

Usage of helmets: 45% work‐related fall injured patients were wearing safety helmets. Intracranial injury was high at 8.7% in the no safety helmet group and 4.6% in the safety helmet group. There was significant preventive effects of safety helmet on intracranial injury when the height of fall was less than 4 m.

OR 0.42 (95% CI 0.24 to 0.73)

Marcucci 2010

Before‐after study

Electricians in Ontario, Canada

Multifaceted electrical burn prevention programme (starting in 2004) consisting of education, facilitation:

  • survey to understand the multimeter problem, best practice review, technical research

  • awareness raise

  • behavioural change through proper safety precautions

  • influence product design

  • new product design and stimulate market place

No denominator reported

Non‐fatal injuries, i.e. electrical burns through multimeters

Before (1998 to 2005): 26 electrical burn injuries caused by multimeters

After (2006 to 2008): 0 electrical burn injuries caused by multimeters

Nelson 1997

Retrospective cohort study

Construction workers (784 employers, control group of 8301 employers)

Washington State fall protection standard, violation during 1991 to 1992 in USA

Number of fall injuries: before intervention group: 1.8; before control group: 1.0; after intervention group: 1.4; after control group: 1.0; absolute change difference between intervention and control group: 0.4

Ohdo 2014

Before‐after study

Amended occupational safety and health regulations in Japan in 2009: installation of mid‐rails, lower bars and other similar structures to prevent falls from the space between a guardrail and the work platform erected on scaffolds

Scaffold‐related fall accidents: Decrease over years

1552 (2007), 1227 (2008), 828 (2009), 718 (2010), 871 (2011)

Salminen 2008

Before‐after study

Company 1: 172 drivers/electricity workers

Company 2: 179 drivers/electricity workers

Company 1: 3, 45‐60 min group discussions

Company 2: 1‐day course in anticipatory driving

Company 1

Number of work‐related road injuries: before: 10.5; after: 2.9; absolute change: 7.6

Number of other occupational injuries: before: 42.4; after: 48.8; absolute change: 6.4

Company 2

Number of work‐related road injuries: before: 2.2; after: 3.4; absolute change: 1.2

Number of other occupational injuries: before: 23.5; after: 28.5; absolute change: 5.0

Williams 2010

Before–after study

Latino day labourers in USA

Training safety and health awareness of 1 day based on active learning and problem solving through peer trainers. Training materials adapted from OSHA curriculum and pilot

No denominator reported

Non‐fatal injuries leading to stop with work

Any serious injury last 6 months: before: 21% (N = 64); after: 24% (N = 16)

At least 2 serious injuries last 6 months: before: 16% (N = 36); after: 1.5% (N = 1)

CI: confidence interval;LWDI: lost work day injuries; OR: odds ratio; OSHA: Occupational Safety and Health Administration.

Figures and Tables -
Table 1. Characteristics of excluded before‐after and retrospective studies
Table 2. Results from re‐analysis of the ITS studies; non‐standardised data

Study

Pre‐int level (SD)

Change level (SE)

Pre‐int slope (SE)

Change slope (SE)

Autocorrelation

Fatal injuries/1 million person‐years

Derr 2001

45.80 (3.42)

8.16 (2.18)

−1.97 (0.51)

0.28 (0.67)

−0.64

Suruda 2002

14.01 (2.09)

−2.18 (1.17)

−1.10 (0.23)

0.76 (0.31)

−0.37

Beal 2007

73.60 (15.31)

4.21 (6.61)

−4.52 (0.84)

2.79 (1.23)

0.22

Choe 2016

40.2 (4.92)

−9.05 (5.19)

1.96 (1.22)

−6.34 (1.60)

−0.74

Farina 2013

4.94 (0.37)

−0.38 (0.38)

−0.10 (0.08)

−0.29 (0.12)

0.17

Non‐fatal injuries/100 person‐years

Spangenberg 2002

3.34 (2.06)

−3.75 (1.13)

2.17 (0.43)

−2.67 (0.52)

−0.82

Lipscomb 2003

3.50 (0.49)

0.39 (0.57)

−0.70 (0.35)

0.47 (0.35)

−0.08

Wickizer 2004: intervention

27.80 (1.40)

−4.62 (2.43)

−0.79 (0.98)

0.13 (1.01)

−0.70

Wickizer 2004: control

28.06 (2.35)

2.93 (0.61)

−2.25 (0.24)

2.01 (0.25)

−1.25

Wickizer 2004: int‐con

−0.26 (1.12)

−7.59 (1.85)

−1.50 (0.75)

−1.97 (0.77)

−0.83

Miscetti 2008

10.92 (1.44)

0.11 (2.13)

−0.94 (0.62)

0.90 (0.72)

0.46

Bena 2009

23.6 (4.58)

0.46 (4.33)

−0.57 (0.98)

−1.97 (1.22)

−0.14

Aires 2010_Austria

8.10 (2.08)

1.33 (0.86)

−1.44 (0.27)

1.22 (0.29)

−0.13

Aires 2010_Belgium

9.20 (0.87)

1.08 (0.52)

−0.50 (0.17)

−0.11 (0.17)

−0.40

Aires 2010_Germany

10.28 (0.73)

1.13 (0.45)

−0.57 (0.20)

−0.01 (0.20)

−0.63

Choe 2016

43.58 (3.47)

−21.78(1.71)

−0.76 (0.4)

−2.07(0.53)

−0.88

Non‐fatal injuries/million m³construction volume

Laitinen 2010: intervention

792.29 (195.12)

105.15 (50.18)

‐86.75 (9.12)

87.39 (10.18)

−0.35

Laitinen 2010: control

372.1 (21.57)

17.58 (23.54)

−3.43 (4.35)

3.52 (5.09)

0.06

Laitinen 2010: int‐con

420.14 (187.75)

87.57 (49.28)

‐84.11 (8.97)

85.43 (9.96)

−0.46

Pre‐int: pre‐intervention; SD: standard deviation; SE: standard error.

Figures and Tables -
Table 2. Results from re‐analysis of the ITS studies; non‐standardised data
Comparison 1. Introduction of regulation (ITS)

Outcome or subgroup title

No. of studies

No. of participants

Statistical method

Effect size

1 Level Show forest plot

9

Effect Size (Random, 95% CI)

‐0.33 [‐2.08, 1.41]

1.1 Fatal injuries

5

Effect Size (Random, 95% CI)

‐0.13 [‐1.51, 1.25]

1.2 Non‐fatal injuries

5

Effect Size (Random, 95% CI)

‐0.44 [‐3.70, 2.83]

2 Slope Show forest plot

9

Effect Size (Random, 95% CI)

‐0.03 [‐0.30, 0.24]

2.1 Fatal injuries

5

Effect Size (Random, 95% CI)

‐0.20 [‐0.64, 0.23]

2.2 Non‐fatal injuries

5

Effect Size (Random, 95% CI)

0.14 [‐0.26, 0.54]

Figures and Tables -
Comparison 1. Introduction of regulation (ITS)
Comparison 2. Inspections (ITS)

Outcome or subgroup title

No. of studies

No. of participants

Statistical method

Effect size

1 Level: non‐fatal injuries Show forest plot

1

Effect Size (Random, 95% CI)

0.07 [‐2.83, 2.97]

2 Slope: non‐fatal injuries Show forest plot

1

Effect Size (Random, 95% CI)

0.63 [‐0.35, 1.61]

Figures and Tables -
Comparison 2. Inspections (ITS)
Comparison 3. Training (ITS, CBA)

Outcome or subgroup title

No. of studies

No. of participants

Statistical method

Effect size

1 Level: non‐fatal injuries Show forest plot

1

Effect Size (Random, 95% CI)

0.1 [‐1.74, 1.94]

2 Slope: non‐fatal injuries Show forest plot

1

Effect Size (Random, 95% CI)

‐0.43 [‐0.96, 0.10]

3 Non‐fatal Injuries (CBA) Show forest plot

1

Odds Ratio (Fixed, 95% CI)

0.87 [0.72, 1.06]

Figures and Tables -
Comparison 3. Training (ITS, CBA)
Comparison 4. Subsidy for scaffolding (CBA)

Outcome or subgroup title

No. of studies

No. of participants

Statistical method

Effect size

1 Injuries from falls to a lower level Show forest plot

1

Risk Ratio (M‐H, Fixed, 95% CI)

Subtotals only

1.1 Baseline

1

58019

Risk Ratio (M‐H, Fixed, 95% CI)

3.89 [2.32, 6.52]

1.2 At 2 years follow‐up

1

44619

Risk Ratio (M‐H, Fixed, 95% CI)

0.93 [0.30, 2.91]

Figures and Tables -
Comparison 4. Subsidy for scaffolding (CBA)
Comparison 5. Safety campaign (ITS)

Outcome or subgroup title

No. of studies

No. of participants

Statistical method

Effect size

1 Level: non‐fatal injuries Show forest plot

2

Effect Size (Random, 95% CI)

Totals not selected

1.1 At company level

1

Effect Size (Random, 95% CI)

0.0 [0.0, 0.0]

1.2 At regional level

1

Effect Size (Random, 95% CI)

0.0 [0.0, 0.0]

2 Slope: non‐fatal injuries Show forest plot

2

Effect Size (Random, 95% CI)

Totals not selected

2.1 At company level

1

Effect Size (Random, 95% CI)

0.0 [0.0, 0.0]

2.2 At regional level

1

Effect Size (Random, 95% CI)

0.0 [0.0, 0.0]

Figures and Tables -
Comparison 5. Safety campaign (ITS)
Comparison 6. Drug‐free workplace programme (ITS)

Outcome or subgroup title

No. of studies

No. of participants

Statistical method

Effect size

1 Level: non‐fatal injuries Show forest plot

1

Effect Size (Random, 95% CI)

‐6.78 [‐10.01, ‐3.55]

2 Slope: non‐fatal injuries Show forest plot

1

Effect Size (Random, 95% CI)

‐1.76 [‐3.11, ‐0.41]

Figures and Tables -
Comparison 6. Drug‐free workplace programme (ITS)