Вмешательства, направленные на профилактику профессиональной потери слуха, вызванной шумом
Abstract
Background
This is the second update of a Cochrane Review originally published in 2009. Millions of workers worldwide are exposed to noise levels that increase their risk of hearing disorders. There is uncertainty about the effectiveness of hearing loss prevention interventions.
Objectives
To assess the effectiveness of non‐pharmaceutical interventions for preventing occupational noise exposure or occupational hearing loss compared to no intervention or alternative interventions.
Search methods
We searched the CENTRAL; PubMed; Embase; CINAHL; Web of Science; BIOSIS Previews; Cambridge Scientific Abstracts; and OSH UPDATE to 3 October 2016.
Selection criteria
We included randomised controlled trials (RCT), controlled before‐after studies (CBA) and interrupted time‐series (ITS) of non‐clinical interventions under field conditions among workers to prevent or reduce noise exposure and hearing loss. We also collected uncontrolled case studies of engineering controls about the effect on noise exposure.
Data collection and analysis
Two authors independently assessed study eligibility and risk of bias and extracted data. We categorised interventions as engineering controls, administrative controls, personal hearing protection devices, and hearing surveillance.
Main results
We included 29 studies. One study evaluated legislation to reduce noise exposure in a 12‐year time‐series analysis but there were no controlled studies on engineering controls for noise exposure. Eleven studies with 3725 participants evaluated effects of personal hearing protection devices and 17 studies with 84,028 participants evaluated effects of hearing loss prevention programmes (HLPPs).
Effects on noise exposure
Engineering interventions following legislation
One ITS study found that new legislation in the mining industry reduced the median personal noise exposure dose in underground coal mining by 27.7 percentage points (95% confidence interval (CI) −36.1 to −19.3 percentage points) immediately after the implementation of stricter legislation. This roughly translates to a 4.5 dB(A) decrease in noise level. The intervention was associated with a favourable but statistically non‐significant downward trend in time of the noise dose of −2.1 percentage points per year (95% CI −4.9 to 0.7, 4 year follow‐up, very low‐quality evidence).
Engineering intervention case studies
We found 12 studies that described 107 uncontrolled case studies of immediate reductions in noise levels of machinery ranging from 11.1 to 19.7 dB(A) as a result of purchasing new equipment, segregating noise sources or installing panels or curtains around sources. However, the studies lacked long‐term follow‐up and dose measurements of workers, and we did not use these studies for our conclusions.
Hearing protection devices
In general hearing protection devices reduced noise exposure on average by about 20 dB(A) in one RCT and three CBAs (57 participants, low‐quality evidence). Two RCTs showed that, with instructions for insertion, the attenuation of noise by earplugs was 8.59 dB better (95% CI 6.92 dB to 10.25 dB) compared to no instruction (2 RCTs, 140 participants, moderate‐quality evidence).
Administrative controls: information and noise exposure feedback
On‐site training sessions did not have an effect on personal noise‐exposure levels compared to information only in one cluster‐RCT after four months' follow‐up (mean difference (MD) 0.14 dB; 95% CI −2.66 to 2.38). Another arm of the same study found that personal noise exposure information had no effect on noise levels (MD 0.30 dB(A), 95% CI −2.31 to 2.91) compared to no such information (176 participants, low‐quality evidence).
Effects on hearing loss
Hearing protection devices
In two studies the authors compared the effect of different devices on temporary threshold shifts at short‐term follow‐up but reported insufficient data for analysis. In two CBA studies the authors found no difference in hearing loss from noise exposure above 89 dB(A) between muffs and earplugs at long‐term follow‐up (OR 0.8, 95% CI 0.63 to 1.03 ), very low‐quality evidence). Authors of another CBA study found that wearing hearing protection more often resulted in less hearing loss at very long‐term follow‐up (very low‐quality evidence).
Combination of interventions: hearing loss prevention programmes
One cluster‐RCT found no difference in hearing loss at three‐ or 16‐year follow‐up between an intensive HLPP for agricultural students and audiometry only. One CBA study found no reduction of the rate of hearing loss (MD −0.82 dB per year (95% CI −1.86 to 0.22) for a HLPP that provided regular personal noise exposure information compared to a programme without this information.
There was very‐low‐quality evidence in four very long‐term studies, that better use of hearing protection devices as part of a HLPP decreased the risk of hearing loss compared to less well used hearing protection in HLPPs (OR 0.40, 95% CI 0.23 to 0.69). Other aspects of the HLPP such as training and education of workers or engineering controls did not show a similar effect.
In three long‐term CBA studies, workers in a HLPP had a statistically non‐significant 1.8 dB (95% CI −0.6 to 4.2) greater hearing loss at 4 kHz than non‐exposed workers and the confidence interval includes the 4.2 dB which is the level of hearing loss resulting from 5 years of exposure to 85 dB(A). In addition, of three other CBA studies that could not be included in the meta‐analysis, two showed an increased risk of hearing loss in spite of the protection of a HLPP compared to non‐exposed workers and one CBA did not.
Authors' conclusions
There is very low‐quality evidence that implementation of stricter legislation can reduce noise levels in workplaces. Controlled studies of other engineering control interventions in the field have not been conducted. There is moderate‐quality evidence that training of proper insertion of earplugs significantly reduces noise exposure at short‐term follow‐up but long‐term follow‐up is still needed.
There is very low‐quality evidence that the better use of hearing protection devices as part of HLPPs reduces the risk of hearing loss, whereas for other programme components of HLPPs we did not find such an effect. The absence of conclusive evidence should not be interpreted as evidence of lack of effectiveness. Rather, it means that further research is very likely to have an important impact.
PICOs
Резюме на простом языке
Вмешательства, направленные на профилактику потери слуха, вызванной шумом на рабочем месте
Какова цель этого обзора?
Целью этого Кокрейновского обзора было выяснить, может ли быть предотвращена потеря слуха, вызванная шумом на работе. Исследователи Кокрейн собрали и проанализировали все соответствующие исследования, чтобы ответить на этот вопрос. Они нашли 29 исследований, посвященных влиянию профилактических мер.
Ключевая информация
Более строгие законодательные меры могли бы снизить уровень шума. На индивидуальном уровне наушники и беруши могут снизить воздействие шума до безопасной степени. Однако, требуется инструктаж по применению берушей. Без инструктажа беруши, возможно, не защищают в достаточной степени. Предоставление работникам обратной связи по поводу шумового воздействия, вероятно, не снижает уровень шума. Инженерные решения, такие как лучшее техническое обслуживание, могут привести к такому же снижению уровня шума, как и средства защиты органа слуха. Необходима лучшая оценка этих инженерных решений.
Влияние программ предотвращения потери слуха (ПППС) остается неясным. Лучшее использование средств защиты в рамках программы, вероятно, помогает, но не защищает от потери слуха полностью. Улучшенное внедрение могло бы обеспечить большую защиту.
Что было изучено в этом обзоре?
Миллионы работников подвергаются воздействию шума, которое может привести к потере слуха. Авторы обзора были заинтересованы в эффекте любых вмешательств для снижения уровня шума или частоты потери слуха на рабочих местах, таких как инженерные решения, средства защиты органа слуха или программы предотвращения потери слуха.
Каковы результаты этого обзора?
Влияние на воздействие шума
Инженерные решения
Мы обнаружили одно исследование, которое показало, что уровень шума снизился более чем на 5 децибел (дБ) после внедрения более строгих нормативных актов в горнодобывающей промышленности. Несмотря на то, что многие исследования случаев показывают, что технические усовершенствования могут снизить уровень шума на рабочих местах даже на 20 дБ, не было никаких контролируемых исследований за пределами лабораторий, которые продемонстрировали бы это с большей уверенностью.
Защита слуха
В восьми исследованиях с 358 работниками средства защиты органа слуха снижали уровень воздействия шума на работников примерно на 20 дБ (А). Однако, в случае с берушами, доказательства умеренного качества, полученные из двух рандомизированных исследований, показали, что если рабочие не получали должных инструкций по поводу их использования, предполагаемое ослабление снижалось в среднем на 9дБ.
Обратная связь по поводу воздействия шума
Обратная связь по поводу воздействия шума не привела к изменению уровня шума в строительной отрасли в одном исследовании.
Влияние на потерю слуха
Мы нашли 16 исследований с 81220 участниками, в которых изучали долгосрочное влияние средств защиты на потерю слуха.
Защита слуха
Использование средств защиты органа слуха в хорошо реализуемых ПППС ассоциировалось с меньшей потерей слуха. Для других элементов программ, таких как обучение работников, применение одной лишь аудиометрии, мониторинг шума или предоставление обратной связи по поводу индивидуального воздействия шума, явного эффекта обнаружено не было. В двух исследованиях с 3242 работниками было обнаружено, что разницы в долгосрочном влиянии на потерю слуха между наушниками и берушами не было.
Программы предотвращения потери слуха
В четырех исследованиях были получены доказательства очень низкого качества в пользу того, что стандартные ПППС не снижают риск потери слуха до уровня, по меньшей мере эквивалентного уровню тех, кто подвергается воздействию 85 дБ (А) (в сравнении с работниками, не подвергающимися воздействию). Два дополнительных сравнительных исследования показали, что риск потери слуха по‐прежнему значителен, несмотря на то, что все работники были охвачены ПППС. Однако, одно исследование низкого качества показало, что более строгая ПППС может защитить работников от потери слуха.
Отсутствие убедительных доказательств не следует интерпретировать как доказательства недостаточной эффективности. Скорее это означает, что дальнейшие исследования с большой вероятностью повлияют на полученные нами выводы. Для предотвращения потери слуха, вызванной шумом, необходимы более качественные программы предотвращения и более качественные исследования, особенно в области инженерного контроля, а также более совершенное внедрение законодательных мер.
Насколько актуален этот обзор?
Авторы обзора провели поиск исследований, опубликованных вплоть до октября 2016 года.
Authors' conclusions
Summary of findings
| Stricter legislation compared with existing legislation for noise exposure | |||||
| Patient or population: workers with noise exposure Settings: coal mines Intervention: stricter legislation Comparison: existing legislation | |||||
| Outcomes | Illustrative comparative risks* (95% CI) | No of observations (studies) | Quality of the evidence | Comments | |
| Assumed risk | Corresponding risk | ||||
| Existing legislation | Stricter legislation | ||||
| Immediate change in level in year 2000 (noise level at work as PEL dose in dB(A); range 0 to 6400, log scale) 1 year | The mean noise levels during pre‐intervention years were 56.9 PEL dose | The mean noise exposure level after introduction was 27.70 PEL dose lower (36.1 lower to 19.3 lower PEL dose) | 14 years pre‐intervention and 4 years post‐intervention (1 ITS) | ⊕⊝⊝⊝ | The reduction of 27.7 PEL dose translates to about 4.5 dB(A) |
| Change in slope after introduction (noise level at work as PEL dose in dB(A); range 0 to 6400, log scale) 4 years | The mean noise levels during pre‐intervention years were 56.9 PEL dose | The mean change in level of noise exposure per year after introduction was 2.10 PEL dose lower (4.90 lower to 0.70 PEL dose higher) | 14 years pre‐intervention and 4 years post‐intervention (1 ITS) | ⊕⊝⊝⊝ | |
| *The basis for the assumed risk (e.g. the median control group risk across studies) is provided in footnotes. The corresponding risk (and its 95% confidence interval) is based on the assumed risk in the comparison group and the absolute effect of the intervention (and its 95% CI). | |||||
| GRADE Working Group grades of evidence High quality: we are very confident that the true effect lies close to that of the estimate of the effect Moderate quality: we are moderately confident in the effect estimate; the true effect is likely to be close to the estimate of effect, but there is a possibility that it is substantially different Low quality: our confidence in the effect estimate is limited; the true effect may be substantially different from the estimate of the effect Very low quality: we have very little confidence in the effect estimate; the true effect is likely to be substantially different from the estimate of effect | |||||
| 1We downgraded by one level from low to very low because there is only one study and it has a high risk of bias. | |||||
| Earplugs with instruction compared with no instruction for noise reduction | |||||
| Patient or population: workers with exposure to noise Settings: industrial Intervention: instruction on how to insert earplugs Comparison: no instruction | |||||
| Outcomes | Illustrative comparative risks* (95% CI) | No of participants | Quality of the evidence | Comments | |
| Assumed risk | Corresponding risk | ||||
| Without instruction | With instruction | ||||
| Mean noise attenuation over 0.5, 1, 2, 3, 4, 6, 8 kHz (dB) Immediate follow‐up | The mean noise attenuation ranged across frequencies from 5.5 to 25.9 dB | The mean noise attenuation in the intervention groups was 8.59 dB higher (6.92 dB higher to 10.25 dB higher) | 140 participants | ⊕⊕⊕⊝ | |
| *The basis for the assumed risk (e.g. the median control group risk across studies) is provided in footnotes. The corresponding risk (and its 95% confidence interval) is based on the assumed risk in the comparison group and the relative effect of the intervention (and its 95% CI). | |||||
| GRADE Working Group grades of evidence High quality: we are very confident that the true effect lies close to that of the estimate of the effect Moderate quality: we are moderately confident in the effect estimate; the true effect is likely to be close to the estimate of effect, but there is a possibility that it is substantially different Low quality: our confidence in the effect estimate is limited; the true effect may be substantially different from the estimate of the effect Very low quality: we have very little confidence in the effect estimate; the true effect is likely to be substantially different from the estimate of effect | |||||
| 1We downgraded from high quality by one level because of imprecision due to small number of participants. | |||||
| Exposure information compared with training as usual for noise exposure | |||||
| Patient or population: workers exposed to noise Settings: construction industry Intervention: provision of noise level indicator Comparison: safety training as usual | |||||
| Outcomes | Illustrative comparative risks* (95% CI) | No of participants | Quality of the evidence | Comments | |
| Assumed risk | Corresponding risk | ||||
| Training as usual | Plus noise level indicator | ||||
| Change in noise levels at 4 months' follow‐up (dB(A)) | The mean noise level in the control group ranged from 87.1 to 89 dB(A) | The mean noise level in the intervention groups was | 176 | ⊕⊕⊝⊝ | |
| *The basis for the assumed risk (e.g. the median control group risk across studies) is provided in footnotes. The corresponding risk (and its 95% confidence interval) is based on the assumed risk in the comparison group and the relative effect of the intervention (and its 95% CI). | |||||
| GRADE Working Group grades of evidence High quality: we are very confident that the true effect lies close to that of the estimate of the effect Moderate quality: we are moderately confident in the effect estimate; the true effect is likely to be close to the estimate of effect, but there is a possibility that it is substantially different Low quality: our confidence in the effect estimate is limited; the true effect may be substantially different from the estimate of the effect Very low quality: we have very little confidence in the effect estimate; the true effect is likely to be substantially different from the estimate of effect | |||||
| 1We downgraded by two levels from high to low because of high risk of bias and imprecision. | |||||
| Earmuffs compared with earplugs for noise‐induced hearing loss | ||||||
| Patient or population: workers exposed to 88‐94 dB(A) Settings: shipyard Intervention: most wearing earmuffs Comparison: most wearing earplugs | ||||||
| Outcomes | Illustrative comparative risks* (95% CI) | Relative effect | No of participants | Quality of the evidence | Comments | |
| Assumed risk | Corresponding risk | |||||
| Earplugs | Earmuffs | |||||
| Hearing loss change over 3 years (4 kHz/STS) 2 to 3 years' follow‐up | High risk population | OR 0.8 (0.63 to 1.03 ) | 3242 | ⊕⊝⊝⊝ | At lower exposures the results were too heterogeneous to be combined | |
| 42 per 1000 | 34 per 1000 | |||||
| *The basis for the assumed risk (e.g. the median control group risk across studies) is provided in footnotes. The corresponding risk (and its 95% confidence interval) is based on the assumed risk in the comparison group and the relative effect of the intervention (and its 95% CI). | ||||||
| GRADE Working Group grades of evidence High quality: we are very confident that the true effect lies close to that of the estimate of the effect Moderate quality: we are moderately confident in the effect estimate; the true effect is likely to be close to the estimate of effect, but there is a possibility that it is substantially different Low quality: our confidence in the effect estimate is limited; the true effect may be substantially different from the estimate of the effect Very low quality: we have very little confidence in the effect estimate; the true effect is likely to be substantially different from the estimate of effect | ||||||
| 1We downgraded from low quality to very low quality because of high risk of bias in both studies. | ||||||
| Hearing loss prevention programme (HLPP) compared to audiometric testing | ||||||
| Patient or population: agricultural students without hearing loss Settings: agricultural schools | ||||||
| Outcomes | Illustrative comparative risks* (95% CI) | Relative effect | No of participants | Quality of the evidence | Comments | |
| Assumed risk | Corresponding risk | |||||
| Audiometric testing only | HLPP with information | |||||
| Hearing loss | 21 per 1000 | 18 per 1000 | OR 0.85 | 687 | ⊕⊕⊕⊝ | |
| Hearing loss | 149 per 1000 | 141 per 1000 | OR 0.94 | 355 | ⊕⊕⊕⊝ | |
| *The basis for the assumed risk (e.g. the median control group risk across studies) is provided in footnotes. The corresponding risk (and its 95% confidence interval) is based on the assumed risk in the comparison group and the relative effect of the intervention (and its 95% CI). | ||||||
| GRADE Working Group grades of evidence High quality: we are very confident that the true effect lies close to that of the estimate of the effect Moderate quality: we are moderately confident in the effect estimate; the true effect is likely to be close to the estimate of effect, but there is a possibility that it is substantially different Low quality: our confidence in the effect estimate is limited; the true effect may be substantially different from the estimate of the effect Very low quality: we have very little confidence in the effect estimate; the true effect is likely to be substantially different from the estimate of effect | ||||||
| 1We downgraded one level from high to moderate due to lack of information on randomisation and allocation concealment. | ||||||
| HLPP with exposure information compared with HLPP without exposure information for noise‐induced hearing loss | |||||
| Patient or population: workers exposed to noise Settings: aluminium smelter Intervention: exposure information as part of HLPP Comparison: no such information | |||||
| Outcomes | Illustrative comparative risks* (95% CI) | No of participants | Quality of the evidence | Comments | |
| Assumed risk | Corresponding risk | ||||
| Without exposure info | With exposure info | ||||
| Annual increase in hearing threshold (dB/year at 2,3 and 4 kHz) 4‐year follow‐up | The mean hearing loss rate in the control group was 1.0 dB per year | The mean hearing loss rate in the intervention groups was | 312 | ⊕⊝⊝⊝ | Matched for age, gender, baseline hearing loss and baseline hearing |
| *The basis for the assumed risk (e.g. the median control group risk across studies) is provided in footnotes. The corresponding risk (and its 95% confidence interval) is based on the assumed risk in the comparison group and the relative effect of the intervention (and its 95% CI). | |||||
| GRADE Working Group grades of evidence High quality: we are very confident that the true effect lies close to that of the estimate of the effect Moderate quality: we are moderately confident in the effect estimate; the true effect is likely to be close to the estimate of effect, but there is a possibility that it is substantially different Low quality: our confidence in the effect estimate is limited; the true effect may be substantially different from the estimate of the effect Very low quality: we have very little confidence in the effect estimate; the true effect is likely to be substantially different from the estimate of effect | |||||
| 1We downgraded by one level from low to very low because of high risk of bias. | |||||
| Well‐implemented hearing loss prevention programme (HLPP) compared to less well‐implemented HLPP for hearing loss | ||||||
| Patient or population: workers | ||||||
| Outcomes | Illustrative comparative risks* (95% CI) | Relative effect | No of participants | Quality of the evidence | Comments | |
| Assumed risk | Corresponding risk | |||||
| Less well‐implemented HLPP | Well‐implemented HLPP | |||||
| Hearing loss | 86 per 1000 | 36 per 1000 | OR 0.40 | 16,301 | ⊕⊝⊝⊝ | SMD 0.26 (0.14 to 0.47) |
| *The basis for the assumed risk (e.g. the median control group risk across studies) is provided in footnotes. The corresponding risk (and its 95% confidence interval) is based on the assumed risk in the comparison group and the relative effect of the intervention (and its 95% CI). | ||||||
| GRADE Working Group grades of evidence High quality: we are very confident that the true effect lies close to that of the estimate of the effect Moderate quality: we are moderately confident in the effect estimate; the true effect is likely to be close to the estimate of effect, but there is a possibility that it is substantially different Low quality: our confidence in the effect estimate is limited; the true effect may be substantially different from the estimate of the effect Very low quality: we have very little confidence in the effect estimate; the true effect is likely to be substantially different from the estimate of effect | ||||||
| 1STS used in two studies, change of mean 4 kHz threshold in one study. | ||||||
| Hearing loss prevention programme (HLPP) compared to non‐exposed workers | ||||||
| Patient or population: workers | ||||||
| Outcomes | Illustrative comparative risks* (95% CI) | Relative effect | No of participants | Quality of the evidence | Comments | |
| Assumed risk | Corresponding risk | |||||
| Non‐exposed workers | HLPP | |||||
| Hearing loss | The mean hearing loss in the control groups was | The mean hearing loss in the intervention groups was | 1846 | ⊕⊝⊝⊝ | pooled effect size 0.17 (95% CI ‐0.06 to 0.40) recalculated into dBs | |
| *The basis for the assumed risk (e.g. the median control group risk across studies) is provided in footnotes. The corresponding risk (and its 95% confidence interval) is based on the assumed risk in the comparison group and the relative effect of the intervention (and its 95% CI). | ||||||
| GRADE Working Group grades of evidence High quality: we are very confident that the true effect lies close to that of the estimate of the effect Moderate quality: we are moderately confident in the effect estimate; the true effect is likely to be close to the estimate of effect, but there is a possibility that it is substantially different Low quality: our confidence in the effect estimate is limited; the true effect may be substantially different from the estimate of the effect Very low quality: we have very little confidence in the effect estimate; the true effect is likely to be substantially different from the estimate of effect | ||||||
| 1Assumed increase of hearing threshold: median of three studies with respectively 3.4, 3.6 and 5.2 dB increase in hearing threshold at 4 kHz after five years' follow‐up. | ||||||
Background
Description of the condition
Noise is a prevalent exposure in many workplaces. Approximately nine million workers in the USA alone are exposed to time‐weighted average (TWA) sound levels of 85 dB(A) and above (WHO 2002). The first signs of noise‐induced hearing loss (NIHL) can be detected in the typical 4 kHz 'notch' observed on audiograms (Nelson 2005). Worldwide, 16% of disabling hearing loss in adults is attributed to occupational noise. Leigh 1999 calculated a global annual incidence of NIHL of 1,628,000 cases, which means an annual incidence rate of almost two new cases per 1000 older workers. Noise‐induced hearing loss is the second most common self‐reported occupational illness or injury, despite decades of study, workplace interventions, and regulations (Nelson 2005). Information is also available for self‐reported hearing difficulty and tinnitus among workers and non‐workers (Masterson 2016a), incidence and prevalence data from audiometric data sets (Masterson 2015), and disability‐adjusted life years (Masterson 2016b). Self‐reported rates of hearing difficulty and tinnitus were higher among noise‐exposed workers when compared to non‐workers (Masterson 2016a). The mining sector had the highest prevalence of workers with any hearing impairment (hearing loss that impacts day‐to‐day activities), and with moderate or worse impairment, followed by the construction and manufacturing sectors (Masterson 2016b); rates were also high among workers in the healthcare and social assistance sector (Masterson 2015). Two‐and‐a‐half healthy life years were lost each year for every 1000 noise‐exposed US workers because of hearing impairment. Mining, construction and manufacturing workers lost more healthy years than workers in other industry sectors, respectively 3.5, 3.1 and 2.7 healthy years were lost each year for every 1000 workers due to hearing impairment.
Construction workers are still considered as an underserved population where it comes to hearing loss prevention, with one in twenty construction workers estimated to have occupational hearing loss (Suter 2009; Tak 2009). An analysis of the noise exposure on construction sites shows the difficulties for preventive interventions in this industrial sector. Due to the setting and nature of the job, noise exposure varies over time and there are often combined exposures such as chemicals and vibration. Various trades work in the same environment, which also puts quiet trades at risk. Communication and sound localisation are of vital importance for the workers but personal hearing protection devices can degrade those abilities. The use of personal hearing protection also causes other problems such as hygiene problems or occlusion effects (Suter 2002). Interventions to reduce noise at the source such as efficient design, retrofit, and maintenance of equipment or special marks for extra quiet equipment are presented in the literature but these have not been evaluated nor sufficiently implemented (Seixas 2001; Suter 2002; Trabeau 2008). Overall there is a lack of information about noise exposure and hearing ability of construction workers even though methods are available (Haron 2009; Neitzel 2011; Seixas 2001; Suter 2002). One reason is that it is difficult to keep records and organise follow‐up of workers in the construction industry. Mobility among the workers is high, employment periods are often short and seasonal, and self‐employed workers might not even be part of a hearing conservation programme (Suter 2002).
Long‐term exposure to noise levels beyond 80 dB(A) carries an increased risk of hearing loss, which increases with the noise level and can ultimately lead to hearing impairment (ISO 1990). The risk of hearing impairment also increases substantially with age. There are various definitions of hearing impairment in use. The most commonly used definition for hearing impairment is a weighted average hearing loss at 1 kHz, 2 kHz, 3 kHz and 4 kHz greater than 25 dB (John 2012). Such a hearing loss decreases the capacity to engage in conversation in meetings or social activities thus creating a significant barrier in establishing or maintaining emotional relationships. Measured this way, the probability of hearing impairment occurring in persons not exposed to noise at the ages of 35 and 65 is estimated to be 10% and 55% respectively, because it increases naturally with age. Ten years of noise exposure at the level of 100 dB(A) will raise the probability of hearing impairment for the same individuals to 94.5% and 99.5%. Thus, 10 years of noise exposure entails a relative risk of hearing impairment of 9.9 for a 35 year‐old worker and 1.8 for a 65 year‐old worker compared to their non‐exposed peers (Prince 1997). Concurrent exposure to ototoxic substances (that is, damaging to the cochlea or auditory nerve), such as solvents and heavy metals, may increase the damaging potential of noise (EU 2003; Johnson 2010). The condition is permanent and there is no effective treatment for permanent hearing loss resulting from excessive noise exposure. However, the risk of noise‐induced hearing loss can be greatly minimised if noise is reduced to below 80 dB(A) (ISO 1990).
Description of the intervention
The preventive potential of reducing noise exposure has led to mandatory HLPPs in many countries. However, the reportedly continuing high rate of occupational noise‐induced hearing loss casts doubt upon the effectiveness of these standards and workers' compliance with them. Moreover, the broad range of interventions included in HLPPs makes it difficult to appraise the most effective strategy for reducing risk.
How the intervention might work
There is a general belief that it is most effective to apply control measures in a hierarchical order. This means first using measures that eliminate the source of the noise and, at the other end of the spectrum, implementing measures that protect the individual worker only. In occupational hygiene terms this is called the hierarchy of controls (Ellenbecker 1996). Despite the general consensus that this should be the leading principle for noise reduction strategies at the workplace, the first attempt to reduce noise often is limited to the provision of hearing protectors. Also clinical interventions such as the use of magnesium or anti‐oxidants such as N‐acetylcysteine for preventing noise‐induced hearing loss have been studied (Le Prell 2012; Lynch 2005). These will not be included in this review.
Why it is important to do this review
A more general and non‐systematic review on the effectiveness of hearing conservation programmes concluded in 1995 that there was no convincing evidence that HLPPs are effective (Dobie 1995). A systematic review of studies that have evaluated interventions to reduce occupational exposure to noise or to decrease occupationally‐induced hearing loss is therefore warranted. This is the second update of a Cochrane Review originally published in 2009.
Objectives
To assess the effectiveness of non‐pharmaceutical interventions for preventing occupational noise exposure and occupational hearing loss compared to no or alternative interventions.
Methods
Criteria for considering studies for this review
Types of studies
We included randomised controlled trials (RCT), cluster‐randomised trials, controlled before‐after studies (CBA) and interrupted time‐series (ITS).
Evaluations of hearing loss prevention interventions can be biased by factors that also cause hearing loss other than noise, such as ageing or exposure to ototoxic substances (Kirchner 2012). Randomisation is the best protection against such bias. However, noise reduction is an intervention that is almost never carried out only at the individual level. Noise reduction in enterprises usually entails replacing noisy machinery or shielding off noisy machinery or tools. Cluster‐randomisation, in which whole companies or departments are randomly assigned to the intervention and control group, is a way to replace randomisation at the individual level and is a relatively new trial design.
As randomisation is difficult to perform for the interventions of interest in this review, we therefore also included CBA studies. There is no uniform nomenclature for non‐randomised studies. In the literature CBA studies are also known as cohort studies, quasi‐experimental studies, non‐randomised pre‐post‐intervention or controlled clinical trials. For studies that measured an immediate effect of hearing protection it was difficult to assess what the control group should be. We included only studies that measured an immediate effect of two types of hearing protectors if this was measured in the same study participants. For studies that measured hearing loss in the long‐term we excluded those that did not collect data on a proper control group but used only data from available databases.
In addition, hearing loss is often registered in medical databases. These can form a reliable source in which changes can be observed in trends over time as a result of interventions. These type of data are also called ITS. Cochrane Effective Practice and Organisation of Care (EPOC) has defined these as studies in which the outcome has been measured at least three times before and three times after the intervention (EPOC 2012; Ramsay 2003).
We also included uncontrolled before‐and‐after studies that evaluated the effectiveness of engineering controls in reducing noise levels to compare studies and review results in the discussion part of this review. We only included studies if they compared noise readings in the same location during similar work operations before and after engineering controls were implemented.
For the effect of hearing protection devices on noise attenuation, we only included studies that compared different devices worn by the same workers in real work conditions. This is because hearing attenuation depends both on the skills of the worker to fit a device and the properties of the device itself. A comparison between devices worn by different groups of workers would be a comparison between skills of workers and the attenuation of devices at the same time and the effects would be impossible to disentangle.
For the effect of training workers in the fitting of hearing protection devices on noise attenuation, we included studies with a comparison group including different workers but for the same device.
We excluded laboratory studies because it has been repeatedly reported that the results in the laboratory are often overly positive due to the lack of real‐world conditions, such as change of working tasks, differences in training in the fitting of devices, and wearing of glasses.
Types of participants
We included studies with male and female workers at workplaces exposed to noise levels of more than 80 dB(A) as a TWA over a period of an entire work shift or working day or part of the work shift.
Types of interventions
We included studies where the interventions intended to prevent noise‐induced hearing loss, or which formed part of a noise‐induced hearing loss prevention programme (HLPP). We included interventions consisting of one or more of the following elements.
-
Engineering controls: reducing or eliminating the source of the noise, changing materials, processes or workplace layout (NIOSH 1997)
-
Administrative controls: changing work practices, management policies or worker behaviour (NIOSH 1997)
-
Personal hearing protection devices (NIOSH 1998)
-
Hearing surveillance: monitoring the hearing levels of exposed workers (NIOSH 1998)
We excluded all clinical interventions such as the use of anti‐oxidants, magnesium or other compounds.
Types of outcome measures
We included two main outcomes: noise exposure and hearing loss. We included studies that reported the effects of the intervention on either noise exposure or hearing loss. For both outcomes we took the change in the outcome between before and after the implementation of the intervention. We did so because we included mostly non‐randomised studies where workers could already have had hearing loss before the intervention.
We included noise exposure as a primary outcome because the relation between exposure to noise at work and hearing loss has been well established (ISO 1990; Prince 1997). It can be safely assumed that interventions that reduce noise exposure will in turn lead to a decrease in participants with hearing loss. Noise exposure is therefore a good predictor of the eventual health outcome, hearing loss. We also made a distinction between short‐term and long‐term effects. We considered three follow‐up times as important: less than one year, one to five years and more than five years. Short‐term effects were considered if a change in outcome was possible in less than one year. Long‐term effects were considered to occur only after at least one year.
An alternative technique to evaluate immediate or long‐term effects on hearing ability is the measurement of otoacoustic emissions (OAEs). OAEs provide a measurement of outer hair cell integrity with two most prominent types of measurement: transient evoked otoacoustic emissions (TEOAEs), and dual‐tone evoked distortion product otoacoustic emissions (DPOAEs). Both can be used for example to check the attenuation effect of hearing protection devices in real wearing conditions (Bockstael 2008). Nevertheless there is an ongoing discussion in the literature about the use of TEOAEs and DPOAEs as diagnostic tools in occupational health examinations of noise‐exposed workers (EU‐OSHA 2009; Helleman 2010). Because of considerable uncertainties regarding the use of OAEs we decided not to use OAE test results as outcome measurements. References of studies qualifying for inclusion but measuring noise‐induced hearing loss only as OAEs were listed as references pending classification. In cases where study results were measured additionally as OAEs the studies were included with the outcome measurements mentioned above.
Noise exposure
We included studies that directly measured the change in noise exposure level either as the difference in noise levels (dB) or the difference in exposure doses (%). We also included noise levels measured as noise attenuation effects from hearing protection devices assessed as the difference in hearing threshold with and without the hearing protection device. We included studies regardless of the frequencies measured (Hz). All outcomes can either be measured as long‐term or short‐term effects, depending on the follow‐up time of the study.
We included studies reporting noise exposure measurements for either a specific area or a specific worker. Measurement instruments could be fixed in one location, attached on a person (e.g. on the collar), or installed in the ear behind the hearing protection device (e.g. microphone in real ear (MIRE)). We included outcome measures of the exposure for one point in time and measures over longer time periods (e.g. average exposure over one working day).
We intended to include all noise outcomes that were measured with a measurement instrument that was calibrated before use. Although we intended to include only measurements executed according to a written national or international standard, in which information on measurement method and measurement settings (e.g. time weighting) was given, this turned out to be an excessively strict criterion. We therefore included all reported noise measurements.
Noise level
We included studies that reported sound pressure levels, either as absolute measures or as averages over time in dB.
TWA noise levels are used to convey a worker's daily exposure to noise (normalised to an eight‐hour day), taking into account the average levels of noise and time spent in each area. Decisions have to be made on which parameters to use in these calculations. The Equivalent Continuous Sound Level ‐ (Leq) is based on the equal energy hypothesis, which states that equal amounts of sound energy produce equal amounts of damage regardless of their distribution over time. Leq calculations are based on an 85 dB limit and an exchange rate of 3 dB. However, in the USA, noise levels are often reported as TWA, or averaged sound level (Lavg) with an exchange rate of 5 dB and threshold level of 90 dB, as these are the levels set by the Occupational Safety and Health Administration (OSHA). This results in one hour of exposure to 90 dB(A) in US studies being equal to half an hour of exposure to 95 dB(A) whereas in European studies this would equal half an hour of 93 dB(A). As a consequence, the US time‐weighted figure would be an underestimate of the same noise levels measured according to the European methodology. Because we had no method to correct for this, we used the outcome measurements as described by the study authors.
Exposure dose
The calculation of a dose is based on the permissible exposure limit. For example a day‐long exposure to 90 dB(A) would lead to a dose of 100% for that day. With each 5 dB increase or decrease the dose would be doubled or halved. However different standards recommend different exposure limits (e.g. 90 dB(A), 85 dB(A) or 80 dB(A)) as well as different exchange rates (e.g. 3 dB, 4 dB, 5 dB) and different threshold levels. As a consequence, the same exposure would be expressed as a smaller dose for the higher exposure limits. We again used the outcome measurements as described by the study authors.
Immediate hearing threshold changes
We included measures of differences between hearing thresholds with and without hearing protection. This method is called real ear attenuation at threshold (REAT) and is equivalent to the noise attenuation effect of the hearing protection device.
Hearing loss
Short‐term effects
We also included measures of temporary threshold shifts (TTS), a temporary decrease in hearing acuity after some hours of exposure. We included studies that used TTS as an effect measure of the noise attenuation of hearing protection devices.
Long‐term effects
We included studies that measured permanent threshold shifts (PTS). Those threshold shifts are non‐reversible and only occur after several years. We also included studies that used standard thresholds shifts (STS), which is a measure of a minimum relevant shift of the PTS by, for example, 15 dB.
We intended to include only hearing loss measured with a calibrated audiometer and defined by means of a written protocol, which was the case for most studies. However, in some cases this was found to be an excessively strict criterion so we also included audiometric measurements when there was no written protocol reported.
Search methods for identification of studies
We conducted systematic searches for RCTs, CBA studies, ITS studies and noise reduction case studies. We used no restrictions on language, publication year or publication status. The date of the last search was 26 September 2016 for Pubmed, Embase, Web of Science and OSHupdate. The database Central and CINAHL were last searched on 3 October 2016.
Electronic searches
We searched:
-
the Cochrane Central Register of Controlled Trials (CENTRAL, 2008, Issue 4) in the Cochrane Library (until 3 October 2016) (including Cochrane Ear, Nose and Throat Disorders Group's Trials Register and Cochrane Work's Trials Register);
-
PubMed (until 26 September 2016);
-
Embase (using Embase) (until 26 September 2016);
-
CINAHL (until 3 October 2016);
-
Web of Science (until 26 September 2016);
-
OSHupdate (until 26 September 2016) (including the databases from the US National Institute of Occupational Safety and Health (NIOSHTIC, NIOSHTIC‐2), International Occupational Safety and Health Information Centre of The International Labour Organisation (CISDOC), International bibliographic, UK Health and Safety executive (HSELINE), Institut de recherche Robert‐Sauvé en santé et en sécurité du travail, Canada (IRRST), Ryerson Technical University Library, Toronto, Canada (RILOSH)
The following databases were included in the original review (2008) but were not included in the update, as we did not locate additional relevant studies:
-
LILACS;
-
KoreaMed;
-
IndMed;
-
PakMediNet;
-
CAB Abstracts;
-
BIOSIS Previews;
-
mR CT (Current Controlled Trials); and
-
Google.
We modelled subject strategies for databases on the search strategy designed for CENTRAL. We did not combine subject strategies with a methodological filter because we wanted to identify all occupational health studies, both randomised and non‐randomised (Verbeek 2005).
The search strategy for CENTRAL is shown in Appendix 1.
The search strategies for other key databases including PubMed are shown in Appendix 2.
Searching other resources
We scanned reference lists of identified studies for further papers. We also searched PubMed, TRIPdatabase, NHS Evidence ‐ Ear, Nose, Throat and Audiology (formerly NLH ENT & Audiology Specialist Library) and Google to retrieve existing systematic reviews possibly relevant to this systematic review, so that we could scan their reference lists for additional studies.
We contacted Dr E Berger who keeps an up‐to‐date archive on hearing protector effectiveness and obtained copies from the grey literature studies that he included in his review of real field effectiveness studies of hearing protection. Of the 22 studies in his review we were unable to retrieve two because they were personal communications (Berger 1996).
Data collection and analysis
Selection of studies
To determine which studies to assess further, pairs of the review authors (EK, JV, TM, WD, CM, SF) independently scanned the titles and abstracts of every record retrieved. Full articles were retrieved for further assessment if the information given suggested that the study could meet all of the following criteria:
-
included workers exposed to noise levels greater than 80 dB(A);
-
concerned interventions aimed at reduction of noise exposure to prevent noise‐induced hearing loss;
-
used noise exposure or noise‐induced hearing loss as an outcome; and
-
used RCT, CBA studies, or ITS as the study design.
Data extraction and management
For each study included, pairs of the review authors (EK, JV, TM, WD, CM, SF) extracted data independently. Where possible, we resolved discrepancies in the results by discussion or we involved a third review author. Studies with unclear information were often over 20 years old and we refrained from trying to contact the authors. We contacted eight authors of recent studies and obtained additional data from three (Davies 2008; Joy 2007; Rabinowitz 2011).
We used a standard form to extract the following information: characteristics of the study (design, methods of randomisation); setting; participants; interventions and outcomes (types of outcome measures, timing of outcomes, adverse events).
Assessment of risk of bias in included studies
We conducted the evaluation of the risk of bias of RCTs and cohort studies included in the review by means of the checklist developed by Downs and Black (Downs 1998). We only used the items on internal validity of the checklist and not those on reporting quality or external validity. We slightly adapted the way answers to the items of the checklist were formulated to make it fit the Cochrane 'Risk of bias' tool (Higgins 2011a) as implemented in Review Manager 5 (RevMan 5) (RevMan 2014) and thus used the judgements high, low or unclear risk of bias instead of using scores 1 or 0 as proposed by the checklist authors.
For non‐randomised studies, for item allocation concealment, we judged all studies to have an unclear risk of bias because this item is not applicable to non‐randomised studies and the effect of unconcealed allocation on the outcome hearing loss and noise is unknown.
We assessed risk of bias due to confounding separately for noise and hearing loss outcomes. We judged studies based on the assessment and adjustment for confounders. If confounders were similar at baseline or confounders were adjusted for adequately in the analysis, we judged studies to be at low risk of bias for confounding. We judged none of the engineering control studies to be at high risk of bias for confounding, as we don't know of factors that have been shown to be significant predictors of noise exposure. For behavioural interventions, we considered age, gender, and hearing loss to be possible confounders of noise exposure outcomes as those participant characteristics could lead to different behaviours (e.g. distance to noisy equipment) and could therefore alter the effect of an intervention. We judged studies adjusting for at least two of those possible confounders to have a low risk of bias and studies not fulfilling that criteria to have an unknown risk of bias. We considered age, hearing levels, recreational noise exposure, ototoxic medication and previous ear infections as possible confounders for studies measuring hearing loss outcomes. We considered age to be the most important confounder and judged studies that did not adjust for age to have a high risk of bias irrespective of adjustment to other factors. We considered age to be similar between intervention and control group as long as the mean age difference was smaller than five years. We judged studies that adjusted for age and at least one additional possible confounder to have a low risk of bias. Studies that did not report sufficient information about baseline differences or necessary statistical adjustments, we judged to have an unknown risk of bias.
Pairs of the review authors independently examined the risk of bias of the studies. We resolved disagreements by discussion. We defined low risk of bias overall as a score of more than 50% on the internal validity scale of the checklist.
For ITS we used the quality criteria as presented by Ramsay 2003.
Measures of treatment effect
The included studies measured noise exposure on a continuous scale in decibels (dB) with A or C weighting. The A weighting takes into account the sensitivity of the human ear to certain frequencies whereas the C weighting is used for peak sound level measurements. The studies calculated the effect of an intervention, either as attenuation of noise level or as change in noise level over time, by subtracting the level after the intervention from the level measured before the intervention. In one study (Joy 2007) the authors used the medians of all noise measurements in a year as the measure of effect in an ITS analysis to show the long‐term effect. We used a PEL of 90 dB(A) as 100% and a 5 dB exchange rate to convert the change in the exposure dose into the change in dB(A).
For immediate effects of noise attenuation, authors used the MIRE to measure the difference in noise levels inside and outside hearing protection (Pääkkönen 1998; Pääkkönen 2001). They also used REAT, which measures hearing thresholds with and without protection (Park 1991b protection). The MIRE and REAT methods yield slightly different results at different frequencies. For studies that reported noise attenuation in dB for each frequency measured we calculated the mean noise attenuation over all measured frequencies. We calculated the mean noise attenuation as the average of the reported means with a standard deviation calculated from the variances, as square root of the average variance (Salmani 2014). We applied the same formula for calculating the mean noise exposure from machinery if studies reported mean noise level measurements separately for multiple machines of the same type (Küpper 2013). Two studies included participants with different times of follow‐up between control and intervention group. We recalculated the effect as RR per 100 person years to adjust for the differences in the length of follow‐up (Muhr 2006; Muhr 2016). We have reported the original study data that we used to recalculate the outcomes in Table 1.
| Küpper 2013 (Outcome: Leq 8 h (dB)a) ‐ noise exposure of rescue helicopter personnel ‐ case study | ||||||||||
| Study data | Recalculation ‐ group mean, SD | |||||||||
| Helicopter type | Helicopter name | mean | SD | dB min | dB max | variance | mean | SD | ||
| with advanced technology | EC 135b | 85.80 | 4.00 | 73.00 | 97.00 | 16.00 | 87.9 | 4.16 | ||
| BK 117b | 87.20 | 4.60 | 74.00 | 101.00 | 21.16 | |||||
| Bell 206 B Jetrangerc | 88.80 | 4.00 | 76.00 | 100.00 | 16.00 | |||||
| Bell 206 Longranger IIc | 89.80 | 4.00 | 77.00 | 101.00 | 16.00 | |||||
| without advanced technology | UH 1Db | 86.80 | 4.00 | 74.00 | 98.00 | 16.00 | 98.41 | 4.49 | ||
| BO 105c | 91.80 | 4.00 | 79.00 | 103.00 | 16.00 | |||||
| Sea Kingc | 92.60 | 7.50 | 78.00 | 114.00 | 56.25 | |||||
| Ecureuil AS350Bb | 92.80 | 4.00 | 80.00 | 104.00 | 16.00 | |||||
| Alouette IIIbb | 98.40 | 4.80 | 85.00 | 113.00 | 23.04 | |||||
| Sikorsky H‐23/UH12c | 99.70 | 3.90 | 87.00 | 111.00 | 15.21 | |||||
| Alouette IIb | 100.10 | 4.40 | 87.00 | 113.00 | 19.36 | |||||
| Sikorsky H‐34c | 101.8 | 4.00 | 89.00 | 113.00 | 16.00 | |||||
| Mi‐4c | 109.10 | 3.50 | 97.00 | 117.00 | 12.25 | |||||
| Sikorsky H‐37 Mojavec | 111 | 3.40 | 99.00 | 119.00 | 11.56 | |||||
| Muhr 2016 (Outcome: STS) ‐ hearing loss Swedish military ‐ CBA | ||||||||||
| Study data | Recalculation | |||||||||
| group | follow up mean (month) | # Events | N | follow up (month/year) | per 100 person‐years | |||||
| event rate | lnRR | SE | ||||||||
| HLPP | 8 | 9 | 395 | 0.67 | 3.4 | 0.002 | 0.379 | |||
| non‐exposed | 13 | 31 | 839 | 1.08 | 3.4 | |||||
| Muhr 2006 (Outcome: STS) ‐ hearing loss Swedish military ‐ CBA | ||||||||||
| Study data | Recalculation | |||||||||
| group | follow up mean (month) | # Events | N | group | follow up (year) | # Events | N | per 100 person‐years | ||
| event rate | lnRR | SE | ||||||||
| HLPP (low‐exposed) | 9.25 | 11 | 291 | HLPP (low‐exposed) | 0.77 | 11 | 291 | 4.9 | 0.73 | 1.04 |
| HLPP (medium‐exposed) | 13 | 252 | non‐exposed (split 1) | 0.92 | 1 | 46 | 2.37 | |||
| HLPP (high‐exposed) | 35 | 204 | HLPP (medium‐exposed) | 0.77 | 13 | 252 | 6.69 | 1.04 | 1.04 | |
| non‐exposed | 11 | 4 | 138 | non‐exposed (split 2) | 0.92 | 1 | 46 | 2.37 | ||
| HLPP (high‐exposed) | 0.77 | 35 | 204 | 22.26 | 1.55 | 0.73 | ||||
| non‐exposed (split 3) | 0.92 | 2 | 46 | 4.74 | ||||||
| non‐exposed (all) | 0.92 | 4 | 138 | 3.16 | ||||||
| low‐exposed vs non‐exposed (all) | 0.439 | 0.584 | ||||||||
| medium‐exposed vs non‐exposed (all) | 0.750 | 0.572 | ||||||||
| high‐exposed vs non‐exposed (all) | 1.951 | 0.528 | ||||||||
aBased on task analysis and helicopter noise data, task analysis is based on measurements of type and duration of tasks per rescue operation of four bases over 1 year (total, 2726 rescue operations).
bStudy authors obtained helicopter noise data from own measurements (n = 3 per helicopter).
cStudy authors obtained helicopter noise data from other studies.
For hearing loss, the included studies measured effects both as permanent loss of hearing acuity (dB units) on a continuous scale expressed as differences in means, and as the rate of workers with a certain amount of hearing loss, which was expressed using odds ratios (OR). Usually these amounts were defined as a STS and measured as a change or shift in hearing loss of at least 10 dB averaged over 2 kHz, 3 kHz and 4 kHz in either ear, which is also the criterion used by OSHA to maintain a safe and healthy work environment (Rabinowitz 2007). In one study this was defined as the better ear (Davies 2008) and in one study as the worst ear (Lee‐Feldstein 1993). In one study the STS was considered for all frequencies tested (Nilsson 1980). In another study it was defined as greater than 15 dB at the best ear at any test frequency (Muhr 2006). We considered STS to be the event and were recalculated rates per 100 person‐years for all studies that used the STS as an outcome measure.
We used the change in hearing level at 4 kHz as the effect measure because this frequency is generally considered to be the most susceptible to the detrimental effects of noise (May 2000). We took the last minus the first measurement in all cases, thus a positive number indicates an increase in hearing loss.
For TTS, all outcomes were recalculated in order to reflect hearing thresholds before noise exposure minus hearing thresholds after noise exposure. TTS is highly dependent on the amount of time between exposure and measurement. All authors indicated this time interval. We presented the results according to this time interval.
For time‐series, were extracted data from the original papers (Joy 2007) or obtained additional data from the authors (Rabinowitz 2011) and re‐analysed them according to the recommended methods for analysis of ITS designs for inclusion in systematic reviews (Ramsay 2003). These methods utilise a segmented time‐series regression analysis to estimate the effect of an intervention while taking into account secular time trends and any autocorrelation between individual observations. For the included studies, we fitted a first order auto regressive time‐series model to the data using a modification of the parameters of Ramsay 2003. Details of the mode specification are as follows:
Y = ß0+ ß1time+ ß2 (time‐p) I(time > p) +ß3 I(time > p)+ E, E˜ N(0, s2)
For time = 1,...,T, where p is the time of the start of the intervention, I (time ≥ p) is a function that takes the value 1 if time is p or later and zero otherwise, and where the errors E are assumed to follow a first order auto regressive process (AR1). The parameters ß have the following interpretation:
ß1 is the pre‐intervention slope;
ß2 is the difference between post and pre‐intervention slopes;
ß3 is the change in level at the beginning of the intervention period, meaning that it is the difference between the observed level at the first intervention time point and that predicted by the pre‐intervention time trend.
Unit of analysis issues
There were no cluster‐randomised trials for which we had to assess a unit of analysis error. However, there were three studies (Adera 2000; Lee‐Feldstein 1993; Simpson 1994) that used a cluster of companies as a control group but did not correct for the clustering effect and thus had artificially high precision. We assumed an intra‐class correlation coefficient of 0.06, based on analogy of the study on workplace health promotion by Martinson 1999. We adjusted the size of the control groups for the design effect according to the Cochrane Handbook for Systematic Reviews of Interventions (Higgins 2011b). For studies that used a cluster‐randomised design and adjusted statistically for the design effect (Berg 2009), we used the adjusted OR to be entered into RevMan 5 (RevMan 2014). One other study (Seixas 2011) used a combined cluster‐ and individually‐randomised design but did not provide enough information about the clustering to be able to adjust for clustering effects.
One study had multiple intervention arms (Hager 1982). To include it in a meta‐analysis, we chose to include the arm with the most active intervention and the control group with the least noise exposure, thus avoiding the inclusion of the same control group twice.
Dealing with missing data
We asked seven study authors to provide missing data and we obtained data from six of them (Davies 2008; Huttunen 2011; Joy 2007; Moshammer 2015; Rabinowitz 2011; Seixas 2011). In two cases we calculated standard deviations (SDs) from P values (Hager 1982) and standard errors (SE) from OR and 95% confidence interval (CI) values (Berg 2009) according to the Cochrane Handbook for Systematic Reviews of Interventions (Higgins 2011b).
We also contacted the author of one study to categorise the evaluated helicopters to the two different types of intervention compared in the study (with or without advanced technology) and we received the additional information (Küpper 2013).
Assessment of heterogeneity
First we assessed whether studies were sufficiently homogeneous to be included in one comparison, based on the similarity of the timing of the outcome measurement (immediate or long‐term) and the type of intervention, what the control condition was (poor‐quality HLPP, non‐exposed workers) and when the outcome was measured (one year, one to five years, more than five years).
Next, we tested for statistical heterogeneity by means of the I² statistic as presented in the meta‐analysis graphs generated by the RevMan software (Higgins 2003; RevMan 2014). If this test statistic was greater than 50% we considered there to be substantial heterogeneity between studies (Deeks 2011).
Assessment of reporting biases
Since there were no comparisons for which we could include more than five studies we did not attempt to assess publication bias.
Data synthesis
We included studies that we deemed sufficiently homogeneous with regard to interventions, participants, settings and the outcomes measured in a meta‐analysis.
For HLPPs, we deemed both the change in hearing loss at 4 kHz and the STS sufficiently similar to combine them as similar outcomes in the meta‐analysis. Because the former is a continuous measure and the latter a dichotomous measure we had to use effect sizes to combine these two. We used the mean change in hearing threshold at 4 kHz to calculate effect size as follows: (effect size = mean change difference/standard deviation). For the rate of occurrence of standard threshold shifts we calculated the ORs, took their natural logarithm and divided them by 1.8 to transform them also into effect sizes (Chinn 2000). We entered these effect sizes and their standard errors into the meta‐analysis using the Generic Inverse Variance method as implemented in RevMan 2014.
When the results were statistically heterogeneous according to the I² statistic we used a random‐effects model for the meta‐analysis.
After meta‐analysis we recalculated a mean change difference from the pooled effect size using the median standard deviation of the included studies in the formula: (pooled mean change = pooled effect size * median standard deviation).
Some study authors reported the results according to hearing thresholds at the start of the study (Pell 1973). We included these categories as subgroups and combined them in the meta‐analysis as subcategories. Other study authors presented the data according to gender (Adera 2000) and we combined these data following the instructions of the Cochrane Handbook for Systematic Reviews of Interventions (Deeks 2011). In two studies, we used the same control group as a comparison in multiple subgroups. To avoid using the same control group data more than once, we split the control group into three (Muhr 2006) or two (Seixas 2011) equal subgroups that were subsequently combined in the meta‐analysis.
In our protocol we planned to conduct a qualitative synthesis. However the GRADE approach is now the recommended method. We therefore used the GRADE approach to rate the quality of evidence as follows. The quality of the evidence on a specific outcome is based on the study design, risk of bias, consistency, directness (generalisability) and precision (sufficient or precise data) of results and publication bias across all studies that measure that particular outcome. The overall quality is considered to be high when RCTs with low risk of bias, with consistent, precise and directly applicable results and without evidence of reporting bias, measure the results for the outcome, and is reduced by a level for each of the factors not met. For observational studies, the overall quality is considered low at the start of the rating process and this can be further downgraded in the same way as for RCTs but upgraded if the studies have special strengths (large effect size, dose response and findings contrary to confounding). For non‐randomised studies, the judgement of the quality of the evidence is more difficult than for RCTs because of the wider variation and the lesser likelihood of being able to combine studies in a meta‐analysis. Therefore we presented our GRADE rating in a separate table that includes all comparisons (Table 2).
| Comparison | N Studies | 1. RoB? | 2. Inconsistent? | 3. Indirect? | 4. Imprecise? | 5. Pub bias? | 6. Large ES? | 7. DR? | 8. Opp Conf | Qualitya |
| Outcome noise | ||||||||||
| Legislation vs no legislation | 1 ITS | yes | 1 study | no | no | 1 study | yes | no | no | very low (1) |
| One HPD vs another HPD | 1 RCT 4 CBA | 2 yes | no | no | no | not shown | no | no | no | low (1) |
| HPD+Instruction vs HPD‐instruction | 2 RCT | 2 no | no | no | yes | not shown | na | na | na | moderate (4) |
| Information vs no information | 1 RCT (2 arms) | 1 yes | 1 study | no | yes | 1 study | na | na | na | low (1, 4) |
| Outcome hearing loss | ||||||||||
| One HPD vs another HPD (TTS) | 2 CBA | no data | ||||||||
| Muffs vs plugs | 2 CBA | 2 yes | no | no | yes | not shown | no | no | no | very low (1,4) |
| Frequent HPD vs less frequent use | 1 CBA | 1 yes | 1 study | no | yes | 1 study | no | no | no | very low (1) |
| HLPP vs audiometry | 1 RCT | 1 yes | 1 study | no | no | 1 study | na | na | na | moderate (1) |
| HLPP+exposure information vs HLPP‐information | 1 CBA | 1 yes | 1 study | no | yes | 1 study | no | no | no | very low (1,4) |
| Frequent HPD in HLPP vs less | 5 CBA | 5 yes | no | no | yes | not shown | no | no | no | very low (1,4) |
| HLPP vs no exposure | 7 CBA | 7 yes | no | no | yes | not shown | no | no | no | very low (1,4) |
| Follow‐up vs no follow‐up | 1 CBA | 1 yes | 1 study | no | yes | 1 study | no | no | no | very low (1,4) |
| HLPP+long shifts vs HLPP normal | 1 CBA | 1 yes | 1 study | no | yes | 1 study | no | no | no | very low (1,4) |
1‐5 Reasons for downgrading: 1. Risk of bias/Limitations in study design 2. Inconsistency between studies. 3. Indirectness of PICO 4. Imprecision of the results 5. Publication bias. 6‐8 Reasons for upgrading: 6. Large effect size. 7. Dose‐repsonse relationship 8. Confounding opposes the direction of the effect;
na= not applicable; 1 study = only one study available and impossible to assess consistency or publication bias
aFinal grading of quality of evidence, between brackets domain that led to down/upgrading the quality.
The interpretation of the quality of evidence is as follows. With high‐quality evidence, it is unlikely that further research will change our confidence in the estimate of effect. With moderate‐quality evidence, further research is likely to have an impact and may change the estimates. With low‐quality evidence, further research is very likely to have an important impact and with very low‐quality evidence any estimate of effect is very uncertain.
We entered the results for the most important comparisons into eight 'Summary of findings' tables (summary of findings Table for the main comparison). To keep the amount of information manageable we left out the comparison of the effects of various hearing protection devices on noise exposure and temporary hearing loss, the comparison of frequent versus less frequent use, the comparison of follow‐up of STS and the comparison of HLPP for long versus normal shifts.
Sensitivity analysis
We conducted a sensitivity analysis, which involved leaving out one study (Pell 1973) that had the highest risk of bias, due to differences in age between the intervention and the control group.
Results
Description of studies
Results of the search
Our search yielded 3899 references in total (1360 in 2009, plus 1129 in 2012, plus 1410 in 2016). The search in 2009 yielded 1198 references from a combined search of MEDLINE and Embase using Ovid, 86 from CINAHL, 76 from CENTRAL and 9 from the Cochrane Work's Trials Register up until 2005. An additional search from 2005 to December 2008 yielded an additional 256 references. The update in January and February 2012 for references from 2009 to 2012 brought 54 new references from PubMed, 299 from Embase, 601 from Web of Science, 168 from NIOSHTIC and 7 references from reference lists of articles. The update in September 2016 was based on two searches, one in 2015 and one in 2016. The combined retrieval for references from 2012 to 2016 yielded 987 references from PubMed and Embase, 385 from Web of Science, and 204 from OSHupdate. We searched CENTRAL and CINAHL for references from 2009 to September 2016 and found 294 references from CENTRAL (excluding reviews) and 263 from CINAHL.
The screening of references for eligibility resulted in 265 studies (104 in 2009, 50 in 2012, 111 in 2016), which we then retrieved in full text.
Following further screening using our eligibility checklist, 29 articles ultimately fulfilled our inclusion criteria. One article described two trials (Park 1991a instructions; Park 1991b protection) and two articles described the same study. This resulted in 29 included studies (21 in 2009, 4 in 2012, and 4 in 2016).
See also Figure 1.

PRISMA Study flow diagram
Included studies
See also the 'Characteristics of included studies' table.
Design
We had considerable difficulty in establishing the types of study design used. In many articles, studies reported technical measurements that would apparently not be prone to bias and would not require a control group or long‐term follow‐up. Four studies used a randomised design (Berg 2009; Park 1991a instructions; Salmani 2014; Seixas 2011) and one study used a quasi‐randomised design with alternation (Royster 1980). Another two studies used an interrupted time‐series (ITS) design (Joy 2007; Rabinowitz 2011). All remaining studies used a form of controlled before‐after (CBA) design.
To measure the long‐term effects of hearing loss prevention, only two studies used a randomised design (Berg 2009; Seixas 2011) and another study used a CBA design but reported data for an ITS analysis, and we used these data for the analysis (Rabinowitz 2011). Seven studies implicitly used an equivalence design in which they tried to prove that the intervention (a hearing loss prevention programme (HLPP)) led to the same amount of hearing loss as in a non‐exposed control group (Davies 2008;Gosztonyi 1975; Hager 1982; Lee‐Feldstein 1993; Muhr 2006; Muhr 2016; Pell 1973). In another five studies, the authors tried to show that better implementation of a HLPP led to a better outcome. Adera 1993, Adera 2000 and Simpson 1994 compared study companies with companies from a database called ANSI S12.13, which were rated as having a very high‐quality HLPP, and Brink 2002 compared workers who wore hearing protection less than 33% of the time to those who wore hearing protection more often. A similar comparison of more versus less use of hearing protection devices was used in Moshammer 2015. Heyer 2011 used a retrospective study design and combined historical data of noise exposure, working tasks and audiometric results of the workforce of three plants. The authors compared the effect on the rate of hearing change during the time individuals were in a well‐implemented hearing conservation programme, with the rate observed among individuals who were in less well‐implemented programmes, by programme component.
All but three of the long‐term equivalence and implementation studies were retrospective by design meaning that the data were already gathered before the study was planned. The first of these three studies reported to be prospective (Pell 1973), whereas the second study (Seixas 2011) collected noise exposure measurement data pre‐intervention and at two‐ and four month follow‐up times. The third study (Berg 2009) collected hearing loss data of students enrolled in a HLPP prospectively over a three‐ and 16‐year follow‐up and used retrospectively collected data to assess exposure for the 16‐year follow‐up. Many studies reported only the change, which made it difficult to assess baseline comparability of age and hearing loss.
To measure the immediate effects of hearing protection, studies essentially used before‐after measurements in which it was not always clearly stated what the comparison was. In this case, before and after the intervention should be interpreted as 'outside' versus 'inside' the hearing protector (Pääkkönen 1998; Pääkkönen 2001; Park 1991a instructions) or 'before exposure with protection' versus 'after exposure with protection' (Horie 2002; Royster 1980).
For assessing the immediate effect, all studies used a prospective design in which data were gathered after the study had been planned. One study used a Latin square design in which participants were randomised to four different types of hearing protection with and without instructions for use (Park 1991a instructions; Park 1991b protection). Another study randomised participants to the same type of hearing protections either with or without training (Salmani 2014). In five studies the same workers used sequentially different types of hearing protection (Horie 2002; Huttunen 2011; Pääkkönen 1998; Pääkkönen 2001; Royster 1980).
Sample sizes
Although large numbers of workers were examined, this number was reduced substantially in many cases because workers had to be followed over a long period of time in the same noise levels, thus reducing the number of eligible subjects.
The sample size of the first ITS noise exposure study was 142,735 workplaces, measured during 18 years of follow‐up, four years post‐intervention and 14 years pre‐intervention with the intervention implemented in the year 2000 (Joy 2007). The other ITS study included 312 workers followed during nine years from 2000 to 2009 with the year of intervention being 2005 (Rabinowitz 2011).
In the 19 hearing loss evaluation studies, sample sizes ranged from 43 to 22,376 workers, amounting to a total of 84,153 with an average of 4429 participants per study. We adjusted for the cluster effect by reducing the sample size according to the number of clusters and the design effect. After adjustment the sample sizes totaled 55,908 with an average of 2943 participants per study.
Numbers in the eight immediate effect studies ranged from 4 to 150, amounting to a total of 358, with an average of 45 workers per study.
Setting
The legislation evaluation study (Joy 2007) was carried out in coal mines and the administrative control intervention study (Seixas 2011) in construction sites in the USA.
Eight studies evaluated immediate effects (noise attenuation) and three studies evaluated the preventive effect on hearing loss of personal hearing protection devices. One of the immediate studies was carried out in Japan, one in Iran, three in Finland and three in the USA. Four of the immediate effect studies were carried out after 2000, three in the 1990s and one in 1980. All of the hearing loss studies were based on data from the 1980s, two were carried out in Sweden and one in Austria. In one study we found a potential conflict of interest as the company that produced the earplugs that were tested also participated in the study (Royster 1980).
Nine long‐term hearing loss evaluation studies were published after 2000, five in the 1990s, one in the 1980s, and two in the 1970s. Since most studies were retrospective, they were based on data gathered in the decade(s) preceding their publication.
Thirteen of the long‐term HLPP evaluation studies were carried out in the USA, one in Canada (Davies 2008) and two in Sweden (Muhr 2006; Muhr 2016), which is of importance because of the different weighting used for summarising noise levels over time.
Two older studies were carried out by in‐house occupational health professionals (Gosztonyi 1975; Pell 1973) and four by in‐house military officials (Adera 1993; Meyer 1993; Muhr 2006; Muhr 2016). They were thus actually financed by the companies that were supposed to benefit from the HLPP. This created, in our view, a potential conflict of interest in the sense that the employers of the authors could potentially benefit from a positive result of their studies.
Participants
The participants in all studies were described as being exposed to noise at work. However, these descriptions were often based on measurement methods that were not clearly described.
Noise‐exposed participants worked on construction sites (one study), in mines (one study), in the automobile industry (three studies), in the steel industry (two studies), in an aluminium smelter (one study), in agriculture (one study), in the lumber industry (one study), in an orchestra (one study), at a shipyard (two studies), in the military (four studies), in one unspecified company (three studies) or were gathered from various workplaces (eight studies). One study did not specify the type of industry nor the type of jobs included in the study (Salmani 2014).
In most studies only men were included or there were mostly male workers at the workplaces that were studied.
Interventions
We found one study that evaluated technical noise reduction measures over time based on the change of legislation that forced coal mines to take measures to decrease noise levels (Joy 2007). The new legislation established the primacy of engineering and administrative controls and an Action Level of 85 dB(A), at which enrolment for hearing conservation programmes should be started. The legislation officially came into effect in the year 2000 but many employers had already prepared themselves to address it in 1999. Nevertheless we chose the year 2000 as the intervention year but we also present results for the year 1999. The intervention was supposed to be equally effective for the above ground and underground workplaces. We present the outcomes for both situations.
Another study intended to change workers' behaviour (Seixas 2011). The intervention consisted of two types of information and the distribution of personal noise level indicators. The control group received information at baseline only. It was a one‐time information session consisting of two hours of instructions for hearing protection device use and fitting as well as noise control techniques (sound barriers and distance). The three intervention groups each received a different combination of the interventions: both types of information (extensive information), noise level indicator with extensive information, or noise level indicator with one‐time information only. The extensive information consisted of a one month long weekly on‐site training session focusing on areas of hearing protection device use and noise control. Workers receiving the noise level indicator clipped it to their shoulder or chest. The noise level indicators were implemented for two months and gave a light signal when the noise level exceeded 85 dB(A), 95 dB(A), 105 dB(A) and in addition vibrated at 115 dB(A).
Studies that evaluated hearing protection devices evaluated active noise cancellation devices (Horie 2002; Pääkkönen 2001), special communication earmuffs (Pääkkönen 1998), the effect of fitting instructions (Park 1991a instructions; Salmani 2014), alternative hearing protection (Erlandsson 1980; Huttunen 2011; Nilsson 1980; Park 1991b protection; Royster 1980) or the percentage of working time with hearing protection devices (more versus less use) (Moshammer 2015).
In sixteen studies a hearing surveillance, hearing conservation or HLPP was evaluated as the intervention of interest. We have described the contents of the interventions extensively in Table 3. For example, in one study the intervention consisted of annual audiometry and instruction once but with yearly reminders delivered to the home address and free hearing protection whereas the control group received only audiometry (Berg 2009). In another study the intervention was daily monitoring of at‐ear noise exposure with regular feedback from a supervisor in addition to the ongoing mandatory hearing conservation programme (Rabinowitz 2011). In Meyer 1993 the intervention was frequent follow‐up for one year after a standard threshold shift (STS) had been found in a person exposed to noise, with the aim of detecting susceptible people with increasing hearing loss. Reynolds 1990a evaluated the effectiveness of a HLPP for workers on 12‐hour work shifts.
| Study | Described as HLPP | HPD provided | Noise measurements | Technical measures | Administrative measures | Audiometry |
| ? | Enforced mandatory wearing of hearing protection | Personal dosimeter twice a year | ? | ? | Audiometric booth ANSI‐OSHA | |
| HLPP | ? based on Aldera 1993 we assumed that excellent implementation meant better use of hearing protection | ? | ? | ? | Audiogram taken | |
| HCP | Beside educational intervention, hearing protection devices were provided free to students and replaced regularly | Students were given opportunity to use sound level meter unaffiliated | Not part of the programme | Not part of the programme | Yearly audiometric testing, calibrated per ANSI standard with Hughson‐Westlake modification of the ascending threshold technique | |
| HCP | ? | Area‐wide sound level surveys | ? | ? | Annual audiometric evaluation calibrated Bekesy audiometer ANSI | |
| HCP | Hearing protection was one element | Noise monitoring was one element | Engineering controls were one element | Administrative controls were one element | Audiometric evaluation by certified audiometric technicians | |
| ? | ? | Personal noise dosimeters | ? | ? | Calibrated ISO r389 | |
| HCP | Earmuffs mandatory in noise areas | Calibrated personal dosimeters sound level meter in all shop areas | ? | ? | Soundproof booth ANSI s3.1‐1960 | |
| Walsh‐Healy standard; OSHA | Yes, mandatory use of approved protection | ? | Gradual continuous engineering control wherever, whenever economically feasible | ? | Audiometric surveys | |
| HCP | ? Percent use of hearing protection used as a quality indicator | Used as a quality indicator of the programmes: high quality if any monitoring and worker input reported by focus group | Stated as part of the programme but not possible to evaluate with the study data | Training and education stated as part of the programme but not possible to evaluate with study data | Audiometric testing, quality varies, evaluated as days between two tests, audiometry method not reported | |
| ? | ? | Annual sound surveys | ? | ? | Automatic audiometer according to ANSI s3.6‐1996 | |
| HCP | Must be provided with effective HP devices | Identify hazardous noise | ? | Detailed follow‐up 3 and 6 months after a STS | ? | |
| HCP | Earmuffs and or earplugs with level‐dependent function limited to 82 dB(A) with SNR 27 dB | Standardised noise measurements | Risk areas around weapon use | ? | Screening audiometry | |
| HCP, stated to be stricter than to the one evaluated in Muhr 2006 | Mandatory use of HPDs, earmuffs and or earplugs with or without level‐dependent function (enable speech communication), (stated to be stricter recommendations and better devices) | ? | safety distances (stated to be stricter) | Mandatory training in HPD use and education in NIHL and noise induced tinnitus, stricter audiometry inclusion criteria for acceptance to military service (≤ 25 dB average HL for the frequencies 0.5 to 8 kHz in both ears, 30 dB HL at one or more frequencies, and 35–40 dB HL at one single frequency) (to exclude mild hearing loss cases presumed to be more vulnerable to HL) | Screening audiometry at begin and end of military service | |
| Routine HCP | ? | Individual noise dosimetry over long periods | ? | ? | Calibrated ISO 389 isolated booth | |
| ? | Mandatory hearing protection | Routine noise level surveys | Noise abatement | ? | Automatic Bekesy‐type ANSI calibrated | |
| HCP | 3 specific types of earplugs | Sound survey, noise dosimeters | ? | ? | Audiometric database | |
| Demonstrate excellent HCP practices | ? | ? | ? | ? | ? |
ANSI = American National Standards Institute
HCP = hearing conservation programme
HL = hearing loss
HLPP = hearing loss prevention programme
HPD = hearing protection device
ISO = International Organization for Standardization
OSHA =Occupational Safety and Health Administration
SNR = Single Number Rating
? = not reported
Outcomes and measures
In one ITS and all but one long‐term evaluation study, the authors measured hearing thresholds as an outcome measure for hearing loss. Three studies measured the difference in hearing thresholds with and without hearing protection as the effect measure for noise attenuation. One ITS and three short‐term evaluation studies measured sound pressure levels as the outcome measure for noise exposure.
In some studies the authors also reported the percentage of workers whose hearing got worse or the percentage of workers whose hearing got better. Others used the increase in standard deviations of hearing levels to show the effect of the programme or summarised audiometric results in low and high frequencies. However we did not use these percentages of workers nor increases in standard deviation because they did not add anything to the outcomes that we already included.
Authors used varying definitions of hearing loss. In seven studies they used STS, defined as an increase in hearing threshold of at least 10 dB averaged over 2 kHz, 3 kHz or 4 kHz compared to a baseline measurement or the previous measurement (Adera 1993; Adera 2000; Berg 2009; Davies 2008; Lee‐Feldstein 1993; Meyer 1993; Simpson 1994 ). In one study STS was defined as an increase of more than 10 dB in any frequency. In another study STS was defined as an increase of 15 dB in one or both ears at one or more frequencies (0.25 kHz to 8 kHz) between the first and second audiometry (Muhr 2016). In other studies hearing loss was measured as the average over the frequencies 0.5 kHz, 1 kHz, 2 kHz, 3 kHz, 4 kHz and 6 kHz. One study used the frequencies 3 kHz, 4 kHz and 6 kHz (Heyer 2011). Two studies also included the frequency of 8 kHz (Muhr 2006; Park 1991a instructions). One study used the rate of hearing loss in the binaural average hearing level at 2 kHz, 3 kHz, and 4 kHz (Rabinowitz 2011). One study did not clearly define hearing loss but used the baseline hearing minus age‐related hearing loss at the last observation as the outcome measurement (Moshammer 2015).
The authors of two studies measured temporary threshold shifts (TTS) as the effect measure of noise attenuation (difference in hearing levels before and after exposure to noise) (Horie 2002; Royster 1980). Four other studies used REAT (the differences in hearing thresholds with and without hearing protection) (Huttunen 2011; Park 1991a instructions; Park 1991b protection; Salmani 2014). Two studies reported the mean (SD) noise attenuation over the frequencies 0.125 kHz to 8 kHz (Huttunen 2011) or over the frequencies 0.5 kHz, 1 kHz, 2 kHz, 3 kHz, 4 kHz, 6 kHz, and 8 kHz (Salmani 2014). In Salmani 2014 the SDs reported were unrealistically small and did not match with the box‐plots in the figure. We contacted the study authors but they did not reply. We then extracted the interquartile ranges from the box‐plots and multiplied them by 1.35 to obtain a more realistic estimate of the SDs, according to the advice in the Cochrane Handbook for Systematic Reviews of Interventions (Deeks 2011). One study reported the noise attenuation per frequency (0.5 kHz, 1 kHz, 2 kHz, 3 kHz, 4 kHz, 6 kHz, and 8 kHz) and we calculated the mean (SD) noise attenuation over all measured frequencies (Park 1991a instructions).
In one study, authors used personal noise dosimeters with a 3 dB exchange rate, 80 dB(A) threshold level, 85 dB(A) criterion level, and slow response to measure the full‐shift Equivalent Continuous Sound Level (Leq) (Seixas 2011). In one study authors used the eight‐hour time‐weighted average (TWA) as a measure for noise exposure transformed to a permissible exposure level (PEL) dose (Joy 2007). The PEL dose transforms the noise levels to an equivalent of a 90 dB(A) noise exposure by using an exchange rate of 5 dB for doubling the dose. This translates 90 dB(A) into a 100% PEL dose, and for example 85 dB(A) into 50% and 95 dB(A) into 150% PEL dose. Two studies used MIRE (microphone in real ear) to measure the difference in noise levels inside and outside the hearing protectors (Pääkkönen 1998; Pääkkönen 2001).
Case studies
In this 2017 update, we collected 12 additional references that reported effects of engineering control interventions of 107 cases (Azman 2012; Caillet 2012; Cockrell 2015; Golmohammadi 2014; HSE 2013; HSE 2015; Küpper 2013; Maling 2016; Morata 2015; Pan 2016; Thompson 2015; Wilson 2016). Table 4 provides an overview of study characteristics. We have presented the results under the heading Effects of interventions and in additional tables (Table 5; Table 6; Table 7; Table 8; Table 9; Table 10; Table 11).
| Reference ID | Case studies included in review | |||||
| Number of cases | Type of industry | Country | Interventiona | Measureb | Additional information (number of cases) | |
| 1 | mining (1) | USA | retro‐fit | noise level, noise dose | description of noise measurement (1), follow‐up (1) | |
| 1 | offshore helicopter (1) | France | all retro‐fit | noise level | description of noise measurement (1), funding (1), conflict of interest (1) | |
| 2 | manufacturing (2) | USA | all retro‐fit | noise level, dose | description of noise measurement (2) | |
| 3 | steel industry (3) | Iran | all retro‐fit | noise level, dose | description of noise measurement (3), funding (3), conflict of interest (3) | |
| 57 | manufacturing (57) | not reported | new 6 retro‐fit 51 | noise level | ‐ | |
| 2 | manufacturing (2) | not reported | all retro‐fit | noise level | ‐ | |
| 1 | alpine rescue operation (helicopter) (1) | Austria, Switzerland | new | noise level | description of noise measurement, follow‐up, statistical tests used | |
| 8 | textile (1), paper shredding (1), manufacturing (6) | USA | new 4, retro‐fit 2, both 2 | noise level | ‐ | |
| 18 | manufacturing (15), drilling industry (2), mining (1) | not reported | new 5, retro‐fit 11, both 2 | noise level, dose | description of noise measurement (3) | |
| 3 | mining (3) | Australia | all retro‐fit | dose | description of noise measurement (2), funding (3), follow‐up (immediate) (3) | |
| 5 | mining(5) | USA | all retro‐fit | noise level, dose | description of noise measurement (1), adverse effects: engine over‐heating (1), time of intervention: 2014/2015 (1) | |
| 6 | manufacturing (6) | not reported | all retro‐fit | noise level | ‐ | |
| Total | 107 | manufacturing (88), mining (10), steel (3), drilling (2), helicopter (2), textile (1), paper shredding (1) | Australia (3), Iran (3), France (1), USA (16), Austria and Switzerland (1), nr (26) | retro‐fit (86), new (16), both (4) | noise level, dose | description of noise measurement (14), funding (7), follow‐up (5), conflict of interest (4), adverse effects (1), time of intervention (1), statistical tests used (1) |
aTypes of intervention: installation of completely new equipment (new), intervention to improve existing equipment (e.g. new parts, additional damping material layers) (retro‐fit), or a combination of new and retro‐fit interventions (both).
bNoise level (including time‐weighted averages or sound pressure levels), dose (including calculations according to OSHA, NIOSH, or MSHA PEL specifications).
| New equipment | |||||||
| Noise source | Intervention | follow‐up | Initial noise level | Noise level after | 8 h TWA before | 8 h TWA after | Reference ID |
| Helicopter | Modern helicopter with advanced technology (compared to older helicopters without advanced technology) | short term (1 year) | mean 98.41 (SD 4.49) (n = 10) | mean 87.9 (SD 4.16) (n = 4) | |||
| Pumps | New high‐pressure coolant pumps have been installed at various metal cutting operations. These new pumps produce more pressure and more volume directly at the cutting tools. | not reported | 110 dB | 87 dB | |||
| Drill | New injector drill with a sound enclosure for a deep drilling operation | not reported | 110 dB | 95 dB | |||
| Roof fans | Old roof fans were replaced with new high‐efficiency fans | not reported | lowered the noise below the fan | ||||
| Air gun | Air gun substitution | not reported | 94 dB | 85 dB | |||
| Fork lifts | Use of tugs instead of fork lifts | not reported | 92 dB | 72 dB | |||
| Alarm system | Change from audible alarm to visual warning and pressure sensor | not reported | 95 dB | 0 dB | |||
| Air wand | Replacement of 45 air wands | not reported | 112.8 dB | 90.1 dB | |||
| Bottling line ‐ rinser‐filler‐capper machine | Purchase of a new bottling line | not reported | 89 dB | below 80 dB | |||
| Bottle‐blowers | New bottle‐blowers and segregation | not reported | 86‐87 dB | below 83 dB | |||
| Glass bottles on transport conveyer | Purchasing new design of bottle transport conveyor | not reported | 101 dB | 83 dB | |||
| Packing machinery ‐ Compressors and compressed‐air exhausts | Purchasing policy and fitted silencers | not reported | above 90 dB | below 85 dB | |||
| Bakery machinery | Not purchasing equipment that produced noise level above 85 dB, company’s health and safety adviser would visit the makers of new machinery during its manufacture and conduct a noise assessment to make sure the machinery did not exceed 85 dB | not reported | 94 dB | 85 dB | |||
| Bottle‐laner ‐ bottles banging together on laner conveyor | New machine with guide‐rails | not reported | 93‐96 dB | 87 dB | |||
| Number of cases: 14 | mean before | mean after | mean reduction | ||||
| Noise level dB | 97.4 dB | 77.7 dB | 19.7 | ||||
| TWA dB | 98.41 (SD 4.49) | 87.9 (SD 4.16) | 10.51 (95% CI 15.45 to 5.57) | ||||
TWA = time weighted average
| Acoustic panels and curtains | |||||||
| Noise source | Intervention | Follow‐up | Initial noise level | Noise level after | Dose before | Dose after | Reference ID |
| Production noise | Door | not reported | 85 dB | 79 dB | |||
| Blast furnace | Control rooms were redesigned in order to improve acoustical condition: installation of a UPVC window with vacuumed double‐layered glass 80 x 80 cm and double wall for entrance by 90° rotate plus a 2.0 × 1.2 m steel door without glass | not reported | 80 dB | 52.6 dB | |||
| Blast furnace | In rest room wall facing to the furnace was made from the armed concrete with a thickness of 20 cm, length of 9 m, and height of 3 m and was located in the entrance by 90° rotate | not reported | 86.1 dB | 58.4 dB | |||
| Blast furnace | Control room and rest room redesigned to improve acoustical condition | not reported | 236% (unspecified) | 130% (unspecified) | |||
| Product impact on multi‐head weigher | Fitted flexible PVC curtains | not reported | 92 dB | 88 dB | |||
| Packaging lines | Fitted acoustic baffles to ceiling | not reported | Above 90 dB | below 90 dB | |||
| Noise from hearing protection zones affecting quieter areas | Erected acoustic panels and automatic doors between hearing protection zones and quieter areas | not reported | Above 90 dB | below 85 dB | |||
| Filler pump | Improved efficiency of pump and added acoustic hood | not reported | 96 dB | 86 dB | |||
| Compressed air in bottle transportation | Acoustic side panels fitted | not reported | 85–86 dB | 73 dB | |||
| Product impact on hoppers | Flexible PVC curtains fitted | not reported | Above 90 dB | 83 dB | |||
| Number of cases: 10 | mean before | mean after | mean reduction | ||||
| noise level dB | 88.3 | 77.2 | 11.1 | ||||
| Dose % (unspecified) | 236 | 130 | 106 | ||||
| Damping material and silencers | |||||||||
| Noise source | Intervention | Follow‐up | Initialnoise level | Noise level after | 8 h TWA before | 8 h TWA after | Dose before | Dose after | Reference ID |
| Confetti machine | Damped machine surfaces: Replaced vacuums with small cyclones that were quieter and had fewer clogs, Installed conveyors to carry the paper into the disintegrators | not reported | 95 dB | 85 dB | |||||
| Production noise | Installation of sound absorbing panels, shields, covers, insulation, sheeting, installation of mufflers for fans and solenoids, reduction of compressed‐air pressure and volume in vents, use of vibrating personal alarms instead of audible alarms | not reported | 2 to 11 dB noise reduction | ||||||
| Helicopter | Cover of structural leaks with lightweight materials (e.g. new door seals) and damping of the structure (patches of constrained visco‐elastic materials that are bonded to the structure), optimised sound‐proofing panels (sandwich panels with “soft core”) and windows (thickened laminated windows with damping layer and double glazing), and Main Gear Box suspension devices (laminated ball joints at MGB support strut foot) | not reported | 7 dB noise reduction | ||||||
| Pump | Suppressor on palletizer hydraulic pump to minimize hydraulic banging, pump whine contained in sound‐insulated box | not reported | 88 dB | 83 dB | |||||
| Air‐rotary drill rig | Installation of hydraulic noise suppressors and a lead‐fiberglass blanket covering Ihe gap between the inside door and the cab frame | not reported | 98 dB | 95 dB | MSHA PEL 280%; NIOSH 3222% | MSHA PEL 210%: NIOSH 2585% | |||
| Air‐rotary drill rig | Installation of hydraulic noise suppressors | not reported | 98 dB | 97 dB | MSHA PEL 280%; NIOSH 3222% | MSHA PEL 249%; NIOSH 2951% | |||
| Pumps | Installing mufflers on pumps | not reported | 98.1 dB | 81.3 dB | |||||
| Haul trucks in underground metal/non‐metal mines | Improving the engine compartment noise barrier: the usual barrier material has been replaced with a barrier material part number Duracote 5356, manufactured by Durasonic | not reported | MSHA PEL 495% | MSHA PEL 416% | |||||
| Chiller | Reduce noise from a chiller with a combination of acoustic absorbent and retro‐fit constrained layer damping | not reported | 8 dB noise reduction | ||||||
| High‐speed strip‐fed press | Normally the press legs are welded boxes, the press frame was isolated from the fabricated legs by inserting 6 mm composite pads between frame and legs | not reported | 101 dB | 92 dB | |||||
| Product impact on hoppers and chutes | Coated internally with food‐grade, sound‐deadening material | not reported | 96–98 dB | Noise reduced by 2‐8 dB | |||||
| Gas cylinder impact on metal table | Rubber matting on table | not reported | 110 dB peaks | removal of peak noises | |||||
| Product impact on ducting | Lagged ductwork with noise‐absorbent padding | not reported | 92 dB | 84 dB | |||||
| Product impact on vibrating components | Coated externally with sound‐deadening material | not reported | 92 dB | 84 dB | |||||
| Bread‐basket stacking machine | Fitted hydraulic dampers | not reported | 92 dB | 83 dB | |||||
| Hand‐crimping metal foil packages | Mounted on layers of rubber | not reported | 86–89 dB | 85–86 dB | |||||
| Keg impact on concrete floor | Fitted rubber matting on to floor | not reported | High noise levels | Noise levels reduced | |||||
| Gas cylinder impact on metal ‘A’ frame trolleys | Fitted rubber matting on to trolleys | not reported | 110 dB peaks | Peak noise levels reduced | |||||
| Road tanker degassing | Fitted silencers | not reported | 92 dB | 83 dB | |||||
| Evaporative condensers and refrigeration plant | Fitted silencers | not reported | 94 dB | 83–87 dB | |||||
| Number of cases: 20 | mean before | mean after | mean reduction | ||||||
| noise level dB | 93.6 | 86.5 | 7 | ||||||
| TWA dB | 101 | 92 | 9 | ||||||
| Dose % (MSHA PEL) [dosimeter settings: | 351.7 | 291.7 | 60 | ||||||
| Dose % (NIOSH) [dosimeter settings: | 3222 | 2768 | 454 | ||||||
MSHA = Mine safety and health administration
NIOSH = National Institute for Occupational Safety and Health
PEL = permissible exposure limit
| Design changes | |||||||||
| Noise source | Intervention | Follow‐up | Initial noise level | Noise level after | 8 h TWA before | 8 h TWA after | Dose before | Dose after | Reference ID |
| Roof bolting machine at underground coal mines | New drill bit isolator | immediate | reduced by 3.2 dB | MSHA PEL per hole 0.85% | MSHA PEL per hole 0.57% | ||||
| short term (after 253 holes and 628 m) | reduced by 2.2 dB | MSHA PEL per hole 0.9% | MSHA PEL per hole 0.66% | ||||||
| 4‐roll calender in a tire manufacturing facility "calender operator" | Replacing the piercer brackets, optimising alignment and improving preventative maintenance (increased and more frequent lubrication of the piercer and other areas of the equipment with high friction or pressure) | not reported | 87.7 dB | 86.3 dB | OSHA dose 72.8% | OSHA dose 59.6% | |||
| 4‐roll calender in a tire manufacturing facility "wind up operator" | Replacing the piercer brackets, optimising alignment and improving preventative maintenance (increased and more frequent lubrication of the piercer and other areas of the equipment with high friction or pressure) | not reported | 93.1 dB | 89 dB | OSHA dose 153% | OSHA dose 87.3% | |||
| Heavy metal arms which drove the reciprocating blade on the machines | Alternative linkage using flexible nylon straps | not reported | 95 dB | 75 dB | |||||
| Tobacco filter making machine | Machine design improvements on a tobacco filter making machine and room improvements | not reported | 9 dB reduction | ||||||
| Weaving machines | Use of different spindle | not reported | 100 dB | 90 dB | |||||
| Locomotive for mining | Active noise control | immediate | |||||||
| Mining truck | Active noise control | immediate | |||||||
| Mining truck | active noise control and damping material | immediate | |||||||
| Filler | Filler outfeed: line shaft removed, individual drives installed | not reported | 107 dB | 81 dB | |||||
| Con‐air dryer | Machine set on vibration mounts, quieter blower | not reported | 94 dB | 85 dB | |||||
| Transfer cart | not reported | not reported | 94 dB | 79 dB | |||||
| Trimmer | rReplacing nozzles from trimmer with in feed decline drive belt | not reported | 98 to 113 dB | 86 to 104 dB | |||||
| Continuous mining machine | Exchange of a single sprocket chain for a dual sprocket chain on a continuous mining machine (CMM, Joy Mining Machine 14CM‐15) | not reported | 93.4 to 93.3 dB | 92 dB | MSHA PEL 159 % | MSHA PEL 132.5% | |||
| Moen case former | Exchange of pneumatic cylinder for servo‐mandrel | not reported | 97 dB | 87 dB | |||||
| Cart | Exchange of cart wheels | not reported | 88 dB | 72 dB | |||||
| Standard longwall cutting drums (mining) | Modified set of longwall cutting drums instead of a set of standard (baseline) drums | not reported | 98 dB | 92 dB | 95.7 dB | 93.1 dB | MSHA PEL 220.5% | MSHA PEL 158.6% | |
| Haul trucks in underground metal/non‐metal mines | Improving the engine compartment noise barrier and changing the fan type, size, and rotation speed (larger fan of different design and different fan pulley to reduce the fan rotation speed to 90%) | not reported | 102 dB | 93 dB | MSHA PEL 495% | MSHA PEL 158% | |||
| Load‐haul‐dumps (LHDs) in underground metal/non‐metal mines | Improving the engine compartment noise barrier and changing the fan type, size, and rotation speed (larger fan of a different design and a different fan hub to reduce the fan rotation speed to roughly 87% and new noise barrier material (Duracote Durasonic 5356)) | not reported | 98 dB | 96 dB | MSHA PEL 289% | MSHA PEL 231% | |||
| Load‐haul‐dumps (LHDs) in underground metal/non‐metal mines | Improving the engine compartment noise barrier and changing the fan type, size, and rotation speed (a larger fan of a different design was installed as well as a different fan hub to reduce the fan rotation speed to roughly 95%) | not reported | 98 dB | 93 dB | MSHA PEL 289% | MSHA PEL 142% | |||
| Standard camshaft washer drying nozzles (pneumatic) | Pneumatic nozzles replaced with suitable entraining units | not reported | 12 dB reduction | ||||||
| Drier fan | Retro‐fitting aerodynamic and acoustic elements inside fan casings and the associated ductwork | not reported | 9 dB reduction | ||||||
| Aluminium can extract and chopper fans | Fitting aerodynamic inserts inside the fan casing | not reported | 22 dB reduction | ||||||
| Separator (large thin sheet distribution dome) | alteration to a vibratory separator: forming this component in stainless sound deadened steel | not reported | 105 dB | 89 dB | |||||
| Metal trays | Replacing metal trays with plastic trays | not reported | 89 dB | 84‐85 dB | |||||
| Metal wheels on baking racks | Replacing baking rack wheels with resin wheels | not reported | above 100 dB | 86‐92 dB | |||||
| Loosening product from baking tins with air knives | Air knives modified to operate with a diffuse air jet | not reported | above 90 dB | below 85 dB | |||||
| Bottles and cans banging together on conveyors | Fitted a pressureless combiner conveyor system | not reported | above 90 dB | below 90 dB | |||||
| Baking tins banging together on chain or slat conveyors | Installing ‘tin‐friendly’ conveyors | not reported | above 90 dB | below 85 dB | |||||
| Manual changeover of baking tins on conveyor | Installed robots to handle pans | not reported | 94‐96 dB | below 90 dB | |||||
| Water pumps on filling machines | Replaced with air pumps and fitted silencers | not reported | 90 dB | 84 dB | |||||
| Filling sachets and cups | New design of horizontal powder‐feeder and enclosed machine | not reported | 83‐84 dB | 80 dB | |||||
| Bottle manufacture, filling and packing lines | Acoustic panels fitted to walls, high ceiling installed | not reported | Above 90 dB | 83 dB | |||||
| Contact between metal trays and metal tracking | Replaced with plastic tracking | not reported | 94 dB | 87 dB | |||||
| Product impact on metal chutes | Replaced with plastic chutes | not reported | 96‐98 dB | 90 dB | |||||
| Electrically powered sausage‐spooling machines | Replaced with compressed‐air spooler | not reported | 86‐90 dB | below 80 dB | |||||
| Tray‐indexing arm | Plastic caps on fingers of indexing arm | not reported | 94 dB | 87‐89 dB | |||||
| Vibratory conveyor | Ensured conveyor only used at least noisy speed | not reported | above 90 dB | below 85 | |||||
| Glass bottles on conveyor | New design of conveyor with different chain speeds | not reported | 101 dB | 84 dB | |||||
| Lidding and de‐lidding tins | Installed robots to lid and de‐lid baking tins | not reported | 90‐93 dB | 88 dB | |||||
| Number of cases: 41 | mean before | mean after | mean reduction | ||||||
| Noise level dB | 94.5 dB | 85.3 dB | 9.6 dB | ||||||
| TWA dB | 95.4 | 91.8 | 3.4 dB | ||||||
| Dose % (OSHA) | 112.9 | 73.5 | 39.5 | ||||||
| Dose % (MSHA PEL) | 207.8 | 117.6 | 90.1 | ||||||
MSHA = Mine Safety and Health Administration
OSHA = Occupational Safety and Health Administration
PEL = permissible exposure limit
| Enclosure | |||||
| Noise source | Intervention | Follow‐up | Initial noise level | Noise level after | Reference ID |
| Conveyor | An enclosure was put over the conveyor at a cost of GBP 2000 and the conveyor speed was changed to reduce jar clashing | not reported | 96 dB | 86 dB | |
| Grinder | Enclosure over the grinder | not reported | 93 dB | 85 dB | |
| Not reported | Use of an enclosure with acoustical foam to deburring area | not reported | 104 dB | 82 dB | |
| Feeder | Enclosing the bowl feeder | not reported | 116 dB | 86 dB | |
| Compressed‐air knives | Enclosed machine | not reported | 91–92 dB | Below 85 dB | |
| Glass‐bottle conveyor | Enclosed the conveyor noise levels | not reported | Above 90 dB | reduced by 2‐8 dB | |
| Blower machine | Enclosed machine using sound‐absorbent panels | not reported | above 90 | Below 90 dB | |
| Bottle‐blowing machines | Machine enclosed and segregated | not reported | 94 dB | 89 dB | |
| Hammer mill | Enclosed in an acoustic booth | not reported | 102 dB | 87 dB | |
| Rinser‐filler‐capper machine | Enclosed machine | not reported | 85 dB | 73 dB | |
| Glass jars clashing together on conveyor | Fitted enclosure and changed conveyor speed | not reported | 96 dB | 86 dB | |
| Bottles banging together on filler infeed conveyor | Fitted covers over conveyor | not reported | 96‐100 dB | 92 dB | |
| Number of cases: 12 | mean before | mean after | mean reduction | ||
| Noise level (dB) | 96.3 dB | 85.5 dB | 11.8 dB | ||
| Maintenance | |||||
| Noise source | Intervention | Follow‐up | Initial noise level | Noise level after | Reference ID |
| Dough mixer | Maintenance modifications to a mixing machine | not reported | 94 dB | 91 dB | |
| Compressed air in soft drinks factory machines | Regular maintenance of machines to reduce noise from air leaks | not reported | High noise levels | Noise levels reduced by 3 to 4 dB | |
| Gearboxes on mixing machine | Lubricating gearboxes | not reported | 80–85 dB | Noise levels reduced by 1.5 dB | |
| Compressed‐air exhausts on vacuum‐wrapping machines | Fitting and maintaining silencers on wrapping machines | not reported | 88–90 dB | Below 85 dB | |
| Number of cases: 4 | mean before | mean after | mean reduction | ||
| Noise level dB | 88.5 dB | 85.7 dB | 3 dB | ||
| Segregation | |||||
| Noise source | Intervention | Follow‐up | Initial noise level | Noise level after | Reference ID |
| Main production area of bakery | Re‐routing pedestrian traffic, signage and training | not reported | 94 dB | below 85 dB | |
| Bowl chopper and mincers | Moved from main production area to an isolated area | not reported | 88–94 dB | below 85 dB | |
| Basket‐washing machine in main bakery | Moved to a separate building | not reported | 88 dB | Noise source removed | |
| High‐pressure air‐compressor | Located in a separate room | not reported | 110–112 dB | 60–70 dB outside room | |
| Vibrating cap‐hoppers | Located in separate enclosure | not reported | Above 90 dB | Noise source removed | |
| Air‐compressor | Located in separate, unmanned room | not reported | 94–95 dB | 80 dB | |
| Pet food processing area | Solid block wall with acoustic panelling between processing and packaging area | not reported | 95 dB | Below 85 dB | |
| Number of cases: 7 | mean before | mean after | mean reduction | ||
| Noise level dB | 97.1 dB | 80.0 dB | 17.1 dB | ||
For most cases the country location of the intervention was not reported (78 of 107 cases). Eighteen cases were implemented and evaluated in the USA, three in Australia, three in Iran and one in France.
Study authors reported funding sources for only seven out of 107 cases. Funds came from ALCOA, Strategic Marine, and SVT Engineering Consultants (no grant numbers reported) (Pan 2016), Hamadan University (Golmohammadi 2014), and Eurocopter Ltd (Caillet 2012). Study authors did not report conflict of interest, except for three cases where they declared no conflict of interest (Golmohammadi 2014). Nevertheless study authors reported for 14 cases that the outcome was evaluated by an acoustical consultant or an employee at the firm where the intervention was evaluated and a conflict of interest was apparent (Caillet 2012; Maling 2016; Wilson 2016).
For most cases (n = 87) the effect of the intervention was measured as change in absolute noise levels. For other cases the personal noise exposure for workers was measured, either as TWA (12) or as PEL exposure dose (OSHA 2, MSHA PEL 10, NIOSH 2, other 1).
Study authors reported information on the collection of the noise data only for 16 of the cases and on the measurement device settings only for eight of the cases. Study authors reported that noise data for those eight cases was collected A‐weighted with a slow response with four of those cases using a 5 dB exchange rate.
Most cases evaluated design changes (n = 41), followed by installing damping material and silencers (n = 20), purchasing new equipment (n = 14), the use of enclosures (n = 12), acoustic panels and curtains (n = 10), and maintenance only (n = 4).
None of the study authors reported the time of the intervention. Only for a few case studies authors reported the time of follow up (7 of 107 cases). Five cases had an immediate follow‐up (Azman 2012; Caillet 2012; Pan 2016) and two cases a short‐term follow‐up, with one study collecting data for one year (Küpper 2013) and another study reporting that the device was used to drill a total of 253 holes (Azman 2012).
Interventions were mostly evaluated in the manufacturing industry, followed by mining, steel, drilling, helicopter, textile, and paper‐shredding industry. Types of jobs, when reported, included operating machines and driving vehicles.
Excluded studies
See also the 'Characteristics of excluded studies' table.
We excluded one study (Pääkkönen 2005) because most of the data had already been reported in another article (Pääkkönen 1998) and the remainder did not meet the inclusion criteria. Most studies were excluded because they were either not empirical studies or because the authors did not use a control group. We excluded one controlled study on noise reduction in an MRI scanner because only the patients were exposed to the noise and not the healthcare workers (Mechfske 2002). In another study the participants were excluded if they were routinely exposed to occupational noise (Byrne 2011). Other identified studies of noise reduction in occupational settings were either case studies (Jelinic 2005; Knothe 1999; Pingle 2006; Scannell 1998; Stone 1971) or had a cross‐sectional design without pre‐intervention measurements (Chou 2009), consisted of descriptions of a noise abatement strategy but without a control group (as for example Groothoff 1999), or recommended noise reductions without evaluating them (such as Bowes 1990; Golmohammadi 2010; Kardous 2003). For long‐term hearing evaluation we excluded studies that used data from existing databases as control group material (Brühl 1994).
We excluded hearing protection studies that evaluated immediate effects on volunteers or that were not field studies such as Franks 2000; Merry 1992; Toivonen 2002; Williams 2004. We also excluded studies that evaluated the immediate effects of hearing protection but did not use the same workers for the evaluation (Giardino 1996; Neitzel 2005; Reynolds 1990b).
Risk of bias in included studies
The overview of risk of bias, based on the Downs and Black checklist (Downs 1998), is shown in Figure 2 and Figure 3.

Risk of bias graph: review authors' judgements about each risk of bias item presented as percentages across all included studies. Please note that the blank space corresponds to the studies that have an ITS study design.

Risk of bias summary: review authors' judgements about each risk of bias item for each included study. Please note that the blank spaces correspond to the studies that have an ITS study design.
Allocation
Four studies randomised participants to intervention and control groups (Berg 2009; Park 1991a instructions; Salmani 2014; Seixas 2011). Of these only one study properly described the randomisation process (Park 1991a instructions). Salmani 2014 indicated using random number tables but not how these were used and the authors did not provide an explanation. None of the included studies reported allocation concealment.
Confounding and selection bias
For studies measuring hearing loss, the age and hearing loss of the intervention and control group participants should be comparable at baseline. Comparability of both age and hearing loss at baseline could be ascertained in six studies (Davies 2008; Heyer 2011; Lee‐Feldstein 1993; Moshammer 2015; Muhr 2006; Muhr 2016), age only in two studies (Berg 2009; Gosztonyi 1975) and hearing loss only in one study (Pell 1973), and neither age nor hearing loss in one study (Hager 1982). In Pell 1973 there was a difference of 10 years between the protected and the non‐exposed group, artificially increasing the risk in the non‐exposed group. In Hager 1982 there was a 7.8 dB difference in hearing level at entry to the study between the protected and non‐exposed group, thus artificially increasing the risk in the protected group. In Lee‐Feldstein 1993 and Pell 1973 the non‐exposed group still had considerable exposure and could thus have confounded an effect of the intervention programme. One study recruited participants from different time periods for control and intervention groups (Muhr 2016). Thus, according to our judgment, only three long‐term evaluation studies had a low risk of confounding and selection bias.
Blinding
Only two studies reported blinded outcome assessment leading to our assessment of a low risk of bias (Heyer 2011; Salmani 2014).
Incomplete outcome data
Most study authors did not report the loss of follow‐up or had a loss of more than 20%. Only nine studies had a low risk of bias in this domain (Berg 2009; Gosztonyi 1975; Hager 1982; Huttunen 2011; Muhr 2006; Park 1991a instructions; Park 1991b protection; Royster 1980; Salmani 2014).
Selective reporting
We did not formally test for reporting bias. However as many studies were funded or carried out by professionals that were part of the company where the intervention took place it can be assumed that they had an interest in reporting favourable results. We considered it conceivable that the results of the studies were biased towards a positive outcome. Horie 2002 and Royster 1980 did not provide SDs and were thus at risk for outcome reporting bias.
Other potential sources of bias
One of the two ITS studies met three of the seven risk of bias criteria, which means that there was considerable risk of bias in the study (Joy 2007). The most serious risk of bias was that the intervention and the outcome measurements were not independent. The number of inspections on which the noise measurement data are based increased after the intervention and might also have included workplaces with lower noise levels that were not previously included (Table 12). The other ITS study met five of the seven criteria and thus we judged it to have a low risk of bias overall (Rabinowitz 2011).
| Study | Independence other changes | Sufficient data points | Formal test for trend | Intervention does not affect data | Blinded assessment of outcome | Complete data set | Reliable outcome measure |
| Not done | Done | Done | Not done | Not done | Not clear | Done | |
| Not done | Done | Done | Done | Not Done | Done | Done |
Overall risk of bias per study
Most studies scored poorly on all aspects of the checklist. Six studies (four well‐designed CBA studies and two well‐designed RCTs) achieved more than 50% of the maximum score of 13 on the internal validity scale of the checklist and we considered them to be at low risk of bias overall (Berg 2009; Horie 2002; Huttunen 2011; Muhr 2006; Park 1991a instructions; Salmani 2014).
Effects of interventions
See: Summary of findings for the main comparison Stricter legislation for noise exposure; Summary of findings 2 Earplugs with instruction versus without instruction (noise exposure); Summary of findings 3 Training plus exposure information compared to training (noise exposure); Summary of findings 4 Earmuffs versus earplugs (hearing loss); Summary of findings 5 Hearing loss prevention programme compared to audiometric testing (hearing loss); Summary of findings 6 Hearing loss prevention programme (HLPP) with exposure information compared to HLPP without exposure information (hearing loss); Summary of findings 7 Well‐implemented hearing loss prevention programme (HLPP) compared to less well‐implemented HLPP (hearing loss); Summary of findings 8 Hearing loss prevention programme (HLPP) compared to non‐exposed workers (hearing loss)
1 Effect on noise exposure
1.1 Immediate and short‐term follow‐up (noise reduction)
1.1.1 Engineering controls following legislation
Legislation in the mining industry (ITS)
We found one study that indirectly measured the effect of legislation on the decrease of noise levels. We assumed that the effect was mediated by better engineering controls. The content of legislation was directed at better compliance with the law with primacy for engineering and administrative controls.
Outcome: noise exposure (dB)
In the Joy 2007 study, in which legislation was introduced to reduce noise levels in the mining industry, the immediate effect of introducing changes in surface mining locations in the year 2000 was a 27.7 percentage points reduction in the median noise dose level (95% confidence interval (CI) −36.10 to −19.30 percentage points) compared to that predicted by extrapolation of the pre‐intervention slope (Analysis 1.1). The noise dose was measured as a permissible exposure level (PEL) dose percentage. Given a predicted post‐intervention level of 58.7 PEL dose and a measured level of 31 PEL dose, this means a change from 86.1 dB(A) to 81.6 dB(A) or a 4.5 dB(A) decrease.
For the underground mining noise levels the immediate effect was −16.8 noise dose percentage points (95% CI −23.5 to −10.1 percentage points). Given a predicted post‐intervention level of 79.8 PEL dose and a measured level of 63 PEL dose, this means a change from 88.3 dB(A) to 86.7 dB(A).
Taking 1999 as the year in which the change of legislation was implemented, the immediate effect is smaller but the change of slope larger and significant. We rated the overall quality of evidence as very low (see summary of findings Table for the main comparison).
1.1.2 Personal hearing protection devices
a) Hearing protection devices with instructions versus without instructions
Earmuffs with instruction versus without instruction (RCT, immediate)
Outcome: noise attenuation (REAT, dB(A) at one frequency)
The use of earmuffs with instructions compared to no instructions increased noise attenuation, measured as REAT, at 0.5 kHz, 1 kHz, 2 kHz, 3 kHz, 4 kHz, 6 kHz, and 8 kHz but the effect was non‐significant (Park 1991a instructions, Analysis 2.1; Analysis 2.2; Analysis 2.3; Analysis 2.4; Analysis 2.5; Analysis 2.6; Analysis 2.7). Noise attenuation at 4 kHz increased slightly but non‐significantly after instruction with 0.83 dB (95% CI −3.28 dB to 4.95 dB) for two different types of earmuffs (Analysis 2.5). We rated the quality of evidence as moderate.
Earplugs with instruction versus without instruction (RCT, immediate)
Outcome: noise attenuation (REAT, dB(A) at one frequency)
The use of earplugs with instructions compared to no instructions significantly increased noise attenuation at 0.5 kHz, 1 kHz, 2 kHz, 3 kHz, 4 kHz, 6 kHz, and 8 kHz, measured as REAT (Park 1991a instructions; Analysis 3.1; Analysis 3.2; Analysis 3.3; Analysis 3.4; Analysis 3.5; Analysis 3.6; Analysis 3.7). Noise attenuation at 4 kHz significantly increased with 7.97 dB (95% CI 3.60 dB to 12.34 dB) for two different types of earplugs (Analysis 3.5). We rated the quality of evidence as moderate.
Outcome: noise attenuation (REAT, mean dB(A) over frequencies 0.5 kHz, 1 kHz, 2 kHz, 3 kHz, 4 kHz, 6 kHz, 7 kHz, and 8 kHz)
The use of earplugs with instructions compared to no instructions significantly increased the mean noise attenuation over 0.5 kHz, 1 kHz, 2 kHz, 3 kHz, 4 kHz, 6 kHz, 7 kHz, and 8 kHz by 8.59 dB (95% CI 6.92 to 10.25; I² = 0%) (Park 1991a instructions; Salmani 2014; Analysis 3.8).
Earplugs with instructions versus earplugs without instructions but a higher noise reduction rate
Outcome: noise attenuation (REAT, mean dB(A) over frequencies 0.5 kHz, 1 kHz, 2 kHz, 3 kHz, 4 kHz, 6 kHz, 7 kHz, and 8 kHz)
The use of earplugs with instructions compared to earplugs with a higher noise reduction rate but without instructions significantly increased the mean noise attenuation over 0.5 kHz, 1 kHz, 2 kHz, 3 kHz, 4 kHz, 6 kHz, 7 kHz, and 8 kHz by 2.62 dB (95% CI 1.75 to 3.49) (Salmani 2014; Analysis 4.1).
b) Hearing protection versus alternative hearing protection
Hearing protection with noise cancelling devices versus hearing protection without noise cancelling devices (CBA, immediate)
Outcome: noise attenuation (MIRE, dB(A))
The installation of active noise cancellation in the same hearing protector increased the total noise reduction (measured with MIRE) from 17 dB(A) to 25 dB(A) in one helmet and from 20 dB(A) to 24 dB(A) in another helmet (Pääkkönen 2001, Analysis 5.1).
Earplugs with higher noise reduction rates versus earplugs with lower noise reduction rates (CBA, immediate)
Outcome: mean noise attenuation (REAT, dB over frequencies 0.125 kHz to 8 kHz)
Earplugs with a higher noise reduction rate compared to earplugs with a lower noise reduction rate increased noise attenuation by 3.1 dB(A) (95% CI 1.12 to 5.08) (Huttunen 2011; Analysis 6.1).
Noise attenuation of various hearing protection devices (RCT, CBA)
Outcome: noise attenuation (dB)
In the RCT and with fitting instructions, the EAR plug had a 17 dB higher noise attenuation than the Bilsom muff at 0.5 kHz and 16 dB at 1 kHz, and outperformed the other plug and muff at all other frequencies (Park 1991b protection).
For peak noise, the noise attenuation ranged between 22 dB (SD 14) and 27 dB (SD 16) for six different types of hearing protectors but none of the differences were significant (Pääkkönen 1998, Analysis 7.1).
1.1.3 Hearing loss prevention programmes (HLPP)
Hearing loss prevention training with noise level indicators versus training only (RCT, four‐month follow‐up)
Outcome: noise level (Leq dB(A))
In Seixas 2011, we compared the change in noise level of two intervention groups to one control group. The comparison was basic information plus extensive information in so called tool‐box sessions plus personal noise‐level indicators or basic information plus personal noise level indicators versus basic information only. We entered the two interventions as subgroups in one comparison. Noise level indicators with or without information did not show a significant effect in lowering the sound pressure level compared to the group receiving information only. At two months, the noise level decreased 0.32 dB more in the control group (95% CI −2.44, 3.08) but at four months' follow‐up the noise levels in the intervention group decreased 0.14 dB more than in the control group (95% CI −2.66 to 2.38) but neither were statistically significant (Analysis 8.1; Analysis 8.2).
Extensive information versus information only (RCT, four‐month follow‐up)
Outcome: noise level (Leq dB(A))
In the same study (Seixas 2011), noise levels of workers who received additional extensive information in four tool‐box sessions were compared to those of workers who received one baseline information session only but there were no significant differences. The noise level decreased 1.7 dB more in the information‐only control group at two months (95% CI −1.24 to 4.64) but 0.3 dB less at four months (95% CI −2.31 to 2.91) compared to the intervention group (Analysis 9.1; Analysis 9.2).
1.2 Long‐term follow‐up (noise reduction)
1.2.1 Engineering controls, legislation
Legislation in the mining industry (ITS)
The same study that measured immediate effects of legislation change also measured the impact of the intervention on the trend over time.
Outcome: noise exposure (dB)
In the Joy 2007 study, in which legislation was introduced to reduce noise levels in the mining industry, the long‐term effect in the change of trend in time as measured by the change in slope before and after the intervention was −2.1 PEL dose percentage points per year but this was not statistically significant (95% CI −4.9 to 0.7 points) (Analysis 1.2). For the underground mining noise levels the long‐term effect was −3.8 PEL dose points per year (95% CI −6.2 to −1.4 dB). Taking 1999 as the year in which the change of legislation was implemented, the immediate effect is smaller but the change of slope larger and significant. We rated the overall quality of evidence as very low (see summary of findings Table for the main comparison).
2 Effect on hearing loss
2.1 Short‐term follow‐up (temporary hearing loss)
2.1.1 Personal hearing protection devices
a) Hearing protection versus alternative hearing protection
Hearing protection with noise cancelling devices versus hearing protection without noise cancelling devices (CBA)
Outcome: TTS (dB at single frequencies 1 kHz, 2 kHz, 4 kHz, 6 kHz and 8 kHz)
Protectors with noise cancellation compared to protectors without noise cancellation resulted in less temporary hearing loss at the frequencies 1 kHz, 2 kHz, 4 kHz, 6 kHz and 8 kHz (Horie 2002, Analysis 5.2; Analysis 5.3; Analysis 5.4; Analysis 5.5; Analysis 5.6 ). The average temporary hearing loss at 4 kHz was 11.2 dB for conventional protectors without cancellation devices and 5.8 dB for different protectors with noise cancellation (Analysis 5.4). The study did not provide SDs and the statistical significance is unclear.
Earplug versus alternative earplug (RCT, CBA)
Outcome: TTS (dB at single frequencies 0.5 kHz, 1 kHz, 2 kHz, 3 kHz, 4 kHz and 6 kHz)
In one study, the EAR plug users had less TTS than those wearing another plug (V‐51‐R) which, according to the study authors, was significant but we could not check it due to missing standard deviations (Royster 1980, Analysis 10.1; Analysis 10.2; Analysis 10.3; Analysis 10.4; Analysis 10.5; Analysis 10.6).
All hearing protectors performed worse than the official attenuation ratings provided by the manufacturers.
2.2 Long‐term follow‐up (permanent hearing loss)
2.2.1 Personal hearing protection devices
a) Hearing protection versus alternative hearing protection
Earmuffs versus earplugs (CBA, three‐year follow‐up)
Outcome: standard threshold shift (STS)
Studies divided workers into high and low noise exposure groups. We did not combine study results in a meta‐analysis because of considerable inconsistency in the results due to one study. Most studies show no difference in preventing permanent hearing loss between earmuffs and earplugs (Erlandsson 1980; Nilsson 1980; Analysis 11.1). We rated the overall quality of evidence as very low.
b) More versus less hearing protection device use
Outcome: hearing loss (dB) (CBA, more than two‐year follow‐up)
In one study the authors reported that an increase in the use of hearing protection devices at work in noisy areas from 80% to 90% of the time showed a decrease in hearing loss of 3 dB to 5 dB (Moshammer 2015). The study authors also reported a regression coefficient of −5.342 (95% CI −9.116 to −1.568) from a different and unpublished analysis, which they calculated to be a 0.2 dB to 1.6 dB reduction in hearing loss (additional email conversation). We were not able to recalculate the reported results ourselves from the available data. The difference between the two analyses is unclear.
2.2.2 Hearing Loss Prevention Programmes (HLPPs)
a) Components of HLPPs
HLPP versus audiometric testing only (RCT, more than five‐year follow‐up)
Outcome: standard threshold shift (STS)
Berg 2009 calculated the likelihood of developing a STS. The three‐year and 16‐year follow‐up showed no difference between intervention and control group with an odds ratio (OR) of 0.85 (95% CI 0.29 to 2.44) after three years' follow‐up and 0.94 (95% CI 0.46 to 1.91) after 16 years' follow‐up (Analysis 12.1, summary of findings Table 5).
HLPP with daily noise exposure monitoring and feedback versus audiometric testing only (ITS, five‐year follow‐up)
Outcome: change in mean hearing threshold (dB) at 2 kHz, 3 kHz, and 4 kHz
In Rabinowitz 2011 there was no effect of the programme immediately after introduction (Analysis 13.1). The trend over time showed a significant yearly decrease of the rate of hearing loss, measured as the mean hearing threshold at 2 kHz, 3 kHz, and 4 kHz controlled for differences in age, gender, and baseline hearing, of −1.57 dB (95% CI −2.37 to −0.77) in the intervention group (Analysis 13.2). Similar but smaller improvements over time also occurred in the control group (−0.23 dB per year with 95% CI −0.39 to −0.07). The trend of the difference between the intervention and control group remained significant with −1.35 dB per year for the intervention group (95% CI −2.09 to −0.61).
The study authors could also control for the initial rate of hearing loss as a potential confounder. The results were similar to the previous comparison but the trend over time for the intervention group minus the control group was no longer significant (−0.82 with 95% CI −1.86 to 0.22) (Analysis 13.2).
The study authors also analysed the data as the mean yearly change in rate of hearing loss before and after the introduction of the intervention but their results were similar to our findings.
Follow‐up examinations after STS versus no follow‐up in one year (CBA, one‐year follow‐up)
Outcome: standard threshold shift (STS)
In one study the OR for sustaining a STS was 0.87 (95% CI 0.56 to 1.36) after having a year of follow‐up examinations versus no examinations (Meyer 1993) (Analysis 14.1).
b) HLPPs compared to other HLPPs
Well‐implemented HLPP versus less well‐implemented HLPP (CBA, one‐year follow‐up)
Outcome: standard threshold shift (STS)
In Simpson 1994, employees in companies with a well‐implemented HLPP ran a lower risk of STS than those in companies with less well‐implemented programmes, with a relative risk of 0.36, which was not significant (95% CI 0.09 to 1.42) (Analysis 15.1).
Well‐implemented HLPP versus less well‐implemented HLPP (CBA, more than five‐year follow‐up)
Outcome: standard threshold shift (STS at 4 kHz)
In a meta‐analysis of three studies we estimated the effect as the OR of sustaining a STS during the follow‐up period in workers in companies with a well‐implemented HLPP versus those in companies with less well‐implemented programmes (Adera 1993; Adera 2000; Brink 2002). The OR for the risk of sustaining a STS was 0.40 (95% CI 0.23 to 0.69) (Analysis 16.1) for workers covered by well‐implemented programmes. The results were statistically heterogeneous, with an I² of 66%. We rated the overall quality of evidence as very low (summary of findings Table 7).
Outcome: changes in binaural hearing thresholds at 3 kHz, 4 kHz, and 6 kHz
In Heyer 2011, only one out of three quality aspects of the HLPP was associated with hearing loss. We could not include the data in a meta‐analysis because they were reported as the results of a regression analysis. Years with more than 50% use of hearing protection devices (better quality) caused less hearing loss than years in a HLPP with less than 50% compliance of using hearing protection devices, for men with a beta of −0.31 dB(A) (95% CI −0.37 to −0.24) ) and for women −0.14 dB(A) (95% CI −0.27 to −0.01). The other quality aspect, noise monitoring (men: beta −0.13 dB(A) (95% CI −0.20 to −0.07); women: beta −0.15 dB(A) 95% CI −0.44 to 0.14) showed varying results but was, according to the study authors likely to be confounded by plant. The quality aspects of audiometric testing (men: beta 0.13 dB(A) (95% CI 0.06 to 0.19); women: beta 0.33 dB(A) 95% CI 0.19 to 0.47) and worker training (men: beta −0.04 dB(A) (95% CI −0.10 to 0.02); women: beta −0.05 dB(A) 95% CI −0.18 to 0.07), did not show a significant association with hearing loss.
c) HLPPs compared to less or no exposure
HLPP for 12‐hour shifts versus eight‐hour shifts (CBA, one‐year follow‐up)
Outcome: change in hearing level (dB) at 4 kHz
In one study the mean difference in change in hearing level over one year at 4 kHz for the same HLPP between the 12‐hour shift and 8‐hour shift was −0.68 dB (95% CI ‐1.85 to 0.49) (Reynolds 1990a) (Analysis 17.1).
HLPP versus non‐exposed workers (CBA, one‐year follow‐up)
Outcome: standard threshold shifts (STS), per 100 person‐years
In Muhr 2006 the rate ratio per 100 person‐years of sustaining a STS in the total cohort of recruits was 3.38 (95% CI 1.23 to 9.32) compared to recruits waiting for their training and not exposed. Meta‐analysis results for the subgroups have to be interpreted with caution as the control group in the analysis was split into three parts and the total number of events was small (n = 4) (Analysis 18.1). Results show that the risk of sustaining a STS compared to non‐exposed recruits increased for exposed recruits with the level of exposure from low to high. Separate calculations of the rate ratio for low, medium, and high exposed recruits versus all controls show a rate ratio of 1.55 (95% CI 0.49 to 4.87), 2.12 (95% CI 0.69 to 6.5), and 7.04 (95% CI 2.5 to 19.8) (Table 1).
In Muhr 2016 the rate ratio per 100 person‐years of sustaining a STS in a cohort of high exposed recruits (artillery and armoured vehicle crew members) compared to recruits waiting for their training did not show a difference between the exposed enrolled in the HLPP and the unexposed (RR 1.00, 95% CI 0.48 to 2.11) (Analysis 19.1).
HLPP or hearing protection versus non‐exposed workers (CBA, more than five‐year follow‐up)
Outcome: change in hearing levels (dB) at 4 kHz
In the meta‐analysis of four studies the summary effect size estimate was 0.05 (95% CI −0.05 to 0.16) (Analysis 20.1). When calculated back to a difference in mean changes in hearing level at 4 kHz the result was 0.53 dB (95% CI −0.53 to 1.68) (Gosztonyi 1975; Hager 1982; Lee‐Feldstein 1993; Pell 1973). The results were statistically homogeneous.
We performed a sensitivity analysis by leaving out the Pell 1973 study because of the 10‐year age difference between the intervention and the non‐exposed group, which could explain a difference of 7 dB hearing thresholds (calculated based on ISO 1990). This yielded an effect size of 0.17 (95% CI −0.06 to 0.40) (Analysis 21.1). When calculated back to a difference in mean changes in hearing level at 4 kHz, this resulted in 1.8 dB (95% CI −0.6 to 4.2).
These results indicate that the workers in a HLPP have equivalent hearing thresholds to the non‐exposed workers. However, the 95% CI includes the possibility of a hearing loss as great as 4.2 dB. This threshold is equivalent to thresholds resulting from five years of exposure to 85 dB(A). Consequently these results do not rule out the risk of hearing loss in protected workers.
Outcome: time to a standard threshold shift (STS)
Davies 2008 measured the time to a STS and compared the hazard ratio (HR) to a non‐exposed group with a result of 2.1 (95% CI 1.26 to 3.49) for workers with exposure of 80 to 85 dB‐years. The HR gradually increased to 6.6 (95% CI 5.56 to 7.84) for workers with an exposure of more than 100 dB‐years. Combined in the meta‐analysis, this yielded a HR of 3.78 (95% CI 2.69 to 5.31) (Analysis 20.2).
We rated the overall quality of evidence as very low (summary of findings Table 8).
3. Effects from uncontrolled before after case studies of engineering control interventions
New equipment
A reduction in noise levels with new equipment was reported for fourteen cases.
Outcome: personal noise exposure (Leq eight hours dB(A))
One study reported a decrease in personal daily noise exposure at work based on a case of renovating helicopters. The use of helicopters for rescue operations with advanced technology decreases daily personal noise exposure by 10.51 dB(A) (95% CI 15.45 to 5.57 dB(A), Leq 8 hours) compared to helicopters without this technology (Küpper 2013; Table 1; Table 5).
Outcome: noise level (dB(A))
Study authors reported for the other thirteen cases a mean noise reduction with new equipment of 19.7 dB(A) (HSE 2013; Maling 2016; Morata 2015; Table 5).
Acoustic panels and curtains
Outcome: noise level (dB(A))
In nine cases of application of panels and curtains, study authors reported a mean reduction in noise levels of 11.1 dB (Golmohammadi 2014; HSE 2013; Morata 2015; Table 6).
Damping material and silencers
Outcome: personal noise exposure (eight‐hour TWA dB)
In two cases, damping material and application of silencers reduced the personal noise exposure of workers by 5.5 dB (Thompson 2015; Wilson 2016; Table 7).
Outcome: Mine Safety and Health Administration (MSHA) PEL dose (%)
In three cases the effect was measured as exposure dose (MSHA PEL) and the intervention reduced the dose on average by 60 percentage points.
Outcome: noise level (dB(A))
In another 15 cases, damping material and silencers reduced noise on average by 7 dB (Caillet 2012, HSE 2013; Maling 2016; Morata 2015; Wilson 2016; Table 7).
Design changes
Outcome: personal noise exposure (eight‐hour TWA dB)
Design changes led to a mean decrease in the TWA noise exposure for workers of 3.4 dB in nine cases (Azman 2012; Cockrell 2015; Maling 2016; Thompson 2015; Table 8).
Outcome: Occupational Safety and Health Administration (OSHA) PEL dose (%)
Design changes reduced the noise OSHA PEL dose by 39.5 percentage points in two cases (Cockrell 2015; Table 5).
Outcome: MSHA PEL dose (%)
The design changes decreased MSHA PEL noise dose by 90.1 percentage points in seven cases (Azman 2012; Morata 2015; Thompson 2015; Table 8).
Outcome: noise level (dB(A))
In another 31 cases, authors reported a mean decrease in noise levels of 9.6 dB(A) (HSE 2013; HSE 2015; Maling 2016; Morata 2015; Pan 2016; Thompson 2015; Wilson 2016).
Enclosure
Outcome: noise level (dB(A))
Studies reported a mean noise level reduction of 11.8 dB in 12 cases (HSE 2013; HSE 2015; Maling 2016; Morata 2015; Table 9).
Maintenance
Outcome: noise level (dB(A))
A mean noise level reduction of 3 dB was reported in four cases studies (HSE 2013; Table 10).
Segregation
Outcome: noise level (dB(A))
Studies reported a mean noise level reduction of 17.1 dB in five cases (HSE 2013; Table 11).
Discussion
Summary of main results
Effects on noise exposure
We found 12 studies describing 107 cases of engineering interventions to reduce noise exposures but we could not draw conclusions about the long‐term effects due to the lack of controls and long‐term follow‐up. There was very low‐quality evidence from one study showing that legislation can probably induce technical improvements in the working environment that lead to a relevant reduction in noise exposure levels.
For hearing protection we found an average noise reduction of approximately 20 dB with variation among brands. Noise attenuations achieved under field conditions, however, are lower than indicated ratings provided by the manufacturers. Noise cancellation devices provide some additional noise attenuation in the low frequencies. For peak noise, there were no significant differences in the noise attenuation of several types of hearing protection. There was moderate‐quality evidence that instructions for inserting earplugs into the ear canal have a considerable effect on the noise attenuation of the devices with a 8.6 dB (95% CI 6.9 to 10.3) higher protection averaged across frequencies.
Providing feedback on daily noise exposure or providing on‐site training sessions on noise reduction behaviour did not lead to lower noise‐exposure levels in one cluster RCT.
Effects on hearing loss
The long‐term evaluation of the effect of earmuffs versus earplugs on hearing loss showed that, in high noise levels, earmuffs might perform better than earplugs but in low noise levels the effects were better for plugs (very low‐quality evidence).
One cluster‐RCT did not find an effect of an extensive HLPP in agricultural students at three‐ or 16‐year follow‐up (moderate‐quality evidence).
Very low‐quality evidence of long‐term evaluation studies of components of HLPPs showed that the use of hearing protection devices in a well‐implemented HLPP was associated with less hearing loss. This could not be shown for other elements such as worker training, audiometry alone or noise monitoring by very low‐ and moderate‐quality evidence. More individual information on daily noise exposure as part of a HLPP showed favourable but non‐significant effects on hearing loss in one study.
There was also very low‐quality evidence that, compared to non‐exposed workers in long‐term follow‐up, average HLPPs do not reduce the risk of hearing loss to below a level at least equivalent to that of workers who are exposed to 85 dB(A). We were able to combine some studies in a meta‐analysis and found a hearing loss at 4 kHz of 0.5 dB with an upper confidence limit of 1.7 dB for studies with a five‐year follow‐up. After sensitivity analysis hearing loss was 1.8 dB with an upper limit of 4.2 dB. To be able to asses whether HLPPs are as good as not being exposed to noise we had to make an assumption about the minimal clinically relevant hearing loss. For this we took the hearing loss that is caused by exposure to 85 dB(A) as the minimum amount of damage that should be avoided by protection. Based on ISO 1990 we calculated that the amount of hearing loss after five years of exposure to 85 dB(A) for the median, 10th and 90th percentile would be 4.2 dB, 2.1 dB and 6.1 dB, respectively. Based on Hozo 2005, this is equivalent to a mean of 4.2 dB hearing loss and represents clinically relevant hearing loss. The 95% CI of our meta‐analysis should therefore include zero but not 4.2 to be sure that the hearing losses from the protected and the non‐exposed group are equivalent (Piaggio 2006). After sensitivity analysis, the 95% CI includes 4.2 dB hearing loss, which means that even though there is no significant difference between the protected and the non‐exposed workers, we still cannot be sure that the protected workers are not at risk of a clinically relevant hearing loss. In addition, two other studies that could not be combined in the meta‐analysis still found considerable risks of hearing loss in spite of participants being covered by a HLPP. Another more recent study found no difference between exposed and unexposed workers and concluded that the HLPP was sufficiently improved over time.
Overall completeness and applicability of evidence
It is striking that only one controlled study evaluated measures to reduce noise exposure at the macro‐level. We could not find any controlled studies in which technical measures to reduce noise levels were evaluated at the company level. In a previous version of this review we had already noted that case reports of engineering interventions showed considerable reductions in noise level; for example, 7 dB(A) to 9 dB(A) in Jelinic 2005, 30 dB(A) in Knothe 1999, 3 dB(A) to 22 dB(A) in Pingle 2006, 10 dB(A) to 20 dB(A) in Scannell 1998, 13 dB in Stone 1971, 4 dB(A) to 15 dB(A) in Kavraz 2009, 3 dB(A) in Smith 2006 and Smith 2009. We then concluded that our criterion for controlled studies was too strict in the light of the reductions in sound level that are possible by technical interventions alone. Glasziou 2007 argues that in such cases no control group is necessary. On the other hand, the measurement of noise levels in real working life is not simple and can be biased by many factors such as the worker, the task and the environment, where it is impossible to control all operational and environmental variables. Therefore, in our 2017 update of this review, we systematically searched for uncontrolled studies and extracted data from those that we located. All 107 engineering control intervention cases showed reductions in noise levels or personal noise exposure. Engineering solutions such as new equipment, segregation of noisy equipment, installation of enclosures, and panels or curtains can substantially reduce noise levels, with mean reductions of 19.7 dB, 17.1 dB, 11.8 dB and 11.1 dB respectively. These effects are similar to those of hearing protection devices. This means that engineering interventions can potentially make the use of hearing protection devices in workplaces unnecessary, along with the other components of hearing conservation programmes. As engineering interventions do not depend on training, personal preferences or ear canal anatomy, this is a significant advantage.
However, in most case studies, authors measured environmental noise levels in the immediate surroundings of machinery without reporting a measurement protocol. It is therefore unclear if the measured reductions also represent reductions in personal level noise exposure. Even studies that measured the personal noise exposure of workers as TWA or exposure dose did not report measurement protocols including items such as the place of measurement, the exchange rate and permissible exposure levels used to calculate the outcome. Also here we are uncertain what the exact reductions in personal level noise exposure dose are.
Moreover, a long‐term follow‐up was missing from all but one of the case studies that had a one‐year follow‐up. We believe that for many of the engineering interventions such as panelling or maintenance, the effects could wear off over time and it is necessary to show that these are lasting solutions. We also believe that publication bias as well as conflict of interest issues can have distorted the results. To us, it seems probable that a case study with negative results, not showing a reduction in noise levels, would not so easily make it into a publication as a study with positive results. In many cases, the evaluators had a direct interest in showing that the situation improved and we believe that this creates a conflict of interest. Because there are still so many potential biases in the uncontrolled studies that at least partly would be remediated by a control group and long‐term follow‐up we did not include the case‐studies in our conclusions.
However, the case studies do show that engineering controls are feasible across a range of noise problems and can have a considerable immediate effect on noise exposure. Better reporting of the noise measurements and longer‐term follow‐up would be needed to make them more reliable evidence.
No studies evaluated the effectiveness of the practice of recommendations from occupational health services, national agencies or occupational health professionals to reduce noise levels. A possible but speculative reason for the low number of studies could be the tight regulation regarding noise at work, which makes it difficult to challenge current practice in experiments.
For immediate effects of hearing protection, we restricted our inclusion criteria to field studies among workers and excluded studies that made use of volunteers (Franks 2000; Merry 1992;Williams 2004) or were carried out in a laboratory environment (Toivonen 2002). All of these excluded studies showed a benefit of extra instruction compared to less or no instruction. The increase in attenuation was similar to that found in our review (Park 1991a instructions; Salmani 2014). We only included studies that compared different devices worn by the same workers because the evaluation depends to such a great extent on the wearer. That criterion excluded a great number of studies that evaluated different devices worn by different workers. However this provides us with more reliable results of the effect.
Authors of studies that intended to evaluate a HLPP did not clearly define the programmes. It is unclear if the results are applicable in other settings and if measures to reduce noise levels were taken or if workers got training and education in addition to being provided with hearing protection devices. Only two studies that evaluated a HLPP (or components thereof) used a randomised design. Even though randomised studies are more robust to bias, they did not show beneficial effects of HLPPs. One study was conducted in the construction industry, the other RCT (Berg 2009) managed to follow the participants for many years. It shows that, even though it has often been argued that it is difficult to randomise workers, this is feasible even in difficult sectors such as the construction industry (Seixas 2011).
There were two studies that offered a novel component of a HLPP: monitoring personal noise exposure in a way that the individual worker was made aware of his exposure levels (Rabinowitz 2011; Seixas 2011). Possibly due to small sample sizes neither of them found a significant outcome but given the problems in construction industry with varying noise sources that at least partly can be controlled by the worker, this could be a promising intervention to be tested further in this branch of industry.
Quality of the evidence
The risk of bias was high (especially for the long‐term evaluation studies) because it is difficult to control for the confounding effect of aging and prior hearing loss and most studies were set up retrospectively. Consquently there is a need for better quality studies, which is possible, as demonstrated by the one RCT with long‐term follow‐up that we found. Also the ITS design has potential for evaluating HLPPs because much data is collected routinely. We believe that these studies would provide better‐quality evidence than comparing HLPPs to non‐exposed workers or using a retrospective design.
For the immediate effect evaluation, only two studies used a randomised design, even though it is not too demanding to randomise hearing protection in studies of its immediate effects. Since individual factors, such as the skills necessary to use hearing protection, have an important effect on the outcome, it is important that there are no baseline differences. Randomisation is the only way to ensure this equivalence. Some study authors consider effectiveness to be such a technical matter that they do not even describe the participants in their study.
There was also a lack of information on the implementation level of the prevention measures. This is especially important in the studies that compared well‐implemented HLPPs with those of poorer quality. It is possible to compare different HLPPs or single programme components, or different levels of implementation in a cluster‐randomised design. This would eventually yield much higher‐quality information on the effectiveness of hearing loss prevention. Given the enormous numbers of hearing‐impaired workers, this effort seems justified.
Potential biases in the review process
Even though we made significant efforts to search databases that would contain grey literature, such as NIOSHTIC, we did not have the opportunity to go through all conference proceedings. It is therefore possible that we missed retrospective cohort studies or controlled noise‐reduction studies.
Publication bias could play a role in the results of the evaluation studies of HLPPs, with four of the studies being funded or carried out by people employed by the company responsible for the intervention, who could possibly have an interest in publishing studies demonstrating a preventative effect of HLPPs (Muhr 2006; Muhr 2016).
Agreements and disagreements with other studies or reviews
Berger 1996 reviewed 22 studies that evaluated the field performance of many different types of hearing protection devices (also partly reported in Berger 1998). The main purpose of the included studies was to evaluate the noise attenuation of hearing protection when worn by different workers in field conditions. All these studies concluded that there was great variation among workers leading to large standard deviations in the average attenuation values. This was mainly due to the problem of a lack of fitting instructions and training in fitting the devices (Royster 1996). The inclusion criteria of these studies were therefore essentially different from ours because different workers wore different devices, whereas we only included studies that compared devices among the same subjects. However, the conclusions from all these studies are in agreement: under field conditions the noise attenuation of hearing protection devices is much less than is possible to achieve in the lab and what is indicated by the manufacturer. The inherent lack of precision of the methods used since the late 1970s for determining noise attenuation (used in the labelling of these products) is widely recognised. To address this issue, de‐rating procedures for the reported attenuation values in the labels have been proposed (Franks 2000), and standards have been developed with new strategies for a more accurate determination of the noise attenuation provided in the field (ANSI/ASA 2007; ANSI/ASA 2008; ISO 1999b; ISO 2006). The latest standards incorporate the variance of both the fit of the protector across a population of test subjects and the variance of the protector's performance in a wide range of noise spectra. In the USA, new regulation has been proposed that provides guidance for passive hearing protection devices, active noise reduction devices and also for impulse noise reduction devices such as sound restoration or nonlinear acoustic protectors (Murphy 2008).
One other review concluded that the available evidence from long‐term evaluation studies does not support the effectiveness of HLPPs (Dobie 1995). The author acknowledges that he did not perform a systematic search. He included and commented upon the same two evaluation studies that compared hearing protection users versus non‐users and those that compared protected workers to non‐exposed workers as we included in this review. He included three long‐term evaluation studies, of which two were also included in this review. His conclusions are similar to ours in that the evidence for the effectiveness of HLPPs is not very convincing.
Borchgrevink 2003 reviewed only occupational noise‐induced hearing loss data and because hearing loss still occurred he concluded that HLPPs were ineffective. Daniell 2006 evaluated the quality of HLPPs in companies and concluded that they were commonly incomplete and that consideration of noise control was low in all industries. This concurs with the conclusions of our review. Another narrative review was directed at one sector only (mining) (McBride 2004), but drew similar conclusions.
Risk of bias graph: review authors' judgements about each risk of bias item presented as percentages across all included studies. Please note that the blank space corresponds to the studies that have an ITS study design.
Risk of bias summary: review authors' judgements about each risk of bias item for each included study. Please note that the blank spaces correspond to the studies that have an ITS study design.

Comparison 1 Legislation to decrease noise exposure (long‐term) ‐ ITS, Outcome 1 Immediate change in level.

Comparison 1 Legislation to decrease noise exposure (long‐term) ‐ ITS, Outcome 2 Change in slope.
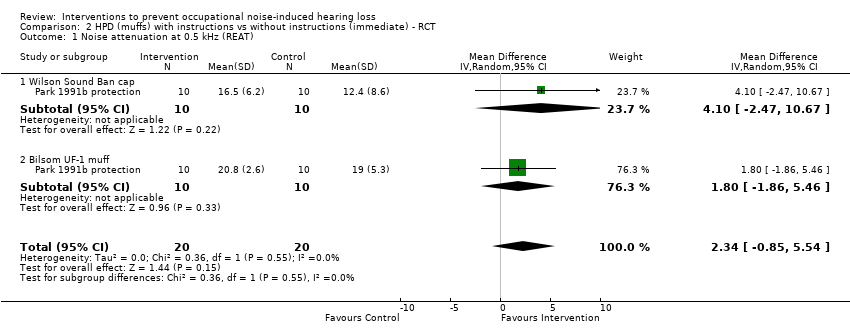
Comparison 2 HPD (muffs) with instructions vs without instructions (immediate) ‐ RCT, Outcome 1 Noise attenuation at 0.5 kHz (REAT).

Comparison 2 HPD (muffs) with instructions vs without instructions (immediate) ‐ RCT, Outcome 2 Noise attenuation at 1 kHz (REAT).

Comparison 2 HPD (muffs) with instructions vs without instructions (immediate) ‐ RCT, Outcome 3 Noise attenuation at 2 kHz (REAT).
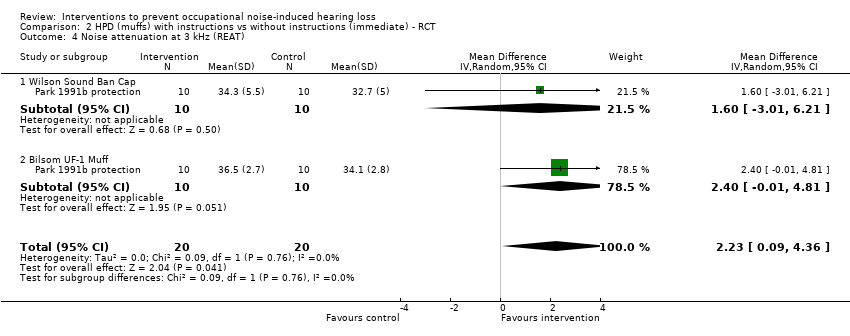
Comparison 2 HPD (muffs) with instructions vs without instructions (immediate) ‐ RCT, Outcome 4 Noise attenuation at 3 kHz (REAT).

Comparison 2 HPD (muffs) with instructions vs without instructions (immediate) ‐ RCT, Outcome 5 Noise attenuation at 4 kHz (REAT).

Comparison 2 HPD (muffs) with instructions vs without instructions (immediate) ‐ RCT, Outcome 6 Noise attenuation at 6 kHz (REAT).

Comparison 2 HPD (muffs) with instructions vs without instructions (immediate) ‐ RCT, Outcome 7 Noise attenuation at 8 kHz (REAT).

Comparison 3 HPD (plugs) with instructions vs without instructions (immediate) ‐ RCT, Outcome 1 Noise attenuation at 0.5 kHz (REAT).
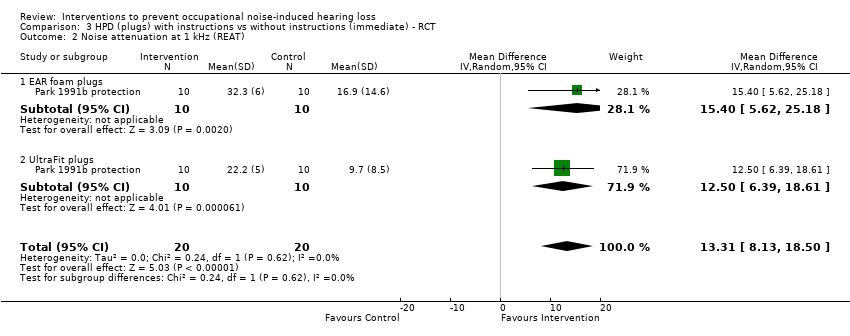
Comparison 3 HPD (plugs) with instructions vs without instructions (immediate) ‐ RCT, Outcome 2 Noise attenuation at 1 kHz (REAT).

Comparison 3 HPD (plugs) with instructions vs without instructions (immediate) ‐ RCT, Outcome 3 Noise attenuation at 2 kHz (REAT).

Comparison 3 HPD (plugs) with instructions vs without instructions (immediate) ‐ RCT, Outcome 4 Noise attenuation at 3 kHz (REAT).

Comparison 3 HPD (plugs) with instructions vs without instructions (immediate) ‐ RCT, Outcome 5 Noise attenuation at 4 kHz (REAT).
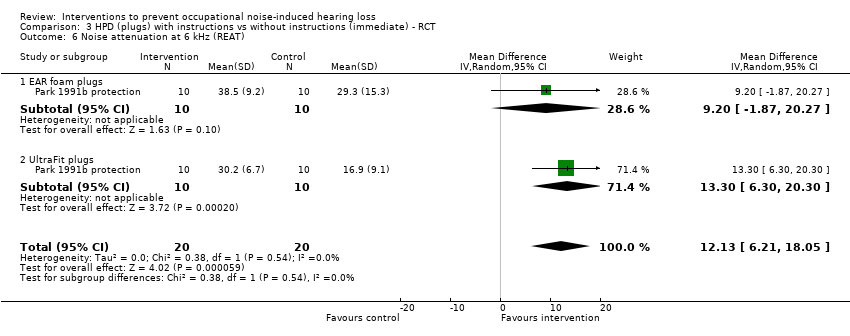
Comparison 3 HPD (plugs) with instructions vs without instructions (immediate) ‐ RCT, Outcome 6 Noise attenuation at 6 kHz (REAT).

Comparison 3 HPD (plugs) with instructions vs without instructions (immediate) ‐ RCT, Outcome 7 Noise attenuation at 8 kHz (REAT).

Comparison 3 HPD (plugs) with instructions vs without instructions (immediate) ‐ RCT, Outcome 8 Mean noise attenuation over 0.5, 1, 2, 3, 4, 6, 8 kHz (REAT).

Comparison 4 HPD (plugs) lower noise reduction rate (NRR) with instructions vs higher NRR without instructions (immediate) ‐ RCT, Outcome 1 Mean attenuation at 0.5, 1, 2, 3, 4, 6, 8 kHz.
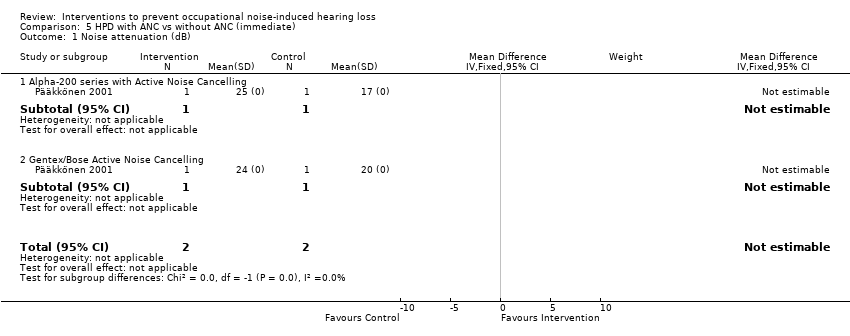
Comparison 5 HPD with ANC vs without ANC (immediate), Outcome 1 Noise attenuation (dB).

Comparison 5 HPD with ANC vs without ANC (immediate), Outcome 2 TTS at 1 kHz (before exposure ‐ after exposure ).

Comparison 5 HPD with ANC vs without ANC (immediate), Outcome 3 TTS at 2 kHz (before exposure ‐ after exposure ).

Comparison 5 HPD with ANC vs without ANC (immediate), Outcome 4 TTS at 4 kHz (before exposure ‐ after exposure ).
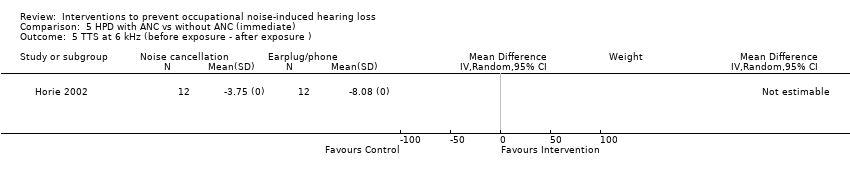
Comparison 5 HPD with ANC vs without ANC (immediate), Outcome 5 TTS at 6 kHz (before exposure ‐ after exposure ).

Comparison 5 HPD with ANC vs without ANC (immediate), Outcome 6 TTS at 8 kHz (before exposure ‐ after exposure ).

Comparison 6 Custom‐moulded musician HPD (plugs) with higher versus HPD (plugs) with lower noise attenuation, Outcome 1 Noise attenuation dB(A).

Comparison 7 HPD (various) noise attenuation (immediate), Outcome 1 Noise attenuation (dB).
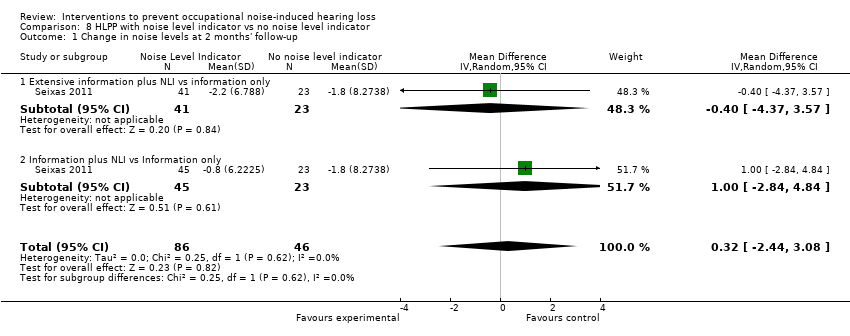
Comparison 8 HLPP with noise level indicator vs no noise level indicator, Outcome 1 Change in noise levels at 2 months' follow‐up.

Comparison 8 HLPP with noise level indicator vs no noise level indicator, Outcome 2 Change in noise levels at 4 months' follow‐up.

Comparison 9 HLPP with extensive information vs information only, Outcome 1 Change in noise levels at 2 months' follow‐up.

Comparison 9 HLPP with extensive information vs information only, Outcome 2 Change in noise levels at 4 months' follow‐up.
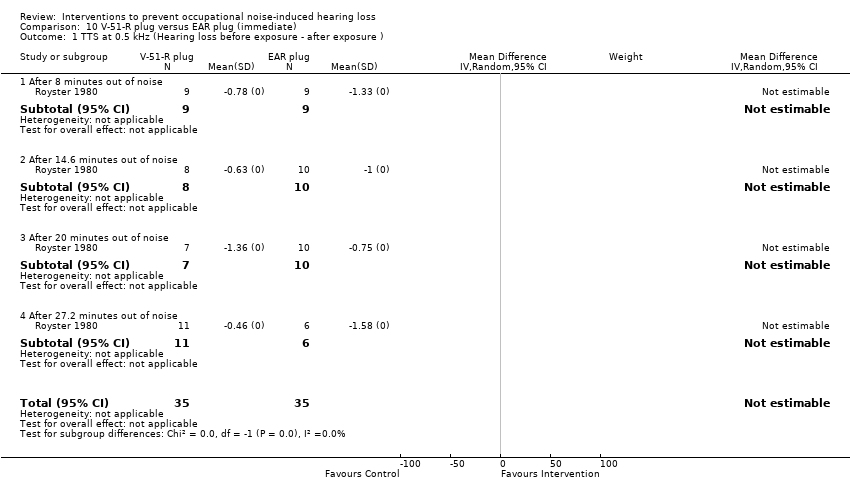
Comparison 10 V‐51‐R plug versus EAR plug (immediate), Outcome 1 TTS at 0.5 kHz (Hearing loss before exposure ‐ after exposure ).

Comparison 10 V‐51‐R plug versus EAR plug (immediate), Outcome 2 TTS at 1 kHz (before exposure ‐ after exposure ).

Comparison 10 V‐51‐R plug versus EAR plug (immediate), Outcome 3 TTS at 2 kHz (before exposure ‐ after exposure ).

Comparison 10 V‐51‐R plug versus EAR plug (immediate), Outcome 4 TTS at 3 kHz (before exposure ‐ after exposure ).
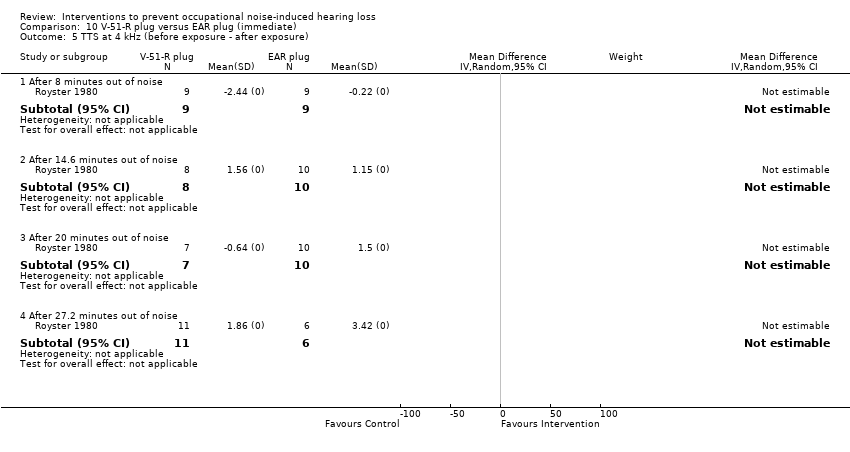
Comparison 10 V‐51‐R plug versus EAR plug (immediate), Outcome 5 TTS at 4 kHz (before exposure ‐ after exposure).

Comparison 10 V‐51‐R plug versus EAR plug (immediate), Outcome 6 TTS at 6 kHz (before exposure ‐ after exposure).

Comparison 11 Earmuffs vs earplugs (long‐term), Outcome 1 Hearing loss change over 3 years (4 kHz / STS).

Comparison 12 HLPP vs audiometric testing (agriculture students, long‐term, 3‐year and 16‐year follow‐up) ‐ RCT, Outcome 1 STS.

Comparison 13 HLPP with daily noise‐exposure monitoring with feedback vs annual audiometry (long‐term) ‐ ITS, Outcome 1 HL (dB/year at 2, 3 and 4 kHz) Δ level.
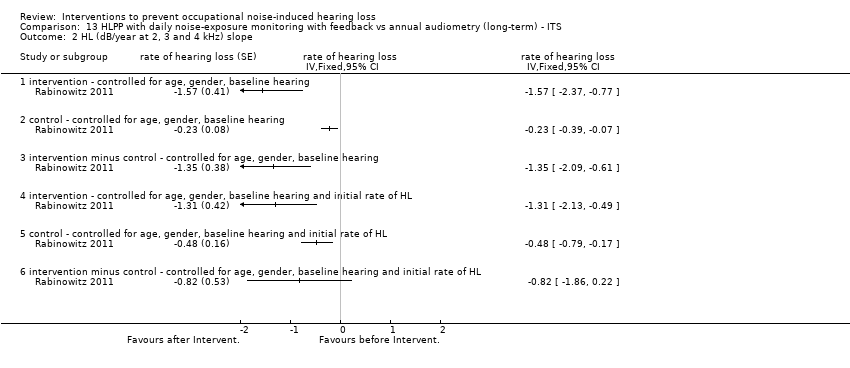
Comparison 13 HLPP with daily noise‐exposure monitoring with feedback vs annual audiometry (long‐term) ‐ ITS, Outcome 2 HL (dB/year at 2, 3 and 4 kHz) slope.

Comparison 14 Follow‐up exam after initial STS vs no exam (long‐term), Outcome 1 Hearing loss change (STS).

Comparison 15 Well‐implemented HLPP vs less well‐implemented (long‐term, 1‐year follow‐up), Outcome 1 STS.

Comparison 16 Well‐implemented HLPP vs less well‐implemented (long‐term > 5‐year follow‐up), Outcome 1 Hearing loss change STS/at 4 kHz.

Comparison 17 HLPP 12‐hour shift vs HLPP 8‐hour shift (long‐term 1‐year follow‐up), Outcome 1 Hearing loss change over 1 year at 4 kHz.

Comparison 18 HLPP vs non‐exposed workers (long‐term 1‐year follow‐up), Outcome 1 hearing loss STS.

Comparison 19 Improved HLPP vs non‐exposed workers (long‐term 1‐year follow‐up), Outcome 1 hearing loss STS.

Comparison 20 HLPP vs non‐exposed workers (long‐term > 5‐year follow‐up), Outcome 1 Hearing loss change at 4 kHz/STS (5‐year follow‐up).

Comparison 20 HLPP vs non‐exposed workers (long‐term > 5‐year follow‐up), Outcome 2 Hazard of STS.

Comparison 21 HLPP vs non‐exposed sensitivity analysis (long‐term, 5‐year follow‐up), Outcome 1 Hearing loss change at 4kHz / STS.
| Stricter legislation compared with existing legislation for noise exposure | |||||
| Patient or population: workers with noise exposure Settings: coal mines Intervention: stricter legislation Comparison: existing legislation | |||||
| Outcomes | Illustrative comparative risks* (95% CI) | No of observations (studies) | Quality of the evidence | Comments | |
| Assumed risk | Corresponding risk | ||||
| Existing legislation | Stricter legislation | ||||
| Immediate change in level in year 2000 (noise level at work as PEL dose in dB(A); range 0 to 6400, log scale) 1 year | The mean noise levels during pre‐intervention years were 56.9 PEL dose | The mean noise exposure level after introduction was 27.70 PEL dose lower (36.1 lower to 19.3 lower PEL dose) | 14 years pre‐intervention and 4 years post‐intervention (1 ITS) | ⊕⊝⊝⊝ | The reduction of 27.7 PEL dose translates to about 4.5 dB(A) |
| Change in slope after introduction (noise level at work as PEL dose in dB(A); range 0 to 6400, log scale) 4 years | The mean noise levels during pre‐intervention years were 56.9 PEL dose | The mean change in level of noise exposure per year after introduction was 2.10 PEL dose lower (4.90 lower to 0.70 PEL dose higher) | 14 years pre‐intervention and 4 years post‐intervention (1 ITS) | ⊕⊝⊝⊝ | |
| *The basis for the assumed risk (e.g. the median control group risk across studies) is provided in footnotes. The corresponding risk (and its 95% confidence interval) is based on the assumed risk in the comparison group and the absolute effect of the intervention (and its 95% CI). | |||||
| GRADE Working Group grades of evidence High quality: we are very confident that the true effect lies close to that of the estimate of the effect Moderate quality: we are moderately confident in the effect estimate; the true effect is likely to be close to the estimate of effect, but there is a possibility that it is substantially different Low quality: our confidence in the effect estimate is limited; the true effect may be substantially different from the estimate of the effect Very low quality: we have very little confidence in the effect estimate; the true effect is likely to be substantially different from the estimate of effect | |||||
| 1We downgraded by one level from low to very low because there is only one study and it has a high risk of bias. | |||||
| Earplugs with instruction compared with no instruction for noise reduction | |||||
| Patient or population: workers with exposure to noise Settings: industrial Intervention: instruction on how to insert earplugs Comparison: no instruction | |||||
| Outcomes | Illustrative comparative risks* (95% CI) | No of participants | Quality of the evidence | Comments | |
| Assumed risk | Corresponding risk | ||||
| Without instruction | With instruction | ||||
| Mean noise attenuation over 0.5, 1, 2, 3, 4, 6, 8 kHz (dB) Immediate follow‐up | The mean noise attenuation ranged across frequencies from 5.5 to 25.9 dB | The mean noise attenuation in the intervention groups was 8.59 dB higher (6.92 dB higher to 10.25 dB higher) | 140 participants | ⊕⊕⊕⊝ | |
| *The basis for the assumed risk (e.g. the median control group risk across studies) is provided in footnotes. The corresponding risk (and its 95% confidence interval) is based on the assumed risk in the comparison group and the relative effect of the intervention (and its 95% CI). | |||||
| GRADE Working Group grades of evidence High quality: we are very confident that the true effect lies close to that of the estimate of the effect Moderate quality: we are moderately confident in the effect estimate; the true effect is likely to be close to the estimate of effect, but there is a possibility that it is substantially different Low quality: our confidence in the effect estimate is limited; the true effect may be substantially different from the estimate of the effect Very low quality: we have very little confidence in the effect estimate; the true effect is likely to be substantially different from the estimate of effect | |||||
| 1We downgraded from high quality by one level because of imprecision due to small number of participants. | |||||
| Exposure information compared with training as usual for noise exposure | |||||
| Patient or population: workers exposed to noise Settings: construction industry Intervention: provision of noise level indicator Comparison: safety training as usual | |||||
| Outcomes | Illustrative comparative risks* (95% CI) | No of participants | Quality of the evidence | Comments | |
| Assumed risk | Corresponding risk | ||||
| Training as usual | Plus noise level indicator | ||||
| Change in noise levels at 4 months' follow‐up (dB(A)) | The mean noise level in the control group ranged from 87.1 to 89 dB(A) | The mean noise level in the intervention groups was | 176 | ⊕⊕⊝⊝ | |
| *The basis for the assumed risk (e.g. the median control group risk across studies) is provided in footnotes. The corresponding risk (and its 95% confidence interval) is based on the assumed risk in the comparison group and the relative effect of the intervention (and its 95% CI). | |||||
| GRADE Working Group grades of evidence High quality: we are very confident that the true effect lies close to that of the estimate of the effect Moderate quality: we are moderately confident in the effect estimate; the true effect is likely to be close to the estimate of effect, but there is a possibility that it is substantially different Low quality: our confidence in the effect estimate is limited; the true effect may be substantially different from the estimate of the effect Very low quality: we have very little confidence in the effect estimate; the true effect is likely to be substantially different from the estimate of effect | |||||
| 1We downgraded by two levels from high to low because of high risk of bias and imprecision. | |||||
| Earmuffs compared with earplugs for noise‐induced hearing loss | ||||||
| Patient or population: workers exposed to 88‐94 dB(A) Settings: shipyard Intervention: most wearing earmuffs Comparison: most wearing earplugs | ||||||
| Outcomes | Illustrative comparative risks* (95% CI) | Relative effect | No of participants | Quality of the evidence | Comments | |
| Assumed risk | Corresponding risk | |||||
| Earplugs | Earmuffs | |||||
| Hearing loss change over 3 years (4 kHz/STS) 2 to 3 years' follow‐up | High risk population | OR 0.8 (0.63 to 1.03 ) | 3242 | ⊕⊝⊝⊝ | At lower exposures the results were too heterogeneous to be combined | |
| 42 per 1000 | 34 per 1000 | |||||
| *The basis for the assumed risk (e.g. the median control group risk across studies) is provided in footnotes. The corresponding risk (and its 95% confidence interval) is based on the assumed risk in the comparison group and the relative effect of the intervention (and its 95% CI). | ||||||
| GRADE Working Group grades of evidence High quality: we are very confident that the true effect lies close to that of the estimate of the effect Moderate quality: we are moderately confident in the effect estimate; the true effect is likely to be close to the estimate of effect, but there is a possibility that it is substantially different Low quality: our confidence in the effect estimate is limited; the true effect may be substantially different from the estimate of the effect Very low quality: we have very little confidence in the effect estimate; the true effect is likely to be substantially different from the estimate of effect | ||||||
| 1We downgraded from low quality to very low quality because of high risk of bias in both studies. | ||||||
| Hearing loss prevention programme (HLPP) compared to audiometric testing | ||||||
| Patient or population: agricultural students without hearing loss Settings: agricultural schools | ||||||
| Outcomes | Illustrative comparative risks* (95% CI) | Relative effect | No of participants | Quality of the evidence | Comments | |
| Assumed risk | Corresponding risk | |||||
| Audiometric testing only | HLPP with information | |||||
| Hearing loss | 21 per 1000 | 18 per 1000 | OR 0.85 | 687 | ⊕⊕⊕⊝ | |
| Hearing loss | 149 per 1000 | 141 per 1000 | OR 0.94 | 355 | ⊕⊕⊕⊝ | |
| *The basis for the assumed risk (e.g. the median control group risk across studies) is provided in footnotes. The corresponding risk (and its 95% confidence interval) is based on the assumed risk in the comparison group and the relative effect of the intervention (and its 95% CI). | ||||||
| GRADE Working Group grades of evidence High quality: we are very confident that the true effect lies close to that of the estimate of the effect Moderate quality: we are moderately confident in the effect estimate; the true effect is likely to be close to the estimate of effect, but there is a possibility that it is substantially different Low quality: our confidence in the effect estimate is limited; the true effect may be substantially different from the estimate of the effect Very low quality: we have very little confidence in the effect estimate; the true effect is likely to be substantially different from the estimate of effect | ||||||
| 1We downgraded one level from high to moderate due to lack of information on randomisation and allocation concealment. | ||||||
| HLPP with exposure information compared with HLPP without exposure information for noise‐induced hearing loss | |||||
| Patient or population: workers exposed to noise Settings: aluminium smelter Intervention: exposure information as part of HLPP Comparison: no such information | |||||
| Outcomes | Illustrative comparative risks* (95% CI) | No of participants | Quality of the evidence | Comments | |
| Assumed risk | Corresponding risk | ||||
| Without exposure info | With exposure info | ||||
| Annual increase in hearing threshold (dB/year at 2,3 and 4 kHz) 4‐year follow‐up | The mean hearing loss rate in the control group was 1.0 dB per year | The mean hearing loss rate in the intervention groups was | 312 | ⊕⊝⊝⊝ | Matched for age, gender, baseline hearing loss and baseline hearing |
| *The basis for the assumed risk (e.g. the median control group risk across studies) is provided in footnotes. The corresponding risk (and its 95% confidence interval) is based on the assumed risk in the comparison group and the relative effect of the intervention (and its 95% CI). | |||||
| GRADE Working Group grades of evidence High quality: we are very confident that the true effect lies close to that of the estimate of the effect Moderate quality: we are moderately confident in the effect estimate; the true effect is likely to be close to the estimate of effect, but there is a possibility that it is substantially different Low quality: our confidence in the effect estimate is limited; the true effect may be substantially different from the estimate of the effect Very low quality: we have very little confidence in the effect estimate; the true effect is likely to be substantially different from the estimate of effect | |||||
| 1We downgraded by one level from low to very low because of high risk of bias. | |||||
| Well‐implemented hearing loss prevention programme (HLPP) compared to less well‐implemented HLPP for hearing loss | ||||||
| Patient or population: workers | ||||||
| Outcomes | Illustrative comparative risks* (95% CI) | Relative effect | No of participants | Quality of the evidence | Comments | |
| Assumed risk | Corresponding risk | |||||
| Less well‐implemented HLPP | Well‐implemented HLPP | |||||
| Hearing loss | 86 per 1000 | 36 per 1000 | OR 0.40 | 16,301 | ⊕⊝⊝⊝ | SMD 0.26 (0.14 to 0.47) |
| *The basis for the assumed risk (e.g. the median control group risk across studies) is provided in footnotes. The corresponding risk (and its 95% confidence interval) is based on the assumed risk in the comparison group and the relative effect of the intervention (and its 95% CI). | ||||||
| GRADE Working Group grades of evidence High quality: we are very confident that the true effect lies close to that of the estimate of the effect Moderate quality: we are moderately confident in the effect estimate; the true effect is likely to be close to the estimate of effect, but there is a possibility that it is substantially different Low quality: our confidence in the effect estimate is limited; the true effect may be substantially different from the estimate of the effect Very low quality: we have very little confidence in the effect estimate; the true effect is likely to be substantially different from the estimate of effect | ||||||
| 1STS used in two studies, change of mean 4 kHz threshold in one study. | ||||||
| Hearing loss prevention programme (HLPP) compared to non‐exposed workers | ||||||
| Patient or population: workers | ||||||
| Outcomes | Illustrative comparative risks* (95% CI) | Relative effect | No of participants | Quality of the evidence | Comments | |
| Assumed risk | Corresponding risk | |||||
| Non‐exposed workers | HLPP | |||||
| Hearing loss | The mean hearing loss in the control groups was | The mean hearing loss in the intervention groups was | 1846 | ⊕⊝⊝⊝ | pooled effect size 0.17 (95% CI ‐0.06 to 0.40) recalculated into dBs | |
| *The basis for the assumed risk (e.g. the median control group risk across studies) is provided in footnotes. The corresponding risk (and its 95% confidence interval) is based on the assumed risk in the comparison group and the relative effect of the intervention (and its 95% CI). | ||||||
| GRADE Working Group grades of evidence High quality: we are very confident that the true effect lies close to that of the estimate of the effect Moderate quality: we are moderately confident in the effect estimate; the true effect is likely to be close to the estimate of effect, but there is a possibility that it is substantially different Low quality: our confidence in the effect estimate is limited; the true effect may be substantially different from the estimate of the effect Very low quality: we have very little confidence in the effect estimate; the true effect is likely to be substantially different from the estimate of effect | ||||||
| 1Assumed increase of hearing threshold: median of three studies with respectively 3.4, 3.6 and 5.2 dB increase in hearing threshold at 4 kHz after five years' follow‐up. | ||||||
| Küpper 2013 (Outcome: Leq 8 h (dB)a) ‐ noise exposure of rescue helicopter personnel ‐ case study | ||||||||||
| Study data | Recalculation ‐ group mean, SD | |||||||||
| Helicopter type | Helicopter name | mean | SD | dB min | dB max | variance | mean | SD | ||
| with advanced technology | EC 135b | 85.80 | 4.00 | 73.00 | 97.00 | 16.00 | 87.9 | 4.16 | ||
| BK 117b | 87.20 | 4.60 | 74.00 | 101.00 | 21.16 | |||||
| Bell 206 B Jetrangerc | 88.80 | 4.00 | 76.00 | 100.00 | 16.00 | |||||
| Bell 206 Longranger IIc | 89.80 | 4.00 | 77.00 | 101.00 | 16.00 | |||||
| without advanced technology | UH 1Db | 86.80 | 4.00 | 74.00 | 98.00 | 16.00 | 98.41 | 4.49 | ||
| BO 105c | 91.80 | 4.00 | 79.00 | 103.00 | 16.00 | |||||
| Sea Kingc | 92.60 | 7.50 | 78.00 | 114.00 | 56.25 | |||||
| Ecureuil AS350Bb | 92.80 | 4.00 | 80.00 | 104.00 | 16.00 | |||||
| Alouette IIIbb | 98.40 | 4.80 | 85.00 | 113.00 | 23.04 | |||||
| Sikorsky H‐23/UH12c | 99.70 | 3.90 | 87.00 | 111.00 | 15.21 | |||||
| Alouette IIb | 100.10 | 4.40 | 87.00 | 113.00 | 19.36 | |||||
| Sikorsky H‐34c | 101.8 | 4.00 | 89.00 | 113.00 | 16.00 | |||||
| Mi‐4c | 109.10 | 3.50 | 97.00 | 117.00 | 12.25 | |||||
| Sikorsky H‐37 Mojavec | 111 | 3.40 | 99.00 | 119.00 | 11.56 | |||||
| Muhr 2016 (Outcome: STS) ‐ hearing loss Swedish military ‐ CBA | ||||||||||
| Study data | Recalculation | |||||||||
| group | follow up mean (month) | # Events | N | follow up (month/year) | per 100 person‐years | |||||
| event rate | lnRR | SE | ||||||||
| HLPP | 8 | 9 | 395 | 0.67 | 3.4 | 0.002 | 0.379 | |||
| non‐exposed | 13 | 31 | 839 | 1.08 | 3.4 | |||||
| Muhr 2006 (Outcome: STS) ‐ hearing loss Swedish military ‐ CBA | ||||||||||
| Study data | Recalculation | |||||||||
| group | follow up mean (month) | # Events | N | group | follow up (year) | # Events | N | per 100 person‐years | ||
| event rate | lnRR | SE | ||||||||
| HLPP (low‐exposed) | 9.25 | 11 | 291 | HLPP (low‐exposed) | 0.77 | 11 | 291 | 4.9 | 0.73 | 1.04 |
| HLPP (medium‐exposed) | 13 | 252 | non‐exposed (split 1) | 0.92 | 1 | 46 | 2.37 | |||
| HLPP (high‐exposed) | 35 | 204 | HLPP (medium‐exposed) | 0.77 | 13 | 252 | 6.69 | 1.04 | 1.04 | |
| non‐exposed | 11 | 4 | 138 | non‐exposed (split 2) | 0.92 | 1 | 46 | 2.37 | ||
| HLPP (high‐exposed) | 0.77 | 35 | 204 | 22.26 | 1.55 | 0.73 | ||||
| non‐exposed (split 3) | 0.92 | 2 | 46 | 4.74 | ||||||
| non‐exposed (all) | 0.92 | 4 | 138 | 3.16 | ||||||
| low‐exposed vs non‐exposed (all) | 0.439 | 0.584 | ||||||||
| medium‐exposed vs non‐exposed (all) | 0.750 | 0.572 | ||||||||
| high‐exposed vs non‐exposed (all) | 1.951 | 0.528 | ||||||||
| aBased on task analysis and helicopter noise data, task analysis is based on measurements of type and duration of tasks per rescue operation of four bases over 1 year (total, 2726 rescue operations). | ||||||||||
| Comparison | N Studies | 1. RoB? | 2. Inconsistent? | 3. Indirect? | 4. Imprecise? | 5. Pub bias? | 6. Large ES? | 7. DR? | 8. Opp Conf | Qualitya |
| Outcome noise | ||||||||||
| Legislation vs no legislation | 1 ITS | yes | 1 study | no | no | 1 study | yes | no | no | very low (1) |
| One HPD vs another HPD | 1 RCT 4 CBA | 2 yes | no | no | no | not shown | no | no | no | low (1) |
| HPD+Instruction vs HPD‐instruction | 2 RCT | 2 no | no | no | yes | not shown | na | na | na | moderate (4) |
| Information vs no information | 1 RCT (2 arms) | 1 yes | 1 study | no | yes | 1 study | na | na | na | low (1, 4) |
| Outcome hearing loss | ||||||||||
| One HPD vs another HPD (TTS) | 2 CBA | no data | ||||||||
| Muffs vs plugs | 2 CBA | 2 yes | no | no | yes | not shown | no | no | no | very low (1,4) |
| Frequent HPD vs less frequent use | 1 CBA | 1 yes | 1 study | no | yes | 1 study | no | no | no | very low (1) |
| HLPP vs audiometry | 1 RCT | 1 yes | 1 study | no | no | 1 study | na | na | na | moderate (1) |
| HLPP+exposure information vs HLPP‐information | 1 CBA | 1 yes | 1 study | no | yes | 1 study | no | no | no | very low (1,4) |
| Frequent HPD in HLPP vs less | 5 CBA | 5 yes | no | no | yes | not shown | no | no | no | very low (1,4) |
| HLPP vs no exposure | 7 CBA | 7 yes | no | no | yes | not shown | no | no | no | very low (1,4) |
| Follow‐up vs no follow‐up | 1 CBA | 1 yes | 1 study | no | yes | 1 study | no | no | no | very low (1,4) |
| HLPP+long shifts vs HLPP normal | 1 CBA | 1 yes | 1 study | no | yes | 1 study | no | no | no | very low (1,4) |
| 1‐5 Reasons for downgrading: 1. Risk of bias/Limitations in study design 2. Inconsistency between studies. 3. Indirectness of PICO 4. Imprecision of the results 5. Publication bias. 6‐8 Reasons for upgrading: 6. Large effect size. 7. Dose‐repsonse relationship 8. Confounding opposes the direction of the effect; aFinal grading of quality of evidence, between brackets domain that led to down/upgrading the quality. | ||||||||||
| Study | Described as HLPP | HPD provided | Noise measurements | Technical measures | Administrative measures | Audiometry |
| ? | Enforced mandatory wearing of hearing protection | Personal dosimeter twice a year | ? | ? | Audiometric booth ANSI‐OSHA | |
| HLPP | ? based on Aldera 1993 we assumed that excellent implementation meant better use of hearing protection | ? | ? | ? | Audiogram taken | |
| HCP | Beside educational intervention, hearing protection devices were provided free to students and replaced regularly | Students were given opportunity to use sound level meter unaffiliated | Not part of the programme | Not part of the programme | Yearly audiometric testing, calibrated per ANSI standard with Hughson‐Westlake modification of the ascending threshold technique | |
| HCP | ? | Area‐wide sound level surveys | ? | ? | Annual audiometric evaluation calibrated Bekesy audiometer ANSI | |
| HCP | Hearing protection was one element | Noise monitoring was one element | Engineering controls were one element | Administrative controls were one element | Audiometric evaluation by certified audiometric technicians | |
| ? | ? | Personal noise dosimeters | ? | ? | Calibrated ISO r389 | |
| HCP | Earmuffs mandatory in noise areas | Calibrated personal dosimeters sound level meter in all shop areas | ? | ? | Soundproof booth ANSI s3.1‐1960 | |
| Walsh‐Healy standard; OSHA | Yes, mandatory use of approved protection | ? | Gradual continuous engineering control wherever, whenever economically feasible | ? | Audiometric surveys | |
| HCP | ? Percent use of hearing protection used as a quality indicator | Used as a quality indicator of the programmes: high quality if any monitoring and worker input reported by focus group | Stated as part of the programme but not possible to evaluate with the study data | Training and education stated as part of the programme but not possible to evaluate with study data | Audiometric testing, quality varies, evaluated as days between two tests, audiometry method not reported | |
| ? | ? | Annual sound surveys | ? | ? | Automatic audiometer according to ANSI s3.6‐1996 | |
| HCP | Must be provided with effective HP devices | Identify hazardous noise | ? | Detailed follow‐up 3 and 6 months after a STS | ? | |
| HCP | Earmuffs and or earplugs with level‐dependent function limited to 82 dB(A) with SNR 27 dB | Standardised noise measurements | Risk areas around weapon use | ? | Screening audiometry | |
| HCP, stated to be stricter than to the one evaluated in Muhr 2006 | Mandatory use of HPDs, earmuffs and or earplugs with or without level‐dependent function (enable speech communication), (stated to be stricter recommendations and better devices) | ? | safety distances (stated to be stricter) | Mandatory training in HPD use and education in NIHL and noise induced tinnitus, stricter audiometry inclusion criteria for acceptance to military service (≤ 25 dB average HL for the frequencies 0.5 to 8 kHz in both ears, 30 dB HL at one or more frequencies, and 35–40 dB HL at one single frequency) (to exclude mild hearing loss cases presumed to be more vulnerable to HL) | Screening audiometry at begin and end of military service | |
| Routine HCP | ? | Individual noise dosimetry over long periods | ? | ? | Calibrated ISO 389 isolated booth | |
| ? | Mandatory hearing protection | Routine noise level surveys | Noise abatement | ? | Automatic Bekesy‐type ANSI calibrated | |
| HCP | 3 specific types of earplugs | Sound survey, noise dosimeters | ? | ? | Audiometric database | |
| Demonstrate excellent HCP practices | ? | ? | ? | ? | ? | |
| ANSI = American National Standards Institute | ||||||
| Reference ID | Case studies included in review | |||||
| Number of cases | Type of industry | Country | Interventiona | Measureb | Additional information (number of cases) | |
| 1 | mining (1) | USA | retro‐fit | noise level, noise dose | description of noise measurement (1), follow‐up (1) | |
| 1 | offshore helicopter (1) | France | all retro‐fit | noise level | description of noise measurement (1), funding (1), conflict of interest (1) | |
| 2 | manufacturing (2) | USA | all retro‐fit | noise level, dose | description of noise measurement (2) | |
| 3 | steel industry (3) | Iran | all retro‐fit | noise level, dose | description of noise measurement (3), funding (3), conflict of interest (3) | |
| 57 | manufacturing (57) | not reported | new 6 retro‐fit 51 | noise level | ‐ | |
| 2 | manufacturing (2) | not reported | all retro‐fit | noise level | ‐ | |
| 1 | alpine rescue operation (helicopter) (1) | Austria, Switzerland | new | noise level | description of noise measurement, follow‐up, statistical tests used | |
| 8 | textile (1), paper shredding (1), manufacturing (6) | USA | new 4, retro‐fit 2, both 2 | noise level | ‐ | |
| 18 | manufacturing (15), drilling industry (2), mining (1) | not reported | new 5, retro‐fit 11, both 2 | noise level, dose | description of noise measurement (3) | |
| 3 | mining (3) | Australia | all retro‐fit | dose | description of noise measurement (2), funding (3), follow‐up (immediate) (3) | |
| 5 | mining(5) | USA | all retro‐fit | noise level, dose | description of noise measurement (1), adverse effects: engine over‐heating (1), time of intervention: 2014/2015 (1) | |
| 6 | manufacturing (6) | not reported | all retro‐fit | noise level | ‐ | |
| Total | 107 | manufacturing (88), mining (10), steel (3), drilling (2), helicopter (2), textile (1), paper shredding (1) | Australia (3), Iran (3), France (1), USA (16), Austria and Switzerland (1), nr (26) | retro‐fit (86), new (16), both (4) | noise level, dose | description of noise measurement (14), funding (7), follow‐up (5), conflict of interest (4), adverse effects (1), time of intervention (1), statistical tests used (1) |
| aTypes of intervention: installation of completely new equipment (new), intervention to improve existing equipment (e.g. new parts, additional damping material layers) (retro‐fit), or a combination of new and retro‐fit interventions (both). | ||||||
| New equipment | |||||||
| Noise source | Intervention | follow‐up | Initial noise level | Noise level after | 8 h TWA before | 8 h TWA after | Reference ID |
| Helicopter | Modern helicopter with advanced technology (compared to older helicopters without advanced technology) | short term (1 year) | mean 98.41 (SD 4.49) (n = 10) | mean 87.9 (SD 4.16) (n = 4) | |||
| Pumps | New high‐pressure coolant pumps have been installed at various metal cutting operations. These new pumps produce more pressure and more volume directly at the cutting tools. | not reported | 110 dB | 87 dB | |||
| Drill | New injector drill with a sound enclosure for a deep drilling operation | not reported | 110 dB | 95 dB | |||
| Roof fans | Old roof fans were replaced with new high‐efficiency fans | not reported | lowered the noise below the fan | ||||
| Air gun | Air gun substitution | not reported | 94 dB | 85 dB | |||
| Fork lifts | Use of tugs instead of fork lifts | not reported | 92 dB | 72 dB | |||
| Alarm system | Change from audible alarm to visual warning and pressure sensor | not reported | 95 dB | 0 dB | |||
| Air wand | Replacement of 45 air wands | not reported | 112.8 dB | 90.1 dB | |||
| Bottling line ‐ rinser‐filler‐capper machine | Purchase of a new bottling line | not reported | 89 dB | below 80 dB | |||
| Bottle‐blowers | New bottle‐blowers and segregation | not reported | 86‐87 dB | below 83 dB | |||
| Glass bottles on transport conveyer | Purchasing new design of bottle transport conveyor | not reported | 101 dB | 83 dB | |||
| Packing machinery ‐ Compressors and compressed‐air exhausts | Purchasing policy and fitted silencers | not reported | above 90 dB | below 85 dB | |||
| Bakery machinery | Not purchasing equipment that produced noise level above 85 dB, company’s health and safety adviser would visit the makers of new machinery during its manufacture and conduct a noise assessment to make sure the machinery did not exceed 85 dB | not reported | 94 dB | 85 dB | |||
| Bottle‐laner ‐ bottles banging together on laner conveyor | New machine with guide‐rails | not reported | 93‐96 dB | 87 dB | |||
| Number of cases: 14 | mean before | mean after | mean reduction | ||||
| Noise level dB | 97.4 dB | 77.7 dB | 19.7 | ||||
| TWA dB | 98.41 (SD 4.49) | 87.9 (SD 4.16) | 10.51 (95% CI 15.45 to 5.57) | ||||
| TWA = time weighted average | |||||||
| Acoustic panels and curtains | |||||||
| Noise source | Intervention | Follow‐up | Initial noise level | Noise level after | Dose before | Dose after | Reference ID |
| Production noise | Door | not reported | 85 dB | 79 dB | |||
| Blast furnace | Control rooms were redesigned in order to improve acoustical condition: installation of a UPVC window with vacuumed double‐layered glass 80 x 80 cm and double wall for entrance by 90° rotate plus a 2.0 × 1.2 m steel door without glass | not reported | 80 dB | 52.6 dB | |||
| Blast furnace | In rest room wall facing to the furnace was made from the armed concrete with a thickness of 20 cm, length of 9 m, and height of 3 m and was located in the entrance by 90° rotate | not reported | 86.1 dB | 58.4 dB | |||
| Blast furnace | Control room and rest room redesigned to improve acoustical condition | not reported | 236% (unspecified) | 130% (unspecified) | |||
| Product impact on multi‐head weigher | Fitted flexible PVC curtains | not reported | 92 dB | 88 dB | |||
| Packaging lines | Fitted acoustic baffles to ceiling | not reported | Above 90 dB | below 90 dB | |||
| Noise from hearing protection zones affecting quieter areas | Erected acoustic panels and automatic doors between hearing protection zones and quieter areas | not reported | Above 90 dB | below 85 dB | |||
| Filler pump | Improved efficiency of pump and added acoustic hood | not reported | 96 dB | 86 dB | |||
| Compressed air in bottle transportation | Acoustic side panels fitted | not reported | 85–86 dB | 73 dB | |||
| Product impact on hoppers | Flexible PVC curtains fitted | not reported | Above 90 dB | 83 dB | |||
| Number of cases: 10 | mean before | mean after | mean reduction | ||||
| noise level dB | 88.3 | 77.2 | 11.1 | ||||
| Dose % (unspecified) | 236 | 130 | 106 | ||||
| Damping material and silencers | |||||||||
| Noise source | Intervention | Follow‐up | Initialnoise level | Noise level after | 8 h TWA before | 8 h TWA after | Dose before | Dose after | Reference ID |
| Confetti machine | Damped machine surfaces: Replaced vacuums with small cyclones that were quieter and had fewer clogs, Installed conveyors to carry the paper into the disintegrators | not reported | 95 dB | 85 dB | |||||
| Production noise | Installation of sound absorbing panels, shields, covers, insulation, sheeting, installation of mufflers for fans and solenoids, reduction of compressed‐air pressure and volume in vents, use of vibrating personal alarms instead of audible alarms | not reported | 2 to 11 dB noise reduction | ||||||
| Helicopter | Cover of structural leaks with lightweight materials (e.g. new door seals) and damping of the structure (patches of constrained visco‐elastic materials that are bonded to the structure), optimised sound‐proofing panels (sandwich panels with “soft core”) and windows (thickened laminated windows with damping layer and double glazing), and Main Gear Box suspension devices (laminated ball joints at MGB support strut foot) | not reported | 7 dB noise reduction | ||||||
| Pump | Suppressor on palletizer hydraulic pump to minimize hydraulic banging, pump whine contained in sound‐insulated box | not reported | 88 dB | 83 dB | |||||
| Air‐rotary drill rig | Installation of hydraulic noise suppressors and a lead‐fiberglass blanket covering Ihe gap between the inside door and the cab frame | not reported | 98 dB | 95 dB | MSHA PEL 280%; NIOSH 3222% | MSHA PEL 210%: NIOSH 2585% | |||
| Air‐rotary drill rig | Installation of hydraulic noise suppressors | not reported | 98 dB | 97 dB | MSHA PEL 280%; NIOSH 3222% | MSHA PEL 249%; NIOSH 2951% | |||
| Pumps | Installing mufflers on pumps | not reported | 98.1 dB | 81.3 dB | |||||
| Haul trucks in underground metal/non‐metal mines | Improving the engine compartment noise barrier: the usual barrier material has been replaced with a barrier material part number Duracote 5356, manufactured by Durasonic | not reported | MSHA PEL 495% | MSHA PEL 416% | |||||
| Chiller | Reduce noise from a chiller with a combination of acoustic absorbent and retro‐fit constrained layer damping | not reported | 8 dB noise reduction | ||||||
| High‐speed strip‐fed press | Normally the press legs are welded boxes, the press frame was isolated from the fabricated legs by inserting 6 mm composite pads between frame and legs | not reported | 101 dB | 92 dB | |||||
| Product impact on hoppers and chutes | Coated internally with food‐grade, sound‐deadening material | not reported | 96–98 dB | Noise reduced by 2‐8 dB | |||||
| Gas cylinder impact on metal table | Rubber matting on table | not reported | 110 dB peaks | removal of peak noises | |||||
| Product impact on ducting | Lagged ductwork with noise‐absorbent padding | not reported | 92 dB | 84 dB | |||||
| Product impact on vibrating components | Coated externally with sound‐deadening material | not reported | 92 dB | 84 dB | |||||
| Bread‐basket stacking machine | Fitted hydraulic dampers | not reported | 92 dB | 83 dB | |||||
| Hand‐crimping metal foil packages | Mounted on layers of rubber | not reported | 86–89 dB | 85–86 dB | |||||
| Keg impact on concrete floor | Fitted rubber matting on to floor | not reported | High noise levels | Noise levels reduced | |||||
| Gas cylinder impact on metal ‘A’ frame trolleys | Fitted rubber matting on to trolleys | not reported | 110 dB peaks | Peak noise levels reduced | |||||
| Road tanker degassing | Fitted silencers | not reported | 92 dB | 83 dB | |||||
| Evaporative condensers and refrigeration plant | Fitted silencers | not reported | 94 dB | 83–87 dB | |||||
| Number of cases: 20 | mean before | mean after | mean reduction | ||||||
| noise level dB | 93.6 | 86.5 | 7 | ||||||
| TWA dB | 101 | 92 | 9 | ||||||
| Dose % (MSHA PEL) [dosimeter settings: | 351.7 | 291.7 | 60 | ||||||
| Dose % (NIOSH) [dosimeter settings: | 3222 | 2768 | 454 | ||||||
| MSHA = Mine safety and health administration NIOSH = National Institute for Occupational Safety and Health PEL = permissible exposure limit | |||||||||
| Design changes | |||||||||
| Noise source | Intervention | Follow‐up | Initial noise level | Noise level after | 8 h TWA before | 8 h TWA after | Dose before | Dose after | Reference ID |
| Roof bolting machine at underground coal mines | New drill bit isolator | immediate | reduced by 3.2 dB | MSHA PEL per hole 0.85% | MSHA PEL per hole 0.57% | ||||
| short term (after 253 holes and 628 m) | reduced by 2.2 dB | MSHA PEL per hole 0.9% | MSHA PEL per hole 0.66% | ||||||
| 4‐roll calender in a tire manufacturing facility "calender operator" | Replacing the piercer brackets, optimising alignment and improving preventative maintenance (increased and more frequent lubrication of the piercer and other areas of the equipment with high friction or pressure) | not reported | 87.7 dB | 86.3 dB | OSHA dose 72.8% | OSHA dose 59.6% | |||
| 4‐roll calender in a tire manufacturing facility "wind up operator" | Replacing the piercer brackets, optimising alignment and improving preventative maintenance (increased and more frequent lubrication of the piercer and other areas of the equipment with high friction or pressure) | not reported | 93.1 dB | 89 dB | OSHA dose 153% | OSHA dose 87.3% | |||
| Heavy metal arms which drove the reciprocating blade on the machines | Alternative linkage using flexible nylon straps | not reported | 95 dB | 75 dB | |||||
| Tobacco filter making machine | Machine design improvements on a tobacco filter making machine and room improvements | not reported | 9 dB reduction | ||||||
| Weaving machines | Use of different spindle | not reported | 100 dB | 90 dB | |||||
| Locomotive for mining | Active noise control | immediate | |||||||
| Mining truck | Active noise control | immediate | |||||||
| Mining truck | active noise control and damping material | immediate | |||||||
| Filler | Filler outfeed: line shaft removed, individual drives installed | not reported | 107 dB | 81 dB | |||||
| Con‐air dryer | Machine set on vibration mounts, quieter blower | not reported | 94 dB | 85 dB | |||||
| Transfer cart | not reported | not reported | 94 dB | 79 dB | |||||
| Trimmer | rReplacing nozzles from trimmer with in feed decline drive belt | not reported | 98 to 113 dB | 86 to 104 dB | |||||
| Continuous mining machine | Exchange of a single sprocket chain for a dual sprocket chain on a continuous mining machine (CMM, Joy Mining Machine 14CM‐15) | not reported | 93.4 to 93.3 dB | 92 dB | MSHA PEL 159 % | MSHA PEL 132.5% | |||
| Moen case former | Exchange of pneumatic cylinder for servo‐mandrel | not reported | 97 dB | 87 dB | |||||
| Cart | Exchange of cart wheels | not reported | 88 dB | 72 dB | |||||
| Standard longwall cutting drums (mining) | Modified set of longwall cutting drums instead of a set of standard (baseline) drums | not reported | 98 dB | 92 dB | 95.7 dB | 93.1 dB | MSHA PEL 220.5% | MSHA PEL 158.6% | |
| Haul trucks in underground metal/non‐metal mines | Improving the engine compartment noise barrier and changing the fan type, size, and rotation speed (larger fan of different design and different fan pulley to reduce the fan rotation speed to 90%) | not reported | 102 dB | 93 dB | MSHA PEL 495% | MSHA PEL 158% | |||
| Load‐haul‐dumps (LHDs) in underground metal/non‐metal mines | Improving the engine compartment noise barrier and changing the fan type, size, and rotation speed (larger fan of a different design and a different fan hub to reduce the fan rotation speed to roughly 87% and new noise barrier material (Duracote Durasonic 5356)) | not reported | 98 dB | 96 dB | MSHA PEL 289% | MSHA PEL 231% | |||
| Load‐haul‐dumps (LHDs) in underground metal/non‐metal mines | Improving the engine compartment noise barrier and changing the fan type, size, and rotation speed (a larger fan of a different design was installed as well as a different fan hub to reduce the fan rotation speed to roughly 95%) | not reported | 98 dB | 93 dB | MSHA PEL 289% | MSHA PEL 142% | |||
| Standard camshaft washer drying nozzles (pneumatic) | Pneumatic nozzles replaced with suitable entraining units | not reported | 12 dB reduction | ||||||
| Drier fan | Retro‐fitting aerodynamic and acoustic elements inside fan casings and the associated ductwork | not reported | 9 dB reduction | ||||||
| Aluminium can extract and chopper fans | Fitting aerodynamic inserts inside the fan casing | not reported | 22 dB reduction | ||||||
| Separator (large thin sheet distribution dome) | alteration to a vibratory separator: forming this component in stainless sound deadened steel | not reported | 105 dB | 89 dB | |||||
| Metal trays | Replacing metal trays with plastic trays | not reported | 89 dB | 84‐85 dB | |||||
| Metal wheels on baking racks | Replacing baking rack wheels with resin wheels | not reported | above 100 dB | 86‐92 dB | |||||
| Loosening product from baking tins with air knives | Air knives modified to operate with a diffuse air jet | not reported | above 90 dB | below 85 dB | |||||
| Bottles and cans banging together on conveyors | Fitted a pressureless combiner conveyor system | not reported | above 90 dB | below 90 dB | |||||
| Baking tins banging together on chain or slat conveyors | Installing ‘tin‐friendly’ conveyors | not reported | above 90 dB | below 85 dB | |||||
| Manual changeover of baking tins on conveyor | Installed robots to handle pans | not reported | 94‐96 dB | below 90 dB | |||||
| Water pumps on filling machines | Replaced with air pumps and fitted silencers | not reported | 90 dB | 84 dB | |||||
| Filling sachets and cups | New design of horizontal powder‐feeder and enclosed machine | not reported | 83‐84 dB | 80 dB | |||||
| Bottle manufacture, filling and packing lines | Acoustic panels fitted to walls, high ceiling installed | not reported | Above 90 dB | 83 dB | |||||
| Contact between metal trays and metal tracking | Replaced with plastic tracking | not reported | 94 dB | 87 dB | |||||
| Product impact on metal chutes | Replaced with plastic chutes | not reported | 96‐98 dB | 90 dB | |||||
| Electrically powered sausage‐spooling machines | Replaced with compressed‐air spooler | not reported | 86‐90 dB | below 80 dB | |||||
| Tray‐indexing arm | Plastic caps on fingers of indexing arm | not reported | 94 dB | 87‐89 dB | |||||
| Vibratory conveyor | Ensured conveyor only used at least noisy speed | not reported | above 90 dB | below 85 | |||||
| Glass bottles on conveyor | New design of conveyor with different chain speeds | not reported | 101 dB | 84 dB | |||||
| Lidding and de‐lidding tins | Installed robots to lid and de‐lid baking tins | not reported | 90‐93 dB | 88 dB | |||||
| Number of cases: 41 | mean before | mean after | mean reduction | ||||||
| Noise level dB | 94.5 dB | 85.3 dB | 9.6 dB | ||||||
| TWA dB | 95.4 | 91.8 | 3.4 dB | ||||||
| Dose % (OSHA) | 112.9 | 73.5 | 39.5 | ||||||
| Dose % (MSHA PEL) | 207.8 | 117.6 | 90.1 | ||||||
| MSHA = Mine Safety and Health Administration OSHA = Occupational Safety and Health Administration PEL = permissible exposure limit | |||||||||
| Enclosure | |||||
| Noise source | Intervention | Follow‐up | Initial noise level | Noise level after | Reference ID |
| Conveyor | An enclosure was put over the conveyor at a cost of GBP 2000 and the conveyor speed was changed to reduce jar clashing | not reported | 96 dB | 86 dB | |
| Grinder | Enclosure over the grinder | not reported | 93 dB | 85 dB | |
| Not reported | Use of an enclosure with acoustical foam to deburring area | not reported | 104 dB | 82 dB | |
| Feeder | Enclosing the bowl feeder | not reported | 116 dB | 86 dB | |
| Compressed‐air knives | Enclosed machine | not reported | 91–92 dB | Below 85 dB | |
| Glass‐bottle conveyor | Enclosed the conveyor noise levels | not reported | Above 90 dB | reduced by 2‐8 dB | |
| Blower machine | Enclosed machine using sound‐absorbent panels | not reported | above 90 | Below 90 dB | |
| Bottle‐blowing machines | Machine enclosed and segregated | not reported | 94 dB | 89 dB | |
| Hammer mill | Enclosed in an acoustic booth | not reported | 102 dB | 87 dB | |
| Rinser‐filler‐capper machine | Enclosed machine | not reported | 85 dB | 73 dB | |
| Glass jars clashing together on conveyor | Fitted enclosure and changed conveyor speed | not reported | 96 dB | 86 dB | |
| Bottles banging together on filler infeed conveyor | Fitted covers over conveyor | not reported | 96‐100 dB | 92 dB | |
| Number of cases: 12 | mean before | mean after | mean reduction | ||
| Noise level (dB) | 96.3 dB | 85.5 dB | 11.8 dB | ||
| Maintenance | |||||
| Noise source | Intervention | Follow‐up | Initial noise level | Noise level after | Reference ID |
| Dough mixer | Maintenance modifications to a mixing machine | not reported | 94 dB | 91 dB | |
| Compressed air in soft drinks factory machines | Regular maintenance of machines to reduce noise from air leaks | not reported | High noise levels | Noise levels reduced by 3 to 4 dB | |
| Gearboxes on mixing machine | Lubricating gearboxes | not reported | 80–85 dB | Noise levels reduced by 1.5 dB | |
| Compressed‐air exhausts on vacuum‐wrapping machines | Fitting and maintaining silencers on wrapping machines | not reported | 88–90 dB | Below 85 dB | |
| Number of cases: 4 | mean before | mean after | mean reduction | ||
| Noise level dB | 88.5 dB | 85.7 dB | 3 dB | ||
| Segregation | |||||
| Noise source | Intervention | Follow‐up | Initial noise level | Noise level after | Reference ID |
| Main production area of bakery | Re‐routing pedestrian traffic, signage and training | not reported | 94 dB | below 85 dB | |
| Bowl chopper and mincers | Moved from main production area to an isolated area | not reported | 88–94 dB | below 85 dB | |
| Basket‐washing machine in main bakery | Moved to a separate building | not reported | 88 dB | Noise source removed | |
| High‐pressure air‐compressor | Located in a separate room | not reported | 110–112 dB | 60–70 dB outside room | |
| Vibrating cap‐hoppers | Located in separate enclosure | not reported | Above 90 dB | Noise source removed | |
| Air‐compressor | Located in separate, unmanned room | not reported | 94–95 dB | 80 dB | |
| Pet food processing area | Solid block wall with acoustic panelling between processing and packaging area | not reported | 95 dB | Below 85 dB | |
| Number of cases: 7 | mean before | mean after | mean reduction | ||
| Noise level dB | 97.1 dB | 80.0 dB | 17.1 dB | ||
| Study | Independence other changes | Sufficient data points | Formal test for trend | Intervention does not affect data | Blinded assessment of outcome | Complete data set | Reliable outcome measure |
| Not done | Done | Done | Not done | Not done | Not clear | Done | |
| Not done | Done | Done | Done | Not Done | Done | Done |
| Outcome or subgroup title | No. of studies | No. of participants | Statistical method | Effect size |
| 1 Immediate change in level Show forest plot | 1 | immediate change in level (Random, 95% CI) | Totals not selected | |
| 1.1 Surface noise Intervention (Int) Year 1999 | 1 | immediate change in level (Random, 95% CI) | 0.0 [0.0, 0.0] | |
| 1.2 Underground noise Int Year 1999 | 1 | immediate change in level (Random, 95% CI) | 0.0 [0.0, 0.0] | |
| 1.3 Surface noise Int Year 2000 | 1 | immediate change in level (Random, 95% CI) | 0.0 [0.0, 0.0] | |
| 1.4 Underground noise Int Year 2000 | 1 | immediate change in level (Random, 95% CI) | 0.0 [0.0, 0.0] | |
| 2 Change in slope Show forest plot | 1 | change in slope (Random, 95% CI) | Totals not selected | |
| 2.1 Surface noise Int Year 1999 | 1 | change in slope (Random, 95% CI) | 0.0 [0.0, 0.0] | |
| 2.2 Underground noise Int Year 1999 | 1 | change in slope (Random, 95% CI) | 0.0 [0.0, 0.0] | |
| 2.3 Surface noise Int Year 2000 | 1 | change in slope (Random, 95% CI) | 0.0 [0.0, 0.0] | |
| 2.4 Underground noise Int Year 2000 | 1 | change in slope (Random, 95% CI) | 0.0 [0.0, 0.0] | |
| Outcome or subgroup title | No. of studies | No. of participants | Statistical method | Effect size |
| 1 Noise attenuation at 0.5 kHz (REAT) Show forest plot | 1 | 40 | Mean Difference (IV, Random, 95% CI) | 2.34 [‐0.85, 5.54] |
| 1.1 Wilson Sound Ban cap | 1 | 20 | Mean Difference (IV, Random, 95% CI) | 4.1 [‐2.47, 10.67] |
| 1.2 Bilsom UF‐1 muff | 1 | 20 | Mean Difference (IV, Random, 95% CI) | 1.80 [‐1.86, 5.46] |
| 2 Noise attenuation at 1 kHz (REAT) Show forest plot | 1 | 40 | Mean Difference (IV, Random, 95% CI) | 0.89 [‐3.02, 4.80] |
| 2.1 Wilson Sound Ban Cap | 1 | 20 | Mean Difference (IV, Random, 95% CI) | 3.80 [‐3.70, 11.30] |
| 2.2 Bilsom UF‐1 Muff | 1 | 20 | Mean Difference (IV, Random, 95% CI) | ‐0.20 [‐4.78, 4.38] |
| 3 Noise attenuation at 2 kHz (REAT) Show forest plot | 1 | 40 | Mean Difference (IV, Random, 95% CI) | 2.57 [‐0.23, 5.38] |
| 3.1 Wilson Sound Ban Cap | 1 | 20 | Mean Difference (IV, Random, 95% CI) | 2.70 [‐1.89, 7.29] |
| 3.2 Bilsom UF‐1 Muff | 1 | 20 | Mean Difference (IV, Random, 95% CI) | 2.5 [‐1.05, 6.05] |
| 4 Noise attenuation at 3 kHz (REAT) Show forest plot | 1 | 40 | Mean Difference (IV, Random, 95% CI) | 2.23 [0.09, 4.36] |
| 4.1 Wilson Sound Ban Cap | 1 | 20 | Mean Difference (IV, Random, 95% CI) | 1.60 [‐3.01, 6.21] |
| 4.2 Bilsom UF‐1 Muff | 1 | 20 | Mean Difference (IV, Random, 95% CI) | 2.40 [‐0.01, 4.81] |
| 5 Noise attenuation at 4 kHz (REAT) Show forest plot | 1 | 40 | Mean Difference (IV, Random, 95% CI) | 0.83 [‐3.28, 4.95] |
| 5.1 Wilson Sound Ban Cap | 1 | 20 | Mean Difference (IV, Random, 95% CI) | 0.90 [‐6.18, 7.98] |
| 5.2 Bilsom UF‐1 Muff | 1 | 20 | Mean Difference (IV, Random, 95% CI) | 0.80 [‐4.26, 5.86] |
| 6 Noise attenuation at 6 kHz (REAT) Show forest plot | 1 | 40 | Mean Difference (IV, Random, 95% CI) | 0.64 [‐3.76, 5.04] |
| 6.1 Wilson Sound Ban Cap | 1 | 20 | Mean Difference (IV, Random, 95% CI) | 2.30 [‐7.31, 11.91] |
| 6.2 Bilsom UF‐1 Muff | 1 | 20 | Mean Difference (IV, Random, 95% CI) | 0.20 [‐4.75, 5.15] |
| 7 Noise attenuation at 8 kHz (REAT) Show forest plot | 1 | 40 | Mean Difference (IV, Random, 95% CI) | 1.14 [‐3.59, 5.87] |
| 7.1 Wilson Sound Ban Cap | 1 | 20 | Mean Difference (IV, Random, 95% CI) | 2.0 [‐8.13, 12.13] |
| 7.2 Bilsom UF‐1 Muff | 1 | 20 | Mean Difference (IV, Random, 95% CI) | 0.90 [‐4.45, 6.25] |
| Outcome or subgroup title | No. of studies | No. of participants | Statistical method | Effect size |
| 1 Noise attenuation at 0.5 kHz (REAT) Show forest plot | 1 | 40 | Mean Difference (IV, Random, 95% CI) | 12.69 [7.69, 17.69] |
| 1.1 EAR foam plugs | 1 | 20 | Mean Difference (IV, Random, 95% CI) | 16.30 [5.93, 26.67] |
| 1.2 UltraFit plugs | 1 | 20 | Mean Difference (IV, Random, 95% CI) | 11.6 [5.89, 17.31] |
| 2 Noise attenuation at 1 kHz (REAT) Show forest plot | 1 | 40 | Mean Difference (IV, Random, 95% CI) | 13.31 [8.13, 18.50] |
| 2.1 EAR foam plugs | 1 | 20 | Mean Difference (IV, Random, 95% CI) | 15.40 [5.62, 25.18] |
| 2.2 UltraFit plugs | 1 | 20 | Mean Difference (IV, Random, 95% CI) | 12.5 [6.39, 18.61] |
| 3 Noise attenuation at 2 kHz (REAT) Show forest plot | 1 | 40 | Mean Difference (IV, Random, 95% CI) | 9.62 [4.52, 14.72] |
| 3.1 EAR foam plugs | 1 | 20 | Mean Difference (IV, Random, 95% CI) | 7.90 [‐1.21, 17.01] |
| 3.2 UltraFit plugs | 1 | 20 | Mean Difference (IV, Random, 95% CI) | 10.40 [4.25, 16.55] |
| 4 Noise attenuation at 3 kHz (REAT) Show forest plot | 1 | 40 | Mean Difference (IV, Random, 95% CI) | 6.71 [2.66, 10.76] |
| 4.1 EAR foam plugs | 1 | 20 | Mean Difference (IV, Random, 95% CI) | 6.20 [‐1.54, 13.94] |
| 4.2 UltraFit plugs | 1 | 20 | Mean Difference (IV, Random, 95% CI) | 6.90 [2.15, 11.65] |
| 5 Noise attenuation at 4 kHz (REAT) Show forest plot | 1 | 40 | Mean Difference (IV, Random, 95% CI) | 7.97 [3.60, 12.34] |
| 5.1 EAR foam plugs | 1 | 20 | Mean Difference (IV, Random, 95% CI) | 6.00 [‐1.23, 13.23] |
| 5.2 UltraFit plugs | 1 | 20 | Mean Difference (IV, Random, 95% CI) | 9.10 [3.62, 14.58] |
| 6 Noise attenuation at 6 kHz (REAT) Show forest plot | 1 | 40 | Mean Difference (IV, Random, 95% CI) | 12.13 [6.21, 18.05] |
| 6.1 EAR foam plugs | 1 | 20 | Mean Difference (IV, Random, 95% CI) | 9.2 [‐1.87, 20.27] |
| 6.2 UltraFit plugs | 1 | 20 | Mean Difference (IV, Random, 95% CI) | 13.3 [6.30, 20.30] |
| 7 Noise attenuation at 8 kHz (REAT) Show forest plot | 1 | 40 | Mean Difference (IV, Random, 95% CI) | 11.07 [4.51, 17.64] |
| 7.1 EAR foam plugs | 1 | 20 | Mean Difference (IV, Random, 95% CI) | 7.60 [‐0.97, 16.17] |
| 7.2 UltraFit plugs | 1 | 20 | Mean Difference (IV, Random, 95% CI) | 14.3 [6.11, 22.49] |
| 8 Mean noise attenuation over 0.5, 1, 2, 3, 4, 6, 8 kHz (REAT) Show forest plot | 2 | 140 | Mean Difference (IV, Fixed, 95% CI) | 8.59 [6.92, 10.25] |
| 8.1 Moldex Comets, EN352, USA | 1 | 100 | Mean Difference (IV, Fixed, 95% CI) | 8.34 [6.58, 10.10] |
| 8.2 EAR foam plugs | 1 | 20 | Mean Difference (IV, Fixed, 95% CI) | 9.8 [0.60, 19.00] |
| 8.3 UltraFit plugs | 1 | 20 | Mean Difference (IV, Fixed, 95% CI) | 11.16 [4.87, 17.45] |
| Outcome or subgroup title | No. of studies | No. of participants | Statistical method | Effect size |
| 1 Mean attenuation at 0.5, 1, 2, 3, 4, 6, 8 kHz Show forest plot | 1 | Mean Difference (IV, Fixed, 95% CI) | Subtotals only | |
| 1.1 NRR 20 vs NRR 30 | 1 | 100 | Mean Difference (IV, Fixed, 95% CI) | 2.62 [1.75, 3.49] |
| Outcome or subgroup title | No. of studies | No. of participants | Statistical method | Effect size |
| 1 Noise attenuation (dB) Show forest plot | 1 | 4 | Mean Difference (IV, Fixed, 95% CI) | 0.0 [0.0, 0.0] |
| 1.1 Alpha‐200 series with Active Noise Cancelling | 1 | 2 | Mean Difference (IV, Fixed, 95% CI) | 0.0 [0.0, 0.0] |
| 1.2 Gentex/Bose Active Noise Cancelling | 1 | 2 | Mean Difference (IV, Fixed, 95% CI) | 0.0 [0.0, 0.0] |
| 2 TTS at 1 kHz (before exposure ‐ after exposure ) Show forest plot | 1 | Mean Difference (IV, Random, 95% CI) | Subtotals only | |
| 3 TTS at 2 kHz (before exposure ‐ after exposure ) Show forest plot | 1 | Mean Difference (IV, Random, 95% CI) | Subtotals only | |
| 4 TTS at 4 kHz (before exposure ‐ after exposure ) Show forest plot | 1 | Mean Difference (IV, Random, 95% CI) | Subtotals only | |
| 5 TTS at 6 kHz (before exposure ‐ after exposure ) Show forest plot | 1 | Mean Difference (IV, Random, 95% CI) | Subtotals only | |
| 6 TTS at 8 kHz (before exposure ‐ after exposure ) Show forest plot | 1 | Mean Difference (IV, Random, 95% CI) | Subtotals only | |
| Outcome or subgroup title | No. of studies | No. of participants | Statistical method | Effect size |
| 1 Noise attenuation dB(A) Show forest plot | 1 | 20 | Mean Difference (IV, Random, 95% CI) | 3.10 [1.12, 5.08] |
| Outcome or subgroup title | No. of studies | No. of participants | Statistical method | Effect size |
| 1 Noise attenuation (dB) Show forest plot | 1 | 36 | Mean Difference (IV, Fixed, 95% CI) | 0.0 [0.0, 0.0] |
| 1.1 Peltor H61 Muff Elec | 1 | 6 | Mean Difference (IV, Fixed, 95% CI) | 0.0 [0.0, 0.0] |
| 1.2 Peltor H7 Muff Elec | 1 | 6 | Mean Difference (IV, Fixed, 95% CI) | 0.0 [0.0, 0.0] |
| 1.3 Peltor H6 Muff Elec | 1 | 6 | Mean Difference (IV, Fixed, 95% CI) | 0.0 [0.0, 0.0] |
| 1.4 Bilsom Marksman Muff Elec | 1 | 6 | Mean Difference (IV, Fixed, 95% CI) | 0.0 [0.0, 0.0] |
| 1.5 Silenta Hunter Muff Elec | 1 | 6 | Mean Difference (IV, Fixed, 95% CI) | 0.0 [0.0, 0.0] |
| 1.6 EAR Ultra 9000 Plug | 1 | 6 | Mean Difference (IV, Fixed, 95% CI) | 0.0 [0.0, 0.0] |
| Outcome or subgroup title | No. of studies | No. of participants | Statistical method | Effect size |
| 1 Change in noise levels at 2 months' follow‐up Show forest plot | 1 | 132 | Mean Difference (IV, Random, 95% CI) | 0.32 [‐2.44, 3.08] |
| 1.1 Extensive information plus NLI vs information only | 1 | 64 | Mean Difference (IV, Random, 95% CI) | ‐0.40 [‐4.37, 3.57] |
| 1.2 Information plus NLI vs Information only | 1 | 68 | Mean Difference (IV, Random, 95% CI) | 1.0 [‐2.84, 4.84] |
| 2 Change in noise levels at 4 months' follow‐up Show forest plot | 1 | 132 | Mean Difference (IV, Fixed, 95% CI) | ‐0.14 [‐2.66, 2.38] |
| 2.1 Extensive information plus NLI vs information only | 1 | 64 | Mean Difference (IV, Fixed, 95% CI) | ‐0.30 [‐3.95, 3.35] |
| 2.2 Information plus NLI vs information only | 1 | 68 | Mean Difference (IV, Fixed, 95% CI) | 0.0 [‐3.48, 3.48] |
| Outcome or subgroup title | No. of studies | No. of participants | Statistical method | Effect size |
| 1 Change in noise levels at 2 months' follow‐up Show forest plot | 1 | Mean Difference (IV, Fixed, 95% CI) | Totals not selected | |
| 2 Change in noise levels at 4 months' follow‐up Show forest plot | 1 | Mean Difference (IV, Random, 95% CI) | Totals not selected | |
| Outcome or subgroup title | No. of studies | No. of participants | Statistical method | Effect size |
| 1 TTS at 0.5 kHz (Hearing loss before exposure ‐ after exposure ) Show forest plot | 1 | 70 | Mean Difference (IV, Random, 95% CI) | 0.0 [0.0, 0.0] |
| 1.1 After 8 minutes out of noise | 1 | 18 | Mean Difference (IV, Random, 95% CI) | 0.0 [0.0, 0.0] |
| 1.2 After 14.6 minutes out of noise | 1 | 18 | Mean Difference (IV, Random, 95% CI) | 0.0 [0.0, 0.0] |
| 1.3 After 20 minutes out of noise | 1 | 17 | Mean Difference (IV, Random, 95% CI) | 0.0 [0.0, 0.0] |
| 1.4 After 27.2 minutes out of noise | 1 | 17 | Mean Difference (IV, Random, 95% CI) | 0.0 [0.0, 0.0] |
| 2 TTS at 1 kHz (before exposure ‐ after exposure ) Show forest plot | 1 | Mean Difference (IV, Random, 95% CI) | Subtotals only | |
| 2.1 After 8 minutes out of noise | 1 | 18 | Mean Difference (IV, Random, 95% CI) | 0.0 [0.0, 0.0] |
| 2.2 After 14.6 minutes out of noise | 1 | 18 | Mean Difference (IV, Random, 95% CI) | 0.0 [0.0, 0.0] |
| 2.3 After 20 minutes out of noise | 1 | 17 | Mean Difference (IV, Random, 95% CI) | 0.0 [0.0, 0.0] |
| 2.4 After 27.2 minutes out of noise | 1 | 17 | Mean Difference (IV, Random, 95% CI) | 0.0 [0.0, 0.0] |
| 3 TTS at 2 kHz (before exposure ‐ after exposure ) Show forest plot | 1 | Mean Difference (IV, Random, 95% CI) | Subtotals only | |
| 3.1 After 8 minutes out of noise | 1 | 18 | Mean Difference (IV, Random, 95% CI) | 0.0 [0.0, 0.0] |
| 3.2 After 14.6 minutes out of noise | 1 | 18 | Mean Difference (IV, Random, 95% CI) | 0.0 [0.0, 0.0] |
| 3.3 After 20 minutes out of noise | 1 | 17 | Mean Difference (IV, Random, 95% CI) | 0.0 [0.0, 0.0] |
| 3.4 After 27.2 minutes out of noise | 1 | 17 | Mean Difference (IV, Random, 95% CI) | 0.0 [0.0, 0.0] |
| 4 TTS at 3 kHz (before exposure ‐ after exposure ) Show forest plot | 1 | Mean Difference (IV, Random, 95% CI) | Subtotals only | |
| 4.1 After 8 minutes out of noise | 1 | 18 | Mean Difference (IV, Random, 95% CI) | 0.0 [0.0, 0.0] |
| 4.2 After 14.6 minutes out of noise | 1 | 18 | Mean Difference (IV, Random, 95% CI) | 0.0 [0.0, 0.0] |
| 4.3 After 20 minutes out of noise | 1 | 17 | Mean Difference (IV, Random, 95% CI) | 0.0 [0.0, 0.0] |
| 4.4 After 27.2 minutes out of noise | 1 | 17 | Mean Difference (IV, Random, 95% CI) | 0.0 [0.0, 0.0] |
| 5 TTS at 4 kHz (before exposure ‐ after exposure) Show forest plot | 1 | Mean Difference (IV, Random, 95% CI) | Subtotals only | |
| 5.1 After 8 minutes out of noise | 1 | 18 | Mean Difference (IV, Random, 95% CI) | 0.0 [0.0, 0.0] |
| 5.2 After 14.6 minutes out of noise | 1 | 18 | Mean Difference (IV, Random, 95% CI) | 0.0 [0.0, 0.0] |
| 5.3 After 20 minutes out of noise | 1 | 17 | Mean Difference (IV, Random, 95% CI) | 0.0 [0.0, 0.0] |
| 5.4 After 27.2 minutes out of noise | 1 | 17 | Mean Difference (IV, Random, 95% CI) | 0.0 [0.0, 0.0] |
| 6 TTS at 6 kHz (before exposure ‐ after exposure) Show forest plot | 1 | Mean Difference (IV, Random, 95% CI) | Subtotals only | |
| 6.1 After 8 minutes out of noise | 1 | 18 | Mean Difference (IV, Random, 95% CI) | 0.0 [0.0, 0.0] |
| 6.2 After 14.6 minutes out of noise | 1 | 18 | Mean Difference (IV, Random, 95% CI) | 0.0 [0.0, 0.0] |
| 6.3 After 20 minutes out of noise | 1 | 17 | Mean Difference (IV, Random, 95% CI) | 0.0 [0.0, 0.0] |
| 6.4 After 27.2 minutes out of noise | 1 | 17 | Mean Difference (IV, Random, 95% CI) | 0.0 [0.0, 0.0] |
| Outcome or subgroup title | No. of studies | No. of participants | Statistical method | Effect size |
| 1 Hearing loss change over 3 years (4 kHz / STS) Show forest plot | 2 | OR (Random, 95% CI) | Subtotals only | |
| 1.1 High noise exposure > 89 dB(A) | 2 | OR (Random, 95% CI) | 0.80 [0.63, 1.03] | |
| 1.2 Low noise exposure < 89 dB(A) | 2 | OR (Random, 95% CI) | 2.65 [0.40, 17.52] | |
| Outcome or subgroup title | No. of studies | No. of participants | Statistical method | Effect size |
| 1 STS Show forest plot | 1 | Odds Ratio (Fixed, 95% CI) | Subtotals only | |
| 1.1 3‐year follow‐up | 1 | Odds Ratio (Fixed, 95% CI) | 0.85 [0.29, 2.44] | |
| 1.2 16‐year follow‐up | 1 | Odds Ratio (Fixed, 95% CI) | 0.94 [0.46, 1.91] | |
| Outcome or subgroup title | No. of studies | No. of participants | Statistical method | Effect size |
| 1 HL (dB/year at 2, 3 and 4 kHz) Δ level Show forest plot | 1 | rate of hearing loss (Random, 95% CI) | Totals not selected | |
| 1.1 intervention ‐ controlled for age, gender, baseline hearing | 1 | rate of hearing loss (Random, 95% CI) | 0.0 [0.0, 0.0] | |
| 1.2 control ‐ controlled for age, gender, baseline hearing | 1 | rate of hearing loss (Random, 95% CI) | 0.0 [0.0, 0.0] | |
| 1.3 intervention minus control ‐ controlled for age, gender, baseline hearing | 1 | rate of hearing loss (Random, 95% CI) | 0.0 [0.0, 0.0] | |
| 1.4 intervention ‐ controlled for age, gender, baseline hearing and initial rate of HL | 1 | rate of hearing loss (Random, 95% CI) | 0.0 [0.0, 0.0] | |
| 1.5 control ‐ controlled for age, gender, baseline hearing and initial rate of HL | 1 | rate of hearing loss (Random, 95% CI) | 0.0 [0.0, 0.0] | |
| 1.6 intervention minus control ‐ controlled for age, gender, baseline hearing and initial rate of HL | 1 | rate of hearing loss (Random, 95% CI) | 0.0 [0.0, 0.0] | |
| 2 HL (dB/year at 2, 3 and 4 kHz) slope Show forest plot | 1 | rate of hearing loss (Fixed, 95% CI) | Totals not selected | |
| 2.1 intervention ‐ controlled for age, gender, baseline hearing | 1 | rate of hearing loss (Fixed, 95% CI) | 0.0 [0.0, 0.0] | |
| 2.2 control ‐ controlled for age, gender, baseline hearing | 1 | rate of hearing loss (Fixed, 95% CI) | 0.0 [0.0, 0.0] | |
| 2.3 intervention minus control ‐ controlled for age, gender, baseline hearing | 1 | rate of hearing loss (Fixed, 95% CI) | 0.0 [0.0, 0.0] | |
| 2.4 intervention ‐ controlled for age, gender, baseline hearing and initial rate of HL | 1 | rate of hearing loss (Fixed, 95% CI) | 0.0 [0.0, 0.0] | |
| 2.5 control ‐ controlled for age, gender, baseline hearing and initial rate of HL | 1 | rate of hearing loss (Fixed, 95% CI) | 0.0 [0.0, 0.0] | |
| 2.6 intervention minus control ‐ controlled for age, gender, baseline hearing and initial rate of HL | 1 | rate of hearing loss (Fixed, 95% CI) | 0.0 [0.0, 0.0] | |
| Outcome or subgroup title | No. of studies | No. of participants | Statistical method | Effect size |
| 1 Hearing loss change (STS) Show forest plot | 1 | 1317 | Odds Ratio (M‐H, Fixed, 95% CI) | 0.87 [0.56, 1.36] |
| Outcome or subgroup title | No. of studies | No. of participants | Statistical method | Effect size |
| 1 STS Show forest plot | 1 | 341 | Risk Ratio (M‐H, Fixed, 95% CI) | 0.36 [0.09, 1.42] |
| Outcome or subgroup title | No. of studies | No. of participants | Statistical method | Effect size |
| 1 Hearing loss change STS/at 4 kHz Show forest plot | 3 | 16301 | OR (Random, 95% CI) | 0.40 [0.23, 0.69] |
| 1.1 Adera 2000 | 1 | 15345 | OR (Random, 95% CI) | 0.26 [0.14, 0.47] |
| 1.2 Adera 1993 | 1 | 692 | OR (Random, 95% CI) | 0.35 [0.19, 0.65] |
| 1.3 Brink 2000 | 1 | 264 | OR (Random, 95% CI) | 0.62 [0.40, 0.97] |
| Outcome or subgroup title | No. of studies | No. of participants | Statistical method | Effect size |
| 1 Hearing loss change over 1 year at 4 kHz Show forest plot | 1 | Mean Difference (IV, Fixed, 95% CI) | Totals not selected | |
| Outcome or subgroup title | No. of studies | No. of participants | Statistical method | Effect size |
| 1 hearing loss STS Show forest plot | 1 | Risk Ratio (Random, 95% CI) | 3.38 [1.23, 9.32] | |
| 1.1 low‐exposed engineers | 1 | Risk Ratio (Random, 95% CI) | 2.07 [0.27, 15.99] | |
| 1.2 medium‐exposed infantry | 1 | Risk Ratio (Random, 95% CI) | 2.82 [0.37, 21.57] | |
| 1.3 high‐exposed artillery | 1 | Risk Ratio (Random, 95% CI) | 4.69 [1.13, 19.51] | |
| Outcome or subgroup title | No. of studies | No. of participants | Statistical method | Effect size |
| 1 hearing loss STS Show forest plot | 1 | Risk Ratio (Fixed, 95% CI) | Totals not selected | |
| 1.1 high‐exposed artillery | 1 | Risk Ratio (Fixed, 95% CI) | 0.0 [0.0, 0.0] | |
| Outcome or subgroup title | No. of studies | No. of participants | Statistical method | Effect size |
| 1 Hearing loss change at 4 kHz/STS (5‐year follow‐up) Show forest plot | 4 | 2231 | effect size (Fixed, 95% CI) | 0.05 [‐0.05, 0.16] |
| 1.1 Pell hearing loss 10 dB | 1 | 628 | effect size (Fixed, 95% CI) | ‐0.1 [‐0.27, 0.07] |
| 1.2 Pell hearing loss 15 to 35 dB | 1 | 559 | effect size (Fixed, 95% CI) | 0.09 [‐0.11, 0.29] |
| 1.3 Pell hearing loss 40 dB | 1 | 385 | effect size (Fixed, 95% CI) | 0.18 [‐0.06, 0.42] |
| 1.4 Lee‐Feldstein | 1 | 474 | effect size (Fixed, 95% CI) | 0.29 [‐0.07, 0.66] |
| 1.5 Hager | 1 | 43 | effect size (Fixed, 95% CI) | ‐0.1 [‐0.72, 0.52] |
| 1.6 Gosztonyi | 1 | 142 | effect size (Fixed, 95% CI) | 0.15 [‐0.18, 0.48] |
| 2 Hazard of STS Show forest plot | 1 | Hazard Ratio (Random, 95% CI) | 3.78 [2.69, 5.31] | |
| 2.1 80 to 85 dB‐years | 1 | Hazard Ratio (Random, 95% CI) | 2.10 [1.26, 3.49] | |
| 2.2 85 to 90 dB‐years | 1 | Hazard Ratio (Random, 95% CI) | 3.00 [2.27, 3.96] | |
| 2.3 90 to 95 dB‐years | 1 | Hazard Ratio (Random, 95% CI) | 3.30 [2.76, 3.94] | |
| 2.4 95 to 100 dB‐years | 1 | Hazard Ratio (Random, 95% CI) | 4.60 [3.86, 5.48] | |
| 2.5 More than 100 dB‐years | 1 | Hazard Ratio (Random, 95% CI) | 6.60 [5.56, 7.84] | |
| Outcome or subgroup title | No. of studies | No. of participants | Statistical method | Effect size |
| 1 Hearing loss change at 4kHz / STS Show forest plot | 3 | effect size (Fixed, 95% CI) | 0.17 [‐0.06, 0.40] | |
| 1.1 Lee‐Feldstein | 1 | effect size (Fixed, 95% CI) | 0.29 [‐0.07, 0.66] | |
| 1.2 Hager | 1 | effect size (Fixed, 95% CI) | ‐0.1 [‐0.72, 0.52] | |
| 1.3 Gosztonyi | 1 | effect size (Fixed, 95% CI) | 0.15 [‐0.18, 0.48] | |