Steroidal contraceptives: effect on carbohydrate metabolism in women without diabetes mellitus
References
References to studies included in this review
References to studies excluded from this review
References to ongoing studies
Additional references
Characteristics of studies
Characteristics of included studies [ordered by study ID]
Jump to:
| Methods | "Randomly allocated" study conducted in Oxford, UK. | |
| Participants | 43 healthy women, 16 to 30 years, attending family planning clinic and requesting oral contraceptives (OC). | |
| Interventions | Two triphasics: gestodene 50‐70‐100 µg + ethinyl estradiol (EE) 30‐40‐30 µg (N=22) versus levonorgestrel 50‐75‐125 µg + EE 30‐40‐30 µg (N=21); 6 treatment cycles | |
| Outcomes | Fasting plasma glucose, glycosylated hemoglobin | |
| Notes | No information on method for randomization or blinding. | |
| Risk of bias | ||
| Bias | Authors' judgement | Support for judgement |
| Allocation concealment? | Unclear risk | No information |
| Methods | Randomized trial; "single‐blind" (unspecified); stratified according to prior OC use | |
| Participants | 51 women, 17 to 41 years, requesting OC. New OC users had not used an OC or hormone therapy for 3 months; switchers were changing from low‐dose combined OC. | |
| Interventions | Progestin‐only pills: norethisterone 350 µg (N=23) versus levonorgestrel 30 µg (N=23); 6 treatment cycles. | |
| Outcomes | Plasma glucose and glycosylated hemoglobin | |
| Notes | No information on method for randomization. No mention of ethical committee approval or informed consent. | |
| Risk of bias | ||
| Bias | Authors' judgement | Support for judgement |
| Allocation concealment? | Unclear risk | No information |
| Methods | "Allocated at random"; conducted in France. | |
| Participants | 58 healthy women. Inclusion criteria: regularly menstruating, at least 3 months postpartum or postabortion, not lactating, and no steroid treatment in past 3 months. | |
| Interventions | Desogestrel 150 µg + EE 30 µg (N=25) versus desogestrel 150 µg + EE 20 µg (N=33); 6 treatment cycles | |
| Outcomes | Fasting blood glucose and insulin | |
| Notes | No information on method for randomization or blinding. | |
| Risk of bias | ||
| Bias | Authors' judgement | Support for judgement |
| Allocation concealment? | Unclear risk | No information |
| Methods | "Randomized" study conducted in Italy. | |
| Participants | 60 healthy women. Inclusion criteria: 18 to 35 years; at least 12 weeks post‐pregnancy; no diabetes, liver disease or thromboembolic disorder; within 20% ideal body weight; regularly menstruating. | |
| Interventions | Norethisterone enanthate 50 mg + estradiol valerate 5 mg (intramuscular every 30 days) (N=30) versus norethisterone 500‐750‐1000 µg + EE 35 µg (OC) (N=30); 6 treatment cycles. | |
| Outcomes | Fasting glucose and insulin; glucose rate of disappearance (euglycemic glucose clamp test) | |
| Notes | No information on method for randomization or on blinding. | |
| Risk of bias | ||
| Bias | Authors' judgement | Support for judgement |
| Allocation concealment? | Unclear risk | No information |
| Methods | Open‐label "randomized" study in Singapore. Sample size was based on WHO recommendations for metabolic studies (40 per group) | |
| Participants | 80 women. Inclusion criteria: 18 to 40 years, sexually active and of childbearing potential, normal menstrual cycles with mean length 24 to 35 days and intra‐individual variation +/‐3 days, good physical and mental health, and no contraindications to contraceptive use. | |
| Interventions | Etonogestrel implant (N=40) versus levonorgestrel implant (N=40) for 24 treatment cycles | |
| Outcomes | Fasting glucose, insulin, and glycosylated hemoglobin; incremental AUC for glucose and insulin during OGTT, 2‐hour response for glucose and insulin. | |
| Notes | No information on method for randomization. No mention of ethical committee approval or informed consent. | |
| Risk of bias | ||
| Bias | Authors' judgement | Support for judgement |
| Allocation concealment? | Unclear risk | No information |
| Methods | "Randomly allocated"; study conducted in Witwatersrand, South Africa. | |
| Participants | Women "matched for age and parity" (unspecified why or how), proven fertility, attending family planning clinics. | |
| Interventions | Levonorgestrel 150 µg + EE 30 µg (N=28) versus biphasic levonorgestrel 50‐125 µg + EE 50 µg (N=26); study duration of 1 year. | |
| Outcomes | Blood glucose ("random") | |
| Notes | No information on method of randomization or blinding. No mention of ethical committee approval or informed consent. | |
| Risk of bias | ||
| Bias | Authors' judgement | Support for judgement |
| Allocation concealment? | Unclear risk | No information |
| Methods | Open‐label, randomized trial conducted in the US. Assignment with computer‐generated randomization code. | |
| Participants | 157 healthy women, 18 to 35 years, within 20% of ideal body weight; menstrual cycles normal (25 to 32 days) and regular (+/‐ 2 days) ; no contraindications to OC use, no injectable or OC in past 3 months. | |
| Interventions | Levonorgestrel 50‐75‐125 µg + EE 30‐40‐30 µg (N=51) versus norethindrone 500‐750‐1000 µg + EE 35 µg (N=50) versus norethindrone 500‐1000‐500 µg + EE 35 µg (N=56); 6 treatment cycles. | |
| Outcomes | AUC for glucose and insulin, plasma glucose and insulin concentration during OGTT. | |
| Notes | Losses: 27/157 = 17%. | |
| Risk of bias | ||
| Bias | Authors' judgement | Support for judgement |
| Allocation concealment? | Unclear risk | No information |
| Methods | Randomized trial in Italy; randomization following a "computer‐generated list." Sample size estimate based on detecting significant change in glucose test results. | |
| Participants | 28 healthy women, 18 to 35 years old. Inclusion criteria: BMI < 25 kg/m2; normal menses, no OC or medicine that could affect glucose or lipid metabolism in past 12 months. | |
| Interventions | Desogestrel 150 µg plus EE 20 µg versus chlormadinone acetate 2 mg plus EE 30 µg; duration 6 months | |
| Outcomes | After 'frequently sampled intravenous glucose tolerance test': AUC for glucose, insulin, and C‐peptide | |
| Notes | No mention of blinding except for the data analysis. | |
| Risk of bias | ||
| Bias | Authors' judgement | Support for judgement |
| Allocation concealment? | Unclear risk | "The list was concealed" and an independent physician did the allocation |
| Methods | Randomized trial in Italy; randomization following a "computer‐generated list." Sample size estimate based on detecting significant change in glucose test results. | |
| Participants | 36 healthy women, 18 to 35 years old. Inclusion criteria: BMI = 20 to 25 kg/m2; normal menses, no OC or medicine that could affect glucose or lipid metabolism in past 6 months. | |
| Interventions | Desogestrel 150 µg plus EE 30 µg (high EE) versus desogestrel 150 µg plus EE 20 µg (low EE) versus vaginal ring (etonogestrel 120 µg plus EE 15 µg); duration 6 months | |
| Outcomes | After 'frequently sampled intravenous glucose tolerance test': AUC for glucose, insulin, and C‐peptide. Data for the 2 COC groups were not shown separately unless they differed or were relevant. | |
| Notes | No mention of blinding except for the data analysis. | |
| Risk of bias | ||
| Bias | Authors' judgement | Support for judgement |
| Allocation concealment? | Unclear risk | "The list was concealed" and an independent physician did the allocation |
| Methods | Open‐label, randomized trial in the UK. According to the co‐author, a computer‐generated list was used for randomization. Block size of 4 for either ring or OC. | |
| Participants | 85 women, 18 to 40 years, at risk of pregnancy and requesting contraception. | |
| Interventions | Vaginal ring releasing etonogestrel 120 µg + EE 15 µg daily (N=44) versus OC with levonorgestrel 150 µg + EE 30 µg (N=41); 6 treatment cycles. | |
| Outcomes | AUC during OGTT for glucose and insulin, incremental AUC for glucose and insulin, fasting glycosylated hemoglobin. | |
| Notes | Corresponding author (Dieben) provided design information and data (means, SD, and Ns for carbohydrate measures). | |
| Risk of bias | ||
| Bias | Authors' judgement | Support for judgement |
| Allocation concealment? | High risk | According to author, none used. |
| Methods | Randomized trial conducted in Louisiana (USA); randomization with a "computer‐generated program." Modified intent‐to‐treat analysis used (at least one treatment dose). Post hoc power analysis. | |
| Participants | 65 healthy women, 18 to 40 years old, seeking contraception or contraceptive steroids for cycle control. All were nonsmokers or had not smoked for 3 months. Exclusion criteria: contraindication to hormonal contraceptive, used drugs that interfered with carbohydrate metabolism, used injectable contraceptive in past 6 months or hormonal IUD or OC in past 2 months; had condition relevant to ring use, such as cervicitis or vaginitis; non‐normal Papanicolaou smear; prolapse of cervix, cystocele, or rectocele. | |
| Interventions | Vaginal ring (releasing etonogestrel 120 µg plus EE 15 µg daily) versus OC containing levonorgestrel 100 µg plus 20 µg; duration 5 cycles | |
| Outcomes | Insulin sensitivity after OGTT | |
| Notes | No mention of blinding. | |
| Risk of bias | ||
| Bias | Authors' judgement | Support for judgement |
| Allocation concealment? | Unclear risk | No information |
| Methods | Open‐label, randomized trial in The Netherlands. | |
| Participants | 60 healthy women, 18 to 35 years. Inclusion criteria: desiring contraception for at least 13 cycles, new OC users or switchers with at least 2 OC‐free cycles before study. | |
| Interventions | Levonorgestrel 100 µg + EE 20 µg (N=30) versus levonorgestrel 150 µg + EE 30 µg (N=30); 13 treatment cycles. | |
| Outcomes | Plasma glucose and insulin ‐ fasting and AUC during OGTT; fasting C‐peptide. Medians and ranges were presented in report; no data were available for analysis in this review. | |
| Notes | No information on method of randomization | |
| Risk of bias | ||
| Bias | Authors' judgement | Support for judgement |
| Allocation concealment? | Unclear risk | No information |
| Methods | According to the author, randomization was conducted with paper slips (20 DMPA and 20 NET‐EN) and the lab assessments were blinded. Study was conducted in Egypt. | |
| Participants | 40 multiparous women, attending family planning clinic. Inclusion criteria: willingness and fitness for injectables, having at least 2 living children, not lactating, and no hormonal contraception in past 6 months. | |
| Interventions | Injectables: DMPA 150 mg every 90 (+/‐ 5) days for 12 months versus norethisterone enanthate 200 mg every 60 (+/‐ 5) days for 6 months, then every 84 (+/‐) 5 days for another 6 months. Study duration was 12 months. | |
| Outcomes | Fasting serum insulin; during OGTT, serum glucose and 2‐hour serum insulin. | |
| Notes | Author provided information on study design and additional data. | |
| Risk of bias | ||
| Bias | Authors' judgement | Support for judgement |
| Allocation concealment? | Low risk | According to the author, serially‐numbered, sealed and mixed envelopes were used to conceal allocation until after assignment. Did not specify if the envelopes were opaque. |
| Methods | Open‐label randomized trial at one center in Belgium. According to correspondence with the author, randomization was conducted with a central telephone system, and randomization was done with a permuted block technique with block size of four. | |
| Participants | 60 women. Inclusion criteria: wanted contraception for at least 13 cycles, new OC users or switchers with at least 2 OC‐free cycles before study. Exclusion criteria: contraindications to OC use, no parenteral depot contraceptive in past 6 months, co‐existing diseases such as diabetes or endocrinopathies, use of medications that interfere with lipid or carbohydrate metabolism, diagnostically unclassified genital bleeding, history of migraine with menstruation. | |
| Interventions | Drospirenone 3 mg + EE 30 µg (N=30) versus desogestrel 150 µg + EE 30 µg (N=30); 13 treatment cycles. | |
| Outcomes | Area under the curve for glucose and insulin during OGTT. | |
| Notes | Losses included 6 women who did not start study medication (3 each group) and 4 who discontinued early (2 each group) (10/60 = 17%). Per protocol analysis included the remaining 50. | |
| Risk of bias | ||
| Bias | Authors' judgement | Support for judgement |
| Allocation concealment? | Low risk | According to the author, participant identifiers were recorded before allocation was revealed. |
| Methods | "Randomly assigned"; conducted in the US. | |
| Participants | Women who responded to newspaper advertisements. Inclusion criteria: 18 to 35 years, at least 90 days postpartum, within 20% of average weight for height and age, regular menses, no change in diet or exercise pattern for study duration, no contraindications to OCs, limited alcohol and cigarette use, no hormone use in 30 days, and no other medications within 7 days of study. | |
| Interventions | Levonorgestrel 50‐75‐125 µg + EE 30‐40‐30 µg (N=27) versus norethindrone 500‐750‐1000 µg + EE 35 µg (N=30); study duration was 12 months. | |
| Outcomes | During OGTT, plasma glucose and insulin. | |
| Notes | No information on method of randomization or blinding. Corresponding author was unable to provide design information as records were no longer available. | |
| Risk of bias | ||
| Bias | Authors' judgement | Support for judgement |
| Allocation concealment? | Unclear risk | No information |
| Methods | "Randomly allocated"; conducted in Belgium. | |
| Participants | 40 healthy women, 20 to 30 years, mostly medical students and nurses. Inclusion criteria: no OC use in past 8 weeks, no family history of diabetes, within 15% of ideal body weight, nonsmoker, no contraindications to OC use. | |
| Interventions | Desogestrel 150 µg + EE 30 µg (N=21) versus cyproterone acetate 2000 µg + EE 35 µg (N=19); study duration 12 months. | |
| Outcomes | Changes in fasting values and in AUC (during OGTT) for blood glucose, plasma insulin, and plasma C‐peptide. Change data were presented without any measure of variance, so no data were analyzed in this review. | |
| Notes | No information on method of randomization or blinding. | |
| Risk of bias | ||
| Bias | Authors' judgement | Support for judgement |
| Allocation concealment? | Unclear risk | No information |
| Methods | Double‐blind, randomized, multi‐center trial in Finland. | |
| Participants | 88 healthy women, 18 to 45 years, sexually active and of child‐bearing potential. Inclusion criteria: normal menstrual cycles of 24 to 35 days (+/‐ 3 days), good mental and physical health, and body weight 80‐130% of ideal. | |
| Interventions | Progestin‐only pills: desogestrel 75 µg (N=46) versus levonorgestrel 30 µg (N=42); 7 treatment cycles. | |
| Outcomes | During OGTT, AUC for glucose and insulin; fasting glycosylated hemoglobin. Medians and ranges were presented in report; no data were available for analysis in this review. | |
| Notes | No information on method for randomization. Corresponding author was not able to locate any more information on design or data. | |
| Risk of bias | ||
| Bias | Authors' judgement | Support for judgement |
| Allocation concealment? | Unclear risk | No information |
| Methods | Open‐label randomized trial at one site in The Netherlands. Use of computer‐generated randomization code. Recruited 30 women per group in order to have 20 per group for per protocol analysis (assumed 30% drop outs). | |
| Participants | 60 healthy women, 18 to 35 years, including smokers up to age 30 years, requesting OC. Exclusion criteria: pregnancy or lactation, contraindications to steroidal contraceptives, BMI > 30 kg/m2; uncontrolled thyroid disorders, clinically significant findings that might worsen with hormonal therapy, depression in past year, vascular disease (or its risks), diabetes or impaired glucose tolerance, sickle cell anemia, disturbance of lipid metabolism; use of medication that affects metabolism or pharmokinetics of OCs, such hydantoins, barbiturates, rifampicin, or St John's Wort; use of OC in past 2 cycles, sex hormones in past 3 cycles, injectable or implant in past 6 months; uncontrolled hypertension; and malignant or premalignant tumors. | |
| Interventions | Drospirenone 3 mg + EE 20 µg (N=30) versus desogestrel 150 µg + EE 20 µg (N=30); 7 treatment cycles. | |
| Outcomes | Change in fasting insulin, AUC for glucose and C‐peptide during OGTT. | |
| Notes | Losses: 7 discontinued early and were excluded from the per protocol analysis (7/60 = 12%). | |
| Risk of bias | ||
| Bias | Authors' judgement | Support for judgement |
| Allocation concealment? | Unclear risk | No information |
| Methods | "Randomly assigned"; conducted in the US. | |
| Participants | Healthy women. Inclusion criteria: 21 to 35 years, serum LDL‐cholesterol < 160 mg/dl and triglycerides < 250 mg/dl, regular menstrual cycle of 25 to 35 days. | |
| Interventions | Desogestrel 50‐100‐150 µg + EE 35‐30‐30 µg (N=33) versus levonorgestrel 50‐75‐125 µg + EE 30‐40‐30 µg (N=34); 9 treatment cycles | |
| Outcomes | Glucose and insulin: change from fasting to one hour after ingesting 400 kcal drink (glucose, protein, fat). Data on carbohydrate measures were provided for cycle 6. Means for fasting values were presented without any measure of variance. | |
| Notes | No information on method of randomization or blinding. | |
| Risk of bias | ||
| Bias | Authors' judgement | Support for judgement |
| Allocation concealment? | Unclear risk | No information |
| Methods | "Randomly assigned"; crossover design. | |
| Participants | 22 healthy women, 24 to 35 years. Inclusion criteria: no hormonal contraceptives for past 3 months, not exposed to any interfering drug therapy, recent ovulation (serum progesterone > 3 ng/ml). | |
| Interventions | Norgestrel 50‐75‐125 µg + EE 30‐40‐30 µg versus desogestrel 150 µg + EE 30 µg (N=11); 3 treatment cycles followed by washout of 3 months then crossover for 3 treatment cycles. | |
| Outcomes | Serum glucose ‐ fasting and during OGTT. Report mentioned results for glucose, but did not provide any data for analysis in this review. | |
| Notes | No information on method of randomization or blinding. Author was not able to provide additional information, due to the time since publication. Researchers were from Germany; study site not specified. | |
| Risk of bias | ||
| Bias | Authors' judgement | Support for judgement |
| Allocation concealment? | Unclear risk | No information |
| Methods | According to correspondence with a co‐author (Gaspard): randomization was conducted with a central telephone system and used a permuted block technique with block size of four; study was not blinded. | |
| Participants | 44 healthy women, mean age 23 years. No other inclusion or exclusion criteria were reported. | |
| Interventions | Levonorgestrel 50‐75‐125 µg + EE 30‐40‐30 µg (N=24) versus gestodene 50‐70‐100 µg + EE 30‐40‐30 µg (N=20); 6 treatment cycles. Chosen at random: 14 from levonorgestrel group and 13 from gestodene group; 12‐month study. | |
| Outcomes | Change in AUC for glucose and insulin at 6 and 12 months. Report did not have standard deviations for means, so no data could be analyzed for this review. | |
| Notes | No mention of ethical committee approval or informed consent. Researchers were from Belgium; study site not specified. | |
| Risk of bias | ||
| Bias | Authors' judgement | Support for judgement |
| Allocation concealment? | Low risk | According to an author, central telephone system used; participant identifiers were recorded before allocation was revealed. |
| Methods | "Randomly assigned"; study conducted in Finland. | |
| Participants | Twenty healthy women, motivated for OC. Inclusion criteria: regular menstrual period of approximately 28 days, no abnormal carbohydrate metabolism, body weight <= 115% ideal, and no pregnancy or hormonal therapy in past 3 months. | |
| Interventions | Levonorgestrel 150 µg + EE 30 µg (N=10) versus desogestrel 150 µg + EE 30 µg (N=10); study duration was two years. | |
| Outcomes | Fasting blood glucose | |
| Notes | No information on method of randomization or blinding. No mention of ethical committee approval or informed consent. | |
| Risk of bias | ||
| Bias | Authors' judgement | Support for judgement |
| Allocation concealment? | Unclear risk | No information |
| Methods | Randomized, double‐blind trial in Singapore. | |
| Participants | 58 healthy women were recruited from outpatient and fertility control clinics. Inclusion criteria: 18 to 34 years without diabetes, liver disease, or thromboembolic disorders, at least 70 days postpartum. | |
| Interventions | Norethisterone 1 mg + EE 35 µg (N=29) versus levonorgestrel 150 µg + EE 30 µg (N=29); 12‐month duration of study. | |
| Outcomes | Serum glucose: fasting and 2 hours after glucose loading | |
| Notes | No information on method of randomization. No mention of ethical committee approval or informed consent. | |
| Risk of bias | ||
| Bias | Authors' judgement | Support for judgement |
| Allocation concealment? | Unclear risk | No information |
| Methods | Open‐label, randomized trial in one center | |
| Participants | 36 lean, healthy women, 19 to 29 years. No other inclusion or exclusion criteria were reported. | |
| Interventions | Desogestrel 150 µg + EE 20 µg versus gestodene 75 µg + EE 20 µg; 13 treatment cycles | |
| Outcomes | Fasting values as well as AUC during OGTT for glucose, insulin, and C‐peptide | |
| Notes | No information on method of randomization. Researchers were from Switzerland and Belgium; study site not specified. Numbers randomized to each group were not clearly stated, but appear to have been 18 each. Sample sizes were specified for the analysis. | |
| Risk of bias | ||
| Bias | Authors' judgement | Support for judgement |
| Allocation concealment? | Unclear risk | No information |
| Methods | According to correspondence with a co‐author (Gaspard): randomization was conducted with a central telephone system and used a permuted block technique with block size of four; study was not blinded. | |
| Participants | 40 healthy women with no family history of diabetes, within 15% ideal body weight, and no OC use in past 8 weeks. | |
| Interventions | Levonorgestrel 50‐75‐125 µg + EE 30‐40‐30 µg (N=13) versus desogestrel 125 µg + EE 50 µg (N=13) versus desogestrel 150 µg + EE 30 µg (N=14); 6 treatment months. | |
| Outcomes | During OGTT, AUC for blood glucose and insulin (units not specified). | |
| Notes | Researchers were from Belgium; study site not specified. | |
| Risk of bias | ||
| Bias | Authors' judgement | Support for judgement |
| Allocation concealment? | Low risk | According to an author, central telephone system used; participant identifiers were recorded before allocation was revealed. |
| Methods | "Randomly divided" | |
| Participants | 57 healthy women. Inclusion criteria: BMI < 25 kg/m2, no OC or other hormonal therapy in past 8 weeks, no family history of diabetes or hyperlipoproteinemia. | |
| Interventions | Desogestrel 150 µg + EE 20 µg (N=19) versus cyproterone acetate 2000 µg + EE 35 µg (N=20) versus gestodene 50‐70‐100 µg + EE 30‐40‐30 µg (N=18); 6‐month duration of study | |
| Outcomes | Glucose and insulin, fasting and AUC during OGTT. Data were shown in graphs; no numbers were reported for analyzing in this review. | |
| Notes | No information on method of randomization or blinding. No mention of ethical committee approval or informed consent. Researchers were from Italy; study site not specified. | |
| Risk of bias | ||
| Bias | Authors' judgement | Support for judgement |
| Allocation concealment? | Unclear risk | No information |
| Methods | "Randomly divided" | |
| Participants | 300 healthy women of childbearing age. Inclusion criteria: nonsmoking; no therapy (presumably drug); no history of cardiovascular disease, hypertension, diabetes mellitus, hyperlipidemia, hepatic or renal dysfunction, thyroid disease or thromboembolic complications. | |
| Interventions | OC norgestrel 150 µg + EE 30 µg versus medroxyprogesterone acetate (150 mg intramuscularly every 3 months) versus levonorgestrel implant (6 at 36 mg each); 6‐month study duration. | |
| Outcomes | Fasting blood glucose; no analysis could be done without the sample sizes for the comparison groups. | |
| Notes | No information on method of randomization or blinding. Unlikely to have been blinded due to differing interventions. Researchers were from Iran; study site not specified. Report did not include the sample sizes for each group nor any information on losses. | |
| Risk of bias | ||
| Bias | Authors' judgement | Support for judgement |
| Allocation concealment? | Unclear risk | No information |
| Methods | Double‐blind, randomized trial. All persons involved in the trial, including the laboratory personnel, were unaware of group assignment. According to correspondence with a co‐author, the randomization was done by permuted blocks. Block size was 20 with 5:5:5:5 for the 4 treatments. | |
| Participants | 80 healthy women, 18 to 34 years. Inclusion criteria: if smoking (<= 10 cigarettes/day), then younger than 30 years; no OC use for past month. | |
| Interventions | Drospirenone 3 mg + EE 30 µg versus drospirenone 3 mg + EE 20 µg versus drospirenone 3 mg + EE 15 µg versus levonorgestrel 150 µg + EE 30 µg; 6 treatment cycles. | |
| Outcomes | Serum glucose (AUC) during OGTT. Change from baseline was reported but without any variance data for use in analysis. | |
| Notes | Researchers were from Belgium and Germany; study site not reported. Author forwarded correspondence to study sponsor (co‐author), who provided information on design. | |
| Risk of bias | ||
| Bias | Authors' judgement | Support for judgement |
| Allocation concealment? | Unclear risk | No information |
| Methods | Random‐number table with group allocation pre‐determined. No blinding of treatment due to visibly different interventions. Study was conducted in Finland. | |
| Participants | 31 healthy women requesting contraception. Inclusion criteria: no hormonal injectables or implants in past 6 months, no OC or other hormonal therapy in past month, and no medication. | |
| Interventions | Copper‐releasing IUD (N=10) versus LNG‐IUS (N=10) versus levonorgestrel 30 µg OC (N=11); 3‐month study duration. | |
| Outcomes | Fasting blood glucose and insulin. Results were shown in figures; no data were available for analyzing in this review. | |
| Notes | Losses: 2 women discontinued early and 1 women was excluded from analysis due to high BMI (35 kg/m2) (3/31 = 10%) | |
| Risk of bias | ||
| Bias | Authors' judgement | Support for judgement |
| Allocation concealment? | Unclear risk | According to correspondence with the author, allocation concealment was done with sealed, opaque envelopes. Did not specify if the envelopes were sequentially numbered. Envelope was opened after assessing volunteer for inclusion criteria. |
| Methods | Randomized trial. | |
| Participants | 34 healthy women. Inclusion criteria: no predisposition to diabetes or cardiovascular disease, normotensive (BP < 140/90), within 10% of ideal body weight, at least 6 months postpartum or postabortion, not lactating, regular menstrual cycles and no hormonal therapy in past 4 weeks. | |
| Interventions | Desogestrel 150 µg + EE 20 µg (N=15) versus gestodene 75 µg + EE 30 µg (N=19); 12 months of treatment. | |
| Outcomes | Fasting glucose and insulin; medians and ranges reported; no means available for analyzing in this review. During OGTT, AUC for glucose and insulin; results were presented in graphs with no data for analysis. | |
| Notes | No information on method of randomization or blinding. | |
| Risk of bias | ||
| Bias | Authors' judgement | Support for judgement |
| Allocation concealment? | Unclear risk | No information |
| Methods | Randomized trial; study conducted in Copenhagen, Denmark. | |
| Participants | 42 women. Inclusion criteria: no family history of diabetes, no thromboembolic or hepatic disease, regular menstrual cycles; not lactating or pregnant or had sex steroid therapy in past 3 months. | |
| Interventions | Norgestimate 180‐215‐250 µg + EE 35 µg (N=21) versus gestodene 50‐70‐100 µg + EE 30‐40‐30 µg (N=21); 6 months of treatment. | |
| Outcomes | Fasting glucose, insulin, and C‐peptide; during OGTT, AUC for glucose and insulin. Medians and ranges reported; no means available for analyzing in this review. | |
| Notes | No information on method of randomization or blinding. | |
| Risk of bias | ||
| Bias | Authors' judgement | Support for judgement |
| Allocation concealment? | Unclear risk | No information |
| Methods | According to the author: Randomization was accomplished with computer‐generated random numbers. Physician and lab analyst were blinded; nurse who allocated the pills and the subjects knew the treatment group. Drug companies would not repackage the pills for blinding. | |
| Participants | 105 Chinese women of proven fertility, 18 to 34 years, seeking OC. Inclusion criteria: regular menstrual cycles (28 +/‐ 4 days), no hormonal contraception in past 6 months. | |
| Interventions | Levonorgestrel 50‐75‐125 µg + EE 30‐40‐30 µg (N=39) versus desogestrel 150 µg + EE 30 µg (N=32) versus levonorgestrel 150 µg + EE 30 µg (N=34); study duration of 1 year. | |
| Outcomes | Blood glucose ‐ fasting and during OGTT (30, 60, 90, 120 minutes). | |
| Notes | Researchers were from Singapore; study site not specified. | |
| Risk of bias | ||
| Bias | Authors' judgement | Support for judgement |
| Allocation concealment? | Unclear risk | No information |
| Methods | "Randomly organized control trial" | |
| Participants | 46 healthy women, 18 to 30 years, who wanted hormonal contraception (Heidelberg, Germany). Inclusion criteria: body weight +/‐ 20% ideal, regular cycles (26 to 31 days), no pregnancy in past 6 months, no current hormonal contraceptives, no contraindications for hormonal contraceptives. | |
| Interventions | Levonorgestrel 150 µg + EE 30 µg (N=23) versus gestodene 75 µg + EE 30 µg (N=23); study duration was planned for 24 cycles, but interim data were reported for 6 cycles. | |
| Outcomes | Serum glucose and insulin during OGTT. Results for carbohydrate measures were presented in figures; no data were available for analysis in this review. | |
| Notes | No information on method of randomization or blinding. No mention of ethical committee approval or informed consent. | |
| Risk of bias | ||
| Bias | Authors' judgement | Support for judgement |
| Allocation concealment? | Unclear risk | No information |
| Methods | Open‐label randomized study | |
| Participants | 38 healthy, regularly menstruating women, 19 to 35 years, parity 0 to 2 (Budapest, Hungary). Inclusion criteria: normotensive; no history of cardiovascular disease, diabetes, or condition affecting hemostatic balance or lipid levels; no pregnancy or hormonal therapy in past 3 months, no drug therapy or self‐medication during study. | |
| Interventions | Desogestrel 150 µg + EE 50 µg (N=17) versus triphasic levonorgestrel 50‐75‐125 µg + EE 30‐40‐30 µg (N=21); 3 treatment cycles. | |
| Outcomes | Glucose area under the curve after OGTT. Means were reported but without any variance data for use in analysis. | |
| Notes | No information on method of randomization. No mention of ethical committee approval or informed consent. | |
| Risk of bias | ||
| Bias | Authors' judgement | Support for judgement |
| Allocation concealment? | Unclear risk | No information |
| Methods | Randomly allocated | |
| Participants | 53 women, 18 to 45 years. Inclusion criteria: no pathological findings from gynecological assessment, no contraindications to OCs. | |
| Interventions | Desogestrel 150 µg + EE 20 µg (N=13) versus gestodene 75 µg + EE 20 µg (N=15) versus desogestrel 150 µg + EE 30 µg (N=11) versus gestodene 75 µg + EE 30 µg (N=14); 6 treatment cycles. | |
| Outcomes | Fasting plasma glucose and insulin | |
| Notes | No information on method of randomization or blinding. Researchers were from Poland; study site not specified. | |
| Risk of bias | ||
| Bias | Authors' judgement | Support for judgement |
| Allocation concealment? | Unclear risk | No information |
| Methods | Open‐label, randomized study at 11 sites in the US. Treatment allocation 1:1, stratified by site. A priori sample size determination. | |
| Participants | 387 women. Inclusion criteria: 18 to 35 years for smokers (< 15 cigarettes/day), no upper age for nonsmokers, regular menstrual cycles (25 to 31 days) for past 3 months, no OC in past 3 months. | |
| Interventions | Monophasic levonorgestrel 100 µg + EE 20 µg (N=192) versus triphasic norethindrone 500‐750‐1000 µg + EE 35 µg (N=195); study duration 4 cycles. | |
| Outcomes | Change from baseline in blood glucose | |
| Notes | Report notes that assignment was from 1 to 4 cycles. | |
| Risk of bias | ||
| Bias | Authors' judgement | Support for judgement |
| Allocation concealment? | Low risk | "sequentially numbered, sealed envelopes." Did not specify if envelopes were opaque. |
| Methods | Double‐blind randomized trial; 7 WHO Collaborating Centers (Hungary, Yugoslavia, Egypt, India (2), Singapore, Cuba) | |
| Participants | 1085 women recruited from family planning clinics. Inclusion criteria: 18 to 39 years, parous, apparently healthy, not breastfeeding, no hormonal contraceptive use in past 3 months, no injectable or implant use, no contraindications to OCs. | |
| Interventions | Norethisterone 1000 µg + EE 35 µg versus levonorgestrel 150 µg + EE 30 µg; 12‐month duration of study. | |
| Outcomes | Glucose ‐ fasting and 2 hours after glucose load | |
| Notes | No information on method of randomization. | |
| Risk of bias | ||
| Bias | Authors' judgement | Support for judgement |
| Allocation concealment? | Unclear risk | No information |
| Methods | Open‐label, randomized trial at one center in Denmark | |
| Participants | 70 healthy women, 18 to 35 years. Inclusion criteria: desiring contraception for at least 13 cycles, new OC users or switchers with at least 2 OC‐free cycles before study. | |
| Interventions | Levonorgestrel 100 µg + EE 20 µg (N=22) versus levonorgestrel 150 µg + EE 30 µg (N=27); 13 treatment cycles. | |
| Outcomes | Plasma glucose and insulin ‐ fasting and AUC during OGTT; fasting C‐peptide. Medians and ranges presented in report; no data available for analysis in this review. | |
| Notes | No information on method of randomization. | |
| Risk of bias | ||
| Bias | Authors' judgement | Support for judgement |
| Allocation concealment? | Unclear risk | No information |
| Methods | Randomized cross‐over design; study conducted in Shanghai, China | |
| Participants | 12 healthy women recruited from family planning clinic. Inclusion criteria: not pregnant in past 6 months, no steroidal contraceptives in past 3 months, regular menstrual cycles in past 6 months (25 to 36 days), and menses of 3 to 7 days, no other drugs taken during study. | |
| Interventions | Desogestrel 150 µg + EE 30 µg versus desogestrel 150 µg + EE 20 µg versus levonorgestrel 150 µg + EE 30 µg. Each OC was taken for 3 months followed by an OC‐free month when barrier methods were used before each changeover. | |
| Outcomes | Glucose and insulin ‐ fasting; AUC (total and incremental) during OGTT. Change in fasting glycosylated hemoglobin. | |
| Notes | No information on method of randomization or blinding. | |
| Risk of bias | ||
| Bias | Authors' judgement | Support for judgement |
| Allocation concealment? | Unclear risk | No information |
| Methods | Open‐label, randomized, multicenter trial; intent‐to‐treat analysis include all those assigned to treatment and who took at least one pill. | |
| Participants | 124 women. Inclusion criteria: 18 to 40 years, regular menstrual cycles (25 to 31 days), BMI <=28 kg/m2, smoked <= 10 cigarettes/day. | |
| Interventions | Gestodene 60 µg + EE 15 µg (N=62) versus desogestrel 150 µg + EE 20 µg (N=62); 6 treatment cycles. | |
| Outcomes | Fasting glucose, insulin, and C‐peptide; AUC for glucose, insulin, and C‐peptide during OGTT. | |
| Notes | No information on method of randomization or allocation concealment. Study sites not specified. | |
| Risk of bias | ||
| Bias | Authors' judgement | Support for judgement |
| Allocation concealment? | Unclear risk | B ‐ Unclear |
| Methods | "Randomly divided" | |
| Participants | 70 healthy women. Inclusion criteria: 16 to 40 years, body weight 90% to 120% of normal, general good health, no other medications, regular menstrual cycles (26 to 35 days), no OC in past 3 months, no gestational diabetes or family history of diabetes. | |
| Interventions | 7 OC preparations compared: levonorgestrel 150 µg + EE 30 µg, norethisterone 1000 µg + EE 35 µg, desogestrel 150 µg + EE 30 µg, levonorgestrel 50‐75‐125 µg + EE 30‐40‐30 µg, cyproterone acetate 2000 µg + EE 35 µg, gestodene 50‐70‐100 µg + EE 30‐40‐30 µg, desogestrel 25‐125 µg + EE 40‐30 µg; 6 treatment cycles. | |
| Outcomes | Fasting glucose, insulin, and glycosylated hemoglobin; mean glucose and insulin during OGTT (30, 60, 120, 180 minutes). Means were provided in report without any variance estimates, so no data were analyzed in this review. | |
| Notes | No information on method of randomization or blinding. Researchers were from The Netherlands; study site not specified. | |
| Risk of bias | ||
| Bias | Authors' judgement | Support for judgement |
| Allocation concealment? | Unclear risk | No information |
| Methods | Randomized trial in 4 centers: Hangzhou, Havana, Jakarta, and Shanghai. According to correspondence with an author, randomization was stratified by center; computer‐generated random number sequence; permuted blocks; no blinding. | |
| Participants | Inclusion criteria: 18 to 35 years, at least two regular menstrual cycles since last contraceptive method, not lactating in past 6 months, at least 6 months postpartum or postabortion, and one normal cycle since delivery or abortion. | |
| Interventions | Injectables: norethisterone enanthate 50 mg + estradiol valerate 5 mg (N=184) versus medroxyprogesterone acetate 25 mg + estradiol cypionate 5 mg (N=173); 9 treatment cycles. | |
| Outcomes | Serum glucose ‐ fasting and during OGTT (30‐minute intervals) for all 4 sites combined; change in insulin AUC was presented by site (1 site did not have insulin data) but samples sizes were not available by center. | |
| Notes | Author provided additional information on design via correspondence. | |
| Risk of bias | ||
| Bias | Authors' judgement | Support for judgement |
| Allocation concealment? | High risk | According to an author, none used. |
| Methods | Randomized, trial conducted at 2 sites in Germany; randomization with a "computer‐based randomization program"; single‐blind (investigator). Modified intent‐to‐treat analysis consisted of women with at least one treatment dose and lab measures for at least one treatment cycle. | |
| Participants | 45 healthy nonsmoking women, 18 to 40 years old. Inclusion criteria: no hormonal contraceptive in past cycle, no clinical trial participation in past 3 months, regular menses, sexually active, not pregnant, Broca index <= 130%, normal values for routine lab assessments. Exclusion criteria: alcohol or drug dependence, suicidal tendency, psychiatric illness, epilepsy, severe allergy, chronic disease, IUD use, sterilization, hysterectomy, hepatic disease, pancreatitis, vascular or metabolic disease, certain malignancies, and use of named drug classes including anticoagulants. | |
| Interventions | Chlormadinone acetate (CMA) 2 mg plus EE 30 µg versus desogestrel 150 µg plus EE 15 µg; duration 6 cycles | |
| Outcomes | Blood insulin and glucose after OGTT. Results presented in figures only; insufficient data for analysis in this review. Requested additional data from author. | |
| Notes | No mention of sample size estimation. Losses: none reported. Exclusions: 14% chlormadinone acetate COC and 13% desogestrel COC. | |
| Risk of bias | ||
| Bias | Authors' judgement | Support for judgement |
| Allocation concealment? | Unclear risk | No information |
Interventions were oral contraceptives (OC) unless otherwise specified.
AUC = area under the curve; incremental AUC is adjusted for fasting value
BMI = body mass index
BP = blood pressure
Broca index = weight (kg) as % of height (cm) ‐ 100
DMPA = depot medroxyprogesterone acetate
EE = ethinyl estradiol
IUD = Intrauterine device
IUS = Intrauterine system
OGTT = oral glucose tolerance test
Characteristics of excluded studies [ordered by study ID]
Jump to:
| Study | Reason for exclusion |
| Intervention included insulin‐induced hypoglycemia; glucose measured afterward. | |
| Participants had personal or family history of diabetes. This review excludes studies of women with known diabetes. | |
| Trial did not include any of the measures for carbohydrate metabolism. | |
| Briggs is suspected of scientific fraud (Rossiter 1992). This is an earlier conference report of what was later published as Briggs 1982. | |
| Briggs is suspected of scientific fraud (Rossiter 1992). | |
| Study was not RCT. | |
| Carbohydrate metabolism was studied in a subgroup of 27 volunteers (out of the original 69 who had been randomized). | |
| No mention of random or allocation method. | |
| Report does not mention random assignment. | |
| Study was not RCT. | |
| Study was not randomized, according to correspondence with the author. | |
| Randomized to diet not oral contraceptive. | |
| Intervention was only two months in duration. |
Characteristics of ongoing studies [ordered by study ID]
Jump to:
| Trial name or title | Study evaluating levonorgestrel and ethinyl estradiol in oral contraception |
| Methods | Randomized open‐label trial |
| Participants | 600 women, 18 to 49 years old |
| Interventions | Levonorgestrel 90 µg plus EE 20 µg, continuous 28‐day regimen versus cyclic 21‐day regimen |
| Outcomes | Secondary (selected): carbohydrate metabolism |
| Starting date | Estimated completion Oct 2004 |
| Contact information | Wyeth; no other information |
| Notes | Abstract presented in 2006 did not contain outcome information on carbohydrate metabolism. No full report published. |
| Trial name or title | Oral versus patch hormonal contraceptive effects on metabolism, clotting, inflammatory factors and vascular reactivity |
| Methods | Randomized open‐label trial; crossover assignment |
| Participants | 36 women, 18 to 50 years old |
| Interventions | COC (norgestimate 250 µg plus EE 35 µg); patch (norelgestromin 6 mg plus EE 75 µg) |
| Outcomes | Primary (selected): glucose and insulin; measured at baseline and months 2, 4 and 6 |
| Starting date | Feb 2007; estimated completion Jan 2009 |
| Contact information | PI: Robert H Knopp, MD, University of Washington, Seattle WA |
| Notes |
| Trial name or title | Effects on hemostasis, lipids, carbohydrate metabolism, adrenal & thyroid function of the combined oral contraceptive NOMAC‐E2 compared to a COC containing LNG‐EE |
| Methods | Randomized open‐label trial |
| Participants | 121 women, 18 to 50 years |
| Interventions | 1: Nomegestrol acetate (NOMAC) 250 µg plus estradiol 150 µg, 24 active plus 4 placebo tablets per cycle |
| Outcomes | Primary (selected): carbohydrate metabolism via oral glucose tolerance test (including fasting glucose and insulin) and HbA1C; time frame 6 months |
| Starting date | Sep 2006; completion Jan 2008 for primary outcome |
| Contact information | Responsible party: NV Organon |
| Notes | No publication yet; company representative (T Korver) expects one in 2010. |
| Trial name or title | Obesity, oral contraception, and ovarian suppression |
| Methods | Randomized double‐blind trial |
| Participants | 226 women, 18 to 35 years old; BMI 19 to 24.9 or 30 to 39.9 |
| Interventions | 1: levonorgestrel 150 µg plus EE 30 µg; 2: levonorgestrel 100 µg plus EE 20 µg; duration 3 months |
| Outcomes | Primary: ovarian suppression |
| Starting date | Jul 2006; completion Dec 2008 for primary outcome |
| Contact information | Carolyn Westhoff, MD MSc, Columbia University, New York City |
| Notes |
Data and analyses
| Outcome or subgroup title | No. of studies | No. of participants | Statistical method | Effect size |
| 1 Fasting serum glucose (mg/dl) at cycle 3 Show forest plot | 1 | 24 | Mean Difference (IV, Fixed, 95% CI) | 6.60 [2.41, 10.79] |
| Analysis 1.1  Comparison 1 Desogestrel 150 µg + EE 20 µg versus desogestrel 150 µg + EE 30 µg, Outcome 1 Fasting serum glucose (mg/dl) at cycle 3. | ||||
| 2 Fasting serum insulin (µU/ml) at cycle 3 Show forest plot | 1 | 24 | Mean Difference (IV, Fixed, 95% CI) | ‐0.70 [‐3.33, 1.93] |
| Analysis 1.2  Comparison 1 Desogestrel 150 µg + EE 20 µg versus desogestrel 150 µg + EE 30 µg, Outcome 2 Fasting serum insulin (µU/ml) at cycle 3. | ||||
| 3 Glucose AUC (h x mg/dl) at cycle 3 Show forest plot | 1 | 24 | Mean Difference (IV, Fixed, 95% CI) | 0.0 [‐25.21, 25.21] |
| Analysis 1.3  Comparison 1 Desogestrel 150 µg + EE 20 µg versus desogestrel 150 µg + EE 30 µg, Outcome 3 Glucose AUC (h x mg/dl) at cycle 3. | ||||
| 4 Insulin AUC (h x µU/ml) at cycle 3 Show forest plot | 1 | 24 | Mean Difference (IV, Fixed, 95% CI) | ‐1.30 [‐31.87, 29.27] |
| Analysis 1.4  Comparison 1 Desogestrel 150 µg + EE 20 µg versus desogestrel 150 µg + EE 30 µg, Outcome 4 Insulin AUC (h x µU/ml) at cycle 3. | ||||
| 5 Change in fasting glycosylated hemoglobin (%) at cycle 3 Show forest plot | 1 | 24 | Mean Difference (IV, Fixed, 95% CI) | 0.20 [‐0.45, 0.85] |
| Analysis 1.5  Comparison 1 Desogestrel 150 µg + EE 20 µg versus desogestrel 150 µg + EE 30 µg, Outcome 5 Change in fasting glycosylated hemoglobin (%) at cycle 3. | ||||
| 6 Fasting blood glucose (mmol/L) at cycle 6 Show forest plot | 1 | 49 | Mean Difference (IV, Fixed, 95% CI) | 0.0 [‐0.22, 0.22] |
| Analysis 1.6  Comparison 1 Desogestrel 150 µg + EE 20 µg versus desogestrel 150 µg + EE 30 µg, Outcome 6 Fasting blood glucose (mmol/L) at cycle 6. | ||||
| 7 Fasting blood insulin (µU/ml) at cycle 6 Show forest plot | 1 | 49 | Mean Difference (IV, Fixed, 95% CI) | 0.30 [‐2.41, 3.01] |
| Analysis 1.7 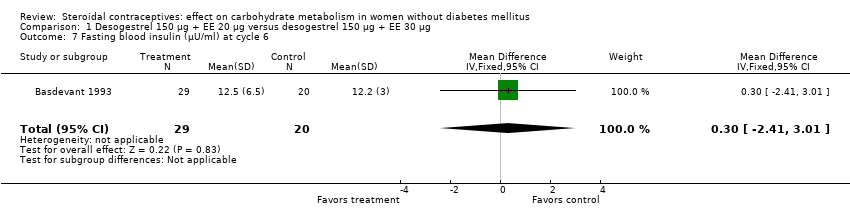 Comparison 1 Desogestrel 150 µg + EE 20 µg versus desogestrel 150 µg + EE 30 µg, Outcome 7 Fasting blood insulin (µU/ml) at cycle 6. | ||||
| 8 Change in insulin AUC (µU/mL) by 6 months Show forest plot | 1 | 20 | Mean Difference (IV, Fixed, 95% CI) | ‐0.69 [‐2.38, 1.00] |
| Analysis 1.8  Comparison 1 Desogestrel 150 µg + EE 20 µg versus desogestrel 150 µg + EE 30 µg, Outcome 8 Change in insulin AUC (µU/mL) by 6 months. | ||||
| Outcome or subgroup title | No. of studies | No. of participants | Statistical method | Effect size |
| 1 Fasting serum glucose (mg/dl) at cycle 3 Show forest plot | 1 | 24 | Mean Difference (IV, Fixed, 95% CI) | ‐1.70 [‐7.81, 4.41] |
| Analysis 2.1  Comparison 2 Desogestrel 150 µg + EE 30 µg versus levonorgestrel 150 µg + EE 30 µg, Outcome 1 Fasting serum glucose (mg/dl) at cycle 3. | ||||
| 2 Fasting serum insulin (µU/ml) at cycle 3 Show forest plot | 1 | 24 | Mean Difference (IV, Fixed, 95% CI) | ‐0.10 [‐2.80, 2.60] |
| Analysis 2.2  Comparison 2 Desogestrel 150 µg + EE 30 µg versus levonorgestrel 150 µg + EE 30 µg, Outcome 2 Fasting serum insulin (µU/ml) at cycle 3. | ||||
| 3 Glucose AUC (h x mg/dl) in cycle 3 Show forest plot | 1 | 24 | Mean Difference (IV, Fixed, 95% CI) | ‐23.40 [‐51.08, 4.28] |
| Analysis 2.3  Comparison 2 Desogestrel 150 µg + EE 30 µg versus levonorgestrel 150 µg + EE 30 µg, Outcome 3 Glucose AUC (h x mg/dl) in cycle 3. | ||||
| 4 Insulin AUC (h x µU/ml) in cycle 3 Show forest plot | 1 | 24 | Mean Difference (IV, Fixed, 95% CI) | ‐18.0 [‐49.41, 13.41] |
| Analysis 2.4  Comparison 2 Desogestrel 150 µg + EE 30 µg versus levonorgestrel 150 µg + EE 30 µg, Outcome 4 Insulin AUC (h x µU/ml) in cycle 3. | ||||
| 5 Change in fasting glycosylated hemoglobin (%) in cycle 3 Show forest plot | 1 | 24 | Mean Difference (IV, Fixed, 95% CI) | ‐0.20 [‐0.85, 0.45] |
| Analysis 2.5 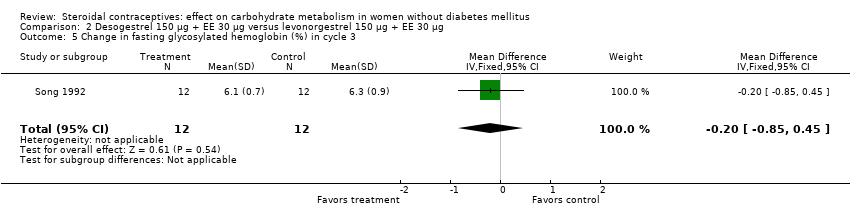 Comparison 2 Desogestrel 150 µg + EE 30 µg versus levonorgestrel 150 µg + EE 30 µg, Outcome 5 Change in fasting glycosylated hemoglobin (%) in cycle 3. | ||||
| 6 Fasting blood glucose (mmol/l) at cycle 6 Show forest plot | 2 | 72 | Mean Difference (IV, Fixed, 95% CI) | 0.20 [0.00, 0.41] |
| Analysis 2.6  Comparison 2 Desogestrel 150 µg + EE 30 µg versus levonorgestrel 150 µg + EE 30 µg, Outcome 6 Fasting blood glucose (mmol/l) at cycle 6. | ||||
| 7 Fasting blood glucose (mmol/l) at cycle 12 Show forest plot | 2 | 62 | Mean Difference (IV, Fixed, 95% CI) | 0.15 [‐0.08, 0.38] |
| Analysis 2.7  Comparison 2 Desogestrel 150 µg + EE 30 µg versus levonorgestrel 150 µg + EE 30 µg, Outcome 7 Fasting blood glucose (mmol/l) at cycle 12. | ||||
| 8 Fasting blood glucose (mmol/l) at cycle 24 Show forest plot | 1 | 17 | Mean Difference (IV, Fixed, 95% CI) | ‐0.40 [‐0.72, ‐0.08] |
| Analysis 2.8 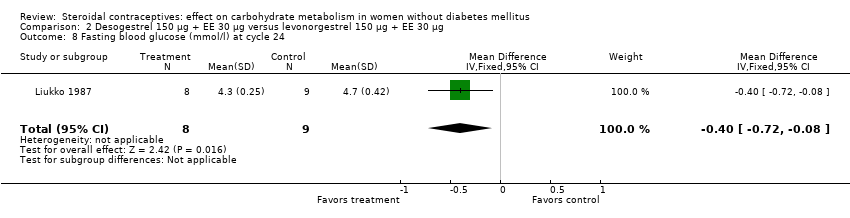 Comparison 2 Desogestrel 150 µg + EE 30 µg versus levonorgestrel 150 µg + EE 30 µg, Outcome 8 Fasting blood glucose (mmol/l) at cycle 24. | ||||
| 9 Glucose 2‐h response (mmol/l) at cycle 6 Show forest plot | 1 | 52 | Mean Difference (IV, Fixed, 95% CI) | ‐0.01 [‐0.97, 0.95] |
| Analysis 2.9  Comparison 2 Desogestrel 150 µg + EE 30 µg versus levonorgestrel 150 µg + EE 30 µg, Outcome 9 Glucose 2‐h response (mmol/l) at cycle 6. | ||||
| 10 Glucose 2‐h response (mmol/l) at cycle 12 Show forest plot | 1 | 44 | Mean Difference (IV, Fixed, 95% CI) | 1.08 [0.45, 1.71] |
| Analysis 2.10  Comparison 2 Desogestrel 150 µg + EE 30 µg versus levonorgestrel 150 µg + EE 30 µg, Outcome 10 Glucose 2‐h response (mmol/l) at cycle 12. | ||||
| Outcome or subgroup title | No. of studies | No. of participants | Statistical method | Effect size |
| 1 Fasting blood glucose (mmol/L) at cycle 6 Show forest plot | 1 | 118 | Mean Difference (IV, Fixed, 95% CI) | 0.0 [‐0.15, 0.15] |
| Analysis 3.1  Comparison 3 Desogestrel 150 µg + EE 20 µg versus gestodene 60 µg + EE 15 µg, Outcome 1 Fasting blood glucose (mmol/L) at cycle 6. | ||||
| 2 Fasting blood insulin (mlU/L) at cycle 6 Show forest plot | 1 | 118 | Mean Difference (IV, Fixed, 95% CI) | ‐0.40 [‐2.34, 1.54] |
| Analysis 3.2  Comparison 3 Desogestrel 150 µg + EE 20 µg versus gestodene 60 µg + EE 15 µg, Outcome 2 Fasting blood insulin (mlU/L) at cycle 6. | ||||
| 3 Fasting C‐peptide (pmol/L) at cycle 6 Show forest plot | 1 | 118 | Mean Difference (IV, Fixed, 95% CI) | ‐0.04 [‐0.12, 0.04] |
| Analysis 3.3  Comparison 3 Desogestrel 150 µg + EE 20 µg versus gestodene 60 µg + EE 15 µg, Outcome 3 Fasting C‐peptide (pmol/L) at cycle 6. | ||||
| 4 Glucose AUC (min x mmol/L) at cycle 6 Show forest plot | 1 | 116 | Mean Difference (IV, Fixed, 95% CI) | 42.00 [‐26.35, 110.35] |
| Analysis 3.4 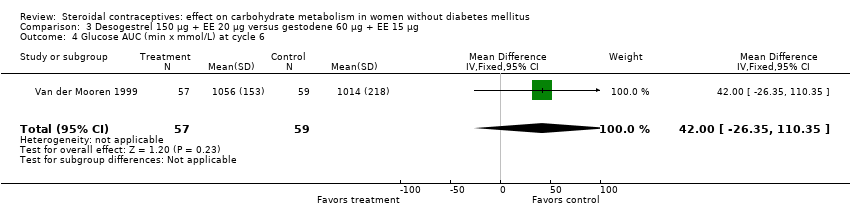 Comparison 3 Desogestrel 150 µg + EE 20 µg versus gestodene 60 µg + EE 15 µg, Outcome 4 Glucose AUC (min x mmol/L) at cycle 6. | ||||
| 5 Insulin AUC (min x mlU/L) at cycle 6 Show forest plot | 1 | 116 | Mean Difference (IV, Fixed, 95% CI) | ‐327.00 [‐1807.37, 1153.37] |
| Analysis 3.5  Comparison 3 Desogestrel 150 µg + EE 20 µg versus gestodene 60 µg + EE 15 µg, Outcome 5 Insulin AUC (min x mlU/L) at cycle 6. | ||||
| 6 C‐peptide AUC (min x nmol/L) at cycle 6 Show forest plot | 1 | 116 | Mean Difference (IV, Fixed, 95% CI) | ‐1.0 [‐38.14, 36.14] |
| Analysis 3.6 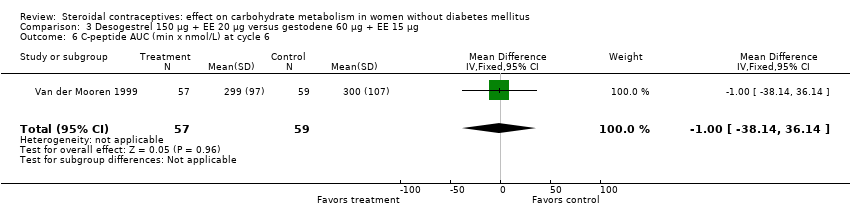 Comparison 3 Desogestrel 150 µg + EE 20 µg versus gestodene 60 µg + EE 15 µg, Outcome 6 C‐peptide AUC (min x nmol/L) at cycle 6. | ||||
| Outcome or subgroup title | No. of studies | No. of participants | Statistical method | Effect size |
| 1 Fasting plasma glucose (mg/dL) after 6 cycles Show forest plot | 2 | 57 | Mean Difference (IV, Fixed, 95% CI) | 0.34 [‐3.99, 4.67] |
| Analysis 4.1  Comparison 4 Desogestrel 150 µg + EE 30 µg versus gestodene 75 µg + EE 20 µg, Outcome 1 Fasting plasma glucose (mg/dL) after 6 cycles. | ||||
| 2 Fasting plasma insulin (µU/ml) after 6 cycles Show forest plot | 1 | 31 | Mean Difference (IV, Fixed, 95% CI) | ‐0.80 [‐3.16, 1.56] |
| Analysis 4.2  Comparison 4 Desogestrel 150 µg + EE 30 µg versus gestodene 75 µg + EE 20 µg, Outcome 2 Fasting plasma insulin (µU/ml) after 6 cycles. | ||||
| 3 Fasting plasma insulin (mIU/ml) after 6 cycles Show forest plot | 1 | 26 | Mean Difference (IV, Fixed, 95% CI) | 4.10 [‐0.57, 8.77] |
| Analysis 4.3  Comparison 4 Desogestrel 150 µg + EE 30 µg versus gestodene 75 µg + EE 20 µg, Outcome 3 Fasting plasma insulin (mIU/ml) after 6 cycles. | ||||
| 4 Fasting C‐peptide (pmol/L) after 6 cycles Show forest plot | 1 | 31 | Mean Difference (IV, Fixed, 95% CI) | 13.0 [‐45.80, 71.80] |
| Analysis 4.4  Comparison 4 Desogestrel 150 µg + EE 30 µg versus gestodene 75 µg + EE 20 µg, Outcome 4 Fasting C‐peptide (pmol/L) after 6 cycles. | ||||
| 5 Glucose AUC (h x g/L) after 6 cycles Show forest plot | 1 | 31 | Mean Difference (IV, Fixed, 95% CI) | ‐0.21 [‐0.85, 0.43] |
| Analysis 4.5 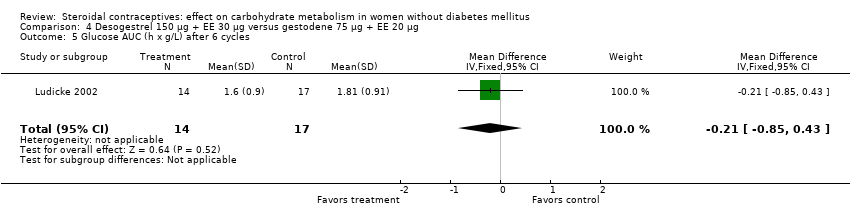 Comparison 4 Desogestrel 150 µg + EE 30 µg versus gestodene 75 µg + EE 20 µg, Outcome 5 Glucose AUC (h x g/L) after 6 cycles. | ||||
| 6 Insulin AUC (h x IU/ml) after 6 cycles Show forest plot | 1 | 31 | Mean Difference (IV, Fixed, 95% CI) | 14.0 [‐76.09, 104.09] |
| Analysis 4.6  Comparison 4 Desogestrel 150 µg + EE 30 µg versus gestodene 75 µg + EE 20 µg, Outcome 6 Insulin AUC (h x IU/ml) after 6 cycles. | ||||
| 7 C‐peptide AUC (h x pmol/L) after 6 cycles Show forest plot | 1 | 31 | Mean Difference (IV, Fixed, 95% CI) | ‐89.0 [‐587.05, 409.05] |
| Analysis 4.7 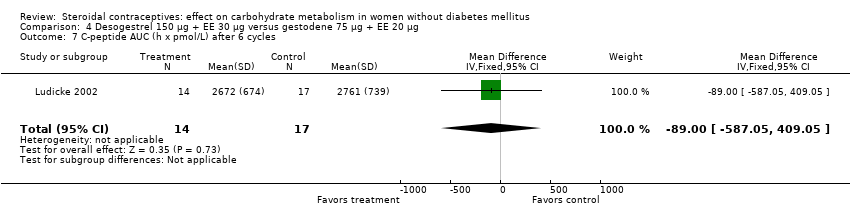 Comparison 4 Desogestrel 150 µg + EE 30 µg versus gestodene 75 µg + EE 20 µg, Outcome 7 C‐peptide AUC (h x pmol/L) after 6 cycles. | ||||
| 8 Fasting glucose (g/L) after 13 cycles Show forest plot | 1 | 31 | Mean Difference (IV, Fixed, 95% CI) | ‐0.02 [‐0.07, 0.03] |
| Analysis 4.8  Comparison 4 Desogestrel 150 µg + EE 30 µg versus gestodene 75 µg + EE 20 µg, Outcome 8 Fasting glucose (g/L) after 13 cycles. | ||||
| 9 Fasting insulin (IU/ml) after 13 cycles Show forest plot | 1 | 31 | Mean Difference (IV, Fixed, 95% CI) | ‐1.0 [‐3.74, 1.74] |
| Analysis 4.9  Comparison 4 Desogestrel 150 µg + EE 30 µg versus gestodene 75 µg + EE 20 µg, Outcome 9 Fasting insulin (IU/ml) after 13 cycles. | ||||
| 10 Fasting C‐peptide (pmol/L) after 13 cycles Show forest plot | 1 | 31 | Mean Difference (IV, Fixed, 95% CI) | 4.0 [‐42.84, 50.84] |
| Analysis 4.10  Comparison 4 Desogestrel 150 µg + EE 30 µg versus gestodene 75 µg + EE 20 µg, Outcome 10 Fasting C‐peptide (pmol/L) after 13 cycles. | ||||
| 11 Glucose AUC (h x g/L) after 13 cycles Show forest plot | 1 | 31 | Mean Difference (IV, Fixed, 95% CI) | 0.29 [‐0.93, 1.51] |
| Analysis 4.11  Comparison 4 Desogestrel 150 µg + EE 30 µg versus gestodene 75 µg + EE 20 µg, Outcome 11 Glucose AUC (h x g/L) after 13 cycles. | ||||
| 12 Insulin AUC (h x IU/ml) after 13 cycles Show forest plot | 1 | 31 | Mean Difference (IV, Fixed, 95% CI) | 0.0 [‐80.75, 80.75] |
| Analysis 4.12  Comparison 4 Desogestrel 150 µg + EE 30 µg versus gestodene 75 µg + EE 20 µg, Outcome 12 Insulin AUC (h x IU/ml) after 13 cycles. | ||||
| 13 C‐peptide AUC (h x pmol/L) after 13 cycles Show forest plot | 1 | 31 | Mean Difference (IV, Fixed, 95% CI) | 494.00 [‐694.17, 1682.17] |
| Analysis 4.13 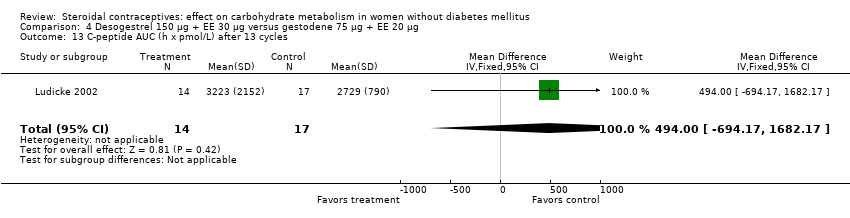 Comparison 4 Desogestrel 150 µg + EE 30 µg versus gestodene 75 µg + EE 20 µg, Outcome 13 C‐peptide AUC (h x pmol/L) after 13 cycles. | ||||
| Outcome or subgroup title | No. of studies | No. of participants | Statistical method | Effect size |
| 1 Fasting plasma glucose (mg/dL) after cycle 6 Show forest plot | 1 | 28 | Mean Difference (IV, Fixed, 95% CI) | ‐1.0 [‐6.24, 4.24] |
| Analysis 5.1  Comparison 5 Desogestrel 150 µg + EE 20 µg versus gestodene 75 µg + EE 20 µg, Outcome 1 Fasting plasma glucose (mg/dL) after cycle 6. | ||||
| 2 Fasting plasma insulin (mIU/mL) after cycle 6 Show forest plot | 1 | 28 | Mean Difference (IV, Fixed, 95% CI) | 4.20 [‐3.18, 11.58] |
| Analysis 5.2  Comparison 5 Desogestrel 150 µg + EE 20 µg versus gestodene 75 µg + EE 20 µg, Outcome 2 Fasting plasma insulin (mIU/mL) after cycle 6. | ||||
| Outcome or subgroup title | No. of studies | No. of participants | Statistical method | Effect size |
| 1 Fasting plasma glucose (mg/dL) after cycle 6 Show forest plot | 1 | 25 | Mean Difference (IV, Fixed, 95% CI) | ‐1.70 [‐7.93, 4.53] |
| Analysis 6.1  Comparison 6 Desogestrel 150 µg + EE 30 µg versus gestodene 75 µg + EE 30 µg, Outcome 1 Fasting plasma glucose (mg/dL) after cycle 6. | ||||
| 2 Fasting plasma insulin (mIU/mL) after cycle 6 Show forest plot | 1 | 25 | Mean Difference (IV, Fixed, 95% CI) | 3.5 [‐1.88, 8.88] |
| Analysis 6.2  Comparison 6 Desogestrel 150 µg + EE 30 µg versus gestodene 75 µg + EE 30 µg, Outcome 2 Fasting plasma insulin (mIU/mL) after cycle 6. | ||||
| Outcome or subgroup title | No. of studies | No. of participants | Statistical method | Effect size |
| 1 Glucose AUC (mg/dl) at 6 months Show forest plot | 1 | 25 | Mean Difference (IV, Fixed, 95% CI) | ‐14.90 [‐38.08, 8.28] |
| Analysis 7.1  Comparison 7 Desogestrel 150 µg + EE 30 µg versus desogestrel 125 µg + EE 50 µg, Outcome 1 Glucose AUC (mg/dl) at 6 months. | ||||
| 2 Insulin AUC at 6 months Show forest plot | 1 | 25 | Mean Difference (IV, Fixed, 95% CI) | ‐16.30 [‐38.06, 5.46] |
| Analysis 7.2 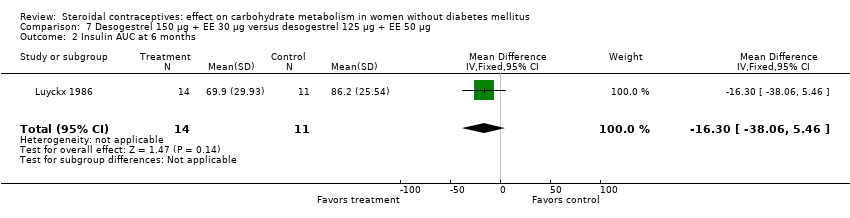 Comparison 7 Desogestrel 150 µg + EE 30 µg versus desogestrel 125 µg + EE 50 µg, Outcome 2 Insulin AUC at 6 months. | ||||
| Outcome or subgroup title | No. of studies | No. of participants | Statistical method | Effect size |
| 1 Glucose AUC (mmol/L) at 6 months Show forest plot | 1 | 24 | Mean Difference (IV, Fixed, 95% CI) | 0.10 [‐1.49, 1.69] |
| Analysis 8.1  Comparison 8 Desogestrel 150 µg + EE 20 µg versus chlormadinone acetete 2 mg + EE 30 µg, Outcome 1 Glucose AUC (mmol/L) at 6 months. | ||||
| 2 Insulin AUC (pmol/L) at 6 months Show forest plot | 1 | 24 | Mean Difference (IV, Fixed, 95% CI) | 7.70 [‐21.47, 36.87] |
| Analysis 8.2  Comparison 8 Desogestrel 150 µg + EE 20 µg versus chlormadinone acetete 2 mg + EE 30 µg, Outcome 2 Insulin AUC (pmol/L) at 6 months. | ||||
| 3 C‐peptide AUC (pmol/L) at 6 months Show forest plot | 1 | 24 | Mean Difference (IV, Fixed, 95% CI) | 201.60 [‐615.19, 1018.39] |
| Analysis 8.3  Comparison 8 Desogestrel 150 µg + EE 20 µg versus chlormadinone acetete 2 mg + EE 30 µg, Outcome 3 C‐peptide AUC (pmol/L) at 6 months. | ||||
| Outcome or subgroup title | No. of studies | No. of participants | Statistical method | Effect size |
| 1 Glucose AUC (mg/dl) at 6 months Show forest plot | 1 | 27 | Mean Difference (IV, Fixed, 95% CI) | ‐9.90 [‐28.33, 8.53] |
| Analysis 9.1 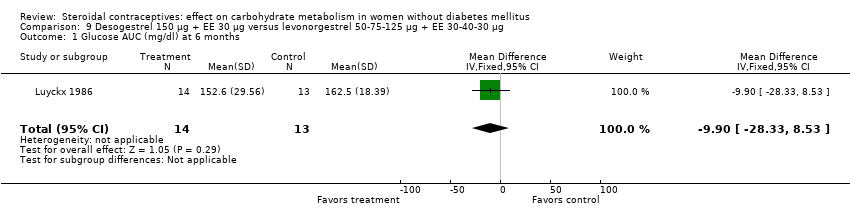 Comparison 9 Desogestrel 150 µg + EE 30 µg versus levonorgestrel 50‐75‐125 µg + EE 30‐40‐30 µg, Outcome 1 Glucose AUC (mg/dl) at 6 months. | ||||
| 2 Insulin AUC at 6 months Show forest plot | 1 | 27 | Mean Difference (IV, Fixed, 95% CI) | 4.0 [‐12.61, 20.61] |
| Analysis 9.2  Comparison 9 Desogestrel 150 µg + EE 30 µg versus levonorgestrel 50‐75‐125 µg + EE 30‐40‐30 µg, Outcome 2 Insulin AUC at 6 months. | ||||
| 3 Fasting blood glucose (mmol/l) at cycle 6 Show forest plot | 1 | 52 | Mean Difference (IV, Fixed, 95% CI) | 0.21 [‐0.04, 0.46] |
| Analysis 9.3  Comparison 9 Desogestrel 150 µg + EE 30 µg versus levonorgestrel 50‐75‐125 µg + EE 30‐40‐30 µg, Outcome 3 Fasting blood glucose (mmol/l) at cycle 6. | ||||
| 4 Fasting blood glucose (mmol/l) at cycle 12 Show forest plot | 1 | 42 | Mean Difference (IV, Fixed, 95% CI) | 0.12 [‐0.16, 0.40] |
| Analysis 9.4  Comparison 9 Desogestrel 150 µg + EE 30 µg versus levonorgestrel 50‐75‐125 µg + EE 30‐40‐30 µg, Outcome 4 Fasting blood glucose (mmol/l) at cycle 12. | ||||
| 5 Glucose 2‐h response (mmol/l) at cycle 6 Show forest plot | 1 | 52 | Mean Difference (IV, Fixed, 95% CI) | ‐0.20 [‐1.11, 0.71] |
| Analysis 9.5 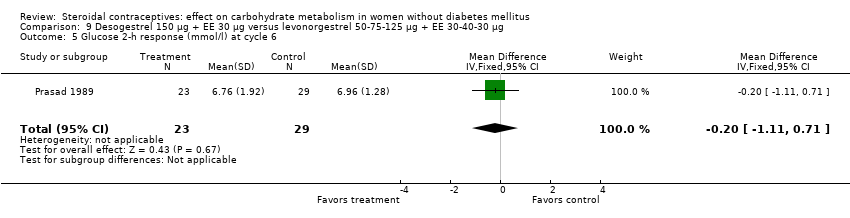 Comparison 9 Desogestrel 150 µg + EE 30 µg versus levonorgestrel 50‐75‐125 µg + EE 30‐40‐30 µg, Outcome 5 Glucose 2‐h response (mmol/l) at cycle 6. | ||||
| 6 Glucose 2‐h response (mmol/l) at cycle 12 Show forest plot | 1 | 42 | Mean Difference (IV, Fixed, 95% CI) | 0.37 [‐0.41, 1.15] |
| Analysis 9.6  Comparison 9 Desogestrel 150 µg + EE 30 µg versus levonorgestrel 50‐75‐125 µg + EE 30‐40‐30 µg, Outcome 6 Glucose 2‐h response (mmol/l) at cycle 12. | ||||
| Outcome or subgroup title | No. of studies | No. of participants | Statistical method | Effect size |
| 1 Glucose AUC (mg/dl) at 6 months Show forest plot | 1 | 24 | Mean Difference (IV, Fixed, 95% CI) | 5.0 [‐14.94, 24.94] |
| Analysis 10.1  Comparison 10 Desogestrel 125 µg + EE 50 µg versus levonorgestrel 50‐75‐125 µg + EE 30‐40‐30 µg, Outcome 1 Glucose AUC (mg/dl) at 6 months. | ||||
| 2 Insulin AUC at 6 months Show forest plot | 1 | 24 | Mean Difference (IV, Fixed, 95% CI) | 20.30 [4.24, 36.36] |
| Analysis 10.2  Comparison 10 Desogestrel 125 µg + EE 50 µg versus levonorgestrel 50‐75‐125 µg + EE 30‐40‐30 µg, Outcome 2 Insulin AUC at 6 months. | ||||
| Outcome or subgroup title | No. of studies | No. of participants | Statistical method | Effect size |
| 1 Change in glucose (mg/dL) from fasting to 1 h after 400 kcal drink at cycle 6 Show forest plot | 1 | 57 | Mean Difference (IV, Fixed, 95% CI) | 1.90 [‐8.07, 11.87] |
| Analysis 11.1 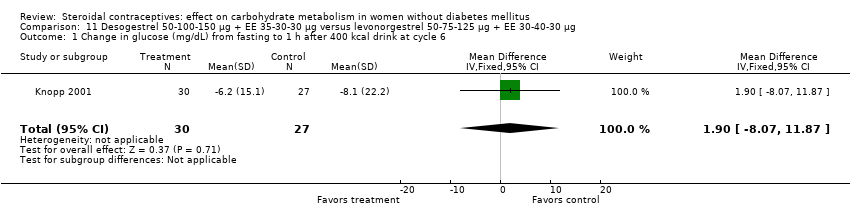 Comparison 11 Desogestrel 50‐100‐150 µg + EE 35‐30‐30 µg versus levonorgestrel 50‐75‐125 µg + EE 30‐40‐30 µg, Outcome 1 Change in glucose (mg/dL) from fasting to 1 h after 400 kcal drink at cycle 6. | ||||
| 2 Change in insulin (µU/ml) from fasting to 1 h after 400 kcal drink at cycle 6 Show forest plot | 1 | 57 | Mean Difference (IV, Fixed, 95% CI) | 12.60 [‐1.27, 26.47] |
| Analysis 11.2  Comparison 11 Desogestrel 50‐100‐150 µg + EE 35‐30‐30 µg versus levonorgestrel 50‐75‐125 µg + EE 30‐40‐30 µg, Outcome 2 Change in insulin (µU/ml) from fasting to 1 h after 400 kcal drink at cycle 6. | ||||
| Outcome or subgroup title | No. of studies | No. of participants | Statistical method | Effect size |
| 1 Change in glucose AUC (mg/dL) by 6 months Show forest plot | 1 | 30 | Mean Difference (IV, Fixed, 95% CI) | ‐2.37 [‐6.72, 1.98] |
| Analysis 12.1  Comparison 12 Etonogestrel 120 µg + EE 15 µg (vaginal ring) versus desogestrel 150 µg + (EE 20 µg or EE 30 µg), Outcome 1 Change in glucose AUC (mg/dL) by 6 months. | ||||
| 2 Change in insulin AUC (µU/mL) by 6 months Show forest plot | 1 | 30 | Mean Difference (IV, Fixed, 95% CI) | ‐2.58 [‐6.63, 1.47] |
| Analysis 12.2  Comparison 12 Etonogestrel 120 µg + EE 15 µg (vaginal ring) versus desogestrel 150 µg + (EE 20 µg or EE 30 µg), Outcome 2 Change in insulin AUC (µU/mL) by 6 months. | ||||
| 3 Change in C‐peptide AUC (ng/mL) by 6 months Show forest plot | 1 | 30 | Mean Difference (IV, Fixed, 95% CI) | 0.04 [‐1.76, 1.84] |
| Analysis 12.3  Comparison 12 Etonogestrel 120 µg + EE 15 µg (vaginal ring) versus desogestrel 150 µg + (EE 20 µg or EE 30 µg), Outcome 3 Change in C‐peptide AUC (ng/mL) by 6 months. | ||||
| Outcome or subgroup title | No. of studies | No. of participants | Statistical method | Effect size |
| 1 Glucose AUC (hr x mmol/L) at cycle 6 Show forest plot | 1 | 69 | Mean Difference (IV, Fixed, 95% CI) | ‐0.06 [‐1.41, 1.29] |
| Analysis 13.1 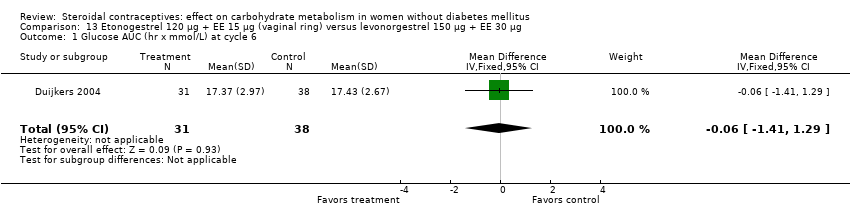 Comparison 13 Etonogestrel 120 µg + EE 15 µg (vaginal ring) versus levonorgestrel 150 µg + EE 30 µg, Outcome 1 Glucose AUC (hr x mmol/L) at cycle 6. | ||||
| 2 Insulin AUC (hr x pmol/L) at cycle 6 Show forest plot | 1 | 65 | Mean Difference (IV, Fixed, 95% CI) | ‐204.51 [‐389.64, ‐19.38] |
| Analysis 13.2  Comparison 13 Etonogestrel 120 µg + EE 15 µg (vaginal ring) versus levonorgestrel 150 µg + EE 30 µg, Outcome 2 Insulin AUC (hr x pmol/L) at cycle 6. | ||||
| 3 Fasting glycosylated hemoglobin (%) at cycle 6 Show forest plot | 1 | 68 | Mean Difference (IV, Fixed, 95% CI) | ‐0.16 [‐0.33, 0.01] |
| Analysis 13.3  Comparison 13 Etonogestrel 120 µg + EE 15 µg (vaginal ring) versus levonorgestrel 150 µg + EE 30 µg, Outcome 3 Fasting glycosylated hemoglobin (%) at cycle 6. | ||||
| Outcome or subgroup title | No. of studies | No. of participants | Statistical method | Effect size |
| 1 Impaired glucose tolerance at cycle 5 Show forest plot | 1 | 42 | Odds Ratio (M‐H, Fixed, 95% CI) | 0.16 [0.01, 3.64] |
| Analysis 14.1 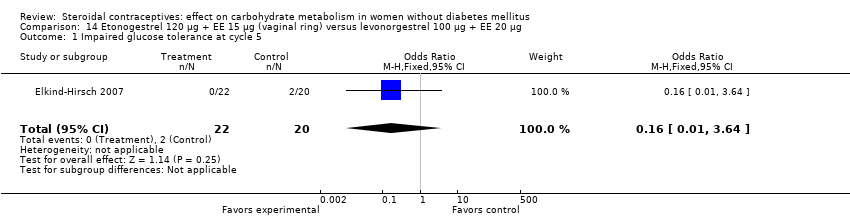 Comparison 14 Etonogestrel 120 µg + EE 15 µg (vaginal ring) versus levonorgestrel 100 µg + EE 20 µg, Outcome 1 Impaired glucose tolerance at cycle 5. | ||||
| 2 Insulin sensitivity at cycle 5 Show forest plot | 1 | 42 | Mean Difference (IV, Fixed, 95% CI) | 1.9 [‐5.92, 9.72] |
| Analysis 14.2  Comparison 14 Etonogestrel 120 µg + EE 15 µg (vaginal ring) versus levonorgestrel 100 µg + EE 20 µg, Outcome 2 Insulin sensitivity at cycle 5. | ||||
| Outcome or subgroup title | No. of studies | No. of participants | Statistical method | Effect size |
| 1 Fasting plasma glucose (mmol/L) at 12 months Show forest plot | 1 | 75 | Mean Difference (IV, Fixed, 95% CI) | 0.01 [‐0.24, 0.26] |
| Analysis 15.1 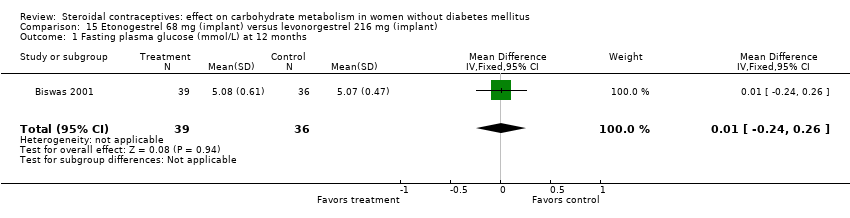 Comparison 15 Etonogestrel 68 mg (implant) versus levonorgestrel 216 mg (implant), Outcome 1 Fasting plasma glucose (mmol/L) at 12 months. | ||||
| 2 Fasting plasma glucose at 24 months Show forest plot | 1 | 68 | Mean Difference (IV, Fixed, 95% CI) | ‐0.02 [‐0.24, 0.20] |
| Analysis 15.2 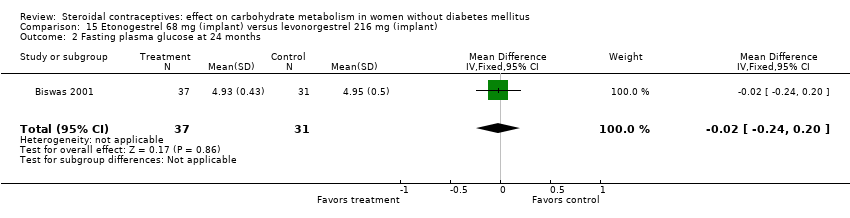 Comparison 15 Etonogestrel 68 mg (implant) versus levonorgestrel 216 mg (implant), Outcome 2 Fasting plasma glucose at 24 months. | ||||
| 3 Fasting plasma insulin (pmol/L) at 12 months Show forest plot | 1 | 75 | Mean Difference (IV, Fixed, 95% CI) | ‐6.45 [‐37.68, 24.78] |
| Analysis 15.3  Comparison 15 Etonogestrel 68 mg (implant) versus levonorgestrel 216 mg (implant), Outcome 3 Fasting plasma insulin (pmol/L) at 12 months. | ||||
| 4 Fasting plasma insulin (pmol/L) at 24 months Show forest plot | 1 | 68 | Mean Difference (IV, Fixed, 95% CI) | 12.09 [‐4.17, 28.35] |
| Analysis 15.4  Comparison 15 Etonogestrel 68 mg (implant) versus levonorgestrel 216 mg (implant), Outcome 4 Fasting plasma insulin (pmol/L) at 24 months. | ||||
| 5 Fasting glycosylated hemoglobin (%) at 12 months Show forest plot | 1 | 75 | Mean Difference (IV, Fixed, 95% CI) | ‐0.03 [‐0.27, 0.21] |
| Analysis 15.5  Comparison 15 Etonogestrel 68 mg (implant) versus levonorgestrel 216 mg (implant), Outcome 5 Fasting glycosylated hemoglobin (%) at 12 months. | ||||
| 6 Fasting glycosylated hemoglobin (%) at 24 months Show forest plot | 1 | 68 | Mean Difference (IV, Fixed, 95% CI) | 0.13 [‐0.11, 0.37] |
| Analysis 15.6 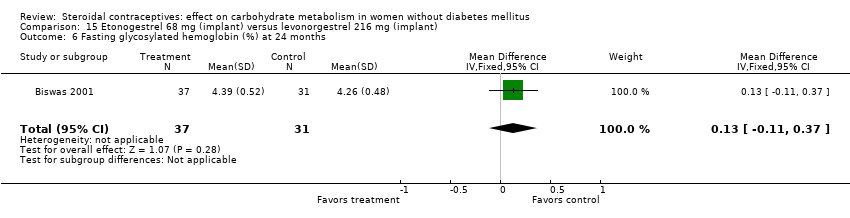 Comparison 15 Etonogestrel 68 mg (implant) versus levonorgestrel 216 mg (implant), Outcome 6 Fasting glycosylated hemoglobin (%) at 24 months. | ||||
| 7 Glucose incremental AUC (min x mmol/L) at 12 months Show forest plot | 1 | 75 | Mean Difference (IV, Fixed, 95% CI) | 0.0 [‐79.44, 79.44] |
| Analysis 15.7 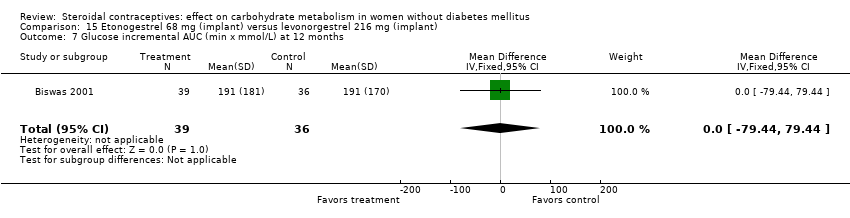 Comparison 15 Etonogestrel 68 mg (implant) versus levonorgestrel 216 mg (implant), Outcome 7 Glucose incremental AUC (min x mmol/L) at 12 months. | ||||
| 8 Glucose incremental AUC (min x mmol/L) at 24 months Show forest plot | 1 | 68 | Mean Difference (IV, Fixed, 95% CI) | ‐59.00 [‐143.87, 25.87] |
| Analysis 15.8  Comparison 15 Etonogestrel 68 mg (implant) versus levonorgestrel 216 mg (implant), Outcome 8 Glucose incremental AUC (min x mmol/L) at 24 months. | ||||
| 9 Insulin incremental AUC (min x nmol/L) at 12 months Show forest plot | 1 | 75 | Mean Difference (IV, Fixed, 95% CI) | 3.20 [‐11.69, 18.09] |
| Analysis 15.9 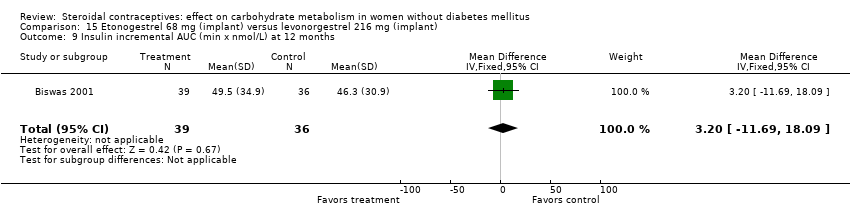 Comparison 15 Etonogestrel 68 mg (implant) versus levonorgestrel 216 mg (implant), Outcome 9 Insulin incremental AUC (min x nmol/L) at 12 months. | ||||
| 10 Insulin incremental AUC (min x nmol/L) at 24 months Show forest plot | 1 | 68 | Mean Difference (IV, Fixed, 95% CI) | ‐9.40 [‐28.91, 10.11] |
| Analysis 15.10  Comparison 15 Etonogestrel 68 mg (implant) versus levonorgestrel 216 mg (implant), Outcome 10 Insulin incremental AUC (min x nmol/L) at 24 months. | ||||
| Outcome or subgroup title | No. of studies | No. of participants | Statistical method | Effect size |
| 1 Change in fasting blood insulin (mU/L) at cycle 7 Show forest plot | 1 | 51 | Mean Difference (IV, Fixed, 95% CI) | 1.1 [‐0.77, 2.97] |
| Analysis 16.1  Comparison 16 Drospirenone 3 mg + EE 20 µg versus desogestrel 150 µg + EE 20 µg, Outcome 1 Change in fasting blood insulin (mU/L) at cycle 7. | ||||
| 2 Change in glucose AUC (h x mg/L) at cycle 7 Show forest plot | 1 | 53 | Mean Difference (IV, Fixed, 95% CI) | 0.23 [‐1.12, 1.58] |
| Analysis 16.2 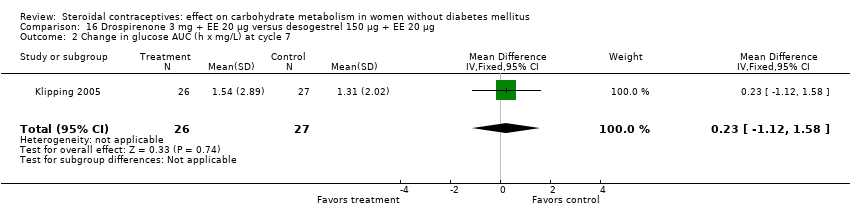 Comparison 16 Drospirenone 3 mg + EE 20 µg versus desogestrel 150 µg + EE 20 µg, Outcome 2 Change in glucose AUC (h x mg/L) at cycle 7. | ||||
| 3 Change in fasting C‐peptide (ng/mL) at cycle 7 Show forest plot | 1 | 53 | Mean Difference (IV, Fixed, 95% CI) | 0.09 [‐0.17, 0.35] |
| Analysis 16.3  Comparison 16 Drospirenone 3 mg + EE 20 µg versus desogestrel 150 µg + EE 20 µg, Outcome 3 Change in fasting C‐peptide (ng/mL) at cycle 7. | ||||
| 4 Change in C‐peptide 2‐h response (ng/mL) at cycle 7 Show forest plot | 1 | 53 | Mean Difference (IV, Fixed, 95% CI) | 0.76 [‐0.27, 1.79] |
| Analysis 16.4  Comparison 16 Drospirenone 3 mg + EE 20 µg versus desogestrel 150 µg + EE 20 µg, Outcome 4 Change in C‐peptide 2‐h response (ng/mL) at cycle 7. | ||||
| Outcome or subgroup title | No. of studies | No. of participants | Statistical method | Effect size |
| 1 Change in fasting plasma glucose (mg/dL) by cycle 13 Show forest plot | 1 | 50 | Mean Difference (IV, Fixed, 95% CI) | 0.56 [‐5.29, 6.41] |
| Analysis 17.1  Comparison 17 Drospirenone 3 mg + EE 30 µg versus desogestrel 150 µg + EE 30 µg, Outcome 1 Change in fasting plasma glucose (mg/dL) by cycle 13. | ||||
| 2 Change in fasting plasma insulin (µU/mL) by cycle 13 Show forest plot | 1 | 50 | Mean Difference (IV, Fixed, 95% CI) | ‐1.86 [‐4.72, 1.00] |
| Analysis 17.2  Comparison 17 Drospirenone 3 mg + EE 30 µg versus desogestrel 150 µg + EE 30 µg, Outcome 2 Change in fasting plasma insulin (µU/mL) by cycle 13. | ||||
| 3 Change in fasting C‐peptide (µmol/L) by cycle 13 Show forest plot | 1 | 50 | Mean Difference (IV, Fixed, 95% CI) | 14.4 [‐83.00, 111.80] |
| Analysis 17.3  Comparison 17 Drospirenone 3 mg + EE 30 µg versus desogestrel 150 µg + EE 30 µg, Outcome 3 Change in fasting C‐peptide (µmol/L) by cycle 13. | ||||
| 4 Change in fasting free fatty acids (µEq/L) by cycle 13 Show forest plot | 1 | 50 | Mean Difference (IV, Fixed, 95% CI) | ‐42.17 [‐194.32, 109.98] |
| Analysis 17.4 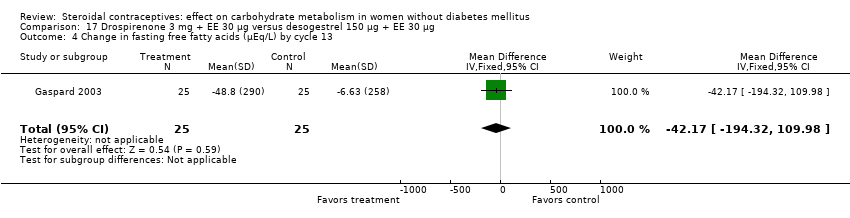 Comparison 17 Drospirenone 3 mg + EE 30 µg versus desogestrel 150 µg + EE 30 µg, Outcome 4 Change in fasting free fatty acids (µEq/L) by cycle 13. | ||||
| 5 Change in glucose AUC (h x mg/dL) by cycle 13 Show forest plot | 1 | 50 | Mean Difference (IV, Fixed, 95% CI) | 6.5 [‐18.07, 31.07] |
| Analysis 17.5  Comparison 17 Drospirenone 3 mg + EE 30 µg versus desogestrel 150 µg + EE 30 µg, Outcome 5 Change in glucose AUC (h x mg/dL) by cycle 13. | ||||
| 6 Change in insulin AUC (h x µU/mL) by cycle 13 Show forest plot | 1 | 50 | Mean Difference (IV, Fixed, 95% CI) | 6.50 [‐29.37, 42.37] |
| Analysis 17.6  Comparison 17 Drospirenone 3 mg + EE 30 µg versus desogestrel 150 µg + EE 30 µg, Outcome 6 Change in insulin AUC (h x µU/mL) by cycle 13. | ||||
| 7 Change in C‐peptide AUC (h x µmol/L) by cycle 13 Show forest plot | 1 | 50 | Mean Difference (IV, Fixed, 95% CI) | 0.29 [‐0.60, 1.18] |
| Analysis 17.7  Comparison 17 Drospirenone 3 mg + EE 30 µg versus desogestrel 150 µg + EE 30 µg, Outcome 7 Change in C‐peptide AUC (h x µmol/L) by cycle 13. | ||||
| 8 Change in free fatty acids AUC (h x µEq/L) by cycle 13 Show forest plot | 1 | 50 | Mean Difference (IV, Fixed, 95% CI) | ‐91.3 [‐212.17, 29.57] |
| Analysis 17.8  Comparison 17 Drospirenone 3 mg + EE 30 µg versus desogestrel 150 µg + EE 30 µg, Outcome 8 Change in free fatty acids AUC (h x µEq/L) by cycle 13. | ||||
| Outcome or subgroup title | No. of studies | No. of participants | Statistical method | Effect size |
| 1 Fasting serum glucose (mg/dL) at 12 months Show forest plot | 1 | 58 | Mean Difference (IV, Fixed, 95% CI) | ‐1.30 [‐6.01, 3.41] |
| Analysis 18.1  Comparison 18 Norethisterone 1000 µg + EE 35 µg versus levonorgestrel 150 µg + EE 30 µg, Outcome 1 Fasting serum glucose (mg/dL) at 12 months. | ||||
| 2 Change in fasting blood glucose (mg/dL) at 12 months Show forest plot | 1 | 470 | Mean Difference (IV, Fixed, 95% CI) | 0.0 [‐0.12, 0.12] |
| Analysis 18.2 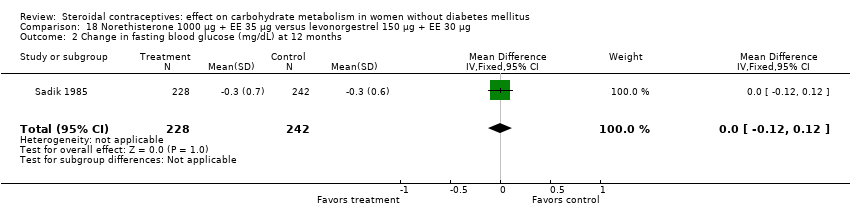 Comparison 18 Norethisterone 1000 µg + EE 35 µg versus levonorgestrel 150 µg + EE 30 µg, Outcome 2 Change in fasting blood glucose (mg/dL) at 12 months. | ||||
| 3 Glucose 2‐h response (mg/dL) at 12 months Show forest plot | 1 | 58 | Mean Difference (IV, Fixed, 95% CI) | 6.5 [‐4.75, 17.75] |
| Analysis 18.3 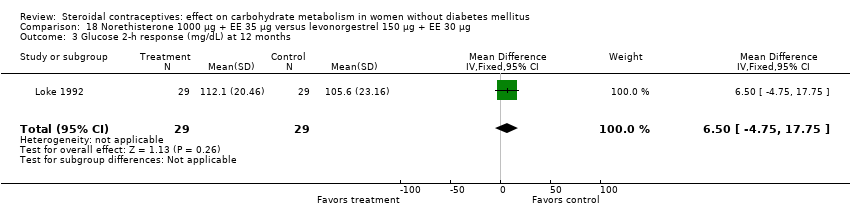 Comparison 18 Norethisterone 1000 µg + EE 35 µg versus levonorgestrel 150 µg + EE 30 µg, Outcome 3 Glucose 2‐h response (mg/dL) at 12 months. | ||||
| 4 Change in glucose 2‐h response (mg/dL) at 12 months Show forest plot | 1 | 470 | Mean Difference (IV, Fixed, 95% CI) | ‐0.30 [‐0.54, ‐0.06] |
| Analysis 18.4 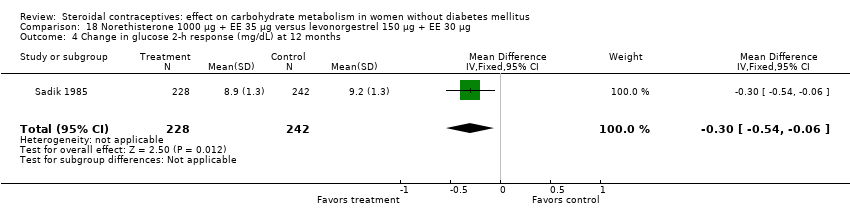 Comparison 18 Norethisterone 1000 µg + EE 35 µg versus levonorgestrel 150 µg + EE 30 µg, Outcome 4 Change in glucose 2‐h response (mg/dL) at 12 months. | ||||
| Outcome or subgroup title | No. of studies | No. of participants | Statistical method | Effect size |
| 1 Fasting plasma glucose (mmol/L) at 6 months Show forest plot | 1 | 33 | Mean Difference (IV, Fixed, 95% CI) | ‐0.62 [‐1.26, 0.02] |
| Analysis 19.1 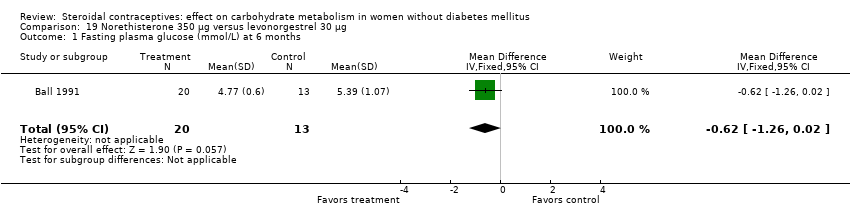 Comparison 19 Norethisterone 350 µg versus levonorgestrel 30 µg, Outcome 1 Fasting plasma glucose (mmol/L) at 6 months. | ||||
| 2 Fasting glycosylated hemoglobin (%) at 6 months Show forest plot | 1 | 33 | Mean Difference (IV, Fixed, 95% CI) | 0.09 [‐0.66, 0.84] |
| Analysis 19.2  Comparison 19 Norethisterone 350 µg versus levonorgestrel 30 µg, Outcome 2 Fasting glycosylated hemoglobin (%) at 6 months. | ||||
| 3 Abnormal fasting plasma glucose at 6 months Show forest plot | 1 | 33 | Peto Odds Ratio (Peto, Fixed, 95% CI) | 0.07 [0.00, 1.30] |
| Analysis 19.3  Comparison 19 Norethisterone 350 µg versus levonorgestrel 30 µg, Outcome 3 Abnormal fasting plasma glucose at 6 months. | ||||
| 4 Abnormal fasting glycosylated hemoglobin at 6 months Show forest plot | 1 | 33 | Peto Odds Ratio (Peto, Fixed, 95% CI) | 0.97 [0.14, 6.61] |
| Analysis 19.4  Comparison 19 Norethisterone 350 µg versus levonorgestrel 30 µg, Outcome 4 Abnormal fasting glycosylated hemoglobin at 6 months. | ||||
| Outcome or subgroup title | No. of studies | No. of participants | Statistical method | Effect size |
| 1 Change in glucose (mmol/L) from baseline to cycle 4 Show forest plot | 1 | 235 | Mean Difference (IV, Fixed, 95% CI) | ‐0.04 [‐0.28, 0.20] |
| Analysis 20.1  Comparison 20 Norethindrone 500‐750‐1000 µg + EE 35 µg versus levonorgestrel 100 µg + EE 20 µg, Outcome 1 Change in glucose (mmol/L) from baseline to cycle 4. | ||||
| Outcome or subgroup title | No. of studies | No. of participants | Statistical method | Effect size |
| 1 Fasting plasma glucose (mg/dl) at cycle 6 Show forest plot | 2 | 144 | Mean Difference (IV, Fixed, 95% CI) | ‐0.88 [‐2.83, 1.06] |
| Analysis 21.1  Comparison 21 Norethindrone 500‐750‐1000 µg + EE 35 µg versus levonorgestrel 50‐75‐125 µg + EE 30‐40‐30 µg, Outcome 1 Fasting plasma glucose (mg/dl) at cycle 6. | ||||
| 2 Fasting plasma glucose (mg/dl) at cycle 12 Show forest plot | 1 | 57 | Mean Difference (IV, Fixed, 95% CI) | ‐1.0 [‐5.38, 3.38] |
| Analysis 21.2  Comparison 21 Norethindrone 500‐750‐1000 µg + EE 35 µg versus levonorgestrel 50‐75‐125 µg + EE 30‐40‐30 µg, Outcome 2 Fasting plasma glucose (mg/dl) at cycle 12. | ||||
| 3 Fasting plasma insulin (µg/dl) at cycle 6 Show forest plot | 1 | 89 | Mean Difference (IV, Fixed, 95% CI) | ‐0.79 [‐4.31, 2.73] |
| Analysis 21.3  Comparison 21 Norethindrone 500‐750‐1000 µg + EE 35 µg versus levonorgestrel 50‐75‐125 µg + EE 30‐40‐30 µg, Outcome 3 Fasting plasma insulin (µg/dl) at cycle 6. | ||||
| 4 Fasting plasma insulin (µU/ml) at cycle 6 Show forest plot | 1 | 48 | Mean Difference (IV, Fixed, 95% CI) | ‐2.0 [‐4.77, 0.77] |
| Analysis 21.4  Comparison 21 Norethindrone 500‐750‐1000 µg + EE 35 µg versus levonorgestrel 50‐75‐125 µg + EE 30‐40‐30 µg, Outcome 4 Fasting plasma insulin (µU/ml) at cycle 6. | ||||
| 5 Fasting plasma insulin (µU/ml) at cycle 12 Show forest plot | 1 | 48 | Mean Difference (IV, Fixed, 95% CI) | 1.0 [‐1.77, 3.77] |
| Analysis 21.5  Comparison 21 Norethindrone 500‐750‐1000 µg + EE 35 µg versus levonorgestrel 50‐75‐125 µg + EE 30‐40‐30 µg, Outcome 5 Fasting plasma insulin (µU/ml) at cycle 12. | ||||
| 6 Glucose AUC (h x mg/dl) at cycle 6 Show forest plot | 2 | 144 | Mean Difference (IV, Fixed, 95% CI) | ‐10.83 [‐29.62, 7.96] |
| Analysis 21.6  Comparison 21 Norethindrone 500‐750‐1000 µg + EE 35 µg versus levonorgestrel 50‐75‐125 µg + EE 30‐40‐30 µg, Outcome 6 Glucose AUC (h x mg/dl) at cycle 6. | ||||
| 7 Glucose AUC (h x mg/dl) at cycle 12 Show forest plot | 1 | 57 | Mean Difference (IV, Fixed, 95% CI) | ‐14.0 [‐44.99, 16.99] |
| Analysis 21.7 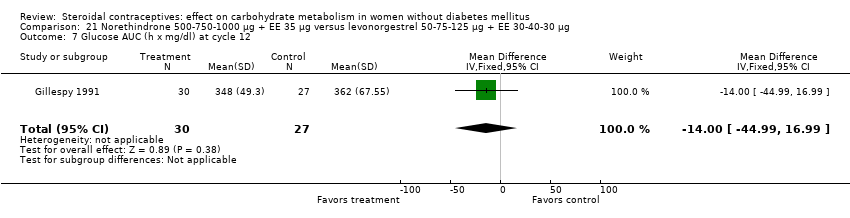 Comparison 21 Norethindrone 500‐750‐1000 µg + EE 35 µg versus levonorgestrel 50‐75‐125 µg + EE 30‐40‐30 µg, Outcome 7 Glucose AUC (h x mg/dl) at cycle 12. | ||||
| 8 Insulin AUC (h x µg/dl) at cycle 6 Show forest plot | 1 | 89 | Mean Difference (IV, Fixed, 95% CI) | ‐12.0 [‐58.88, 34.88] |
| Analysis 21.8 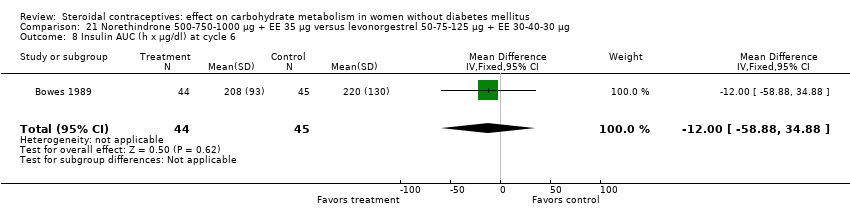 Comparison 21 Norethindrone 500‐750‐1000 µg + EE 35 µg versus levonorgestrel 50‐75‐125 µg + EE 30‐40‐30 µg, Outcome 8 Insulin AUC (h x µg/dl) at cycle 6. | ||||
| 9 Insulin AUC (h x µU/mL) at cycle 6 Show forest plot | 1 | 48 | Mean Difference (IV, Fixed, 95% CI) | 3.00 [‐33.46, 39.46] |
| Analysis 21.9  Comparison 21 Norethindrone 500‐750‐1000 µg + EE 35 µg versus levonorgestrel 50‐75‐125 µg + EE 30‐40‐30 µg, Outcome 9 Insulin AUC (h x µU/mL) at cycle 6. | ||||
| 10 Insulin AUC (h x µU/mL) at cycle 12 Show forest plot | 1 | 48 | Mean Difference (IV, Fixed, 95% CI) | 21.0 [‐15.46, 57.46] |
| Analysis 21.10  Comparison 21 Norethindrone 500‐750‐1000 µg + EE 35 µg versus levonorgestrel 50‐75‐125 µg + EE 30‐40‐30 µg, Outcome 10 Insulin AUC (h x µU/mL) at cycle 12. | ||||
| Outcome or subgroup title | No. of studies | No. of participants | Statistical method | Effect size |
| 1 Fasting plasma glucose (mg/dl) at cycle 6 Show forest plot | 1 | 88 | Mean Difference (IV, Fixed, 95% CI) | ‐0.60 [‐3.32, 2.12] |
| Analysis 22.1  Comparison 22 Norethindrone 500‐1000‐500 µg + EE 35 µg versus levonorgestrel 50‐75‐125 µg + EE 30‐40‐30 µg, Outcome 1 Fasting plasma glucose (mg/dl) at cycle 6. | ||||
| 2 Glucose AUC (h x µg/dl) at cycle 6 Show forest plot | 1 | 88 | Mean Difference (IV, Fixed, 95% CI) | ‐2.0 [‐27.51, 23.51] |
| Analysis 22.2  Comparison 22 Norethindrone 500‐1000‐500 µg + EE 35 µg versus levonorgestrel 50‐75‐125 µg + EE 30‐40‐30 µg, Outcome 2 Glucose AUC (h x µg/dl) at cycle 6. | ||||
| 3 Fasting plasma insulin (µg/dl) at cycle 6 Show forest plot | 1 | 91 | Mean Difference (IV, Fixed, 95% CI) | ‐0.34 [‐3.66, 2.98] |
| Analysis 22.3 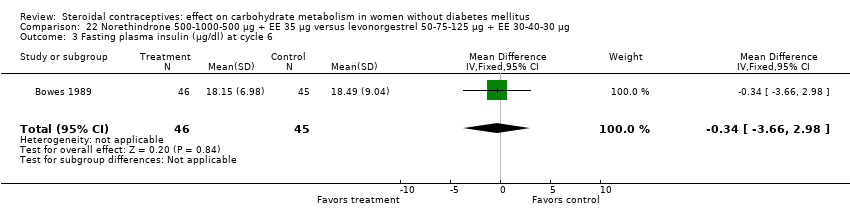 Comparison 22 Norethindrone 500‐1000‐500 µg + EE 35 µg versus levonorgestrel 50‐75‐125 µg + EE 30‐40‐30 µg, Outcome 3 Fasting plasma insulin (µg/dl) at cycle 6. | ||||
| 4 Insulin AUC (h x µg/dl) at cycle 6 Show forest plot | 1 | 91 | Mean Difference (IV, Fixed, 95% CI) | ‐10.0 [‐55.87, 35.87] |
| Analysis 22.4  Comparison 22 Norethindrone 500‐1000‐500 µg + EE 35 µg versus levonorgestrel 50‐75‐125 µg + EE 30‐40‐30 µg, Outcome 4 Insulin AUC (h x µg/dl) at cycle 6. | ||||
| Outcome or subgroup title | No. of studies | No. of participants | Statistical method | Effect size |
| 1 Fasting plasma glucose (mg/dl) at cycle 6 Show forest plot | 1 | 85 | Mean Difference (IV, Fixed, 95% CI) | 1.14 [‐1.74, 4.02] |
| Analysis 23.1  Comparison 23 Norethindrone 500‐1000‐500 µg + EE 35 µg versus norethindrone 500‐750‐1000 µg + EE 35 µg, Outcome 1 Fasting plasma glucose (mg/dl) at cycle 6. | ||||
| 2 Fasting plasma insulin (µg/dl) at cycle 6 Show forest plot | 1 | 90 | Mean Difference (IV, Fixed, 95% CI) | 0.45 [‐2.63, 3.53] |
| Analysis 23.2  Comparison 23 Norethindrone 500‐1000‐500 µg + EE 35 µg versus norethindrone 500‐750‐1000 µg + EE 35 µg, Outcome 2 Fasting plasma insulin (µg/dl) at cycle 6. | ||||
| 3 Glucose AUC (h x µg/dl) at cycle 6 Show forest plot | 1 | 85 | Mean Difference (IV, Fixed, 95% CI) | 8.0 [‐17.31, 33.31] |
| Analysis 23.3  Comparison 23 Norethindrone 500‐1000‐500 µg + EE 35 µg versus norethindrone 500‐750‐1000 µg + EE 35 µg, Outcome 3 Glucose AUC (h x µg/dl) at cycle 6. | ||||
| 4 Insulin AUC (h x µg/dl) at cycle 6 Show forest plot | 1 | 90 | Mean Difference (IV, Fixed, 95% CI) | 2.0 [‐35.64, 39.64] |
| Analysis 23.4  Comparison 23 Norethindrone 500‐1000‐500 µg + EE 35 µg versus norethindrone 500‐750‐1000 µg + EE 35 µg, Outcome 4 Insulin AUC (h x µg/dl) at cycle 6. | ||||
| Outcome or subgroup title | No. of studies | No. of participants | Statistical method | Effect size |
| 1 Fasting serum glucose (mg/dl) after 12 months Show forest plot | 1 | 40 | Mean Difference (IV, Fixed, 95% CI) | 10.05 [3.16, 16.94] |
| Analysis 24.1  Comparison 24 Depot medroxyprogesterone acetate 150 mg versus norethisterone enanthate 200 mg, Outcome 1 Fasting serum glucose (mg/dl) after 12 months. | ||||
| 2 Glucose 2‐hr response (mg/dl) after 12 months Show forest plot | 1 | 40 | Mean Difference (IV, Fixed, 95% CI) | 17.0 [5.67, 28.33] |
| Analysis 24.2  Comparison 24 Depot medroxyprogesterone acetate 150 mg versus norethisterone enanthate 200 mg, Outcome 2 Glucose 2‐hr response (mg/dl) after 12 months. | ||||
| 3 Fasting serum insulin (nU/ml) after 12 months Show forest plot | 1 | 40 | Mean Difference (IV, Fixed, 95% CI) | 3.40 [2.07, 4.73] |
| Analysis 24.3  Comparison 24 Depot medroxyprogesterone acetate 150 mg versus norethisterone enanthate 200 mg, Outcome 3 Fasting serum insulin (nU/ml) after 12 months. | ||||
| 4 Insulin 2‐hr response (nU/ml) after 12 months Show forest plot | 1 | 40 | Mean Difference (IV, Fixed, 95% CI) | 20.0 [‐47.41, 87.41] |
| Analysis 24.4  Comparison 24 Depot medroxyprogesterone acetate 150 mg versus norethisterone enanthate 200 mg, Outcome 4 Insulin 2‐hr response (nU/ml) after 12 months. | ||||
| Outcome or subgroup title | No. of studies | No. of participants | Statistical method | Effect size |
| 1 Fasting plasma glucose (mg/dl) at cycle 6 Show forest plot | 1 | 48 | Mean Difference (IV, Fixed, 95% CI) | 0.60 [‐2.33, 3.53] |
| Analysis 25.1 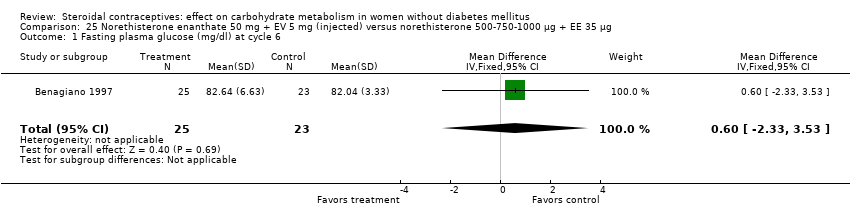 Comparison 25 Norethisterone enanthate 50 mg + EV 5 mg (injected) versus norethisterone 500‐750‐1000 µg + EE 35 µg, Outcome 1 Fasting plasma glucose (mg/dl) at cycle 6. | ||||
| 2 Fasting plasma insulin (µU/ml) at cycle 6 Show forest plot | 1 | 48 | Mean Difference (IV, Fixed, 95% CI) | 0.28 [‐0.84, 1.40] |
| Analysis 25.2  Comparison 25 Norethisterone enanthate 50 mg + EV 5 mg (injected) versus norethisterone 500‐750‐1000 µg + EE 35 µg, Outcome 2 Fasting plasma insulin (µU/ml) at cycle 6. | ||||
| 3 Plasma glucose rate of disappearance (mg/kg/min) at cycle 6 Show forest plot | 1 | 48 | Mean Difference (IV, Fixed, 95% CI) | 0.11 [‐0.19, 0.41] |
| Analysis 25.3 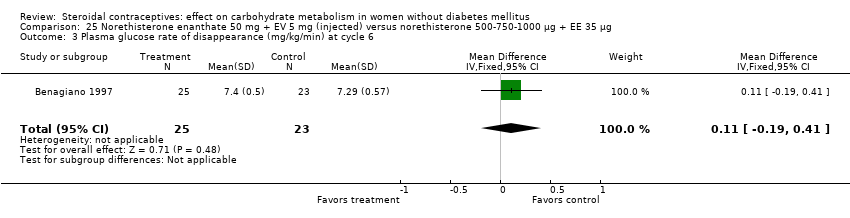 Comparison 25 Norethisterone enanthate 50 mg + EV 5 mg (injected) versus norethisterone 500‐750‐1000 µg + EE 35 µg, Outcome 3 Plasma glucose rate of disappearance (mg/kg/min) at cycle 6. | ||||
| Outcome or subgroup title | No. of studies | No. of participants | Statistical method | Effect size |
| 1 Fasting serum glucose (mmol/L) at cycle 9 Show forest plot | 1 | 298 | Mean Difference (IV, Fixed, 95% CI) | 0.07 [‐0.06, 0.20] |
| Analysis 26.1  Comparison 26 Norethisterone enanthate 50 mg + EV 5 mg versus medroxyprogesterone acetate 25 mg + estradiol cypionate 5 mg, Outcome 1 Fasting serum glucose (mmol/L) at cycle 9. | ||||
| 2 Serum glucose 2‐h response (mmol/L) at cycle 9 Show forest plot | 1 | 298 | Mean Difference (IV, Fixed, 95% CI) | 0.14 [‐0.06, 0.34] |
| Analysis 26.2 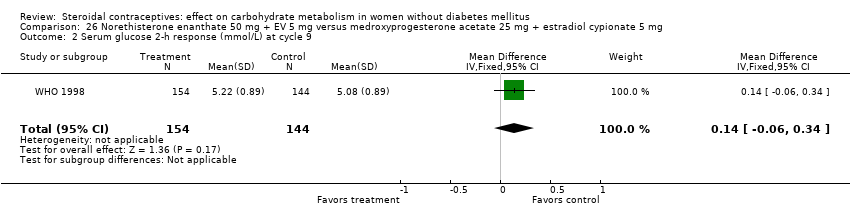 Comparison 26 Norethisterone enanthate 50 mg + EV 5 mg versus medroxyprogesterone acetate 25 mg + estradiol cypionate 5 mg, Outcome 2 Serum glucose 2‐h response (mmol/L) at cycle 9. | ||||
| 3 Abnormal fasting serum glucose at cycle 9 Show forest plot | 1 | 298 | Odds Ratio (M‐H, Fixed, 95% CI) | 0.93 [0.06, 15.08] |
| Analysis 26.3  Comparison 26 Norethisterone enanthate 50 mg + EV 5 mg versus medroxyprogesterone acetate 25 mg + estradiol cypionate 5 mg, Outcome 3 Abnormal fasting serum glucose at cycle 9. | ||||
| Outcome or subgroup title | No. of studies | No. of participants | Statistical method | Effect size |
| 1 Blood glucose ("random") (mg/dl) at 12 months Show forest plot | 1 | 54 | Mean Difference (IV, Fixed, 95% CI) | ‐0.90 [‐8.61, 6.81] |
| Analysis 27.1  Comparison 27 Biphasic levonorgestrel 50‐125 µg + EE 50 µg versus levonorgestrel 150 µg + EE 30 µg, Outcome 1 Blood glucose ("random") (mg/dl) at 12 months. | ||||
| Outcome or subgroup title | No. of studies | No. of participants | Statistical method | Effect size |
| 1 Fasting plasma glucose (mmol/L) at cycle 6 Show forest plot | 1 | 38 | Mean Difference (IV, Fixed, 95% CI) | 0.10 [‐0.18, 0.38] |
| Analysis 28.1  Comparison 28 Gestodene 50‐70‐100 µg + EE 30‐40‐30 µg levonorgestrel 50‐75‐125 µg + EE 30‐40‐30 µg, Outcome 1 Fasting plasma glucose (mmol/L) at cycle 6. | ||||
| 2 Fasting glycosylated hemoglobin (%) at cycle 6 Show forest plot | 1 | 38 | Mean Difference (IV, Fixed, 95% CI) | ‐0.30 [‐0.85, 0.25] |
| Analysis 28.2 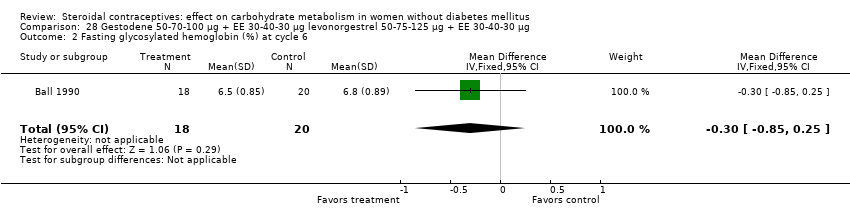 Comparison 28 Gestodene 50‐70‐100 µg + EE 30‐40‐30 µg levonorgestrel 50‐75‐125 µg + EE 30‐40‐30 µg, Outcome 2 Fasting glycosylated hemoglobin (%) at cycle 6. | ||||
Comparison 1 Desogestrel 150 µg + EE 20 µg versus desogestrel 150 µg + EE 30 µg, Outcome 1 Fasting serum glucose (mg/dl) at cycle 3.
Comparison 1 Desogestrel 150 µg + EE 20 µg versus desogestrel 150 µg + EE 30 µg, Outcome 2 Fasting serum insulin (µU/ml) at cycle 3.
Comparison 1 Desogestrel 150 µg + EE 20 µg versus desogestrel 150 µg + EE 30 µg, Outcome 3 Glucose AUC (h x mg/dl) at cycle 3.
Comparison 1 Desogestrel 150 µg + EE 20 µg versus desogestrel 150 µg + EE 30 µg, Outcome 4 Insulin AUC (h x µU/ml) at cycle 3.
Comparison 1 Desogestrel 150 µg + EE 20 µg versus desogestrel 150 µg + EE 30 µg, Outcome 5 Change in fasting glycosylated hemoglobin (%) at cycle 3.
Comparison 1 Desogestrel 150 µg + EE 20 µg versus desogestrel 150 µg + EE 30 µg, Outcome 6 Fasting blood glucose (mmol/L) at cycle 6.
Comparison 1 Desogestrel 150 µg + EE 20 µg versus desogestrel 150 µg + EE 30 µg, Outcome 7 Fasting blood insulin (µU/ml) at cycle 6.
Comparison 1 Desogestrel 150 µg + EE 20 µg versus desogestrel 150 µg + EE 30 µg, Outcome 8 Change in insulin AUC (µU/mL) by 6 months.
Comparison 2 Desogestrel 150 µg + EE 30 µg versus levonorgestrel 150 µg + EE 30 µg, Outcome 1 Fasting serum glucose (mg/dl) at cycle 3.
Comparison 2 Desogestrel 150 µg + EE 30 µg versus levonorgestrel 150 µg + EE 30 µg, Outcome 2 Fasting serum insulin (µU/ml) at cycle 3.
Comparison 2 Desogestrel 150 µg + EE 30 µg versus levonorgestrel 150 µg + EE 30 µg, Outcome 3 Glucose AUC (h x mg/dl) in cycle 3.
Comparison 2 Desogestrel 150 µg + EE 30 µg versus levonorgestrel 150 µg + EE 30 µg, Outcome 4 Insulin AUC (h x µU/ml) in cycle 3.
Comparison 2 Desogestrel 150 µg + EE 30 µg versus levonorgestrel 150 µg + EE 30 µg, Outcome 5 Change in fasting glycosylated hemoglobin (%) in cycle 3.
Comparison 2 Desogestrel 150 µg + EE 30 µg versus levonorgestrel 150 µg + EE 30 µg, Outcome 6 Fasting blood glucose (mmol/l) at cycle 6.
Comparison 2 Desogestrel 150 µg + EE 30 µg versus levonorgestrel 150 µg + EE 30 µg, Outcome 7 Fasting blood glucose (mmol/l) at cycle 12.
Comparison 2 Desogestrel 150 µg + EE 30 µg versus levonorgestrel 150 µg + EE 30 µg, Outcome 8 Fasting blood glucose (mmol/l) at cycle 24.
Comparison 2 Desogestrel 150 µg + EE 30 µg versus levonorgestrel 150 µg + EE 30 µg, Outcome 9 Glucose 2‐h response (mmol/l) at cycle 6.
Comparison 2 Desogestrel 150 µg + EE 30 µg versus levonorgestrel 150 µg + EE 30 µg, Outcome 10 Glucose 2‐h response (mmol/l) at cycle 12.
Comparison 3 Desogestrel 150 µg + EE 20 µg versus gestodene 60 µg + EE 15 µg, Outcome 1 Fasting blood glucose (mmol/L) at cycle 6.
Comparison 3 Desogestrel 150 µg + EE 20 µg versus gestodene 60 µg + EE 15 µg, Outcome 2 Fasting blood insulin (mlU/L) at cycle 6.
Comparison 3 Desogestrel 150 µg + EE 20 µg versus gestodene 60 µg + EE 15 µg, Outcome 3 Fasting C‐peptide (pmol/L) at cycle 6.
Comparison 3 Desogestrel 150 µg + EE 20 µg versus gestodene 60 µg + EE 15 µg, Outcome 4 Glucose AUC (min x mmol/L) at cycle 6.
Comparison 3 Desogestrel 150 µg + EE 20 µg versus gestodene 60 µg + EE 15 µg, Outcome 5 Insulin AUC (min x mlU/L) at cycle 6.
Comparison 3 Desogestrel 150 µg + EE 20 µg versus gestodene 60 µg + EE 15 µg, Outcome 6 C‐peptide AUC (min x nmol/L) at cycle 6.
Comparison 4 Desogestrel 150 µg + EE 30 µg versus gestodene 75 µg + EE 20 µg, Outcome 1 Fasting plasma glucose (mg/dL) after 6 cycles.
Comparison 4 Desogestrel 150 µg + EE 30 µg versus gestodene 75 µg + EE 20 µg, Outcome 2 Fasting plasma insulin (µU/ml) after 6 cycles.
Comparison 4 Desogestrel 150 µg + EE 30 µg versus gestodene 75 µg + EE 20 µg, Outcome 3 Fasting plasma insulin (mIU/ml) after 6 cycles.
Comparison 4 Desogestrel 150 µg + EE 30 µg versus gestodene 75 µg + EE 20 µg, Outcome 4 Fasting C‐peptide (pmol/L) after 6 cycles.
Comparison 4 Desogestrel 150 µg + EE 30 µg versus gestodene 75 µg + EE 20 µg, Outcome 5 Glucose AUC (h x g/L) after 6 cycles.
Comparison 4 Desogestrel 150 µg + EE 30 µg versus gestodene 75 µg + EE 20 µg, Outcome 6 Insulin AUC (h x IU/ml) after 6 cycles.
Comparison 4 Desogestrel 150 µg + EE 30 µg versus gestodene 75 µg + EE 20 µg, Outcome 7 C‐peptide AUC (h x pmol/L) after 6 cycles.
Comparison 4 Desogestrel 150 µg + EE 30 µg versus gestodene 75 µg + EE 20 µg, Outcome 8 Fasting glucose (g/L) after 13 cycles.
Comparison 4 Desogestrel 150 µg + EE 30 µg versus gestodene 75 µg + EE 20 µg, Outcome 9 Fasting insulin (IU/ml) after 13 cycles.
Comparison 4 Desogestrel 150 µg + EE 30 µg versus gestodene 75 µg + EE 20 µg, Outcome 10 Fasting C‐peptide (pmol/L) after 13 cycles.
Comparison 4 Desogestrel 150 µg + EE 30 µg versus gestodene 75 µg + EE 20 µg, Outcome 11 Glucose AUC (h x g/L) after 13 cycles.
Comparison 4 Desogestrel 150 µg + EE 30 µg versus gestodene 75 µg + EE 20 µg, Outcome 12 Insulin AUC (h x IU/ml) after 13 cycles.
Comparison 4 Desogestrel 150 µg + EE 30 µg versus gestodene 75 µg + EE 20 µg, Outcome 13 C‐peptide AUC (h x pmol/L) after 13 cycles.
Comparison 5 Desogestrel 150 µg + EE 20 µg versus gestodene 75 µg + EE 20 µg, Outcome 1 Fasting plasma glucose (mg/dL) after cycle 6.
Comparison 5 Desogestrel 150 µg + EE 20 µg versus gestodene 75 µg + EE 20 µg, Outcome 2 Fasting plasma insulin (mIU/mL) after cycle 6.
Comparison 6 Desogestrel 150 µg + EE 30 µg versus gestodene 75 µg + EE 30 µg, Outcome 1 Fasting plasma glucose (mg/dL) after cycle 6.
Comparison 6 Desogestrel 150 µg + EE 30 µg versus gestodene 75 µg + EE 30 µg, Outcome 2 Fasting plasma insulin (mIU/mL) after cycle 6.
Comparison 7 Desogestrel 150 µg + EE 30 µg versus desogestrel 125 µg + EE 50 µg, Outcome 1 Glucose AUC (mg/dl) at 6 months.
Comparison 7 Desogestrel 150 µg + EE 30 µg versus desogestrel 125 µg + EE 50 µg, Outcome 2 Insulin AUC at 6 months.
Comparison 8 Desogestrel 150 µg + EE 20 µg versus chlormadinone acetete 2 mg + EE 30 µg, Outcome 1 Glucose AUC (mmol/L) at 6 months.
Comparison 8 Desogestrel 150 µg + EE 20 µg versus chlormadinone acetete 2 mg + EE 30 µg, Outcome 2 Insulin AUC (pmol/L) at 6 months.
Comparison 8 Desogestrel 150 µg + EE 20 µg versus chlormadinone acetete 2 mg + EE 30 µg, Outcome 3 C‐peptide AUC (pmol/L) at 6 months.
Comparison 9 Desogestrel 150 µg + EE 30 µg versus levonorgestrel 50‐75‐125 µg + EE 30‐40‐30 µg, Outcome 1 Glucose AUC (mg/dl) at 6 months.
Comparison 9 Desogestrel 150 µg + EE 30 µg versus levonorgestrel 50‐75‐125 µg + EE 30‐40‐30 µg, Outcome 2 Insulin AUC at 6 months.
Comparison 9 Desogestrel 150 µg + EE 30 µg versus levonorgestrel 50‐75‐125 µg + EE 30‐40‐30 µg, Outcome 3 Fasting blood glucose (mmol/l) at cycle 6.
Comparison 9 Desogestrel 150 µg + EE 30 µg versus levonorgestrel 50‐75‐125 µg + EE 30‐40‐30 µg, Outcome 4 Fasting blood glucose (mmol/l) at cycle 12.
Comparison 9 Desogestrel 150 µg + EE 30 µg versus levonorgestrel 50‐75‐125 µg + EE 30‐40‐30 µg, Outcome 5 Glucose 2‐h response (mmol/l) at cycle 6.
Comparison 9 Desogestrel 150 µg + EE 30 µg versus levonorgestrel 50‐75‐125 µg + EE 30‐40‐30 µg, Outcome 6 Glucose 2‐h response (mmol/l) at cycle 12.
Comparison 10 Desogestrel 125 µg + EE 50 µg versus levonorgestrel 50‐75‐125 µg + EE 30‐40‐30 µg, Outcome 1 Glucose AUC (mg/dl) at 6 months.
Comparison 10 Desogestrel 125 µg + EE 50 µg versus levonorgestrel 50‐75‐125 µg + EE 30‐40‐30 µg, Outcome 2 Insulin AUC at 6 months.
Comparison 11 Desogestrel 50‐100‐150 µg + EE 35‐30‐30 µg versus levonorgestrel 50‐75‐125 µg + EE 30‐40‐30 µg, Outcome 1 Change in glucose (mg/dL) from fasting to 1 h after 400 kcal drink at cycle 6.
Comparison 11 Desogestrel 50‐100‐150 µg + EE 35‐30‐30 µg versus levonorgestrel 50‐75‐125 µg + EE 30‐40‐30 µg, Outcome 2 Change in insulin (µU/ml) from fasting to 1 h after 400 kcal drink at cycle 6.
Comparison 12 Etonogestrel 120 µg + EE 15 µg (vaginal ring) versus desogestrel 150 µg + (EE 20 µg or EE 30 µg), Outcome 1 Change in glucose AUC (mg/dL) by 6 months.
Comparison 12 Etonogestrel 120 µg + EE 15 µg (vaginal ring) versus desogestrel 150 µg + (EE 20 µg or EE 30 µg), Outcome 2 Change in insulin AUC (µU/mL) by 6 months.
Comparison 12 Etonogestrel 120 µg + EE 15 µg (vaginal ring) versus desogestrel 150 µg + (EE 20 µg or EE 30 µg), Outcome 3 Change in C‐peptide AUC (ng/mL) by 6 months.
Comparison 13 Etonogestrel 120 µg + EE 15 µg (vaginal ring) versus levonorgestrel 150 µg + EE 30 µg, Outcome 1 Glucose AUC (hr x mmol/L) at cycle 6.
Comparison 13 Etonogestrel 120 µg + EE 15 µg (vaginal ring) versus levonorgestrel 150 µg + EE 30 µg, Outcome 2 Insulin AUC (hr x pmol/L) at cycle 6.
Comparison 13 Etonogestrel 120 µg + EE 15 µg (vaginal ring) versus levonorgestrel 150 µg + EE 30 µg, Outcome 3 Fasting glycosylated hemoglobin (%) at cycle 6.
Comparison 14 Etonogestrel 120 µg + EE 15 µg (vaginal ring) versus levonorgestrel 100 µg + EE 20 µg, Outcome 1 Impaired glucose tolerance at cycle 5.
Comparison 14 Etonogestrel 120 µg + EE 15 µg (vaginal ring) versus levonorgestrel 100 µg + EE 20 µg, Outcome 2 Insulin sensitivity at cycle 5.
Comparison 15 Etonogestrel 68 mg (implant) versus levonorgestrel 216 mg (implant), Outcome 1 Fasting plasma glucose (mmol/L) at 12 months.
Comparison 15 Etonogestrel 68 mg (implant) versus levonorgestrel 216 mg (implant), Outcome 2 Fasting plasma glucose at 24 months.
Comparison 15 Etonogestrel 68 mg (implant) versus levonorgestrel 216 mg (implant), Outcome 3 Fasting plasma insulin (pmol/L) at 12 months.
Comparison 15 Etonogestrel 68 mg (implant) versus levonorgestrel 216 mg (implant), Outcome 4 Fasting plasma insulin (pmol/L) at 24 months.
Comparison 15 Etonogestrel 68 mg (implant) versus levonorgestrel 216 mg (implant), Outcome 5 Fasting glycosylated hemoglobin (%) at 12 months.
Comparison 15 Etonogestrel 68 mg (implant) versus levonorgestrel 216 mg (implant), Outcome 6 Fasting glycosylated hemoglobin (%) at 24 months.
Comparison 15 Etonogestrel 68 mg (implant) versus levonorgestrel 216 mg (implant), Outcome 7 Glucose incremental AUC (min x mmol/L) at 12 months.
Comparison 15 Etonogestrel 68 mg (implant) versus levonorgestrel 216 mg (implant), Outcome 8 Glucose incremental AUC (min x mmol/L) at 24 months.
Comparison 15 Etonogestrel 68 mg (implant) versus levonorgestrel 216 mg (implant), Outcome 9 Insulin incremental AUC (min x nmol/L) at 12 months.
Comparison 15 Etonogestrel 68 mg (implant) versus levonorgestrel 216 mg (implant), Outcome 10 Insulin incremental AUC (min x nmol/L) at 24 months.
Comparison 16 Drospirenone 3 mg + EE 20 µg versus desogestrel 150 µg + EE 20 µg, Outcome 1 Change in fasting blood insulin (mU/L) at cycle 7.
Comparison 16 Drospirenone 3 mg + EE 20 µg versus desogestrel 150 µg + EE 20 µg, Outcome 2 Change in glucose AUC (h x mg/L) at cycle 7.
Comparison 16 Drospirenone 3 mg + EE 20 µg versus desogestrel 150 µg + EE 20 µg, Outcome 3 Change in fasting C‐peptide (ng/mL) at cycle 7.
Comparison 16 Drospirenone 3 mg + EE 20 µg versus desogestrel 150 µg + EE 20 µg, Outcome 4 Change in C‐peptide 2‐h response (ng/mL) at cycle 7.
Comparison 17 Drospirenone 3 mg + EE 30 µg versus desogestrel 150 µg + EE 30 µg, Outcome 1 Change in fasting plasma glucose (mg/dL) by cycle 13.
Comparison 17 Drospirenone 3 mg + EE 30 µg versus desogestrel 150 µg + EE 30 µg, Outcome 2 Change in fasting plasma insulin (µU/mL) by cycle 13.
Comparison 17 Drospirenone 3 mg + EE 30 µg versus desogestrel 150 µg + EE 30 µg, Outcome 3 Change in fasting C‐peptide (µmol/L) by cycle 13.
Comparison 17 Drospirenone 3 mg + EE 30 µg versus desogestrel 150 µg + EE 30 µg, Outcome 4 Change in fasting free fatty acids (µEq/L) by cycle 13.
Comparison 17 Drospirenone 3 mg + EE 30 µg versus desogestrel 150 µg + EE 30 µg, Outcome 5 Change in glucose AUC (h x mg/dL) by cycle 13.
Comparison 17 Drospirenone 3 mg + EE 30 µg versus desogestrel 150 µg + EE 30 µg, Outcome 6 Change in insulin AUC (h x µU/mL) by cycle 13.
Comparison 17 Drospirenone 3 mg + EE 30 µg versus desogestrel 150 µg + EE 30 µg, Outcome 7 Change in C‐peptide AUC (h x µmol/L) by cycle 13.
Comparison 17 Drospirenone 3 mg + EE 30 µg versus desogestrel 150 µg + EE 30 µg, Outcome 8 Change in free fatty acids AUC (h x µEq/L) by cycle 13.
Comparison 18 Norethisterone 1000 µg + EE 35 µg versus levonorgestrel 150 µg + EE 30 µg, Outcome 1 Fasting serum glucose (mg/dL) at 12 months.
Comparison 18 Norethisterone 1000 µg + EE 35 µg versus levonorgestrel 150 µg + EE 30 µg, Outcome 2 Change in fasting blood glucose (mg/dL) at 12 months.
Comparison 18 Norethisterone 1000 µg + EE 35 µg versus levonorgestrel 150 µg + EE 30 µg, Outcome 3 Glucose 2‐h response (mg/dL) at 12 months.
Comparison 18 Norethisterone 1000 µg + EE 35 µg versus levonorgestrel 150 µg + EE 30 µg, Outcome 4 Change in glucose 2‐h response (mg/dL) at 12 months.
Comparison 19 Norethisterone 350 µg versus levonorgestrel 30 µg, Outcome 1 Fasting plasma glucose (mmol/L) at 6 months.
Comparison 19 Norethisterone 350 µg versus levonorgestrel 30 µg, Outcome 2 Fasting glycosylated hemoglobin (%) at 6 months.
Comparison 19 Norethisterone 350 µg versus levonorgestrel 30 µg, Outcome 3 Abnormal fasting plasma glucose at 6 months.
Comparison 19 Norethisterone 350 µg versus levonorgestrel 30 µg, Outcome 4 Abnormal fasting glycosylated hemoglobin at 6 months.
Comparison 20 Norethindrone 500‐750‐1000 µg + EE 35 µg versus levonorgestrel 100 µg + EE 20 µg, Outcome 1 Change in glucose (mmol/L) from baseline to cycle 4.
Comparison 21 Norethindrone 500‐750‐1000 µg + EE 35 µg versus levonorgestrel 50‐75‐125 µg + EE 30‐40‐30 µg, Outcome 1 Fasting plasma glucose (mg/dl) at cycle 6.
Comparison 21 Norethindrone 500‐750‐1000 µg + EE 35 µg versus levonorgestrel 50‐75‐125 µg + EE 30‐40‐30 µg, Outcome 2 Fasting plasma glucose (mg/dl) at cycle 12.
Comparison 21 Norethindrone 500‐750‐1000 µg + EE 35 µg versus levonorgestrel 50‐75‐125 µg + EE 30‐40‐30 µg, Outcome 3 Fasting plasma insulin (µg/dl) at cycle 6.
Comparison 21 Norethindrone 500‐750‐1000 µg + EE 35 µg versus levonorgestrel 50‐75‐125 µg + EE 30‐40‐30 µg, Outcome 4 Fasting plasma insulin (µU/ml) at cycle 6.
Comparison 21 Norethindrone 500‐750‐1000 µg + EE 35 µg versus levonorgestrel 50‐75‐125 µg + EE 30‐40‐30 µg, Outcome 5 Fasting plasma insulin (µU/ml) at cycle 12.
Comparison 21 Norethindrone 500‐750‐1000 µg + EE 35 µg versus levonorgestrel 50‐75‐125 µg + EE 30‐40‐30 µg, Outcome 6 Glucose AUC (h x mg/dl) at cycle 6.
Comparison 21 Norethindrone 500‐750‐1000 µg + EE 35 µg versus levonorgestrel 50‐75‐125 µg + EE 30‐40‐30 µg, Outcome 7 Glucose AUC (h x mg/dl) at cycle 12.
Comparison 21 Norethindrone 500‐750‐1000 µg + EE 35 µg versus levonorgestrel 50‐75‐125 µg + EE 30‐40‐30 µg, Outcome 8 Insulin AUC (h x µg/dl) at cycle 6.
Comparison 21 Norethindrone 500‐750‐1000 µg + EE 35 µg versus levonorgestrel 50‐75‐125 µg + EE 30‐40‐30 µg, Outcome 9 Insulin AUC (h x µU/mL) at cycle 6.
Comparison 21 Norethindrone 500‐750‐1000 µg + EE 35 µg versus levonorgestrel 50‐75‐125 µg + EE 30‐40‐30 µg, Outcome 10 Insulin AUC (h x µU/mL) at cycle 12.
Comparison 22 Norethindrone 500‐1000‐500 µg + EE 35 µg versus levonorgestrel 50‐75‐125 µg + EE 30‐40‐30 µg, Outcome 1 Fasting plasma glucose (mg/dl) at cycle 6.
Comparison 22 Norethindrone 500‐1000‐500 µg + EE 35 µg versus levonorgestrel 50‐75‐125 µg + EE 30‐40‐30 µg, Outcome 2 Glucose AUC (h x µg/dl) at cycle 6.
Comparison 22 Norethindrone 500‐1000‐500 µg + EE 35 µg versus levonorgestrel 50‐75‐125 µg + EE 30‐40‐30 µg, Outcome 3 Fasting plasma insulin (µg/dl) at cycle 6.
Comparison 22 Norethindrone 500‐1000‐500 µg + EE 35 µg versus levonorgestrel 50‐75‐125 µg + EE 30‐40‐30 µg, Outcome 4 Insulin AUC (h x µg/dl) at cycle 6.
Comparison 23 Norethindrone 500‐1000‐500 µg + EE 35 µg versus norethindrone 500‐750‐1000 µg + EE 35 µg, Outcome 1 Fasting plasma glucose (mg/dl) at cycle 6.
Comparison 23 Norethindrone 500‐1000‐500 µg + EE 35 µg versus norethindrone 500‐750‐1000 µg + EE 35 µg, Outcome 2 Fasting plasma insulin (µg/dl) at cycle 6.
Comparison 23 Norethindrone 500‐1000‐500 µg + EE 35 µg versus norethindrone 500‐750‐1000 µg + EE 35 µg, Outcome 3 Glucose AUC (h x µg/dl) at cycle 6.
Comparison 23 Norethindrone 500‐1000‐500 µg + EE 35 µg versus norethindrone 500‐750‐1000 µg + EE 35 µg, Outcome 4 Insulin AUC (h x µg/dl) at cycle 6.
Comparison 24 Depot medroxyprogesterone acetate 150 mg versus norethisterone enanthate 200 mg, Outcome 1 Fasting serum glucose (mg/dl) after 12 months.
Comparison 24 Depot medroxyprogesterone acetate 150 mg versus norethisterone enanthate 200 mg, Outcome 2 Glucose 2‐hr response (mg/dl) after 12 months.
Comparison 24 Depot medroxyprogesterone acetate 150 mg versus norethisterone enanthate 200 mg, Outcome 3 Fasting serum insulin (nU/ml) after 12 months.
Comparison 24 Depot medroxyprogesterone acetate 150 mg versus norethisterone enanthate 200 mg, Outcome 4 Insulin 2‐hr response (nU/ml) after 12 months.
Comparison 25 Norethisterone enanthate 50 mg + EV 5 mg (injected) versus norethisterone 500‐750‐1000 µg + EE 35 µg, Outcome 1 Fasting plasma glucose (mg/dl) at cycle 6.
Comparison 25 Norethisterone enanthate 50 mg + EV 5 mg (injected) versus norethisterone 500‐750‐1000 µg + EE 35 µg, Outcome 2 Fasting plasma insulin (µU/ml) at cycle 6.
Comparison 25 Norethisterone enanthate 50 mg + EV 5 mg (injected) versus norethisterone 500‐750‐1000 µg + EE 35 µg, Outcome 3 Plasma glucose rate of disappearance (mg/kg/min) at cycle 6.
Comparison 26 Norethisterone enanthate 50 mg + EV 5 mg versus medroxyprogesterone acetate 25 mg + estradiol cypionate 5 mg, Outcome 1 Fasting serum glucose (mmol/L) at cycle 9.
Comparison 26 Norethisterone enanthate 50 mg + EV 5 mg versus medroxyprogesterone acetate 25 mg + estradiol cypionate 5 mg, Outcome 2 Serum glucose 2‐h response (mmol/L) at cycle 9.
Comparison 26 Norethisterone enanthate 50 mg + EV 5 mg versus medroxyprogesterone acetate 25 mg + estradiol cypionate 5 mg, Outcome 3 Abnormal fasting serum glucose at cycle 9.
Comparison 27 Biphasic levonorgestrel 50‐125 µg + EE 50 µg versus levonorgestrel 150 µg + EE 30 µg, Outcome 1 Blood glucose ("random") (mg/dl) at 12 months.
Comparison 28 Gestodene 50‐70‐100 µg + EE 30‐40‐30 µg levonorgestrel 50‐75‐125 µg + EE 30‐40‐30 µg, Outcome 1 Fasting plasma glucose (mmol/L) at cycle 6.
Comparison 28 Gestodene 50‐70‐100 µg + EE 30‐40‐30 µg levonorgestrel 50‐75‐125 µg + EE 30‐40‐30 µg, Outcome 2 Fasting glycosylated hemoglobin (%) at cycle 6.
| Outcome or subgroup title | No. of studies | No. of participants | Statistical method | Effect size |
| 1 Fasting serum glucose (mg/dl) at cycle 3 Show forest plot | 1 | 24 | Mean Difference (IV, Fixed, 95% CI) | 6.60 [2.41, 10.79] |
| 2 Fasting serum insulin (µU/ml) at cycle 3 Show forest plot | 1 | 24 | Mean Difference (IV, Fixed, 95% CI) | ‐0.70 [‐3.33, 1.93] |
| 3 Glucose AUC (h x mg/dl) at cycle 3 Show forest plot | 1 | 24 | Mean Difference (IV, Fixed, 95% CI) | 0.0 [‐25.21, 25.21] |
| 4 Insulin AUC (h x µU/ml) at cycle 3 Show forest plot | 1 | 24 | Mean Difference (IV, Fixed, 95% CI) | ‐1.30 [‐31.87, 29.27] |
| 5 Change in fasting glycosylated hemoglobin (%) at cycle 3 Show forest plot | 1 | 24 | Mean Difference (IV, Fixed, 95% CI) | 0.20 [‐0.45, 0.85] |
| 6 Fasting blood glucose (mmol/L) at cycle 6 Show forest plot | 1 | 49 | Mean Difference (IV, Fixed, 95% CI) | 0.0 [‐0.22, 0.22] |
| 7 Fasting blood insulin (µU/ml) at cycle 6 Show forest plot | 1 | 49 | Mean Difference (IV, Fixed, 95% CI) | 0.30 [‐2.41, 3.01] |
| 8 Change in insulin AUC (µU/mL) by 6 months Show forest plot | 1 | 20 | Mean Difference (IV, Fixed, 95% CI) | ‐0.69 [‐2.38, 1.00] |
| Outcome or subgroup title | No. of studies | No. of participants | Statistical method | Effect size |
| 1 Fasting serum glucose (mg/dl) at cycle 3 Show forest plot | 1 | 24 | Mean Difference (IV, Fixed, 95% CI) | ‐1.70 [‐7.81, 4.41] |
| 2 Fasting serum insulin (µU/ml) at cycle 3 Show forest plot | 1 | 24 | Mean Difference (IV, Fixed, 95% CI) | ‐0.10 [‐2.80, 2.60] |
| 3 Glucose AUC (h x mg/dl) in cycle 3 Show forest plot | 1 | 24 | Mean Difference (IV, Fixed, 95% CI) | ‐23.40 [‐51.08, 4.28] |
| 4 Insulin AUC (h x µU/ml) in cycle 3 Show forest plot | 1 | 24 | Mean Difference (IV, Fixed, 95% CI) | ‐18.0 [‐49.41, 13.41] |
| 5 Change in fasting glycosylated hemoglobin (%) in cycle 3 Show forest plot | 1 | 24 | Mean Difference (IV, Fixed, 95% CI) | ‐0.20 [‐0.85, 0.45] |
| 6 Fasting blood glucose (mmol/l) at cycle 6 Show forest plot | 2 | 72 | Mean Difference (IV, Fixed, 95% CI) | 0.20 [0.00, 0.41] |
| 7 Fasting blood glucose (mmol/l) at cycle 12 Show forest plot | 2 | 62 | Mean Difference (IV, Fixed, 95% CI) | 0.15 [‐0.08, 0.38] |
| 8 Fasting blood glucose (mmol/l) at cycle 24 Show forest plot | 1 | 17 | Mean Difference (IV, Fixed, 95% CI) | ‐0.40 [‐0.72, ‐0.08] |
| 9 Glucose 2‐h response (mmol/l) at cycle 6 Show forest plot | 1 | 52 | Mean Difference (IV, Fixed, 95% CI) | ‐0.01 [‐0.97, 0.95] |
| 10 Glucose 2‐h response (mmol/l) at cycle 12 Show forest plot | 1 | 44 | Mean Difference (IV, Fixed, 95% CI) | 1.08 [0.45, 1.71] |
| Outcome or subgroup title | No. of studies | No. of participants | Statistical method | Effect size |
| 1 Fasting blood glucose (mmol/L) at cycle 6 Show forest plot | 1 | 118 | Mean Difference (IV, Fixed, 95% CI) | 0.0 [‐0.15, 0.15] |
| 2 Fasting blood insulin (mlU/L) at cycle 6 Show forest plot | 1 | 118 | Mean Difference (IV, Fixed, 95% CI) | ‐0.40 [‐2.34, 1.54] |
| 3 Fasting C‐peptide (pmol/L) at cycle 6 Show forest plot | 1 | 118 | Mean Difference (IV, Fixed, 95% CI) | ‐0.04 [‐0.12, 0.04] |
| 4 Glucose AUC (min x mmol/L) at cycle 6 Show forest plot | 1 | 116 | Mean Difference (IV, Fixed, 95% CI) | 42.00 [‐26.35, 110.35] |
| 5 Insulin AUC (min x mlU/L) at cycle 6 Show forest plot | 1 | 116 | Mean Difference (IV, Fixed, 95% CI) | ‐327.00 [‐1807.37, 1153.37] |
| 6 C‐peptide AUC (min x nmol/L) at cycle 6 Show forest plot | 1 | 116 | Mean Difference (IV, Fixed, 95% CI) | ‐1.0 [‐38.14, 36.14] |
| Outcome or subgroup title | No. of studies | No. of participants | Statistical method | Effect size |
| 1 Fasting plasma glucose (mg/dL) after 6 cycles Show forest plot | 2 | 57 | Mean Difference (IV, Fixed, 95% CI) | 0.34 [‐3.99, 4.67] |
| 2 Fasting plasma insulin (µU/ml) after 6 cycles Show forest plot | 1 | 31 | Mean Difference (IV, Fixed, 95% CI) | ‐0.80 [‐3.16, 1.56] |
| 3 Fasting plasma insulin (mIU/ml) after 6 cycles Show forest plot | 1 | 26 | Mean Difference (IV, Fixed, 95% CI) | 4.10 [‐0.57, 8.77] |
| 4 Fasting C‐peptide (pmol/L) after 6 cycles Show forest plot | 1 | 31 | Mean Difference (IV, Fixed, 95% CI) | 13.0 [‐45.80, 71.80] |
| 5 Glucose AUC (h x g/L) after 6 cycles Show forest plot | 1 | 31 | Mean Difference (IV, Fixed, 95% CI) | ‐0.21 [‐0.85, 0.43] |
| 6 Insulin AUC (h x IU/ml) after 6 cycles Show forest plot | 1 | 31 | Mean Difference (IV, Fixed, 95% CI) | 14.0 [‐76.09, 104.09] |
| 7 C‐peptide AUC (h x pmol/L) after 6 cycles Show forest plot | 1 | 31 | Mean Difference (IV, Fixed, 95% CI) | ‐89.0 [‐587.05, 409.05] |
| 8 Fasting glucose (g/L) after 13 cycles Show forest plot | 1 | 31 | Mean Difference (IV, Fixed, 95% CI) | ‐0.02 [‐0.07, 0.03] |
| 9 Fasting insulin (IU/ml) after 13 cycles Show forest plot | 1 | 31 | Mean Difference (IV, Fixed, 95% CI) | ‐1.0 [‐3.74, 1.74] |
| 10 Fasting C‐peptide (pmol/L) after 13 cycles Show forest plot | 1 | 31 | Mean Difference (IV, Fixed, 95% CI) | 4.0 [‐42.84, 50.84] |
| 11 Glucose AUC (h x g/L) after 13 cycles Show forest plot | 1 | 31 | Mean Difference (IV, Fixed, 95% CI) | 0.29 [‐0.93, 1.51] |
| 12 Insulin AUC (h x IU/ml) after 13 cycles Show forest plot | 1 | 31 | Mean Difference (IV, Fixed, 95% CI) | 0.0 [‐80.75, 80.75] |
| 13 C‐peptide AUC (h x pmol/L) after 13 cycles Show forest plot | 1 | 31 | Mean Difference (IV, Fixed, 95% CI) | 494.00 [‐694.17, 1682.17] |
| Outcome or subgroup title | No. of studies | No. of participants | Statistical method | Effect size |
| 1 Fasting plasma glucose (mg/dL) after cycle 6 Show forest plot | 1 | 28 | Mean Difference (IV, Fixed, 95% CI) | ‐1.0 [‐6.24, 4.24] |
| 2 Fasting plasma insulin (mIU/mL) after cycle 6 Show forest plot | 1 | 28 | Mean Difference (IV, Fixed, 95% CI) | 4.20 [‐3.18, 11.58] |
| Outcome or subgroup title | No. of studies | No. of participants | Statistical method | Effect size |
| 1 Fasting plasma glucose (mg/dL) after cycle 6 Show forest plot | 1 | 25 | Mean Difference (IV, Fixed, 95% CI) | ‐1.70 [‐7.93, 4.53] |
| 2 Fasting plasma insulin (mIU/mL) after cycle 6 Show forest plot | 1 | 25 | Mean Difference (IV, Fixed, 95% CI) | 3.5 [‐1.88, 8.88] |
| Outcome or subgroup title | No. of studies | No. of participants | Statistical method | Effect size |
| 1 Glucose AUC (mg/dl) at 6 months Show forest plot | 1 | 25 | Mean Difference (IV, Fixed, 95% CI) | ‐14.90 [‐38.08, 8.28] |
| 2 Insulin AUC at 6 months Show forest plot | 1 | 25 | Mean Difference (IV, Fixed, 95% CI) | ‐16.30 [‐38.06, 5.46] |
| Outcome or subgroup title | No. of studies | No. of participants | Statistical method | Effect size |
| 1 Glucose AUC (mmol/L) at 6 months Show forest plot | 1 | 24 | Mean Difference (IV, Fixed, 95% CI) | 0.10 [‐1.49, 1.69] |
| 2 Insulin AUC (pmol/L) at 6 months Show forest plot | 1 | 24 | Mean Difference (IV, Fixed, 95% CI) | 7.70 [‐21.47, 36.87] |
| 3 C‐peptide AUC (pmol/L) at 6 months Show forest plot | 1 | 24 | Mean Difference (IV, Fixed, 95% CI) | 201.60 [‐615.19, 1018.39] |
| Outcome or subgroup title | No. of studies | No. of participants | Statistical method | Effect size |
| 1 Glucose AUC (mg/dl) at 6 months Show forest plot | 1 | 27 | Mean Difference (IV, Fixed, 95% CI) | ‐9.90 [‐28.33, 8.53] |
| 2 Insulin AUC at 6 months Show forest plot | 1 | 27 | Mean Difference (IV, Fixed, 95% CI) | 4.0 [‐12.61, 20.61] |
| 3 Fasting blood glucose (mmol/l) at cycle 6 Show forest plot | 1 | 52 | Mean Difference (IV, Fixed, 95% CI) | 0.21 [‐0.04, 0.46] |
| 4 Fasting blood glucose (mmol/l) at cycle 12 Show forest plot | 1 | 42 | Mean Difference (IV, Fixed, 95% CI) | 0.12 [‐0.16, 0.40] |
| 5 Glucose 2‐h response (mmol/l) at cycle 6 Show forest plot | 1 | 52 | Mean Difference (IV, Fixed, 95% CI) | ‐0.20 [‐1.11, 0.71] |
| 6 Glucose 2‐h response (mmol/l) at cycle 12 Show forest plot | 1 | 42 | Mean Difference (IV, Fixed, 95% CI) | 0.37 [‐0.41, 1.15] |
| Outcome or subgroup title | No. of studies | No. of participants | Statistical method | Effect size |
| 1 Glucose AUC (mg/dl) at 6 months Show forest plot | 1 | 24 | Mean Difference (IV, Fixed, 95% CI) | 5.0 [‐14.94, 24.94] |
| 2 Insulin AUC at 6 months Show forest plot | 1 | 24 | Mean Difference (IV, Fixed, 95% CI) | 20.30 [4.24, 36.36] |
| Outcome or subgroup title | No. of studies | No. of participants | Statistical method | Effect size |
| 1 Change in glucose (mg/dL) from fasting to 1 h after 400 kcal drink at cycle 6 Show forest plot | 1 | 57 | Mean Difference (IV, Fixed, 95% CI) | 1.90 [‐8.07, 11.87] |
| 2 Change in insulin (µU/ml) from fasting to 1 h after 400 kcal drink at cycle 6 Show forest plot | 1 | 57 | Mean Difference (IV, Fixed, 95% CI) | 12.60 [‐1.27, 26.47] |
| Outcome or subgroup title | No. of studies | No. of participants | Statistical method | Effect size |
| 1 Change in glucose AUC (mg/dL) by 6 months Show forest plot | 1 | 30 | Mean Difference (IV, Fixed, 95% CI) | ‐2.37 [‐6.72, 1.98] |
| 2 Change in insulin AUC (µU/mL) by 6 months Show forest plot | 1 | 30 | Mean Difference (IV, Fixed, 95% CI) | ‐2.58 [‐6.63, 1.47] |
| 3 Change in C‐peptide AUC (ng/mL) by 6 months Show forest plot | 1 | 30 | Mean Difference (IV, Fixed, 95% CI) | 0.04 [‐1.76, 1.84] |
| Outcome or subgroup title | No. of studies | No. of participants | Statistical method | Effect size |
| 1 Glucose AUC (hr x mmol/L) at cycle 6 Show forest plot | 1 | 69 | Mean Difference (IV, Fixed, 95% CI) | ‐0.06 [‐1.41, 1.29] |
| 2 Insulin AUC (hr x pmol/L) at cycle 6 Show forest plot | 1 | 65 | Mean Difference (IV, Fixed, 95% CI) | ‐204.51 [‐389.64, ‐19.38] |
| 3 Fasting glycosylated hemoglobin (%) at cycle 6 Show forest plot | 1 | 68 | Mean Difference (IV, Fixed, 95% CI) | ‐0.16 [‐0.33, 0.01] |
| Outcome or subgroup title | No. of studies | No. of participants | Statistical method | Effect size |
| 1 Impaired glucose tolerance at cycle 5 Show forest plot | 1 | 42 | Odds Ratio (M‐H, Fixed, 95% CI) | 0.16 [0.01, 3.64] |
| 2 Insulin sensitivity at cycle 5 Show forest plot | 1 | 42 | Mean Difference (IV, Fixed, 95% CI) | 1.9 [‐5.92, 9.72] |
| Outcome or subgroup title | No. of studies | No. of participants | Statistical method | Effect size |
| 1 Fasting plasma glucose (mmol/L) at 12 months Show forest plot | 1 | 75 | Mean Difference (IV, Fixed, 95% CI) | 0.01 [‐0.24, 0.26] |
| 2 Fasting plasma glucose at 24 months Show forest plot | 1 | 68 | Mean Difference (IV, Fixed, 95% CI) | ‐0.02 [‐0.24, 0.20] |
| 3 Fasting plasma insulin (pmol/L) at 12 months Show forest plot | 1 | 75 | Mean Difference (IV, Fixed, 95% CI) | ‐6.45 [‐37.68, 24.78] |
| 4 Fasting plasma insulin (pmol/L) at 24 months Show forest plot | 1 | 68 | Mean Difference (IV, Fixed, 95% CI) | 12.09 [‐4.17, 28.35] |
| 5 Fasting glycosylated hemoglobin (%) at 12 months Show forest plot | 1 | 75 | Mean Difference (IV, Fixed, 95% CI) | ‐0.03 [‐0.27, 0.21] |
| 6 Fasting glycosylated hemoglobin (%) at 24 months Show forest plot | 1 | 68 | Mean Difference (IV, Fixed, 95% CI) | 0.13 [‐0.11, 0.37] |
| 7 Glucose incremental AUC (min x mmol/L) at 12 months Show forest plot | 1 | 75 | Mean Difference (IV, Fixed, 95% CI) | 0.0 [‐79.44, 79.44] |
| 8 Glucose incremental AUC (min x mmol/L) at 24 months Show forest plot | 1 | 68 | Mean Difference (IV, Fixed, 95% CI) | ‐59.00 [‐143.87, 25.87] |
| 9 Insulin incremental AUC (min x nmol/L) at 12 months Show forest plot | 1 | 75 | Mean Difference (IV, Fixed, 95% CI) | 3.20 [‐11.69, 18.09] |
| 10 Insulin incremental AUC (min x nmol/L) at 24 months Show forest plot | 1 | 68 | Mean Difference (IV, Fixed, 95% CI) | ‐9.40 [‐28.91, 10.11] |
| Outcome or subgroup title | No. of studies | No. of participants | Statistical method | Effect size |
| 1 Change in fasting blood insulin (mU/L) at cycle 7 Show forest plot | 1 | 51 | Mean Difference (IV, Fixed, 95% CI) | 1.1 [‐0.77, 2.97] |
| 2 Change in glucose AUC (h x mg/L) at cycle 7 Show forest plot | 1 | 53 | Mean Difference (IV, Fixed, 95% CI) | 0.23 [‐1.12, 1.58] |
| 3 Change in fasting C‐peptide (ng/mL) at cycle 7 Show forest plot | 1 | 53 | Mean Difference (IV, Fixed, 95% CI) | 0.09 [‐0.17, 0.35] |
| 4 Change in C‐peptide 2‐h response (ng/mL) at cycle 7 Show forest plot | 1 | 53 | Mean Difference (IV, Fixed, 95% CI) | 0.76 [‐0.27, 1.79] |
| Outcome or subgroup title | No. of studies | No. of participants | Statistical method | Effect size |
| 1 Change in fasting plasma glucose (mg/dL) by cycle 13 Show forest plot | 1 | 50 | Mean Difference (IV, Fixed, 95% CI) | 0.56 [‐5.29, 6.41] |
| 2 Change in fasting plasma insulin (µU/mL) by cycle 13 Show forest plot | 1 | 50 | Mean Difference (IV, Fixed, 95% CI) | ‐1.86 [‐4.72, 1.00] |
| 3 Change in fasting C‐peptide (µmol/L) by cycle 13 Show forest plot | 1 | 50 | Mean Difference (IV, Fixed, 95% CI) | 14.4 [‐83.00, 111.80] |
| 4 Change in fasting free fatty acids (µEq/L) by cycle 13 Show forest plot | 1 | 50 | Mean Difference (IV, Fixed, 95% CI) | ‐42.17 [‐194.32, 109.98] |
| 5 Change in glucose AUC (h x mg/dL) by cycle 13 Show forest plot | 1 | 50 | Mean Difference (IV, Fixed, 95% CI) | 6.5 [‐18.07, 31.07] |
| 6 Change in insulin AUC (h x µU/mL) by cycle 13 Show forest plot | 1 | 50 | Mean Difference (IV, Fixed, 95% CI) | 6.50 [‐29.37, 42.37] |
| 7 Change in C‐peptide AUC (h x µmol/L) by cycle 13 Show forest plot | 1 | 50 | Mean Difference (IV, Fixed, 95% CI) | 0.29 [‐0.60, 1.18] |
| 8 Change in free fatty acids AUC (h x µEq/L) by cycle 13 Show forest plot | 1 | 50 | Mean Difference (IV, Fixed, 95% CI) | ‐91.3 [‐212.17, 29.57] |
| Outcome or subgroup title | No. of studies | No. of participants | Statistical method | Effect size |
| 1 Fasting serum glucose (mg/dL) at 12 months Show forest plot | 1 | 58 | Mean Difference (IV, Fixed, 95% CI) | ‐1.30 [‐6.01, 3.41] |
| 2 Change in fasting blood glucose (mg/dL) at 12 months Show forest plot | 1 | 470 | Mean Difference (IV, Fixed, 95% CI) | 0.0 [‐0.12, 0.12] |
| 3 Glucose 2‐h response (mg/dL) at 12 months Show forest plot | 1 | 58 | Mean Difference (IV, Fixed, 95% CI) | 6.5 [‐4.75, 17.75] |
| 4 Change in glucose 2‐h response (mg/dL) at 12 months Show forest plot | 1 | 470 | Mean Difference (IV, Fixed, 95% CI) | ‐0.30 [‐0.54, ‐0.06] |
| Outcome or subgroup title | No. of studies | No. of participants | Statistical method | Effect size |
| 1 Fasting plasma glucose (mmol/L) at 6 months Show forest plot | 1 | 33 | Mean Difference (IV, Fixed, 95% CI) | ‐0.62 [‐1.26, 0.02] |
| 2 Fasting glycosylated hemoglobin (%) at 6 months Show forest plot | 1 | 33 | Mean Difference (IV, Fixed, 95% CI) | 0.09 [‐0.66, 0.84] |
| 3 Abnormal fasting plasma glucose at 6 months Show forest plot | 1 | 33 | Peto Odds Ratio (Peto, Fixed, 95% CI) | 0.07 [0.00, 1.30] |
| 4 Abnormal fasting glycosylated hemoglobin at 6 months Show forest plot | 1 | 33 | Peto Odds Ratio (Peto, Fixed, 95% CI) | 0.97 [0.14, 6.61] |
| Outcome or subgroup title | No. of studies | No. of participants | Statistical method | Effect size |
| 1 Change in glucose (mmol/L) from baseline to cycle 4 Show forest plot | 1 | 235 | Mean Difference (IV, Fixed, 95% CI) | ‐0.04 [‐0.28, 0.20] |
| Outcome or subgroup title | No. of studies | No. of participants | Statistical method | Effect size |
| 1 Fasting plasma glucose (mg/dl) at cycle 6 Show forest plot | 2 | 144 | Mean Difference (IV, Fixed, 95% CI) | ‐0.88 [‐2.83, 1.06] |
| 2 Fasting plasma glucose (mg/dl) at cycle 12 Show forest plot | 1 | 57 | Mean Difference (IV, Fixed, 95% CI) | ‐1.0 [‐5.38, 3.38] |
| 3 Fasting plasma insulin (µg/dl) at cycle 6 Show forest plot | 1 | 89 | Mean Difference (IV, Fixed, 95% CI) | ‐0.79 [‐4.31, 2.73] |
| 4 Fasting plasma insulin (µU/ml) at cycle 6 Show forest plot | 1 | 48 | Mean Difference (IV, Fixed, 95% CI) | ‐2.0 [‐4.77, 0.77] |
| 5 Fasting plasma insulin (µU/ml) at cycle 12 Show forest plot | 1 | 48 | Mean Difference (IV, Fixed, 95% CI) | 1.0 [‐1.77, 3.77] |
| 6 Glucose AUC (h x mg/dl) at cycle 6 Show forest plot | 2 | 144 | Mean Difference (IV, Fixed, 95% CI) | ‐10.83 [‐29.62, 7.96] |
| 7 Glucose AUC (h x mg/dl) at cycle 12 Show forest plot | 1 | 57 | Mean Difference (IV, Fixed, 95% CI) | ‐14.0 [‐44.99, 16.99] |
| 8 Insulin AUC (h x µg/dl) at cycle 6 Show forest plot | 1 | 89 | Mean Difference (IV, Fixed, 95% CI) | ‐12.0 [‐58.88, 34.88] |
| 9 Insulin AUC (h x µU/mL) at cycle 6 Show forest plot | 1 | 48 | Mean Difference (IV, Fixed, 95% CI) | 3.00 [‐33.46, 39.46] |
| 10 Insulin AUC (h x µU/mL) at cycle 12 Show forest plot | 1 | 48 | Mean Difference (IV, Fixed, 95% CI) | 21.0 [‐15.46, 57.46] |
| Outcome or subgroup title | No. of studies | No. of participants | Statistical method | Effect size |
| 1 Fasting plasma glucose (mg/dl) at cycle 6 Show forest plot | 1 | 88 | Mean Difference (IV, Fixed, 95% CI) | ‐0.60 [‐3.32, 2.12] |
| 2 Glucose AUC (h x µg/dl) at cycle 6 Show forest plot | 1 | 88 | Mean Difference (IV, Fixed, 95% CI) | ‐2.0 [‐27.51, 23.51] |
| 3 Fasting plasma insulin (µg/dl) at cycle 6 Show forest plot | 1 | 91 | Mean Difference (IV, Fixed, 95% CI) | ‐0.34 [‐3.66, 2.98] |
| 4 Insulin AUC (h x µg/dl) at cycle 6 Show forest plot | 1 | 91 | Mean Difference (IV, Fixed, 95% CI) | ‐10.0 [‐55.87, 35.87] |
| Outcome or subgroup title | No. of studies | No. of participants | Statistical method | Effect size |
| 1 Fasting plasma glucose (mg/dl) at cycle 6 Show forest plot | 1 | 85 | Mean Difference (IV, Fixed, 95% CI) | 1.14 [‐1.74, 4.02] |
| 2 Fasting plasma insulin (µg/dl) at cycle 6 Show forest plot | 1 | 90 | Mean Difference (IV, Fixed, 95% CI) | 0.45 [‐2.63, 3.53] |
| 3 Glucose AUC (h x µg/dl) at cycle 6 Show forest plot | 1 | 85 | Mean Difference (IV, Fixed, 95% CI) | 8.0 [‐17.31, 33.31] |
| 4 Insulin AUC (h x µg/dl) at cycle 6 Show forest plot | 1 | 90 | Mean Difference (IV, Fixed, 95% CI) | 2.0 [‐35.64, 39.64] |
| Outcome or subgroup title | No. of studies | No. of participants | Statistical method | Effect size |
| 1 Fasting serum glucose (mg/dl) after 12 months Show forest plot | 1 | 40 | Mean Difference (IV, Fixed, 95% CI) | 10.05 [3.16, 16.94] |
| 2 Glucose 2‐hr response (mg/dl) after 12 months Show forest plot | 1 | 40 | Mean Difference (IV, Fixed, 95% CI) | 17.0 [5.67, 28.33] |
| 3 Fasting serum insulin (nU/ml) after 12 months Show forest plot | 1 | 40 | Mean Difference (IV, Fixed, 95% CI) | 3.40 [2.07, 4.73] |
| 4 Insulin 2‐hr response (nU/ml) after 12 months Show forest plot | 1 | 40 | Mean Difference (IV, Fixed, 95% CI) | 20.0 [‐47.41, 87.41] |
| Outcome or subgroup title | No. of studies | No. of participants | Statistical method | Effect size |
| 1 Fasting plasma glucose (mg/dl) at cycle 6 Show forest plot | 1 | 48 | Mean Difference (IV, Fixed, 95% CI) | 0.60 [‐2.33, 3.53] |
| 2 Fasting plasma insulin (µU/ml) at cycle 6 Show forest plot | 1 | 48 | Mean Difference (IV, Fixed, 95% CI) | 0.28 [‐0.84, 1.40] |
| 3 Plasma glucose rate of disappearance (mg/kg/min) at cycle 6 Show forest plot | 1 | 48 | Mean Difference (IV, Fixed, 95% CI) | 0.11 [‐0.19, 0.41] |
| Outcome or subgroup title | No. of studies | No. of participants | Statistical method | Effect size |
| 1 Fasting serum glucose (mmol/L) at cycle 9 Show forest plot | 1 | 298 | Mean Difference (IV, Fixed, 95% CI) | 0.07 [‐0.06, 0.20] |
| 2 Serum glucose 2‐h response (mmol/L) at cycle 9 Show forest plot | 1 | 298 | Mean Difference (IV, Fixed, 95% CI) | 0.14 [‐0.06, 0.34] |
| 3 Abnormal fasting serum glucose at cycle 9 Show forest plot | 1 | 298 | Odds Ratio (M‐H, Fixed, 95% CI) | 0.93 [0.06, 15.08] |
| Outcome or subgroup title | No. of studies | No. of participants | Statistical method | Effect size |
| 1 Blood glucose ("random") (mg/dl) at 12 months Show forest plot | 1 | 54 | Mean Difference (IV, Fixed, 95% CI) | ‐0.90 [‐8.61, 6.81] |
| Outcome or subgroup title | No. of studies | No. of participants | Statistical method | Effect size |
| 1 Fasting plasma glucose (mmol/L) at cycle 6 Show forest plot | 1 | 38 | Mean Difference (IV, Fixed, 95% CI) | 0.10 [‐0.18, 0.38] |
| 2 Fasting glycosylated hemoglobin (%) at cycle 6 Show forest plot | 1 | 38 | Mean Difference (IV, Fixed, 95% CI) | ‐0.30 [‐0.85, 0.25] |