Masaje perineal prenatal para reducir el trauma perineal
References
Referencias de los estudios incluidos en esta revisión
Referencias de los estudios excluidos de esta revisión
Referencias de los estudios en curso
Referencias adicionales
Referencias de otras versiones publicadas de esta revisión
Characteristics of studies
Characteristics of included studies [ordered by study ID]
Jump to:
| Methods | Randomisation using table of random numbers. Concealment of allocation by sealed, numbered, opaque envelopes. Participants asked not to tell their healthcare providers their assignment. Secrecy instruction upheld by 93.3%. All participants entered into trial included in analysis. | |
| Participants | 46 women without previous vaginal birth between 32‐34 weeks, singleton. Excluded if likely caesarean section or history of genital herpes in pregnancy. | |
| Interventions | Woman or partner performed daily 5‐10 minute perineal massage from 34 weeks. 1‐2 fingers introduced 3‐4 cm in vagina, applying alternating downward and sideward pressure using sweet almond oil. Explained using foam perineal model in 15‐20 minute session. Written instructions given and telephone follow‐up 1 and 3 weeks after enrolment to encourage compliance. Given diary to record daily practice. Control group received no instruction on massage. | |
| Outcomes | Mode of delivery, incidence of episiotomy, incidence of perineal tear. | |
| Notes | Pilot study. Intervention group asked to complete questionnaire regarding acceptability of perineal massage. | |
| Risk of bias | ||
| Bias | Authors' judgement | Support for judgement |
| Random sequence generation (selection bias) | Low risk | Randomisation using table of random numbers. |
| Allocation concealment (selection bias) | Low risk | A ‐ Concealment of allocation by sealed, numbered, opaque envelopes. |
| Blinding (performance bias and detection bias) | Low risk | Participants asked not to tell physicians their assignment. Secrecy instruction upheld by 93.3%. |
| Incomplete outcome data (attrition bias) | Low risk | A ‐ All participants entered into trial included in analysis. |
| Selective reporting (reporting bias) | Unclear risk | Small pilot study only. |
| Other bias | Low risk | |
| Methods | Multicentre trial. Randomisation (stratified by whether or not previous vaginal birth) using table of random numbers. Concealment of allocation by sealed, numbered, opaque envelopes. No breaches of sequential assignment. Participants asked not to tell their healthcare providers their assignment. Unblinding of study group in 5.6%. All participants entered into trial included in the analysis. Three months after delivery participants mailed a questionnaire. 79% response rate, similar between massage group and controls. | |
| Participants | 1034 women without previous vaginal birth and 493 women with previous vaginal birth between 30‐35 weeks, singleton. Excluded if high likelihood of delivery by caesarean section, history of genital herpes during pregnancy, inability to understand instructions or already practising perineal massage. 572 women without previous vaginal birth and 377 women with previous vaginal birth returned the subsequent questionnaire. | |
| Interventions | Woman or partner performed daily 10 minute perineal massage from 34 weeks. 1 or 2 fingers introduced 3 to 4 cm in vagina, applying alternating downward and sideward pressure using sweet almond oil. Explained using foam perineal model in 15 to 20 minute session. Written instructions were offered and telephone follow‐up 1 and 3 weeks after enrolment to encourage compliance. Given diary to record daily practice. Control group received no instruction on massage. | |
| Outcomes | Mode of delivery, incidence of episiotomy, incidence of perineal tear, satisfaction with birth. Questionnaire at 3 months assessed self‐reported pain, sexual function of woman and partner, urinary, faecal and flatal incontinence. | |
| Notes | Contact with author provided results by frequency of massage. Data from questionnaire at 3 months is also reported by Eason 2002. | |
| Risk of bias | ||
| Bias | Authors' judgement | Support for judgement |
| Random sequence generation (selection bias) | Low risk | Randomisation (stratified by whether or not previous vaginal birth) using table of random numbers. |
| Allocation concealment (selection bias) | Low risk | A ‐ Concealment of allocation by sealed, numbered, opaque envelopes. No breaches of sequential assignment. |
| Blinding (performance bias and detection bias) | Low risk | Participants asked not to tell physicians their assignment. Unblinding of study group in 5.6%. |
| Incomplete outcome data (attrition bias) | Low risk | A ‐ All participants entered into trial included in the analysis. |
| Selective reporting (reporting bias) | Low risk | Contact with author provided results by frequency of massage. |
| Other bias | Low risk | |
| Methods | Randomisation was carried out by phone by an independent organisation. Concealment achieved by drawing a sealed opaque envelope from a closed box. Participants were asked not to tell healthcare providers their assignment. No process documented to check blinding. All participants entered into trial included in the analysis. | |
| Participants | 63 women without previous vaginal birth between 34 to 36 weeks. Excluded if high likelihood of birth by caesarean section. | |
| Interventions | Woman or partner performed 5 minutes of perineal massage following bath or shower using sweet almond oil. No specific description of technique. Massage performed 4 times per week. Given diary to record practice. Weekly face‐to‐face meeting with trial coordinator to reinforce technique and aid compliance. Control group received no instruction on massage. | |
| Outcomes | Mode of delivery, incidence of episiotomy, incidence of perineal tear. | |
| Notes | Article in Japanese. Unable to communicate with author for further clarification. | |
| Risk of bias | ||
| Bias | Authors' judgement | Support for judgement |
| Random sequence generation (selection bias) | Unclear risk | Not described. |
| Allocation concealment (selection bias) | Low risk | A ‐ The method described appears to have successfully concealed allocation. |
| Blinding (performance bias and detection bias) | Unclear risk | Participants were asked not to tell healthcare providers their assignment. No process documented to check blinding. |
| Incomplete outcome data (attrition bias) | Low risk | A ‐ All participants entered into trial included in the analysis. |
| Selective reporting (reporting bias) | Unclear risk | Article in Japanese. Unable to communicate with author for further clarification. |
| Other bias | Low risk | |
| Methods | Computer‐generated random numbers. Concealment of allocation by indistinguishable, sealed, numbered envelopes. Participants asked not to tell their healthcare providers their assignment. No formal assessment to check blinding but "random checks by trial research midwife indicated that midwives were blind to the group allocation". Outcomes for 179 women who did not deliver vaginally not reported but clarified following correspondence from author. | |
| Participants | 861 women without previous vaginal birth between 29 to 32 weeks, singleton. Excluded if high likelihood of delivery by caesarean section, history of genital herpes during pregnancy, allergy to nuts (contained in massage oil), inability to understand instructions or already practising perineal massage. | |
| Interventions | Woman or partner performed 4 ‐minute perineal massage 3‐4 times per week from 34 weeks. 1 or 2 fingers introduced 5 cm in vagina, applying sweeping downward pressure from 3:00 to 9:00 using provided sweet almond oil. Women given verbal and written instructions. Given diary to record daily practice. Control group received no instruction on massage. Both intervention and control groups encouraged to perform pelvic floor exercises. | |
| Outcomes | Mode of delivery, incidence of perineal trauma. | |
| Notes | Contact with author provided incidence of episiotomy and perineal tears, length of second stage, and results by frequency of massage. | |
| Risk of bias | ||
| Bias | Authors' judgement | Support for judgement |
| Random sequence generation (selection bias) | Low risk | Computer‐generated random numbers. |
| Allocation concealment (selection bias) | Low risk | A ‐ Concealment of allocation by indistinguishable, sealed, numbered envelopes. |
| Blinding (performance bias and detection bias) | Unclear risk | Participants asked not to tell their healthcare providers their assignment. No formal assessment to check blinding but "random checks by trial research midwife indicated that midwives were blind to the group allocation". |
| Incomplete outcome data (attrition bias) | Low risk | A ‐ Outcomes for 179 women who did not deliver vaginally not reported but clarified following correspondence from author. |
| Selective reporting (reporting bias) | Low risk | Contact with author provided incidence of episiotomy and perineal tears, length of second stage, and results by frequency of massage. |
| Other bias | Low risk | |
Characteristics of excluded studies [ordered by study ID]
Jump to:
| Study | Reason for exclusion |
| Inadequate allocation concealment. Although women were asked not to tell their carers their allocation, 1 in 9 women were delivered by a practitioner who would have instructed in perineal massage. No method of assessing maintenance of blinding. Large numbers of exclusions. Contact with author revealed significant withdrawal of participants in intervention group. | |
| This is not a randomised controlled trial. Women recruited to this trial could choose whether or not to join the intervention group or study group. |
Characteristics of ongoing studies [ordered by study ID]
Jump to:
| Trial name or title | The effect of perineal massage on perineal rupture. |
| Methods | A randomised single‐blinded study. |
| Participants | Gestation 36 weeks or more, nulliparous. |
| Interventions | Perineal massage using a water with either coconut or olive oil, 3‐10 minutes a day by expert midwives. Initiated from 36 weeks of conception and carried out daily for 30 days. Control group received no perineal massage. |
| Outcomes | Primary: perineal episiotomy; perineal lacerations. Secondary: pain and vaginal bleeding. |
| Starting date | Expected recruitment start date: 22 December 2011. Expected recruitment end date: 28 May 2012. |
| Contact information | Azam Foroghipour, Master of midwifery, Islamic Azad University of Najaf abad Branch, Iran. Email: [email protected] |
| Notes |
Data and analyses
| Outcome or subgroup title | No. of studies | No. of participants | Statistical method | Effect size |
| 1 Perineal trauma requiring suturing Show forest plot | 4 | 2480 | Risk Ratio (M‐H, Fixed, 95% CI) | 0.91 [0.86, 0.96] |
| Analysis 1.1 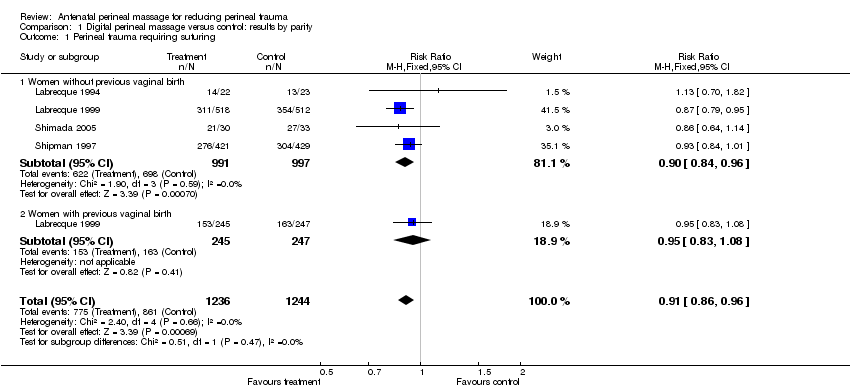 Comparison 1 Digital perineal massage versus control: results by parity, Outcome 1 Perineal trauma requiring suturing. | ||||
| 1.1 Women without previous vaginal birth | 4 | 1988 | Risk Ratio (M‐H, Fixed, 95% CI) | 0.90 [0.84, 0.96] |
| 1.2 Women with previous vaginal birth | 1 | 492 | Risk Ratio (M‐H, Fixed, 95% CI) | 0.95 [0.83, 1.08] |
| 2 1st degree perineal tear Show forest plot | 4 | 2480 | Risk Ratio (M‐H, Random, 95% CI) | 0.96 [0.78, 1.19] |
| Analysis 1.2 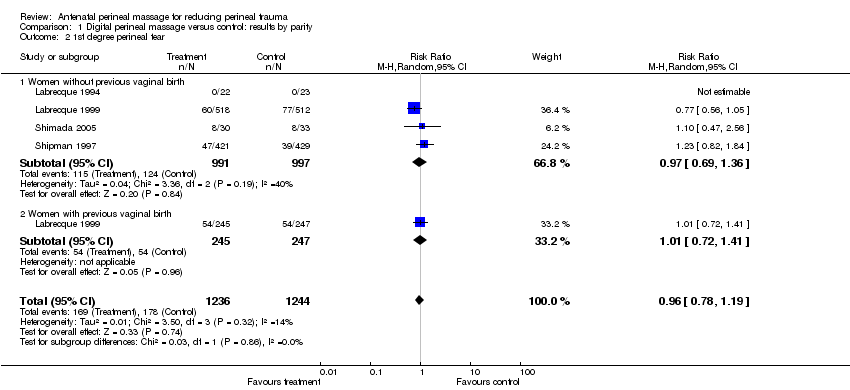 Comparison 1 Digital perineal massage versus control: results by parity, Outcome 2 1st degree perineal tear. | ||||
| 2.1 Women without previous vaginal birth | 4 | 1988 | Risk Ratio (M‐H, Random, 95% CI) | 0.97 [0.69, 1.36] |
| 2.2 Women with previous vaginal birth | 1 | 492 | Risk Ratio (M‐H, Random, 95% CI) | 1.01 [0.72, 1.41] |
| 3 2nd degree perineal tear Show forest plot | 4 | 2480 | Risk Ratio (M‐H, Fixed, 95% CI) | 0.99 [0.85, 1.15] |
| Analysis 1.3  Comparison 1 Digital perineal massage versus control: results by parity, Outcome 3 2nd degree perineal tear. | ||||
| 3.1 Women without previous vaginal birth | 4 | 1988 | Risk Ratio (M‐H, Fixed, 95% CI) | 1.00 [0.84, 1.19] |
| 3.2 Women with previous vaginal birth | 1 | 492 | Risk Ratio (M‐H, Fixed, 95% CI) | 0.96 [0.72, 1.29] |
| 4 3rd or 4th degree perineal trauma Show forest plot | 4 | 2480 | Risk Ratio (M‐H, Fixed, 95% CI) | 0.81 [0.56, 1.18] |
| Analysis 1.4  Comparison 1 Digital perineal massage versus control: results by parity, Outcome 4 3rd or 4th degree perineal trauma. | ||||
| 4.1 Women without previous vaginal birth | 4 | 1988 | Risk Ratio (M‐H, Fixed, 95% CI) | 0.82 [0.56, 1.20] |
| 4.2 Women with previous vaginal birth | 1 | 492 | Risk Ratio (M‐H, Fixed, 95% CI) | 0.50 [0.05, 5.52] |
| 5 Incidence of episiotomy Show forest plot | 4 | 2480 | Risk Ratio (M‐H, Fixed, 95% CI) | 0.84 [0.74, 0.95] |
| Analysis 1.5  Comparison 1 Digital perineal massage versus control: results by parity, Outcome 5 Incidence of episiotomy. | ||||
| 5.1 Women without previous vaginal birth | 4 | 1988 | Risk Ratio (M‐H, Fixed, 95% CI) | 0.83 [0.73, 0.95] |
| 5.2 Women with previous vaginal birth | 1 | 492 | Risk Ratio (M‐H, Fixed, 95% CI) | 0.86 [0.57, 1.30] |
| 6 Length of second stage Show forest plot | 2 | 2211 | Mean Difference (IV, Fixed, 95% CI) | 3.84 [‐0.26, 7.95] |
| Analysis 1.6 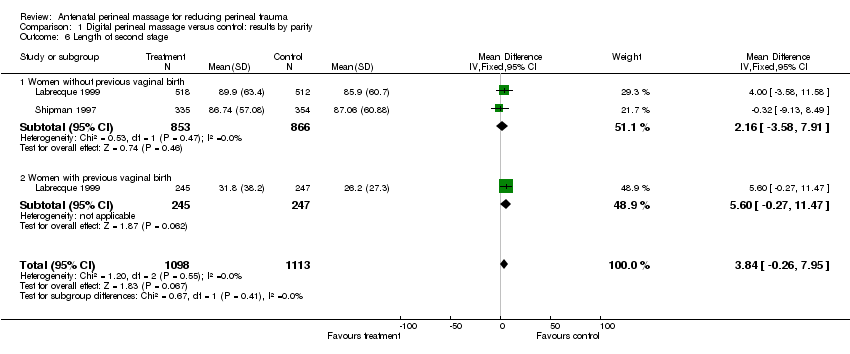 Comparison 1 Digital perineal massage versus control: results by parity, Outcome 6 Length of second stage. | ||||
| 6.1 Women without previous vaginal birth | 2 | 1719 | Mean Difference (IV, Fixed, 95% CI) | 2.16 [‐3.58, 7.91] |
| 6.2 Women with previous vaginal birth | 1 | 492 | Mean Difference (IV, Fixed, 95% CI) | 5.60 [‐0.27, 11.47] |
| 7 Instrumental delivery Show forest plot | 3 | 2417 | Risk Ratio (M‐H, Random, 95% CI) | 0.94 [0.77, 1.16] |
| Analysis 1.7 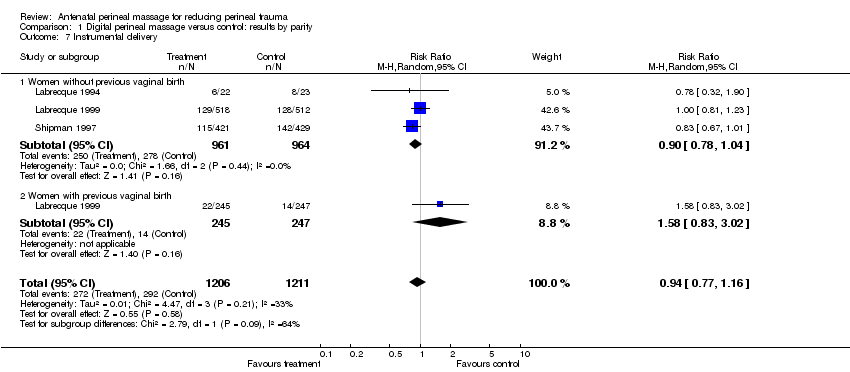 Comparison 1 Digital perineal massage versus control: results by parity, Outcome 7 Instrumental delivery. | ||||
| 7.1 Women without previous vaginal birth | 3 | 1925 | Risk Ratio (M‐H, Random, 95% CI) | 0.90 [0.78, 1.04] |
| 7.2 Women with previous vaginal birth | 1 | 492 | Risk Ratio (M‐H, Random, 95% CI) | 1.58 [0.83, 3.02] |
| 8 Length of inpatient stay | 0 | 0 | Mean Difference (IV, Fixed, 95% CI) | 0.0 [0.0, 0.0] |
| 8.1 Women without previous vaginal birth | 0 | 0 | Mean Difference (IV, Fixed, 95% CI) | 0.0 [0.0, 0.0] |
| 8.2 Women with previous vaginal birth | 0 | 0 | Mean Difference (IV, Fixed, 95% CI) | 0.0 [0.0, 0.0] |
| 9 Admission to nursery | 0 | 0 | Risk Ratio (M‐H, Fixed, 95% CI) | 0.0 [0.0, 0.0] |
| 9.1 Women without previous vaginal birth | 0 | 0 | Risk Ratio (M‐H, Fixed, 95% CI) | 0.0 [0.0, 0.0] |
| 9.2 Women with previous vaginal birth | 0 | 0 | Risk Ratio (M‐H, Fixed, 95% CI) | 0.0 [0.0, 0.0] |
| 10 Apgar < 4 at 1 minute and/or Apgar < 7 at 5 minutes | 0 | 0 | Risk Ratio (M‐H, Fixed, 95% CI) | 0.0 [0.0, 0.0] |
| 10.1 Women without previous vaginal birth | 0 | 0 | Risk Ratio (M‐H, Fixed, 95% CI) | 0.0 [0.0, 0.0] |
| 10.2 Women with previous vaginal birth | 0 | 0 | Risk Ratio (M‐H, Fixed, 95% CI) | 0.0 [0.0, 0.0] |
| 11 Woman's satisfaction with perineal massage | 0 | 0 | Risk Ratio (M‐H, Fixed, 95% CI) | 0.0 [0.0, 0.0] |
| 11.1 Women without previous vaginal birth | 0 | 0 | Risk Ratio (M‐H, Fixed, 95% CI) | 0.0 [0.0, 0.0] |
| 11.2 Women with previous vaginal birth | 0 | 0 | Risk Ratio (M‐H, Fixed, 95% CI) | 0.0 [0.0, 0.0] |
| 12 Perineal pain postpartum | 0 | 0 | Mean Difference (IV, Fixed, 95% CI) | 0.0 [0.0, 0.0] |
| 12.1 Women without previous vaginal birth | 0 | 0 | Mean Difference (IV, Fixed, 95% CI) | 0.0 [0.0, 0.0] |
| 12.2 Women with previous vaginal birth | 0 | 0 | Mean Difference (IV, Fixed, 95% CI) | 0.0 [0.0, 0.0] |
| 13 Perineal pain at 3 months postpartum Show forest plot | 1 | 931 | Risk Ratio (M‐H, Random, 95% CI) | 0.64 [0.39, 1.06] |
| Analysis 1.13  Comparison 1 Digital perineal massage versus control: results by parity, Outcome 13 Perineal pain at 3 months postpartum. | ||||
| 13.1 Women without previous vaginal birth | 1 | 555 | Risk Ratio (M‐H, Random, 95% CI) | 0.77 [0.55, 1.09] |
| 13.2 Women with previous vaginal birth | 1 | 376 | Risk Ratio (M‐H, Random, 95% CI) | 0.45 [0.24, 0.87] |
| 14 Painful sex at 3 months postpartum Show forest plot | 1 | 831 | Risk Ratio (M‐H, Fixed, 95% CI) | 0.96 [0.84, 1.08] |
| Analysis 1.14  Comparison 1 Digital perineal massage versus control: results by parity, Outcome 14 Painful sex at 3 months postpartum. | ||||
| 14.1 Women without previous vaginal birth | 1 | 493 | Risk Ratio (M‐H, Fixed, 95% CI) | 0.97 [0.85, 1.11] |
| 14.2 Women with previous vaginal birth | 1 | 338 | Risk Ratio (M‐H, Fixed, 95% CI) | 0.92 [0.68, 1.24] |
| 15 Woman's sexual satisfaction at 3 months postpartum Show forest plot | 1 | 921 | Risk Ratio (M‐H, Fixed, 95% CI) | 1.02 [0.96, 1.10] |
| Analysis 1.15 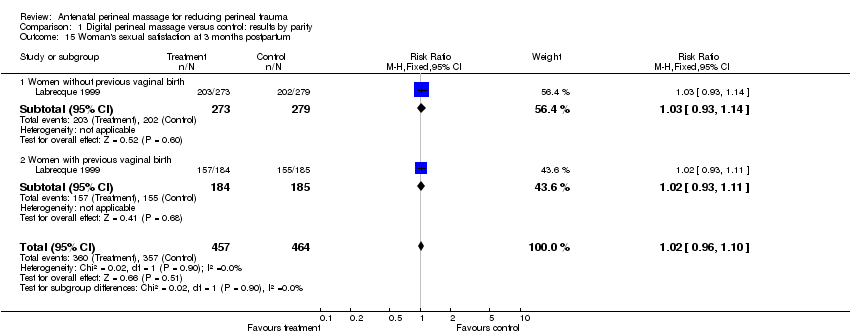 Comparison 1 Digital perineal massage versus control: results by parity, Outcome 15 Woman's sexual satisfaction at 3 months postpartum. | ||||
| 15.1 Women without previous vaginal birth | 1 | 552 | Risk Ratio (M‐H, Fixed, 95% CI) | 1.03 [0.93, 1.14] |
| 15.2 Women with previous vaginal birth | 1 | 369 | Risk Ratio (M‐H, Fixed, 95% CI) | 1.02 [0.93, 1.11] |
| 16 Partner's sexual satisfaction at 3 months postpartum Show forest plot | 1 | 916 | Risk Ratio (M‐H, Fixed, 95% CI) | 0.97 [0.91, 1.04] |
| Analysis 1.16  Comparison 1 Digital perineal massage versus control: results by parity, Outcome 16 Partner's sexual satisfaction at 3 months postpartum. | ||||
| 16.1 Women without previous vaginal birth | 1 | 548 | Risk Ratio (M‐H, Fixed, 95% CI) | 0.99 [0.90, 1.09] |
| 16.2 Women with previous vaginal birth | 1 | 368 | Risk Ratio (M‐H, Fixed, 95% CI) | 0.94 [0.87, 1.03] |
| 17 Uncontrolled loss of urine at 3 months postpartum Show forest plot | 1 | 949 | Risk Ratio (M‐H, Fixed, 95% CI) | 0.90 [0.74, 1.08] |
| Analysis 1.17 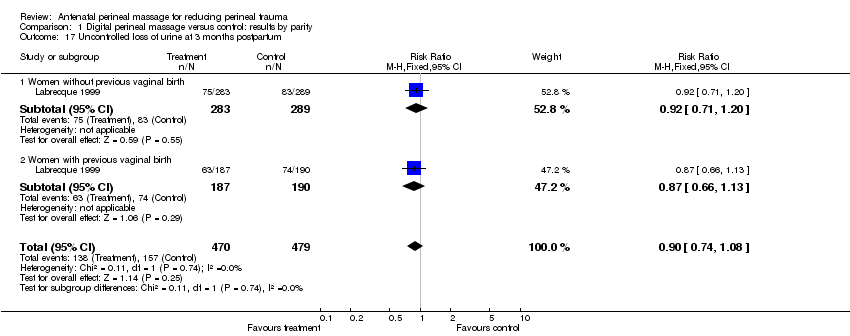 Comparison 1 Digital perineal massage versus control: results by parity, Outcome 17 Uncontrolled loss of urine at 3 months postpartum. | ||||
| 17.1 Women without previous vaginal birth | 1 | 572 | Risk Ratio (M‐H, Fixed, 95% CI) | 0.92 [0.71, 1.20] |
| 17.2 Women with previous vaginal birth | 1 | 377 | Risk Ratio (M‐H, Fixed, 95% CI) | 0.87 [0.66, 1.13] |
| 18 Uncontrolled loss of faeces at 3 months postpartum Show forest plot | 1 | 948 | Risk Ratio (M‐H, Random, 95% CI) | 0.70 [0.27, 1.80] |
| Analysis 1.18 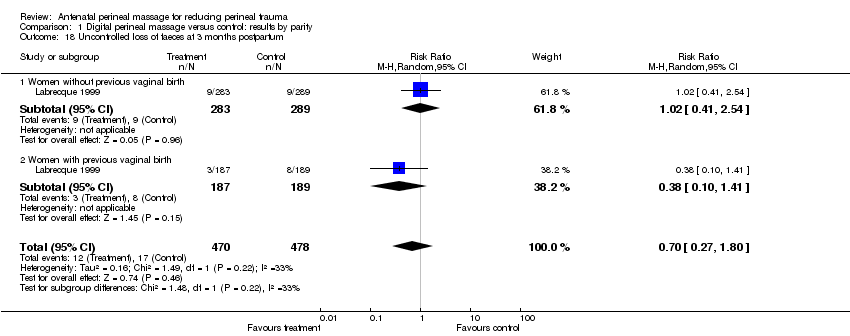 Comparison 1 Digital perineal massage versus control: results by parity, Outcome 18 Uncontrolled loss of faeces at 3 months postpartum. | ||||
| 18.1 Women without previous vaginal birth | 1 | 572 | Risk Ratio (M‐H, Random, 95% CI) | 1.02 [0.41, 2.54] |
| 18.2 Women with previous vaginal birth | 1 | 376 | Risk Ratio (M‐H, Random, 95% CI) | 0.38 [0.10, 1.41] |
| 19 Uncontrolled loss of flatus at 3 months postpartum Show forest plot | 1 | 948 | Risk Ratio (M‐H, Fixed, 95% CI) | 1.09 [0.88, 1.36] |
| Analysis 1.19  Comparison 1 Digital perineal massage versus control: results by parity, Outcome 19 Uncontrolled loss of flatus at 3 months postpartum. | ||||
| 19.1 Women without previous vaginal birth | 1 | 571 | Risk Ratio (M‐H, Fixed, 95% CI) | 1.13 [0.85, 1.50] |
| 19.2 Women with previous vaginal birth | 1 | 377 | Risk Ratio (M‐H, Fixed, 95% CI) | 1.04 [0.74, 1.45] |
| Outcome or subgroup title | No. of studies | No. of participants | Statistical method | Effect size |
| 1 Perineal trauma requiring suturing Show forest plot | 3 | Risk Ratio (M‐H, Random, 95% CI) | Subtotals only | |
| Analysis 2.1 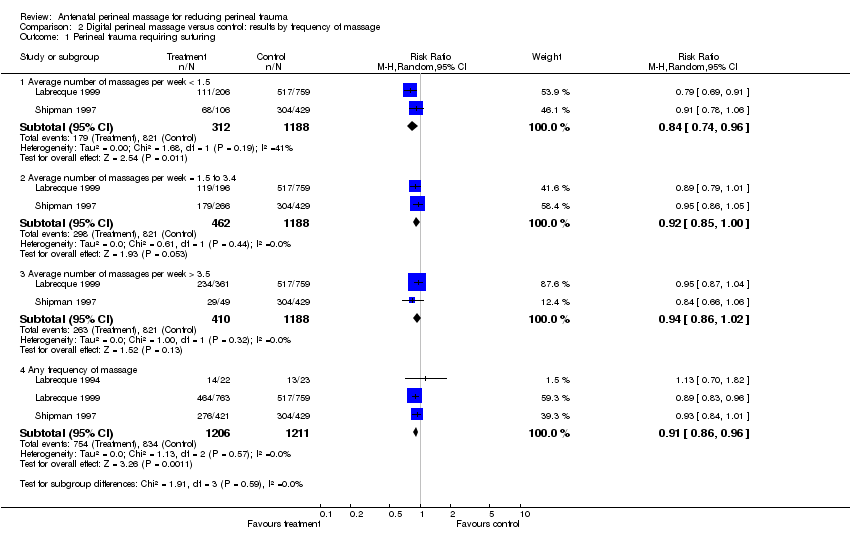 Comparison 2 Digital perineal massage versus control: results by frequency of massage, Outcome 1 Perineal trauma requiring suturing. | ||||
| 1.1 Average number of massages per week < 1.5 | 2 | 1500 | Risk Ratio (M‐H, Random, 95% CI) | 0.84 [0.74, 0.96] |
| 1.2 Average number of massages per week = 1.5 to 3.4 | 2 | 1650 | Risk Ratio (M‐H, Random, 95% CI) | 0.92 [0.85, 1.00] |
| 1.3 Average number of massages per week > 3.5 | 2 | 1598 | Risk Ratio (M‐H, Random, 95% CI) | 0.94 [0.86, 1.02] |
| 1.4 Any frequency of massage | 3 | 2417 | Risk Ratio (M‐H, Random, 95% CI) | 0.91 [0.86, 0.96] |
| 2 1st degree perineal tear Show forest plot | 3 | Risk Ratio (M‐H, Random, 95% CI) | Subtotals only | |
| Analysis 2.2 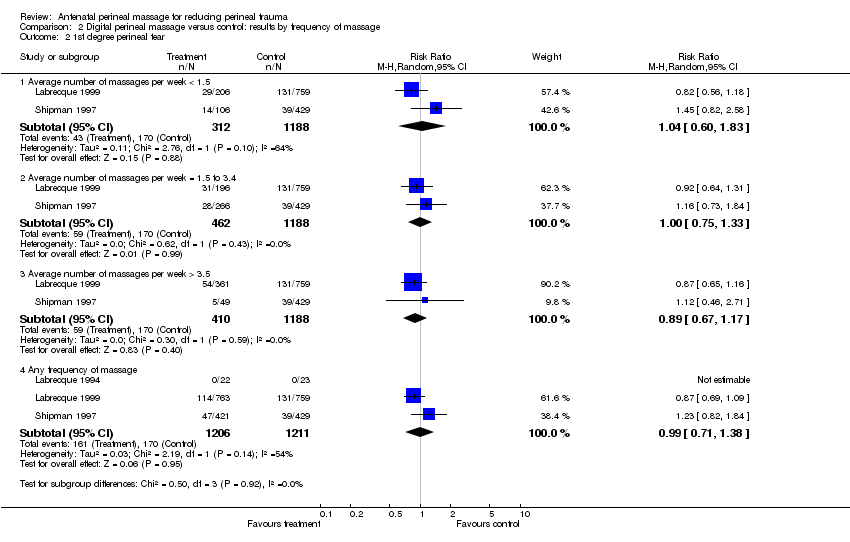 Comparison 2 Digital perineal massage versus control: results by frequency of massage, Outcome 2 1st degree perineal tear. | ||||
| 2.1 Average number of massages per week < 1.5 | 2 | 1500 | Risk Ratio (M‐H, Random, 95% CI) | 1.04 [0.60, 1.83] |
| 2.2 Average number of massages per week = 1.5 to 3.4 | 2 | 1650 | Risk Ratio (M‐H, Random, 95% CI) | 1.00 [0.75, 1.33] |
| 2.3 Average number of massages per week > 3.5 | 2 | 1598 | Risk Ratio (M‐H, Random, 95% CI) | 0.89 [0.67, 1.17] |
| 2.4 Any frequency of massage | 3 | 2417 | Risk Ratio (M‐H, Random, 95% CI) | 0.99 [0.71, 1.38] |
| 3 2nd degree perineal tear Show forest plot | 3 | Risk Ratio (M‐H, Fixed, 95% CI) | Subtotals only | |
| Analysis 2.3 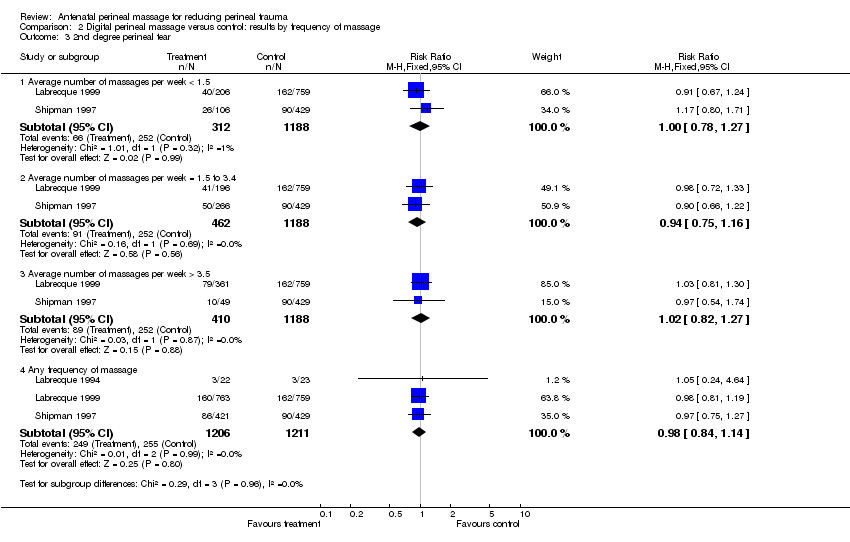 Comparison 2 Digital perineal massage versus control: results by frequency of massage, Outcome 3 2nd degree perineal tear. | ||||
| 3.1 Average number of massages per week < 1.5 | 2 | 1500 | Risk Ratio (M‐H, Fixed, 95% CI) | 1.00 [0.78, 1.27] |
| 3.2 Average number of massages per week = 1.5 to 3.4 | 2 | 1650 | Risk Ratio (M‐H, Fixed, 95% CI) | 0.94 [0.75, 1.16] |
| 3.3 Average number of massages per week > 3.5 | 2 | 1598 | Risk Ratio (M‐H, Fixed, 95% CI) | 1.02 [0.82, 1.27] |
| 3.4 Any frequency of massage | 3 | 2417 | Risk Ratio (M‐H, Fixed, 95% CI) | 0.98 [0.84, 1.14] |
| 4 3rd or 4th degree perineal trauma Show forest plot | 3 | Risk Ratio (M‐H, Random, 95% CI) | Subtotals only | |
| Analysis 2.4 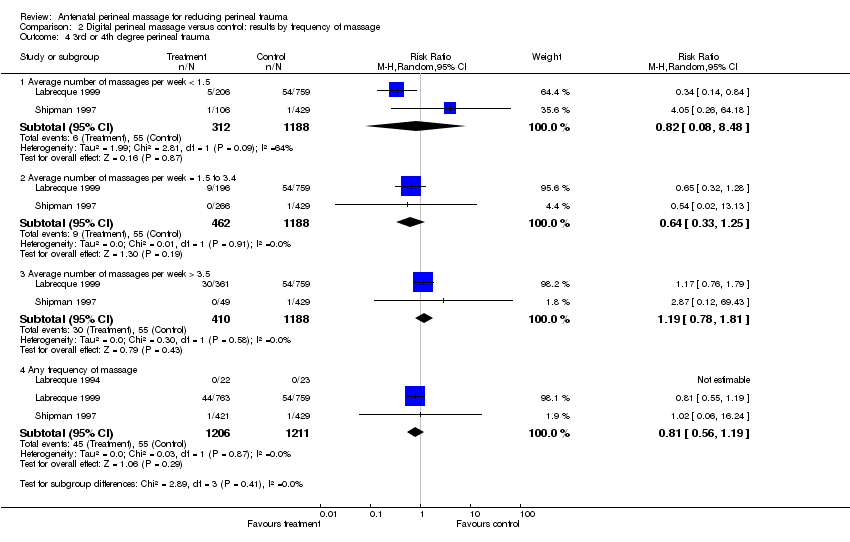 Comparison 2 Digital perineal massage versus control: results by frequency of massage, Outcome 4 3rd or 4th degree perineal trauma. | ||||
| 4.1 Average number of massages per week < 1.5 | 2 | 1500 | Risk Ratio (M‐H, Random, 95% CI) | 0.82 [0.08, 8.48] |
| 4.2 Average number of massages per week = 1.5 to 3.4 | 2 | 1650 | Risk Ratio (M‐H, Random, 95% CI) | 0.64 [0.33, 1.25] |
| 4.3 Average number of massages per week > 3.5 | 2 | 1598 | Risk Ratio (M‐H, Random, 95% CI) | 1.19 [0.78, 1.81] |
| 4.4 Any frequency of massage | 3 | 2417 | Risk Ratio (M‐H, Random, 95% CI) | 0.81 [0.56, 1.19] |
| 5 Incidence of episiotomy Show forest plot | 3 | Risk Ratio (M‐H, Fixed, 95% CI) | Subtotals only | |
| Analysis 2.5 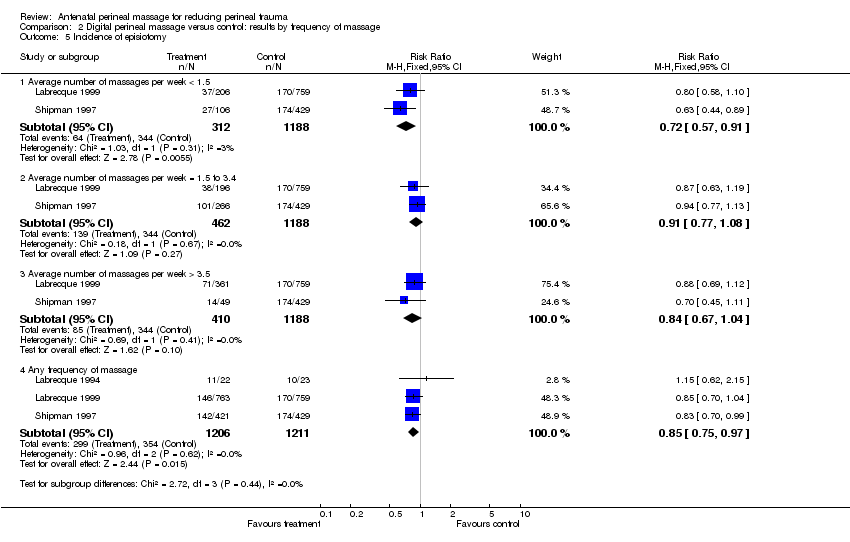 Comparison 2 Digital perineal massage versus control: results by frequency of massage, Outcome 5 Incidence of episiotomy. | ||||
| 5.1 Average number of massages per week < 1.5 | 2 | 1500 | Risk Ratio (M‐H, Fixed, 95% CI) | 0.72 [0.57, 0.91] |
| 5.2 Average number of massages per week = 1.5 to 3.4 | 2 | 1650 | Risk Ratio (M‐H, Fixed, 95% CI) | 0.91 [0.77, 1.08] |
| 5.3 Average number of massages per week > 3.5 | 2 | 1598 | Risk Ratio (M‐H, Fixed, 95% CI) | 0.84 [0.67, 1.04] |
| 5.4 Any frequency of massage | 3 | 2417 | Risk Ratio (M‐H, Fixed, 95% CI) | 0.85 [0.75, 0.97] |
| 6 Length of second stage Show forest plot | 2 | Mean Difference (IV, Random, 95% CI) | Subtotals only | |
| Analysis 2.6  Comparison 2 Digital perineal massage versus control: results by frequency of massage, Outcome 6 Length of second stage. | ||||
| 6.1 Average number of massages per week < 1.5 | 2 | 1403 | Mean Difference (IV, Random, 95% CI) | 0.97 [‐6.45, 8.39] |
| 6.2 Average number of massages per week = 1.5 to 3.4 | 2 | 1525 | Mean Difference (IV, Random, 95% CI) | ‐2.38 [‐8.55, 3.79] |
| 6.3 Average number of massages per week > 3.5 | 2 | 1509 | Mean Difference (IV, Random, 95% CI) | 10.80 [4.03, 17.58] |
| 6.4 Any frequency of massage | 2 | 2211 | Mean Difference (IV, Random, 95% CI) | 3.35 [‐1.29, 8.00] |
| 7 Instrumental delivery Show forest plot | 3 | Risk Ratio (M‐H, Random, 95% CI) | Subtotals only | |
| Analysis 2.7  Comparison 2 Digital perineal massage versus control: results by frequency of massage, Outcome 7 Instrumental delivery. | ||||
| 7.1 Average number of massages per week < 1.5 | 2 | 1500 | Risk Ratio (M‐H, Random, 95% CI) | 0.89 [0.71, 1.13] |
| 7.2 Average number of massages per week = 1.5 to 3.4 | 2 | 1650 | Risk Ratio (M‐H, Random, 95% CI) | 0.88 [0.72, 1.07] |
| 7.3 Average number of massages per week > 3.5 | 2 | 1598 | Risk Ratio (M‐H, Random, 95% CI) | 1.07 [0.86, 1.33] |
| 7.4 Any frequency of massage | 3 | 2417 | Risk Ratio (M‐H, Random, 95% CI) | 0.93 [0.76, 1.13] |
| 8 Length of inpatient stay | 0 | Mean Difference (IV, Fixed, 95% CI) | Subtotals only | |
| 8.1 Average number of massages per week < 1.5 | 0 | 0 | Mean Difference (IV, Fixed, 95% CI) | 0.0 [0.0, 0.0] |
| 8.2 Average number of massages per week = 1.5 to 3.4 | 0 | 0 | Mean Difference (IV, Fixed, 95% CI) | 0.0 [0.0, 0.0] |
| 8.3 Average number of massages per week > 3.5 | 0 | 0 | Mean Difference (IV, Fixed, 95% CI) | 0.0 [0.0, 0.0] |
| 8.4 Any frequency of massage | 0 | 0 | Mean Difference (IV, Fixed, 95% CI) | 0.0 [0.0, 0.0] |
| 9 Admission to nursery | 0 | Risk Ratio (M‐H, Fixed, 95% CI) | Subtotals only | |
| 9.1 Average number of massages per week < 1.5 | 0 | 0 | Risk Ratio (M‐H, Fixed, 95% CI) | 0.0 [0.0, 0.0] |
| 9.2 Average number of massages per week = 1.5 to 3.4 | 0 | 0 | Risk Ratio (M‐H, Fixed, 95% CI) | 0.0 [0.0, 0.0] |
| 9.3 Average number of massages per week > 3.5 | 0 | 0 | Risk Ratio (M‐H, Fixed, 95% CI) | 0.0 [0.0, 0.0] |
| 9.4 Any frequency of massage | 0 | 0 | Risk Ratio (M‐H, Fixed, 95% CI) | 0.0 [0.0, 0.0] |
| 10 Apgar < 4 at 1 minute and/or Apgar < 7 at 5 minutes | 0 | Risk Ratio (M‐H, Fixed, 95% CI) | Subtotals only | |
| 10.1 Average number of massages per week < 1.5 | 0 | 0 | Risk Ratio (M‐H, Fixed, 95% CI) | 0.0 [0.0, 0.0] |
| 10.2 Average number of massages per week = 1.5 to 3.4 | 0 | 0 | Risk Ratio (M‐H, Fixed, 95% CI) | 0.0 [0.0, 0.0] |
| 10.3 Average number of massages per week > 3.5 | 0 | 0 | Risk Ratio (M‐H, Fixed, 95% CI) | 0.0 [0.0, 0.0] |
| 10.4 Any frequency of massage | 0 | 0 | Risk Ratio (M‐H, Fixed, 95% CI) | 0.0 [0.0, 0.0] |
| 11 Woman's satisfaction with perineal massage | 0 | Risk Ratio (M‐H, Fixed, 95% CI) | Subtotals only | |
| 11.1 Average number of massages per week < 1.5 | 0 | 0 | Risk Ratio (M‐H, Fixed, 95% CI) | 0.0 [0.0, 0.0] |
| 11.2 Average number of massages per week = 1.5 to 3.4 | 0 | 0 | Risk Ratio (M‐H, Fixed, 95% CI) | 0.0 [0.0, 0.0] |
| 11.3 Average number of massages per week > 3.5 | 0 | 0 | Risk Ratio (M‐H, Fixed, 95% CI) | 0.0 [0.0, 0.0] |
| 11.4 Any frequency of massage | 0 | 0 | Risk Ratio (M‐H, Fixed, 95% CI) | 0.0 [0.0, 0.0] |
| 12 Perineal pain postpartum | 0 | Mean Difference (IV, Fixed, 95% CI) | Subtotals only | |
| 12.1 Average number of massages per week < 1.5 | 0 | 0 | Mean Difference (IV, Fixed, 95% CI) | 0.0 [0.0, 0.0] |
| 12.2 Average number of massages per week = 1.5 to 3.4 | 0 | 0 | Mean Difference (IV, Fixed, 95% CI) | 0.0 [0.0, 0.0] |
| 12.3 Average number of massages per week > 3.5 | 0 | 0 | Mean Difference (IV, Fixed, 95% CI) | 0.0 [0.0, 0.0] |
| 12.4 Any frequency of massage | 0 | 0 | Mean Difference (IV, Fixed, 95% CI) | 0.0 [0.0, 0.0] |
| 13 Perineal pain at 3 months postpartum Show forest plot | 1 | Risk Ratio (M‐H, Fixed, 95% CI) | Subtotals only | |
| Analysis 2.13 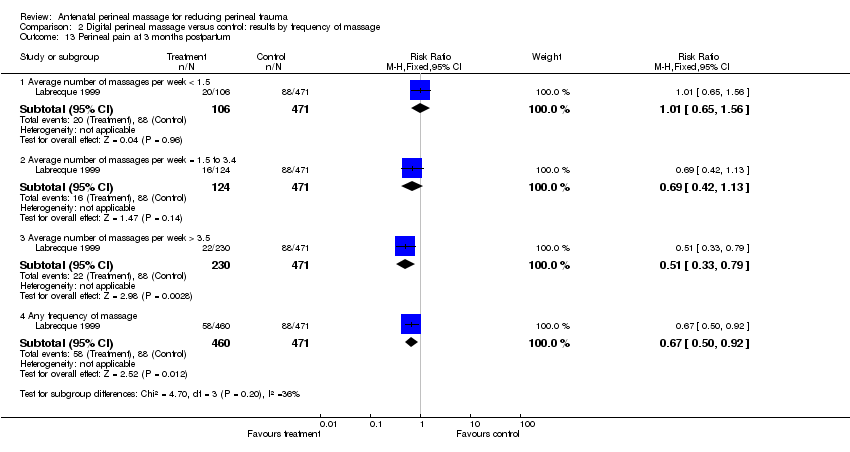 Comparison 2 Digital perineal massage versus control: results by frequency of massage, Outcome 13 Perineal pain at 3 months postpartum. | ||||
| 13.1 Average number of massages per week < 1.5 | 1 | 577 | Risk Ratio (M‐H, Fixed, 95% CI) | 1.01 [0.65, 1.56] |
| 13.2 Average number of massages per week = 1.5 to 3.4 | 1 | 595 | Risk Ratio (M‐H, Fixed, 95% CI) | 0.69 [0.42, 1.13] |
| 13.3 Average number of massages per week > 3.5 | 1 | 701 | Risk Ratio (M‐H, Fixed, 95% CI) | 0.51 [0.33, 0.79] |
| 13.4 Any frequency of massage | 1 | 931 | Risk Ratio (M‐H, Fixed, 95% CI) | 0.67 [0.50, 0.92] |
| 14 Painful sex at 3 months postpartum Show forest plot | 1 | Risk Ratio (M‐H, Fixed, 95% CI) | Subtotals only | |
| Analysis 2.14  Comparison 2 Digital perineal massage versus control: results by frequency of massage, Outcome 14 Painful sex at 3 months postpartum. | ||||
| 14.1 Average number of massages per week < 1.5 | 1 | 521 | Risk Ratio (M‐H, Fixed, 95% CI) | 0.85 [0.67, 1.08] |
| 14.2 Average number of massages per week = 1.5 to 3.4 | 1 | 538 | Risk Ratio (M‐H, Fixed, 95% CI) | 1.03 [0.85, 1.25] |
| 14.3 Average number of massages per week > 3.5 | 1 | 622 | Risk Ratio (M‐H, Fixed, 95% CI) | 0.96 [0.81, 1.13] |
| 14.4 Any frequency of massage | 1 | 831 | Risk Ratio (M‐H, Fixed, 95% CI) | 0.95 [0.83, 1.09] |
| 15 Woman's sexual satisfaction at 3 months postpartum Show forest plot | 1 | Risk Ratio (M‐H, Fixed, 95% CI) | Subtotals only | |
| Analysis 2.15 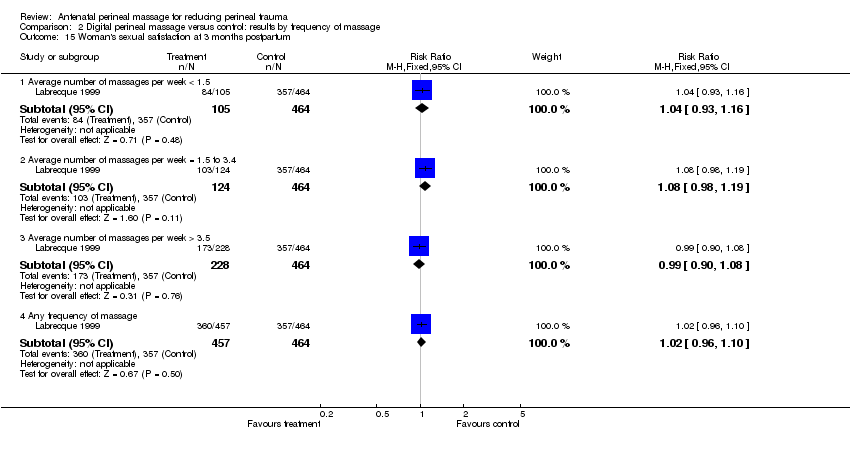 Comparison 2 Digital perineal massage versus control: results by frequency of massage, Outcome 15 Woman's sexual satisfaction at 3 months postpartum. | ||||
| 15.1 Average number of massages per week < 1.5 | 1 | 569 | Risk Ratio (M‐H, Fixed, 95% CI) | 1.04 [0.93, 1.16] |
| 15.2 Average number of massages per week = 1.5 to 3.4 | 1 | 588 | Risk Ratio (M‐H, Fixed, 95% CI) | 1.08 [0.98, 1.19] |
| 15.3 Average number of massages per week > 3.5 | 1 | 692 | Risk Ratio (M‐H, Fixed, 95% CI) | 0.99 [0.90, 1.08] |
| 15.4 Any frequency of massage | 1 | 921 | Risk Ratio (M‐H, Fixed, 95% CI) | 1.02 [0.96, 1.10] |
| 16 Partner's sexual satisfaction at 3 months postpartum Show forest plot | 1 | Risk Ratio (M‐H, Fixed, 95% CI) | Subtotals only | |
| Analysis 2.16  Comparison 2 Digital perineal massage versus control: results by frequency of massage, Outcome 16 Partner's sexual satisfaction at 3 months postpartum. | ||||
| 16.1 Average number of massages per week < 1.5 | 1 | 576 | Risk Ratio (M‐H, Fixed, 95% CI) | 1.01 [0.91, 1.11] |
| 16.2 Average number of massages per week = 1.5 to 3.4 | 1 | 586 | Risk Ratio (M‐H, Fixed, 95% CI) | 1.03 [0.95, 1.13] |
| 16.3 Average number of massages per week > 3.5 | 1 | 688 | Risk Ratio (M‐H, Fixed, 95% CI) | 0.93 [0.86, 1.02] |
| 16.4 Any frequency of massage | 1 | 916 | Risk Ratio (M‐H, Fixed, 95% CI) | 0.97 [0.91, 1.04] |
| 17 Uncontrolled loss of urine at 3 months postpartum Show forest plot | 1 | Risk Ratio (M‐H, Fixed, 95% CI) | Subtotals only | |
| Analysis 2.17 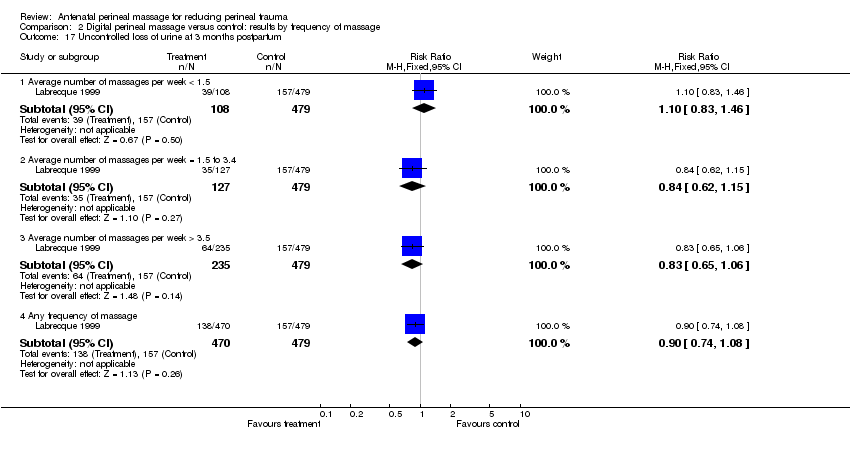 Comparison 2 Digital perineal massage versus control: results by frequency of massage, Outcome 17 Uncontrolled loss of urine at 3 months postpartum. | ||||
| 17.1 Average number of massages per week < 1.5 | 1 | 587 | Risk Ratio (M‐H, Fixed, 95% CI) | 1.10 [0.83, 1.46] |
| 17.2 Average number of massages per week = 1.5 to 3.4 | 1 | 606 | Risk Ratio (M‐H, Fixed, 95% CI) | 0.84 [0.62, 1.15] |
| 17.3 Average number of massages per week > 3.5 | 1 | 714 | Risk Ratio (M‐H, Fixed, 95% CI) | 0.83 [0.65, 1.06] |
| 17.4 Any frequency of massage | 1 | 949 | Risk Ratio (M‐H, Fixed, 95% CI) | 0.90 [0.74, 1.08] |
| 18 Uncontrolled loss of faeces at 3 months postpartum Show forest plot | 1 | Risk Ratio (M‐H, Fixed, 95% CI) | Subtotals only | |
| Analysis 2.18  Comparison 2 Digital perineal massage versus control: results by frequency of massage, Outcome 18 Uncontrolled loss of faeces at 3 months postpartum. | ||||
| 18.1 Average number of massages per week < 1.5 | 1 | 586 | Risk Ratio (M‐H, Fixed, 95% CI) | 1.04 [0.36, 3.03] |
| 18.2 Average number of massages per week = 1.5 to 3.4 | 1 | 605 | Risk Ratio (M‐H, Fixed, 95% CI) | 0.44 [0.10, 1.89] |
| 18.3 Average number of massages per week > 3.5 | 1 | 713 | Risk Ratio (M‐H, Fixed, 95% CI) | 0.72 [0.29, 1.80] |
| 18.4 Any frequency of massage | 1 | 948 | Risk Ratio (M‐H, Fixed, 95% CI) | 0.72 [0.35, 1.49] |
| 19 Uncontrolled loss of flatus at 3 months postpartum Show forest plot | 1 | 2854 | Risk Ratio (M‐H, Fixed, 95% CI) | 1.09 [0.95, 1.25] |
| Analysis 2.19  Comparison 2 Digital perineal massage versus control: results by frequency of massage, Outcome 19 Uncontrolled loss of flatus at 3 months postpartum. | ||||
| 19.1 Average number of massages per week < 1.5 | 1 | 587 | Risk Ratio (M‐H, Fixed, 95% CI) | 1.40 [1.03, 1.90] |
| 19.2 Average number of massages per week = 1.5 to 3.4 | 1 | 606 | Risk Ratio (M‐H, Fixed, 95% CI) | 0.87 [0.60, 1.26] |
| 19.3 Average number of massages per week > 3.5 | 1 | 713 | Risk Ratio (M‐H, Fixed, 95% CI) | 1.07 [0.82, 1.39] |
| 19.4 Any frequency of massage | 1 | 948 | Risk Ratio (M‐H, Fixed, 95% CI) | 1.09 [0.88, 1.36] |

'Risk of bias' graph: review authors' judgements about each risk of bias item presented as percentages across all included studies.

'Risk of bias' summary: review authors' judgements about each risk of bias item for each included study.
Comparison 1 Digital perineal massage versus control: results by parity, Outcome 1 Perineal trauma requiring suturing.
Comparison 1 Digital perineal massage versus control: results by parity, Outcome 2 1st degree perineal tear.
Comparison 1 Digital perineal massage versus control: results by parity, Outcome 3 2nd degree perineal tear.
Comparison 1 Digital perineal massage versus control: results by parity, Outcome 4 3rd or 4th degree perineal trauma.
Comparison 1 Digital perineal massage versus control: results by parity, Outcome 5 Incidence of episiotomy.
Comparison 1 Digital perineal massage versus control: results by parity, Outcome 6 Length of second stage.
Comparison 1 Digital perineal massage versus control: results by parity, Outcome 7 Instrumental delivery.
Comparison 1 Digital perineal massage versus control: results by parity, Outcome 13 Perineal pain at 3 months postpartum.
Comparison 1 Digital perineal massage versus control: results by parity, Outcome 14 Painful sex at 3 months postpartum.
Comparison 1 Digital perineal massage versus control: results by parity, Outcome 15 Woman's sexual satisfaction at 3 months postpartum.
Comparison 1 Digital perineal massage versus control: results by parity, Outcome 16 Partner's sexual satisfaction at 3 months postpartum.
Comparison 1 Digital perineal massage versus control: results by parity, Outcome 17 Uncontrolled loss of urine at 3 months postpartum.
Comparison 1 Digital perineal massage versus control: results by parity, Outcome 18 Uncontrolled loss of faeces at 3 months postpartum.
Comparison 1 Digital perineal massage versus control: results by parity, Outcome 19 Uncontrolled loss of flatus at 3 months postpartum.
Comparison 2 Digital perineal massage versus control: results by frequency of massage, Outcome 1 Perineal trauma requiring suturing.
Comparison 2 Digital perineal massage versus control: results by frequency of massage, Outcome 2 1st degree perineal tear.
Comparison 2 Digital perineal massage versus control: results by frequency of massage, Outcome 3 2nd degree perineal tear.
Comparison 2 Digital perineal massage versus control: results by frequency of massage, Outcome 4 3rd or 4th degree perineal trauma.
Comparison 2 Digital perineal massage versus control: results by frequency of massage, Outcome 5 Incidence of episiotomy.
Comparison 2 Digital perineal massage versus control: results by frequency of massage, Outcome 6 Length of second stage.
Comparison 2 Digital perineal massage versus control: results by frequency of massage, Outcome 7 Instrumental delivery.
Comparison 2 Digital perineal massage versus control: results by frequency of massage, Outcome 13 Perineal pain at 3 months postpartum.
Comparison 2 Digital perineal massage versus control: results by frequency of massage, Outcome 14 Painful sex at 3 months postpartum.
Comparison 2 Digital perineal massage versus control: results by frequency of massage, Outcome 15 Woman's sexual satisfaction at 3 months postpartum.
Comparison 2 Digital perineal massage versus control: results by frequency of massage, Outcome 16 Partner's sexual satisfaction at 3 months postpartum.
Comparison 2 Digital perineal massage versus control: results by frequency of massage, Outcome 17 Uncontrolled loss of urine at 3 months postpartum.
Comparison 2 Digital perineal massage versus control: results by frequency of massage, Outcome 18 Uncontrolled loss of faeces at 3 months postpartum.
Comparison 2 Digital perineal massage versus control: results by frequency of massage, Outcome 19 Uncontrolled loss of flatus at 3 months postpartum.
| Treatment | Control | Risk ratio, M‐H, Fixed, 95% CI | |||
| Events | Total | Events | Total | ||
| Reporting of infrequent flatal incontinence | 21 | 108 | 107 | 479 | 0.87 (0.57,1.32) |
| Reporting of flatal incontinence at least daily | 6 | 108 | 10 | 479 | 2.66 (0.99,7.16) |
| Duration | All women | Excl episiotomy |
| Length of 2nd stage (mins) | +3.84 (95% CI ‐0.26 to +7.95) | +3.57 (95% CI ‐0.86 to +8.00) |
| Length of 2nd stage for women massaging more than 3.5 times/week (mins) | +10.80 (95% CI +4.03 to +17.58) | +5.21 (95% CI ‐1.45 to +11.86) |
| mins: minutes | ||
| Outcome or subgroup title | No. of studies | No. of participants | Statistical method | Effect size |
| 1 Perineal trauma requiring suturing Show forest plot | 4 | 2480 | Risk Ratio (M‐H, Fixed, 95% CI) | 0.91 [0.86, 0.96] |
| 1.1 Women without previous vaginal birth | 4 | 1988 | Risk Ratio (M‐H, Fixed, 95% CI) | 0.90 [0.84, 0.96] |
| 1.2 Women with previous vaginal birth | 1 | 492 | Risk Ratio (M‐H, Fixed, 95% CI) | 0.95 [0.83, 1.08] |
| 2 1st degree perineal tear Show forest plot | 4 | 2480 | Risk Ratio (M‐H, Random, 95% CI) | 0.96 [0.78, 1.19] |
| 2.1 Women without previous vaginal birth | 4 | 1988 | Risk Ratio (M‐H, Random, 95% CI) | 0.97 [0.69, 1.36] |
| 2.2 Women with previous vaginal birth | 1 | 492 | Risk Ratio (M‐H, Random, 95% CI) | 1.01 [0.72, 1.41] |
| 3 2nd degree perineal tear Show forest plot | 4 | 2480 | Risk Ratio (M‐H, Fixed, 95% CI) | 0.99 [0.85, 1.15] |
| 3.1 Women without previous vaginal birth | 4 | 1988 | Risk Ratio (M‐H, Fixed, 95% CI) | 1.00 [0.84, 1.19] |
| 3.2 Women with previous vaginal birth | 1 | 492 | Risk Ratio (M‐H, Fixed, 95% CI) | 0.96 [0.72, 1.29] |
| 4 3rd or 4th degree perineal trauma Show forest plot | 4 | 2480 | Risk Ratio (M‐H, Fixed, 95% CI) | 0.81 [0.56, 1.18] |
| 4.1 Women without previous vaginal birth | 4 | 1988 | Risk Ratio (M‐H, Fixed, 95% CI) | 0.82 [0.56, 1.20] |
| 4.2 Women with previous vaginal birth | 1 | 492 | Risk Ratio (M‐H, Fixed, 95% CI) | 0.50 [0.05, 5.52] |
| 5 Incidence of episiotomy Show forest plot | 4 | 2480 | Risk Ratio (M‐H, Fixed, 95% CI) | 0.84 [0.74, 0.95] |
| 5.1 Women without previous vaginal birth | 4 | 1988 | Risk Ratio (M‐H, Fixed, 95% CI) | 0.83 [0.73, 0.95] |
| 5.2 Women with previous vaginal birth | 1 | 492 | Risk Ratio (M‐H, Fixed, 95% CI) | 0.86 [0.57, 1.30] |
| 6 Length of second stage Show forest plot | 2 | 2211 | Mean Difference (IV, Fixed, 95% CI) | 3.84 [‐0.26, 7.95] |
| 6.1 Women without previous vaginal birth | 2 | 1719 | Mean Difference (IV, Fixed, 95% CI) | 2.16 [‐3.58, 7.91] |
| 6.2 Women with previous vaginal birth | 1 | 492 | Mean Difference (IV, Fixed, 95% CI) | 5.60 [‐0.27, 11.47] |
| 7 Instrumental delivery Show forest plot | 3 | 2417 | Risk Ratio (M‐H, Random, 95% CI) | 0.94 [0.77, 1.16] |
| 7.1 Women without previous vaginal birth | 3 | 1925 | Risk Ratio (M‐H, Random, 95% CI) | 0.90 [0.78, 1.04] |
| 7.2 Women with previous vaginal birth | 1 | 492 | Risk Ratio (M‐H, Random, 95% CI) | 1.58 [0.83, 3.02] |
| 8 Length of inpatient stay | 0 | 0 | Mean Difference (IV, Fixed, 95% CI) | 0.0 [0.0, 0.0] |
| 8.1 Women without previous vaginal birth | 0 | 0 | Mean Difference (IV, Fixed, 95% CI) | 0.0 [0.0, 0.0] |
| 8.2 Women with previous vaginal birth | 0 | 0 | Mean Difference (IV, Fixed, 95% CI) | 0.0 [0.0, 0.0] |
| 9 Admission to nursery | 0 | 0 | Risk Ratio (M‐H, Fixed, 95% CI) | 0.0 [0.0, 0.0] |
| 9.1 Women without previous vaginal birth | 0 | 0 | Risk Ratio (M‐H, Fixed, 95% CI) | 0.0 [0.0, 0.0] |
| 9.2 Women with previous vaginal birth | 0 | 0 | Risk Ratio (M‐H, Fixed, 95% CI) | 0.0 [0.0, 0.0] |
| 10 Apgar < 4 at 1 minute and/or Apgar < 7 at 5 minutes | 0 | 0 | Risk Ratio (M‐H, Fixed, 95% CI) | 0.0 [0.0, 0.0] |
| 10.1 Women without previous vaginal birth | 0 | 0 | Risk Ratio (M‐H, Fixed, 95% CI) | 0.0 [0.0, 0.0] |
| 10.2 Women with previous vaginal birth | 0 | 0 | Risk Ratio (M‐H, Fixed, 95% CI) | 0.0 [0.0, 0.0] |
| 11 Woman's satisfaction with perineal massage | 0 | 0 | Risk Ratio (M‐H, Fixed, 95% CI) | 0.0 [0.0, 0.0] |
| 11.1 Women without previous vaginal birth | 0 | 0 | Risk Ratio (M‐H, Fixed, 95% CI) | 0.0 [0.0, 0.0] |
| 11.2 Women with previous vaginal birth | 0 | 0 | Risk Ratio (M‐H, Fixed, 95% CI) | 0.0 [0.0, 0.0] |
| 12 Perineal pain postpartum | 0 | 0 | Mean Difference (IV, Fixed, 95% CI) | 0.0 [0.0, 0.0] |
| 12.1 Women without previous vaginal birth | 0 | 0 | Mean Difference (IV, Fixed, 95% CI) | 0.0 [0.0, 0.0] |
| 12.2 Women with previous vaginal birth | 0 | 0 | Mean Difference (IV, Fixed, 95% CI) | 0.0 [0.0, 0.0] |
| 13 Perineal pain at 3 months postpartum Show forest plot | 1 | 931 | Risk Ratio (M‐H, Random, 95% CI) | 0.64 [0.39, 1.06] |
| 13.1 Women without previous vaginal birth | 1 | 555 | Risk Ratio (M‐H, Random, 95% CI) | 0.77 [0.55, 1.09] |
| 13.2 Women with previous vaginal birth | 1 | 376 | Risk Ratio (M‐H, Random, 95% CI) | 0.45 [0.24, 0.87] |
| 14 Painful sex at 3 months postpartum Show forest plot | 1 | 831 | Risk Ratio (M‐H, Fixed, 95% CI) | 0.96 [0.84, 1.08] |
| 14.1 Women without previous vaginal birth | 1 | 493 | Risk Ratio (M‐H, Fixed, 95% CI) | 0.97 [0.85, 1.11] |
| 14.2 Women with previous vaginal birth | 1 | 338 | Risk Ratio (M‐H, Fixed, 95% CI) | 0.92 [0.68, 1.24] |
| 15 Woman's sexual satisfaction at 3 months postpartum Show forest plot | 1 | 921 | Risk Ratio (M‐H, Fixed, 95% CI) | 1.02 [0.96, 1.10] |
| 15.1 Women without previous vaginal birth | 1 | 552 | Risk Ratio (M‐H, Fixed, 95% CI) | 1.03 [0.93, 1.14] |
| 15.2 Women with previous vaginal birth | 1 | 369 | Risk Ratio (M‐H, Fixed, 95% CI) | 1.02 [0.93, 1.11] |
| 16 Partner's sexual satisfaction at 3 months postpartum Show forest plot | 1 | 916 | Risk Ratio (M‐H, Fixed, 95% CI) | 0.97 [0.91, 1.04] |
| 16.1 Women without previous vaginal birth | 1 | 548 | Risk Ratio (M‐H, Fixed, 95% CI) | 0.99 [0.90, 1.09] |
| 16.2 Women with previous vaginal birth | 1 | 368 | Risk Ratio (M‐H, Fixed, 95% CI) | 0.94 [0.87, 1.03] |
| 17 Uncontrolled loss of urine at 3 months postpartum Show forest plot | 1 | 949 | Risk Ratio (M‐H, Fixed, 95% CI) | 0.90 [0.74, 1.08] |
| 17.1 Women without previous vaginal birth | 1 | 572 | Risk Ratio (M‐H, Fixed, 95% CI) | 0.92 [0.71, 1.20] |
| 17.2 Women with previous vaginal birth | 1 | 377 | Risk Ratio (M‐H, Fixed, 95% CI) | 0.87 [0.66, 1.13] |
| 18 Uncontrolled loss of faeces at 3 months postpartum Show forest plot | 1 | 948 | Risk Ratio (M‐H, Random, 95% CI) | 0.70 [0.27, 1.80] |
| 18.1 Women without previous vaginal birth | 1 | 572 | Risk Ratio (M‐H, Random, 95% CI) | 1.02 [0.41, 2.54] |
| 18.2 Women with previous vaginal birth | 1 | 376 | Risk Ratio (M‐H, Random, 95% CI) | 0.38 [0.10, 1.41] |
| 19 Uncontrolled loss of flatus at 3 months postpartum Show forest plot | 1 | 948 | Risk Ratio (M‐H, Fixed, 95% CI) | 1.09 [0.88, 1.36] |
| 19.1 Women without previous vaginal birth | 1 | 571 | Risk Ratio (M‐H, Fixed, 95% CI) | 1.13 [0.85, 1.50] |
| 19.2 Women with previous vaginal birth | 1 | 377 | Risk Ratio (M‐H, Fixed, 95% CI) | 1.04 [0.74, 1.45] |
| Outcome or subgroup title | No. of studies | No. of participants | Statistical method | Effect size |
| 1 Perineal trauma requiring suturing Show forest plot | 3 | Risk Ratio (M‐H, Random, 95% CI) | Subtotals only | |
| 1.1 Average number of massages per week < 1.5 | 2 | 1500 | Risk Ratio (M‐H, Random, 95% CI) | 0.84 [0.74, 0.96] |
| 1.2 Average number of massages per week = 1.5 to 3.4 | 2 | 1650 | Risk Ratio (M‐H, Random, 95% CI) | 0.92 [0.85, 1.00] |
| 1.3 Average number of massages per week > 3.5 | 2 | 1598 | Risk Ratio (M‐H, Random, 95% CI) | 0.94 [0.86, 1.02] |
| 1.4 Any frequency of massage | 3 | 2417 | Risk Ratio (M‐H, Random, 95% CI) | 0.91 [0.86, 0.96] |
| 2 1st degree perineal tear Show forest plot | 3 | Risk Ratio (M‐H, Random, 95% CI) | Subtotals only | |
| 2.1 Average number of massages per week < 1.5 | 2 | 1500 | Risk Ratio (M‐H, Random, 95% CI) | 1.04 [0.60, 1.83] |
| 2.2 Average number of massages per week = 1.5 to 3.4 | 2 | 1650 | Risk Ratio (M‐H, Random, 95% CI) | 1.00 [0.75, 1.33] |
| 2.3 Average number of massages per week > 3.5 | 2 | 1598 | Risk Ratio (M‐H, Random, 95% CI) | 0.89 [0.67, 1.17] |
| 2.4 Any frequency of massage | 3 | 2417 | Risk Ratio (M‐H, Random, 95% CI) | 0.99 [0.71, 1.38] |
| 3 2nd degree perineal tear Show forest plot | 3 | Risk Ratio (M‐H, Fixed, 95% CI) | Subtotals only | |
| 3.1 Average number of massages per week < 1.5 | 2 | 1500 | Risk Ratio (M‐H, Fixed, 95% CI) | 1.00 [0.78, 1.27] |
| 3.2 Average number of massages per week = 1.5 to 3.4 | 2 | 1650 | Risk Ratio (M‐H, Fixed, 95% CI) | 0.94 [0.75, 1.16] |
| 3.3 Average number of massages per week > 3.5 | 2 | 1598 | Risk Ratio (M‐H, Fixed, 95% CI) | 1.02 [0.82, 1.27] |
| 3.4 Any frequency of massage | 3 | 2417 | Risk Ratio (M‐H, Fixed, 95% CI) | 0.98 [0.84, 1.14] |
| 4 3rd or 4th degree perineal trauma Show forest plot | 3 | Risk Ratio (M‐H, Random, 95% CI) | Subtotals only | |
| 4.1 Average number of massages per week < 1.5 | 2 | 1500 | Risk Ratio (M‐H, Random, 95% CI) | 0.82 [0.08, 8.48] |
| 4.2 Average number of massages per week = 1.5 to 3.4 | 2 | 1650 | Risk Ratio (M‐H, Random, 95% CI) | 0.64 [0.33, 1.25] |
| 4.3 Average number of massages per week > 3.5 | 2 | 1598 | Risk Ratio (M‐H, Random, 95% CI) | 1.19 [0.78, 1.81] |
| 4.4 Any frequency of massage | 3 | 2417 | Risk Ratio (M‐H, Random, 95% CI) | 0.81 [0.56, 1.19] |
| 5 Incidence of episiotomy Show forest plot | 3 | Risk Ratio (M‐H, Fixed, 95% CI) | Subtotals only | |
| 5.1 Average number of massages per week < 1.5 | 2 | 1500 | Risk Ratio (M‐H, Fixed, 95% CI) | 0.72 [0.57, 0.91] |
| 5.2 Average number of massages per week = 1.5 to 3.4 | 2 | 1650 | Risk Ratio (M‐H, Fixed, 95% CI) | 0.91 [0.77, 1.08] |
| 5.3 Average number of massages per week > 3.5 | 2 | 1598 | Risk Ratio (M‐H, Fixed, 95% CI) | 0.84 [0.67, 1.04] |
| 5.4 Any frequency of massage | 3 | 2417 | Risk Ratio (M‐H, Fixed, 95% CI) | 0.85 [0.75, 0.97] |
| 6 Length of second stage Show forest plot | 2 | Mean Difference (IV, Random, 95% CI) | Subtotals only | |
| 6.1 Average number of massages per week < 1.5 | 2 | 1403 | Mean Difference (IV, Random, 95% CI) | 0.97 [‐6.45, 8.39] |
| 6.2 Average number of massages per week = 1.5 to 3.4 | 2 | 1525 | Mean Difference (IV, Random, 95% CI) | ‐2.38 [‐8.55, 3.79] |
| 6.3 Average number of massages per week > 3.5 | 2 | 1509 | Mean Difference (IV, Random, 95% CI) | 10.80 [4.03, 17.58] |
| 6.4 Any frequency of massage | 2 | 2211 | Mean Difference (IV, Random, 95% CI) | 3.35 [‐1.29, 8.00] |
| 7 Instrumental delivery Show forest plot | 3 | Risk Ratio (M‐H, Random, 95% CI) | Subtotals only | |
| 7.1 Average number of massages per week < 1.5 | 2 | 1500 | Risk Ratio (M‐H, Random, 95% CI) | 0.89 [0.71, 1.13] |
| 7.2 Average number of massages per week = 1.5 to 3.4 | 2 | 1650 | Risk Ratio (M‐H, Random, 95% CI) | 0.88 [0.72, 1.07] |
| 7.3 Average number of massages per week > 3.5 | 2 | 1598 | Risk Ratio (M‐H, Random, 95% CI) | 1.07 [0.86, 1.33] |
| 7.4 Any frequency of massage | 3 | 2417 | Risk Ratio (M‐H, Random, 95% CI) | 0.93 [0.76, 1.13] |
| 8 Length of inpatient stay | 0 | Mean Difference (IV, Fixed, 95% CI) | Subtotals only | |
| 8.1 Average number of massages per week < 1.5 | 0 | 0 | Mean Difference (IV, Fixed, 95% CI) | 0.0 [0.0, 0.0] |
| 8.2 Average number of massages per week = 1.5 to 3.4 | 0 | 0 | Mean Difference (IV, Fixed, 95% CI) | 0.0 [0.0, 0.0] |
| 8.3 Average number of massages per week > 3.5 | 0 | 0 | Mean Difference (IV, Fixed, 95% CI) | 0.0 [0.0, 0.0] |
| 8.4 Any frequency of massage | 0 | 0 | Mean Difference (IV, Fixed, 95% CI) | 0.0 [0.0, 0.0] |
| 9 Admission to nursery | 0 | Risk Ratio (M‐H, Fixed, 95% CI) | Subtotals only | |
| 9.1 Average number of massages per week < 1.5 | 0 | 0 | Risk Ratio (M‐H, Fixed, 95% CI) | 0.0 [0.0, 0.0] |
| 9.2 Average number of massages per week = 1.5 to 3.4 | 0 | 0 | Risk Ratio (M‐H, Fixed, 95% CI) | 0.0 [0.0, 0.0] |
| 9.3 Average number of massages per week > 3.5 | 0 | 0 | Risk Ratio (M‐H, Fixed, 95% CI) | 0.0 [0.0, 0.0] |
| 9.4 Any frequency of massage | 0 | 0 | Risk Ratio (M‐H, Fixed, 95% CI) | 0.0 [0.0, 0.0] |
| 10 Apgar < 4 at 1 minute and/or Apgar < 7 at 5 minutes | 0 | Risk Ratio (M‐H, Fixed, 95% CI) | Subtotals only | |
| 10.1 Average number of massages per week < 1.5 | 0 | 0 | Risk Ratio (M‐H, Fixed, 95% CI) | 0.0 [0.0, 0.0] |
| 10.2 Average number of massages per week = 1.5 to 3.4 | 0 | 0 | Risk Ratio (M‐H, Fixed, 95% CI) | 0.0 [0.0, 0.0] |
| 10.3 Average number of massages per week > 3.5 | 0 | 0 | Risk Ratio (M‐H, Fixed, 95% CI) | 0.0 [0.0, 0.0] |
| 10.4 Any frequency of massage | 0 | 0 | Risk Ratio (M‐H, Fixed, 95% CI) | 0.0 [0.0, 0.0] |
| 11 Woman's satisfaction with perineal massage | 0 | Risk Ratio (M‐H, Fixed, 95% CI) | Subtotals only | |
| 11.1 Average number of massages per week < 1.5 | 0 | 0 | Risk Ratio (M‐H, Fixed, 95% CI) | 0.0 [0.0, 0.0] |
| 11.2 Average number of massages per week = 1.5 to 3.4 | 0 | 0 | Risk Ratio (M‐H, Fixed, 95% CI) | 0.0 [0.0, 0.0] |
| 11.3 Average number of massages per week > 3.5 | 0 | 0 | Risk Ratio (M‐H, Fixed, 95% CI) | 0.0 [0.0, 0.0] |
| 11.4 Any frequency of massage | 0 | 0 | Risk Ratio (M‐H, Fixed, 95% CI) | 0.0 [0.0, 0.0] |
| 12 Perineal pain postpartum | 0 | Mean Difference (IV, Fixed, 95% CI) | Subtotals only | |
| 12.1 Average number of massages per week < 1.5 | 0 | 0 | Mean Difference (IV, Fixed, 95% CI) | 0.0 [0.0, 0.0] |
| 12.2 Average number of massages per week = 1.5 to 3.4 | 0 | 0 | Mean Difference (IV, Fixed, 95% CI) | 0.0 [0.0, 0.0] |
| 12.3 Average number of massages per week > 3.5 | 0 | 0 | Mean Difference (IV, Fixed, 95% CI) | 0.0 [0.0, 0.0] |
| 12.4 Any frequency of massage | 0 | 0 | Mean Difference (IV, Fixed, 95% CI) | 0.0 [0.0, 0.0] |
| 13 Perineal pain at 3 months postpartum Show forest plot | 1 | Risk Ratio (M‐H, Fixed, 95% CI) | Subtotals only | |
| 13.1 Average number of massages per week < 1.5 | 1 | 577 | Risk Ratio (M‐H, Fixed, 95% CI) | 1.01 [0.65, 1.56] |
| 13.2 Average number of massages per week = 1.5 to 3.4 | 1 | 595 | Risk Ratio (M‐H, Fixed, 95% CI) | 0.69 [0.42, 1.13] |
| 13.3 Average number of massages per week > 3.5 | 1 | 701 | Risk Ratio (M‐H, Fixed, 95% CI) | 0.51 [0.33, 0.79] |
| 13.4 Any frequency of massage | 1 | 931 | Risk Ratio (M‐H, Fixed, 95% CI) | 0.67 [0.50, 0.92] |
| 14 Painful sex at 3 months postpartum Show forest plot | 1 | Risk Ratio (M‐H, Fixed, 95% CI) | Subtotals only | |
| 14.1 Average number of massages per week < 1.5 | 1 | 521 | Risk Ratio (M‐H, Fixed, 95% CI) | 0.85 [0.67, 1.08] |
| 14.2 Average number of massages per week = 1.5 to 3.4 | 1 | 538 | Risk Ratio (M‐H, Fixed, 95% CI) | 1.03 [0.85, 1.25] |
| 14.3 Average number of massages per week > 3.5 | 1 | 622 | Risk Ratio (M‐H, Fixed, 95% CI) | 0.96 [0.81, 1.13] |
| 14.4 Any frequency of massage | 1 | 831 | Risk Ratio (M‐H, Fixed, 95% CI) | 0.95 [0.83, 1.09] |
| 15 Woman's sexual satisfaction at 3 months postpartum Show forest plot | 1 | Risk Ratio (M‐H, Fixed, 95% CI) | Subtotals only | |
| 15.1 Average number of massages per week < 1.5 | 1 | 569 | Risk Ratio (M‐H, Fixed, 95% CI) | 1.04 [0.93, 1.16] |
| 15.2 Average number of massages per week = 1.5 to 3.4 | 1 | 588 | Risk Ratio (M‐H, Fixed, 95% CI) | 1.08 [0.98, 1.19] |
| 15.3 Average number of massages per week > 3.5 | 1 | 692 | Risk Ratio (M‐H, Fixed, 95% CI) | 0.99 [0.90, 1.08] |
| 15.4 Any frequency of massage | 1 | 921 | Risk Ratio (M‐H, Fixed, 95% CI) | 1.02 [0.96, 1.10] |
| 16 Partner's sexual satisfaction at 3 months postpartum Show forest plot | 1 | Risk Ratio (M‐H, Fixed, 95% CI) | Subtotals only | |
| 16.1 Average number of massages per week < 1.5 | 1 | 576 | Risk Ratio (M‐H, Fixed, 95% CI) | 1.01 [0.91, 1.11] |
| 16.2 Average number of massages per week = 1.5 to 3.4 | 1 | 586 | Risk Ratio (M‐H, Fixed, 95% CI) | 1.03 [0.95, 1.13] |
| 16.3 Average number of massages per week > 3.5 | 1 | 688 | Risk Ratio (M‐H, Fixed, 95% CI) | 0.93 [0.86, 1.02] |
| 16.4 Any frequency of massage | 1 | 916 | Risk Ratio (M‐H, Fixed, 95% CI) | 0.97 [0.91, 1.04] |
| 17 Uncontrolled loss of urine at 3 months postpartum Show forest plot | 1 | Risk Ratio (M‐H, Fixed, 95% CI) | Subtotals only | |
| 17.1 Average number of massages per week < 1.5 | 1 | 587 | Risk Ratio (M‐H, Fixed, 95% CI) | 1.10 [0.83, 1.46] |
| 17.2 Average number of massages per week = 1.5 to 3.4 | 1 | 606 | Risk Ratio (M‐H, Fixed, 95% CI) | 0.84 [0.62, 1.15] |
| 17.3 Average number of massages per week > 3.5 | 1 | 714 | Risk Ratio (M‐H, Fixed, 95% CI) | 0.83 [0.65, 1.06] |
| 17.4 Any frequency of massage | 1 | 949 | Risk Ratio (M‐H, Fixed, 95% CI) | 0.90 [0.74, 1.08] |
| 18 Uncontrolled loss of faeces at 3 months postpartum Show forest plot | 1 | Risk Ratio (M‐H, Fixed, 95% CI) | Subtotals only | |
| 18.1 Average number of massages per week < 1.5 | 1 | 586 | Risk Ratio (M‐H, Fixed, 95% CI) | 1.04 [0.36, 3.03] |
| 18.2 Average number of massages per week = 1.5 to 3.4 | 1 | 605 | Risk Ratio (M‐H, Fixed, 95% CI) | 0.44 [0.10, 1.89] |
| 18.3 Average number of massages per week > 3.5 | 1 | 713 | Risk Ratio (M‐H, Fixed, 95% CI) | 0.72 [0.29, 1.80] |
| 18.4 Any frequency of massage | 1 | 948 | Risk Ratio (M‐H, Fixed, 95% CI) | 0.72 [0.35, 1.49] |
| 19 Uncontrolled loss of flatus at 3 months postpartum Show forest plot | 1 | 2854 | Risk Ratio (M‐H, Fixed, 95% CI) | 1.09 [0.95, 1.25] |
| 19.1 Average number of massages per week < 1.5 | 1 | 587 | Risk Ratio (M‐H, Fixed, 95% CI) | 1.40 [1.03, 1.90] |
| 19.2 Average number of massages per week = 1.5 to 3.4 | 1 | 606 | Risk Ratio (M‐H, Fixed, 95% CI) | 0.87 [0.60, 1.26] |
| 19.3 Average number of massages per week > 3.5 | 1 | 713 | Risk Ratio (M‐H, Fixed, 95% CI) | 1.07 [0.82, 1.39] |
| 19.4 Any frequency of massage | 1 | 948 | Risk Ratio (M‐H, Fixed, 95% CI) | 1.09 [0.88, 1.36] |