Masaje perineal prenatal para reducir el trauma perineal
Appendices
Appendix 1. Search strategy
CENTRAL (The Cochrane Library 2012, Issue 10), PubMed (1966 to October 2012) and EMBASE (1980 to October 2012) adapted for each database by selecting appropriate subject headings and/or free text terms.
#1 PERINEUM (MeSH)
#2 perine*
#3 MASSAGE (MeSH)
#4 massag*
#5 EPISIOTOMY (MeSH)
#6 episiotom*
#7 LACERATION (MeSH)
#8 lacerat*
#9 #1 or #2
#10 #3 or #4
#11 #5 or #6
#12 #7 or #8
#13 #9 and #10
#14 #11 and #10
#15 #12 and #10
#16 #13 or #14 or #15
Appendix 2. Data collection and analysis ‐ methods used in previous versions
We considered for inclusion all studies identified by the search strategy outlined above. Both review authors independently evaluated trials under consideration for appropriateness for inclusion and methodological quality without consideration of their results. Any differences of opinion were resolved by open discussion. We recorded and reported in the review the reasons for excluding trials. Both review authors independently entered the extracted data into Review Manager (RevMan 2008). We performed statistical analyses using Review Manager.
We assessed included trial data as described in the Cochrane Handbook for Systematic Reviews of Interventions (Higgins 2008). We described methods used for generation of the randomisation sequence for each trial.
(1) Selection bias (allocation concealment)
We assigned a quality score for each trial, using the following criteria:
(A) adequate concealment of allocation, such as: telephone randomisation, consecutively numbered sealed opaque envelopes;
(B) unclear whether adequate concealment of allocation, such as: list or table used, sealed envelopes, or study does not report any concealment approach;
(C) inadequate concealment of allocation, such as: open list of random‐number tables, use of case record numbers, dates of birth or days of the week.
(2) Attrition bias (loss of participants, e.g. withdrawals, dropouts, protocol deviations)
We assessed completeness to follow up using the following criteria:
(A) less than 5% loss of participants;
(B) 5% to 9.9% loss of participants;
(C) 10% to 19.9% loss of participants;
(D) more than 20% loss of participants.
(3) Performance bias (blinding of participants, researchers and outcome assessment)
We assessed blinding using the following criteria:
(A) blinding of participants (yes/no/unclear);
(B) blinding of caregiver (yes/no/unclear);
(C) blinding of outcome assessment (yes/no/unclear).
For dichotomous data we calculated the relative risks and 95% confidence intervals (CI) and pooled the results using a fixed‐effect model. For continuous data we used mean differences and 95% CI. We evaluated statistical heterogeneity by a visual inspection of forest plots and using the I² statistic as calculated in 'RevMan Analyses'. We detected no significant heterogeneity (I² statistic greater than 50%) in any of the outcome measures.
We attempted to undertake the following subgroup analyses:
(a) women with previous vaginal birth versus without previous vaginal birth;
(b) digital perineal massage versus massaging device;
(c) daily perineal massage versus less frequent perineal massage.
Appendix 3. Data collection and analysis ‐ methods to be used in future updates
Selection of studies
Two review authors will independently assess for inclusion all the potential studies we identify as a result of the search strategy. We will resolve any disagreement through discussion or, if required, we will consult the third review author.
We will design a form to extract data. For eligible studies, two review authors will extract the data using the agreed form. We will resolve discrepancies through discussion or, if required, we will consult the third review author. Data will be entered into Review Manager software (RevMan 2011) and checked for accuracy.
When information regarding any of the above is unclear, we will attempt to contact authors of the original reports to provide further details.
Assessment of risk of bias in included studies
Two review authors will independently assess risk of bias for each study using the criteria outlined in the Cochrane Handbook for Systematic Reviews of Interventions (Higgins 2011). Any disagreement will be resolved by discussion or by involving a third assessor.
(1) Random sequence generation (checking for possible selection bias)
We will describe for each included study the method used to generate the allocation sequence in sufficient detail to allow an assessment of whether it should produce comparable groups.
We will assess the method as:
-
low risk of bias (any truly random process, e.g. random number table; computer random number generator);
-
high risk of bias (any non‐random process, e.g. odd or even date of birth; hospital or clinic record number);
-
unclear risk of bias.
(2) Allocation concealment (checking for possible selection bias)
We will describe for each included study the method used to conceal allocation to interventions prior to assignment and will assess whether intervention allocation could have been foreseen in advance of, or during recruitment, or changed after assignment.
We will assess the methods as:
-
low risk of bias (e.g. telephone or central randomisation; consecutively numbered sealed opaque envelopes);
-
high risk of bias (open random allocation; unsealed or non‐opaque envelopes, alternation; date of birth);
-
unclear risk of bias.
(3.1) Blinding of participants and personnel (checking for possible performance bias)
We will describe for each included study the methods used, if any, to blind study participants and personnel from knowledge of which intervention a participant received. We will consider that studies are at low risk of bias if they were blinded, or if we judge that the lack of blinding would be unlikely to affect results. We will assess blinding separately for different outcomes or classes of outcomes.
We will assess the methods as:
-
low, high or unclear risk of bias for participants;
-
low, high or unclear risk of bias for personnel.
(3.2) Blinding of outcome assessment (checking for possible detection bias)
We will describe for each included study the methods used, if any, to blind outcome assessors from knowledge of which intervention a participant received. We will assess blinding separately for different outcomes or classes of outcomes.
We will assess methods used to blind outcome assessment as:
-
low, high or unclear risk of bias.
(4) Incomplete outcome data (checking for possible attrition bias due to the amount, nature and handling of incomplete outcome data)
We will describe for each included study, and for each outcome or class of outcomes, the completeness of data including attrition and exclusions from the analysis. We will state whether attrition and exclusions were reported and the numbers included in the analysis at each stage (compared with the total randomised participants), reasons for attrition or exclusion where reported, and whether missing data were balanced across groups or were related to outcomes. Where sufficient information is reported, or can be supplied by the trial authors, we will re‐include missing data in the analyses which we undertake.
We will assess methods as:
-
low risk of bias (e.g. no missing outcome data; missing outcome data balanced across groups);
-
high risk of bias (e.g. numbers or reasons for missing data imbalanced across groups; ‘as treated’ analysis done with substantial departure of intervention received from that assigned at randomisation);
-
unclear risk of bias.
(5) Selective reporting (checking for reporting bias)
We will describe for each included study how we investigated the possibility of selective outcome reporting bias and what we found.
We will assess the methods as:
-
low risk of bias (where it is clear that all of the study’s pre‐specified outcomes and all expected outcomes of interest to the review have been reported);
-
high risk of bias (where not all the study’s pre‐specified outcomes have been reported; one or more reported primary outcomes were not pre‐specified; outcomes of interest are reported incompletely and so cannot be used; study fails to include results of a key outcome that would have been expected to have been reported);
-
unclear risk of bias.
(6) Other bias (checking for bias due to problems not covered by (1) to (5) above)
We will describe for each included study any important concerns we have about other possible sources of bias.
(7) Overall risk of bias
We will make explicit judgements about whether studies are at high risk of bias, according to the criteria given in the Handbook (Higgins 2011). With reference to (1) to (6) above, we will assess the likely magnitude and direction of the bias and whether we consider it is likely to impact on the findings. We will explore the impact of the level of bias through undertaking sensitivity analyses ‐ see Sensitivity analysis.
Measures of treatment effect
Dichotomous data
For dichotomous data, we will present results as summary risk ratio with 95% confidence intervals.
Continuous data
For continuous data, we will use the mean difference if outcomes are measured in the same way between trials. We will use the standardised mean difference to combine trials that measure the same outcome, but use different methods.
Unit of analysis issues
Cluster‐randomised trials
We will include cluster‐randomised trials in the analyses along with individually‐randomised trials. Their sample sizes or standard errors will be adjusted using the methods described in the Handbook using an estimate of the intracluster correlation co‐efficient (ICC) derived from the trial (if possible), or from another source. If ICCs from other sources are used, this will be reported and sensitivity analyses conducted to investigate the effect of variation in the ICC. If we identify both cluster‐randomised trials and individually‐randomised trials, we plan to synthesise the relevant information. We will consider it reasonable to combine the results from both if there is little heterogeneity between the study designs and the interaction between the effect of intervention and the choice of randomisation unit is considered to be unlikely.
We will also acknowledge heterogeneity in the randomisation unit and perform a separate meta‐analysis.
Cross‐over trials
Cross‐over trials will be excluded from this review.
Dealing with missing data
For included studies, levels of attrition will be noted. The impact of including studies with high levels of missing data in the overall assessment of treatment effect will be explored by using sensitivity analysis.
For all outcomes, analyses will be carried out, as far as possible, on an intention‐to‐treat basis i.e. we will attempt to include all participants randomised to each group in the analyses. The denominator for each outcome in each trial will be the number randomised minus any participants whose outcomes are known to be missing.
Assessment of heterogeneity
We will assess statistical heterogeneity in each meta‐analysis using the T², I² and Chi² statistics. We will regard heterogeneity as substantial if I² is greater than 50% and either T² is greater than zero, or there is a low P value (less than 0.10) in the Chi² test for heterogeneity. If we identify substantial heterogeneity (above 50%), we will explore it by pre‐specified subgroup analysis.
Assessment of reporting biases
If there are 10 or more studies in the meta‐analysis, we will investigate reporting biases (such as publication bias) using funnel plots. We will assess funnel plot asymmetry visually. If asymmetry is suggested by a visual assessment, we will perform exploratory analyses to investigate it.
Data synthesis
We will carry out statistical analysis using the Review Manager software (RevMan 2011). We will use fixed‐effect meta‐analysis for combining data where it is reasonable to assume that studies are estimating the same underlying treatment effect: i.e. where trials are examining the same intervention, and the trials’ populations and methods are judged sufficiently similar. If there is clinical heterogeneity sufficient to expect that the underlying treatment effects differ between trials, or if substantial statistical heterogeneity is detected, we will use random‐effects meta‐analysis to produce an overall summary if an average treatment effect across trials is considered clinically meaningful. The random‐effects summary will be treated as the average range of possible treatment effects and we will discuss the clinical implications of treatment effects differing between trials. If the average treatment effect is not clinically meaningful, we will not combine trials. If we use random‐effects analyses, the results will be presented as the average treatment effect with 95% confidence intervals, and the estimates of T² and I².
Subgroup analysis and investigation of heterogeneity
If we identify substantial heterogeneity, we will investigate it using subgroup analyses and sensitivity analyses. We will consider whether an overall summary is meaningful, and if it is, use random‐effects analysis to produce it.
We plan to carry out the following subgroup analyses:
-
women with previous vaginal birth versus without previous vaginal birth;
-
digital perineal massage versus massaging device;
-
daily perineal massage versus less frequent perineal massage.
Subgroup analyses will be conducted on all the review's outcomes.
We will assess differences between subgroups by interaction tests available within RevMan (RevMan 2011).
Sensitivity analysis
We plan to carry out sensitivity analyses to explore the effect of trial quality assessed by concealment of allocation, high attrition rates, or both, with poor quality studies being excluded from the analyses in order to assess whether this makes any difference to the overall result.

'Risk of bias' graph: review authors' judgements about each risk of bias item presented as percentages across all included studies.

'Risk of bias' summary: review authors' judgements about each risk of bias item for each included study.
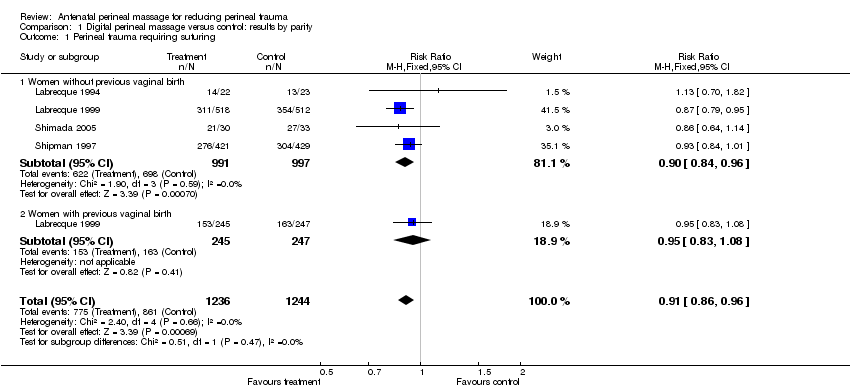
Comparison 1 Digital perineal massage versus control: results by parity, Outcome 1 Perineal trauma requiring suturing.
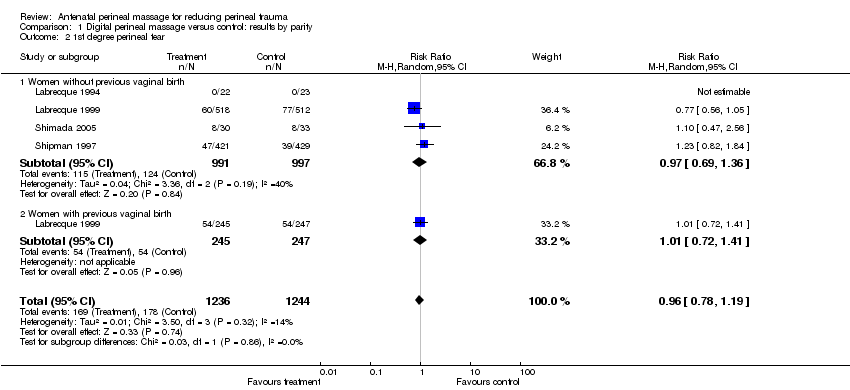
Comparison 1 Digital perineal massage versus control: results by parity, Outcome 2 1st degree perineal tear.

Comparison 1 Digital perineal massage versus control: results by parity, Outcome 3 2nd degree perineal tear.

Comparison 1 Digital perineal massage versus control: results by parity, Outcome 4 3rd or 4th degree perineal trauma.

Comparison 1 Digital perineal massage versus control: results by parity, Outcome 5 Incidence of episiotomy.
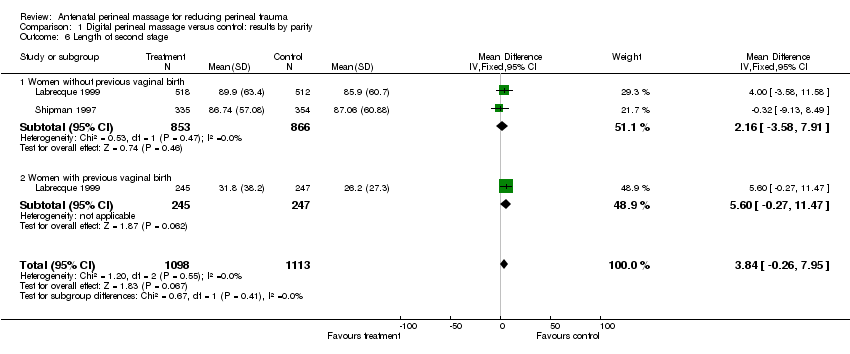
Comparison 1 Digital perineal massage versus control: results by parity, Outcome 6 Length of second stage.
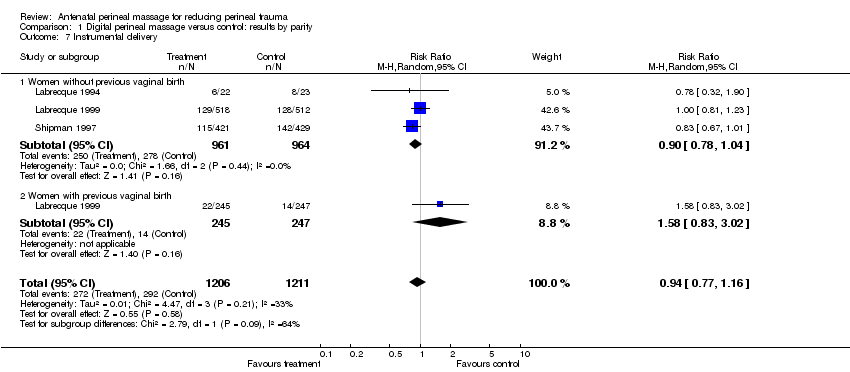
Comparison 1 Digital perineal massage versus control: results by parity, Outcome 7 Instrumental delivery.

Comparison 1 Digital perineal massage versus control: results by parity, Outcome 13 Perineal pain at 3 months postpartum.

Comparison 1 Digital perineal massage versus control: results by parity, Outcome 14 Painful sex at 3 months postpartum.
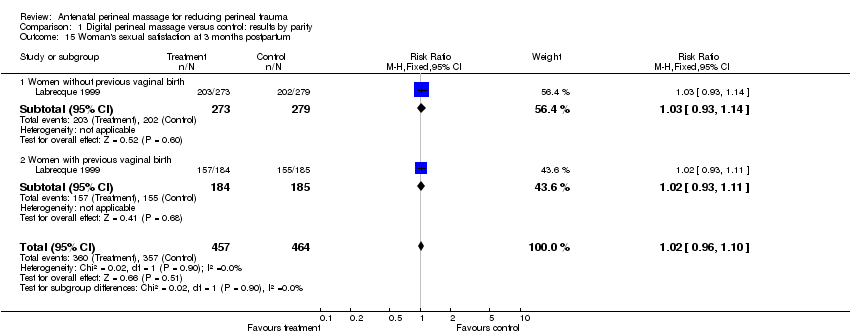
Comparison 1 Digital perineal massage versus control: results by parity, Outcome 15 Woman's sexual satisfaction at 3 months postpartum.

Comparison 1 Digital perineal massage versus control: results by parity, Outcome 16 Partner's sexual satisfaction at 3 months postpartum.
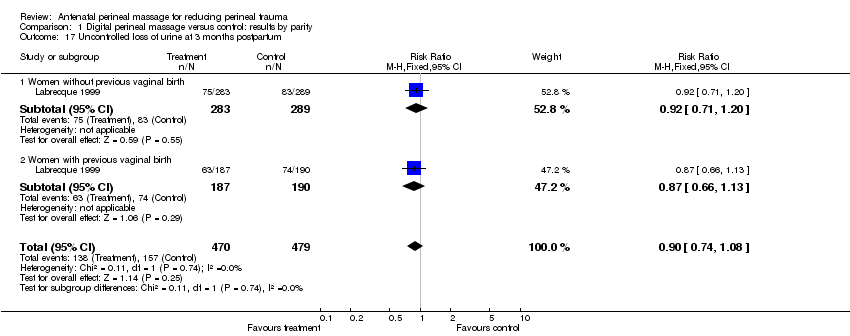
Comparison 1 Digital perineal massage versus control: results by parity, Outcome 17 Uncontrolled loss of urine at 3 months postpartum.
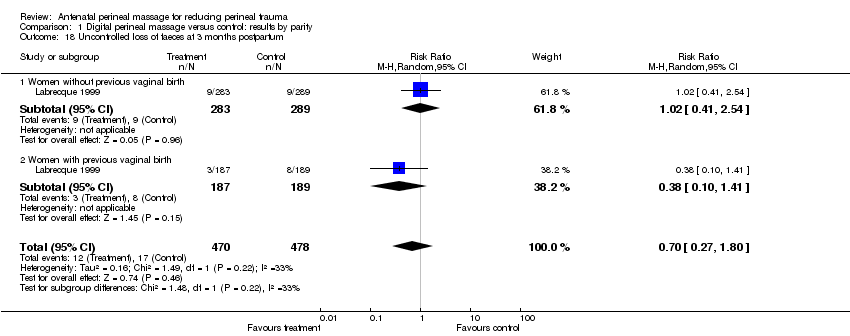
Comparison 1 Digital perineal massage versus control: results by parity, Outcome 18 Uncontrolled loss of faeces at 3 months postpartum.

Comparison 1 Digital perineal massage versus control: results by parity, Outcome 19 Uncontrolled loss of flatus at 3 months postpartum.
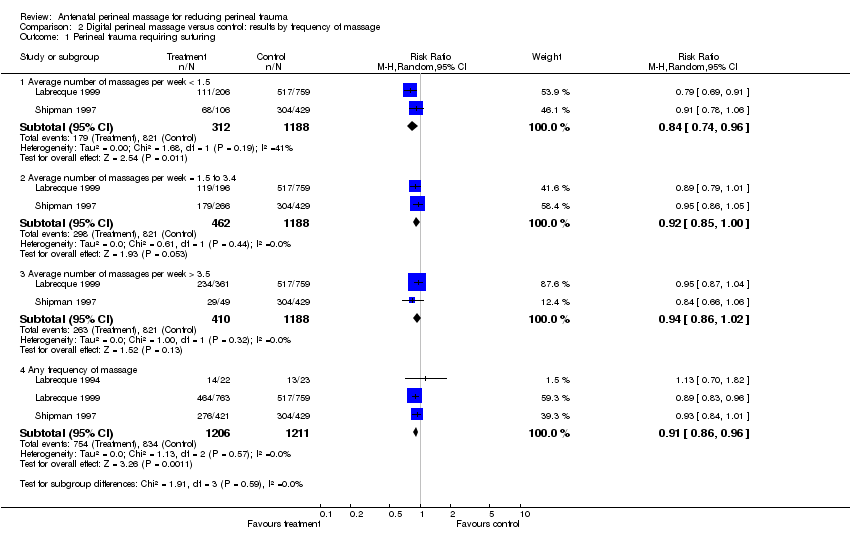
Comparison 2 Digital perineal massage versus control: results by frequency of massage, Outcome 1 Perineal trauma requiring suturing.
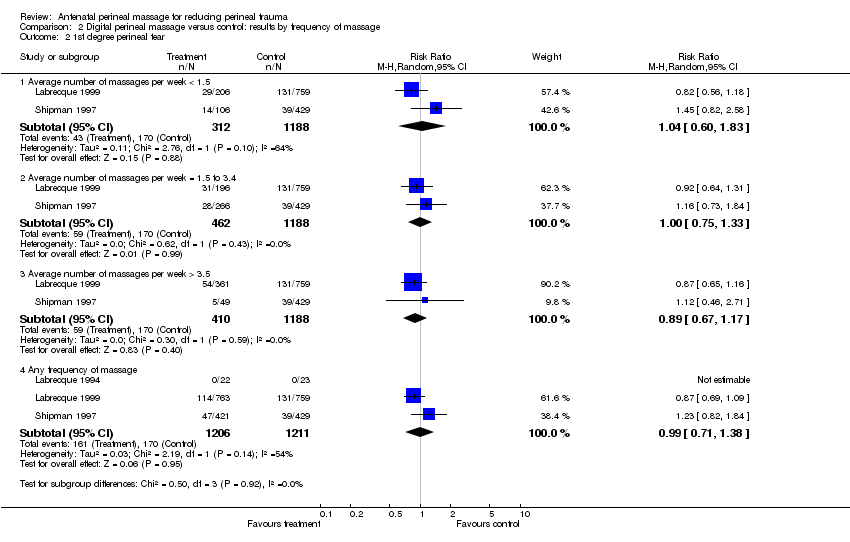
Comparison 2 Digital perineal massage versus control: results by frequency of massage, Outcome 2 1st degree perineal tear.
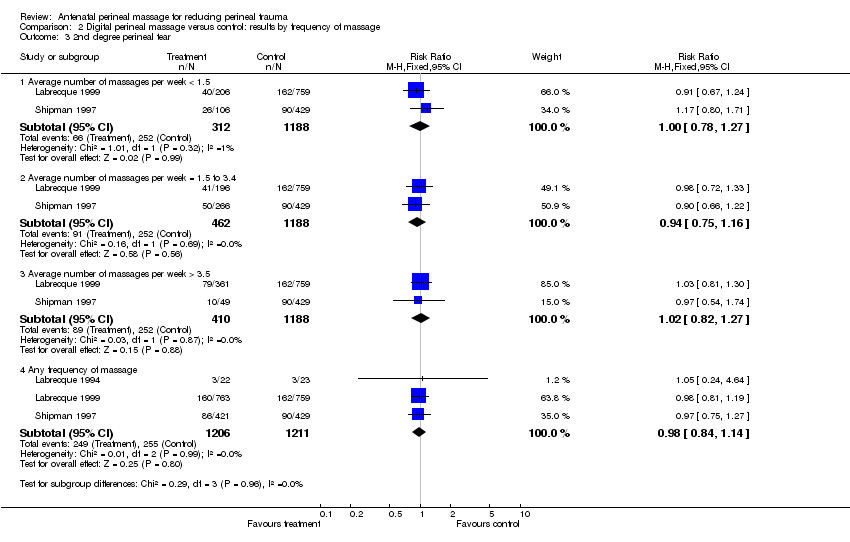
Comparison 2 Digital perineal massage versus control: results by frequency of massage, Outcome 3 2nd degree perineal tear.
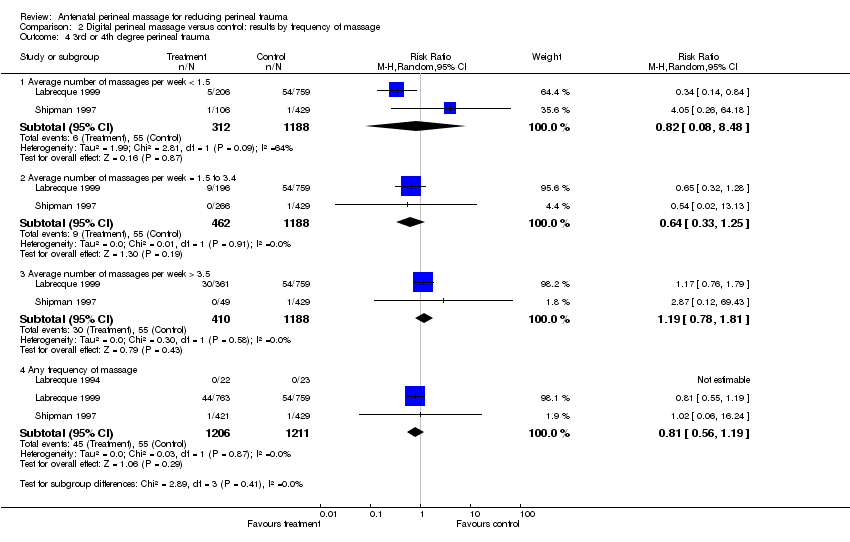
Comparison 2 Digital perineal massage versus control: results by frequency of massage, Outcome 4 3rd or 4th degree perineal trauma.
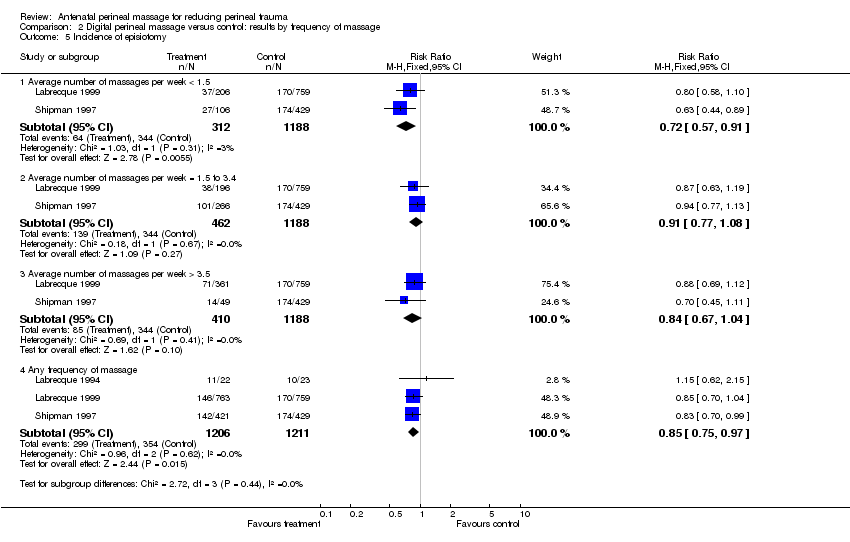
Comparison 2 Digital perineal massage versus control: results by frequency of massage, Outcome 5 Incidence of episiotomy.

Comparison 2 Digital perineal massage versus control: results by frequency of massage, Outcome 6 Length of second stage.

Comparison 2 Digital perineal massage versus control: results by frequency of massage, Outcome 7 Instrumental delivery.
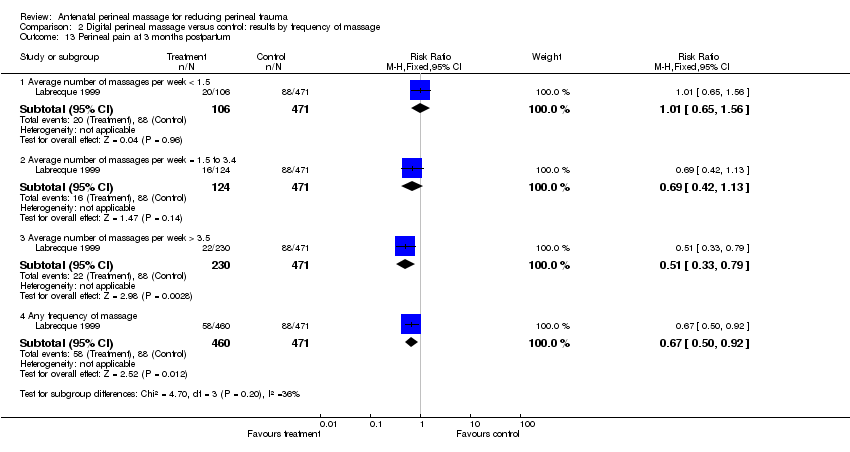
Comparison 2 Digital perineal massage versus control: results by frequency of massage, Outcome 13 Perineal pain at 3 months postpartum.

Comparison 2 Digital perineal massage versus control: results by frequency of massage, Outcome 14 Painful sex at 3 months postpartum.
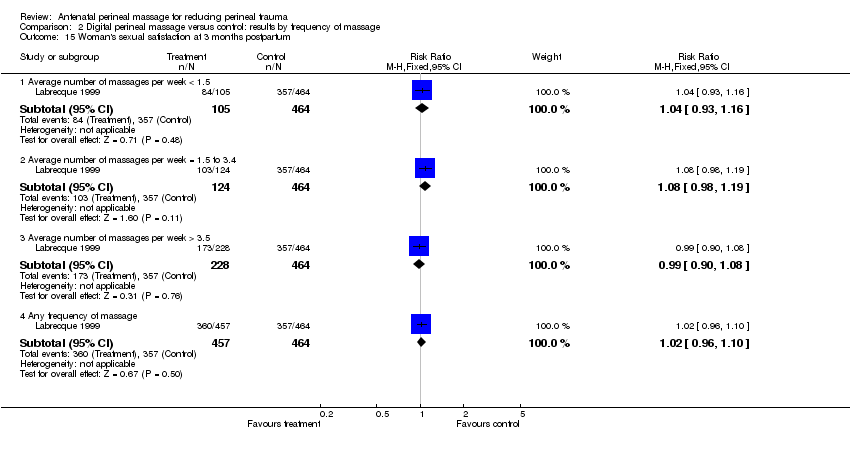
Comparison 2 Digital perineal massage versus control: results by frequency of massage, Outcome 15 Woman's sexual satisfaction at 3 months postpartum.

Comparison 2 Digital perineal massage versus control: results by frequency of massage, Outcome 16 Partner's sexual satisfaction at 3 months postpartum.
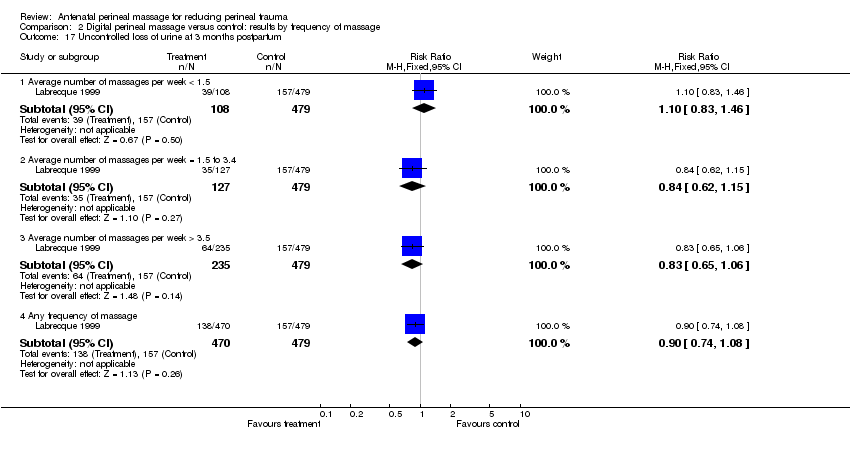
Comparison 2 Digital perineal massage versus control: results by frequency of massage, Outcome 17 Uncontrolled loss of urine at 3 months postpartum.

Comparison 2 Digital perineal massage versus control: results by frequency of massage, Outcome 18 Uncontrolled loss of faeces at 3 months postpartum.

Comparison 2 Digital perineal massage versus control: results by frequency of massage, Outcome 19 Uncontrolled loss of flatus at 3 months postpartum.
| Treatment | Control | Risk ratio, M‐H, Fixed, 95% CI | |||
| Events | Total | Events | Total | ||
| Reporting of infrequent flatal incontinence | 21 | 108 | 107 | 479 | 0.87 (0.57,1.32) |
| Reporting of flatal incontinence at least daily | 6 | 108 | 10 | 479 | 2.66 (0.99,7.16) |
| Duration | All women | Excl episiotomy |
| Length of 2nd stage (mins) | +3.84 (95% CI ‐0.26 to +7.95) | +3.57 (95% CI ‐0.86 to +8.00) |
| Length of 2nd stage for women massaging more than 3.5 times/week (mins) | +10.80 (95% CI +4.03 to +17.58) | +5.21 (95% CI ‐1.45 to +11.86) |
| mins: minutes | ||
| Outcome or subgroup title | No. of studies | No. of participants | Statistical method | Effect size |
| 1 Perineal trauma requiring suturing Show forest plot | 4 | 2480 | Risk Ratio (M‐H, Fixed, 95% CI) | 0.91 [0.86, 0.96] |
| 1.1 Women without previous vaginal birth | 4 | 1988 | Risk Ratio (M‐H, Fixed, 95% CI) | 0.90 [0.84, 0.96] |
| 1.2 Women with previous vaginal birth | 1 | 492 | Risk Ratio (M‐H, Fixed, 95% CI) | 0.95 [0.83, 1.08] |
| 2 1st degree perineal tear Show forest plot | 4 | 2480 | Risk Ratio (M‐H, Random, 95% CI) | 0.96 [0.78, 1.19] |
| 2.1 Women without previous vaginal birth | 4 | 1988 | Risk Ratio (M‐H, Random, 95% CI) | 0.97 [0.69, 1.36] |
| 2.2 Women with previous vaginal birth | 1 | 492 | Risk Ratio (M‐H, Random, 95% CI) | 1.01 [0.72, 1.41] |
| 3 2nd degree perineal tear Show forest plot | 4 | 2480 | Risk Ratio (M‐H, Fixed, 95% CI) | 0.99 [0.85, 1.15] |
| 3.1 Women without previous vaginal birth | 4 | 1988 | Risk Ratio (M‐H, Fixed, 95% CI) | 1.00 [0.84, 1.19] |
| 3.2 Women with previous vaginal birth | 1 | 492 | Risk Ratio (M‐H, Fixed, 95% CI) | 0.96 [0.72, 1.29] |
| 4 3rd or 4th degree perineal trauma Show forest plot | 4 | 2480 | Risk Ratio (M‐H, Fixed, 95% CI) | 0.81 [0.56, 1.18] |
| 4.1 Women without previous vaginal birth | 4 | 1988 | Risk Ratio (M‐H, Fixed, 95% CI) | 0.82 [0.56, 1.20] |
| 4.2 Women with previous vaginal birth | 1 | 492 | Risk Ratio (M‐H, Fixed, 95% CI) | 0.50 [0.05, 5.52] |
| 5 Incidence of episiotomy Show forest plot | 4 | 2480 | Risk Ratio (M‐H, Fixed, 95% CI) | 0.84 [0.74, 0.95] |
| 5.1 Women without previous vaginal birth | 4 | 1988 | Risk Ratio (M‐H, Fixed, 95% CI) | 0.83 [0.73, 0.95] |
| 5.2 Women with previous vaginal birth | 1 | 492 | Risk Ratio (M‐H, Fixed, 95% CI) | 0.86 [0.57, 1.30] |
| 6 Length of second stage Show forest plot | 2 | 2211 | Mean Difference (IV, Fixed, 95% CI) | 3.84 [‐0.26, 7.95] |
| 6.1 Women without previous vaginal birth | 2 | 1719 | Mean Difference (IV, Fixed, 95% CI) | 2.16 [‐3.58, 7.91] |
| 6.2 Women with previous vaginal birth | 1 | 492 | Mean Difference (IV, Fixed, 95% CI) | 5.60 [‐0.27, 11.47] |
| 7 Instrumental delivery Show forest plot | 3 | 2417 | Risk Ratio (M‐H, Random, 95% CI) | 0.94 [0.77, 1.16] |
| 7.1 Women without previous vaginal birth | 3 | 1925 | Risk Ratio (M‐H, Random, 95% CI) | 0.90 [0.78, 1.04] |
| 7.2 Women with previous vaginal birth | 1 | 492 | Risk Ratio (M‐H, Random, 95% CI) | 1.58 [0.83, 3.02] |
| 8 Length of inpatient stay | 0 | 0 | Mean Difference (IV, Fixed, 95% CI) | 0.0 [0.0, 0.0] |
| 8.1 Women without previous vaginal birth | 0 | 0 | Mean Difference (IV, Fixed, 95% CI) | 0.0 [0.0, 0.0] |
| 8.2 Women with previous vaginal birth | 0 | 0 | Mean Difference (IV, Fixed, 95% CI) | 0.0 [0.0, 0.0] |
| 9 Admission to nursery | 0 | 0 | Risk Ratio (M‐H, Fixed, 95% CI) | 0.0 [0.0, 0.0] |
| 9.1 Women without previous vaginal birth | 0 | 0 | Risk Ratio (M‐H, Fixed, 95% CI) | 0.0 [0.0, 0.0] |
| 9.2 Women with previous vaginal birth | 0 | 0 | Risk Ratio (M‐H, Fixed, 95% CI) | 0.0 [0.0, 0.0] |
| 10 Apgar < 4 at 1 minute and/or Apgar < 7 at 5 minutes | 0 | 0 | Risk Ratio (M‐H, Fixed, 95% CI) | 0.0 [0.0, 0.0] |
| 10.1 Women without previous vaginal birth | 0 | 0 | Risk Ratio (M‐H, Fixed, 95% CI) | 0.0 [0.0, 0.0] |
| 10.2 Women with previous vaginal birth | 0 | 0 | Risk Ratio (M‐H, Fixed, 95% CI) | 0.0 [0.0, 0.0] |
| 11 Woman's satisfaction with perineal massage | 0 | 0 | Risk Ratio (M‐H, Fixed, 95% CI) | 0.0 [0.0, 0.0] |
| 11.1 Women without previous vaginal birth | 0 | 0 | Risk Ratio (M‐H, Fixed, 95% CI) | 0.0 [0.0, 0.0] |
| 11.2 Women with previous vaginal birth | 0 | 0 | Risk Ratio (M‐H, Fixed, 95% CI) | 0.0 [0.0, 0.0] |
| 12 Perineal pain postpartum | 0 | 0 | Mean Difference (IV, Fixed, 95% CI) | 0.0 [0.0, 0.0] |
| 12.1 Women without previous vaginal birth | 0 | 0 | Mean Difference (IV, Fixed, 95% CI) | 0.0 [0.0, 0.0] |
| 12.2 Women with previous vaginal birth | 0 | 0 | Mean Difference (IV, Fixed, 95% CI) | 0.0 [0.0, 0.0] |
| 13 Perineal pain at 3 months postpartum Show forest plot | 1 | 931 | Risk Ratio (M‐H, Random, 95% CI) | 0.64 [0.39, 1.06] |
| 13.1 Women without previous vaginal birth | 1 | 555 | Risk Ratio (M‐H, Random, 95% CI) | 0.77 [0.55, 1.09] |
| 13.2 Women with previous vaginal birth | 1 | 376 | Risk Ratio (M‐H, Random, 95% CI) | 0.45 [0.24, 0.87] |
| 14 Painful sex at 3 months postpartum Show forest plot | 1 | 831 | Risk Ratio (M‐H, Fixed, 95% CI) | 0.96 [0.84, 1.08] |
| 14.1 Women without previous vaginal birth | 1 | 493 | Risk Ratio (M‐H, Fixed, 95% CI) | 0.97 [0.85, 1.11] |
| 14.2 Women with previous vaginal birth | 1 | 338 | Risk Ratio (M‐H, Fixed, 95% CI) | 0.92 [0.68, 1.24] |
| 15 Woman's sexual satisfaction at 3 months postpartum Show forest plot | 1 | 921 | Risk Ratio (M‐H, Fixed, 95% CI) | 1.02 [0.96, 1.10] |
| 15.1 Women without previous vaginal birth | 1 | 552 | Risk Ratio (M‐H, Fixed, 95% CI) | 1.03 [0.93, 1.14] |
| 15.2 Women with previous vaginal birth | 1 | 369 | Risk Ratio (M‐H, Fixed, 95% CI) | 1.02 [0.93, 1.11] |
| 16 Partner's sexual satisfaction at 3 months postpartum Show forest plot | 1 | 916 | Risk Ratio (M‐H, Fixed, 95% CI) | 0.97 [0.91, 1.04] |
| 16.1 Women without previous vaginal birth | 1 | 548 | Risk Ratio (M‐H, Fixed, 95% CI) | 0.99 [0.90, 1.09] |
| 16.2 Women with previous vaginal birth | 1 | 368 | Risk Ratio (M‐H, Fixed, 95% CI) | 0.94 [0.87, 1.03] |
| 17 Uncontrolled loss of urine at 3 months postpartum Show forest plot | 1 | 949 | Risk Ratio (M‐H, Fixed, 95% CI) | 0.90 [0.74, 1.08] |
| 17.1 Women without previous vaginal birth | 1 | 572 | Risk Ratio (M‐H, Fixed, 95% CI) | 0.92 [0.71, 1.20] |
| 17.2 Women with previous vaginal birth | 1 | 377 | Risk Ratio (M‐H, Fixed, 95% CI) | 0.87 [0.66, 1.13] |
| 18 Uncontrolled loss of faeces at 3 months postpartum Show forest plot | 1 | 948 | Risk Ratio (M‐H, Random, 95% CI) | 0.70 [0.27, 1.80] |
| 18.1 Women without previous vaginal birth | 1 | 572 | Risk Ratio (M‐H, Random, 95% CI) | 1.02 [0.41, 2.54] |
| 18.2 Women with previous vaginal birth | 1 | 376 | Risk Ratio (M‐H, Random, 95% CI) | 0.38 [0.10, 1.41] |
| 19 Uncontrolled loss of flatus at 3 months postpartum Show forest plot | 1 | 948 | Risk Ratio (M‐H, Fixed, 95% CI) | 1.09 [0.88, 1.36] |
| 19.1 Women without previous vaginal birth | 1 | 571 | Risk Ratio (M‐H, Fixed, 95% CI) | 1.13 [0.85, 1.50] |
| 19.2 Women with previous vaginal birth | 1 | 377 | Risk Ratio (M‐H, Fixed, 95% CI) | 1.04 [0.74, 1.45] |
| Outcome or subgroup title | No. of studies | No. of participants | Statistical method | Effect size |
| 1 Perineal trauma requiring suturing Show forest plot | 3 | Risk Ratio (M‐H, Random, 95% CI) | Subtotals only | |
| 1.1 Average number of massages per week < 1.5 | 2 | 1500 | Risk Ratio (M‐H, Random, 95% CI) | 0.84 [0.74, 0.96] |
| 1.2 Average number of massages per week = 1.5 to 3.4 | 2 | 1650 | Risk Ratio (M‐H, Random, 95% CI) | 0.92 [0.85, 1.00] |
| 1.3 Average number of massages per week > 3.5 | 2 | 1598 | Risk Ratio (M‐H, Random, 95% CI) | 0.94 [0.86, 1.02] |
| 1.4 Any frequency of massage | 3 | 2417 | Risk Ratio (M‐H, Random, 95% CI) | 0.91 [0.86, 0.96] |
| 2 1st degree perineal tear Show forest plot | 3 | Risk Ratio (M‐H, Random, 95% CI) | Subtotals only | |
| 2.1 Average number of massages per week < 1.5 | 2 | 1500 | Risk Ratio (M‐H, Random, 95% CI) | 1.04 [0.60, 1.83] |
| 2.2 Average number of massages per week = 1.5 to 3.4 | 2 | 1650 | Risk Ratio (M‐H, Random, 95% CI) | 1.00 [0.75, 1.33] |
| 2.3 Average number of massages per week > 3.5 | 2 | 1598 | Risk Ratio (M‐H, Random, 95% CI) | 0.89 [0.67, 1.17] |
| 2.4 Any frequency of massage | 3 | 2417 | Risk Ratio (M‐H, Random, 95% CI) | 0.99 [0.71, 1.38] |
| 3 2nd degree perineal tear Show forest plot | 3 | Risk Ratio (M‐H, Fixed, 95% CI) | Subtotals only | |
| 3.1 Average number of massages per week < 1.5 | 2 | 1500 | Risk Ratio (M‐H, Fixed, 95% CI) | 1.00 [0.78, 1.27] |
| 3.2 Average number of massages per week = 1.5 to 3.4 | 2 | 1650 | Risk Ratio (M‐H, Fixed, 95% CI) | 0.94 [0.75, 1.16] |
| 3.3 Average number of massages per week > 3.5 | 2 | 1598 | Risk Ratio (M‐H, Fixed, 95% CI) | 1.02 [0.82, 1.27] |
| 3.4 Any frequency of massage | 3 | 2417 | Risk Ratio (M‐H, Fixed, 95% CI) | 0.98 [0.84, 1.14] |
| 4 3rd or 4th degree perineal trauma Show forest plot | 3 | Risk Ratio (M‐H, Random, 95% CI) | Subtotals only | |
| 4.1 Average number of massages per week < 1.5 | 2 | 1500 | Risk Ratio (M‐H, Random, 95% CI) | 0.82 [0.08, 8.48] |
| 4.2 Average number of massages per week = 1.5 to 3.4 | 2 | 1650 | Risk Ratio (M‐H, Random, 95% CI) | 0.64 [0.33, 1.25] |
| 4.3 Average number of massages per week > 3.5 | 2 | 1598 | Risk Ratio (M‐H, Random, 95% CI) | 1.19 [0.78, 1.81] |
| 4.4 Any frequency of massage | 3 | 2417 | Risk Ratio (M‐H, Random, 95% CI) | 0.81 [0.56, 1.19] |
| 5 Incidence of episiotomy Show forest plot | 3 | Risk Ratio (M‐H, Fixed, 95% CI) | Subtotals only | |
| 5.1 Average number of massages per week < 1.5 | 2 | 1500 | Risk Ratio (M‐H, Fixed, 95% CI) | 0.72 [0.57, 0.91] |
| 5.2 Average number of massages per week = 1.5 to 3.4 | 2 | 1650 | Risk Ratio (M‐H, Fixed, 95% CI) | 0.91 [0.77, 1.08] |
| 5.3 Average number of massages per week > 3.5 | 2 | 1598 | Risk Ratio (M‐H, Fixed, 95% CI) | 0.84 [0.67, 1.04] |
| 5.4 Any frequency of massage | 3 | 2417 | Risk Ratio (M‐H, Fixed, 95% CI) | 0.85 [0.75, 0.97] |
| 6 Length of second stage Show forest plot | 2 | Mean Difference (IV, Random, 95% CI) | Subtotals only | |
| 6.1 Average number of massages per week < 1.5 | 2 | 1403 | Mean Difference (IV, Random, 95% CI) | 0.97 [‐6.45, 8.39] |
| 6.2 Average number of massages per week = 1.5 to 3.4 | 2 | 1525 | Mean Difference (IV, Random, 95% CI) | ‐2.38 [‐8.55, 3.79] |
| 6.3 Average number of massages per week > 3.5 | 2 | 1509 | Mean Difference (IV, Random, 95% CI) | 10.80 [4.03, 17.58] |
| 6.4 Any frequency of massage | 2 | 2211 | Mean Difference (IV, Random, 95% CI) | 3.35 [‐1.29, 8.00] |
| 7 Instrumental delivery Show forest plot | 3 | Risk Ratio (M‐H, Random, 95% CI) | Subtotals only | |
| 7.1 Average number of massages per week < 1.5 | 2 | 1500 | Risk Ratio (M‐H, Random, 95% CI) | 0.89 [0.71, 1.13] |
| 7.2 Average number of massages per week = 1.5 to 3.4 | 2 | 1650 | Risk Ratio (M‐H, Random, 95% CI) | 0.88 [0.72, 1.07] |
| 7.3 Average number of massages per week > 3.5 | 2 | 1598 | Risk Ratio (M‐H, Random, 95% CI) | 1.07 [0.86, 1.33] |
| 7.4 Any frequency of massage | 3 | 2417 | Risk Ratio (M‐H, Random, 95% CI) | 0.93 [0.76, 1.13] |
| 8 Length of inpatient stay | 0 | Mean Difference (IV, Fixed, 95% CI) | Subtotals only | |
| 8.1 Average number of massages per week < 1.5 | 0 | 0 | Mean Difference (IV, Fixed, 95% CI) | 0.0 [0.0, 0.0] |
| 8.2 Average number of massages per week = 1.5 to 3.4 | 0 | 0 | Mean Difference (IV, Fixed, 95% CI) | 0.0 [0.0, 0.0] |
| 8.3 Average number of massages per week > 3.5 | 0 | 0 | Mean Difference (IV, Fixed, 95% CI) | 0.0 [0.0, 0.0] |
| 8.4 Any frequency of massage | 0 | 0 | Mean Difference (IV, Fixed, 95% CI) | 0.0 [0.0, 0.0] |
| 9 Admission to nursery | 0 | Risk Ratio (M‐H, Fixed, 95% CI) | Subtotals only | |
| 9.1 Average number of massages per week < 1.5 | 0 | 0 | Risk Ratio (M‐H, Fixed, 95% CI) | 0.0 [0.0, 0.0] |
| 9.2 Average number of massages per week = 1.5 to 3.4 | 0 | 0 | Risk Ratio (M‐H, Fixed, 95% CI) | 0.0 [0.0, 0.0] |
| 9.3 Average number of massages per week > 3.5 | 0 | 0 | Risk Ratio (M‐H, Fixed, 95% CI) | 0.0 [0.0, 0.0] |
| 9.4 Any frequency of massage | 0 | 0 | Risk Ratio (M‐H, Fixed, 95% CI) | 0.0 [0.0, 0.0] |
| 10 Apgar < 4 at 1 minute and/or Apgar < 7 at 5 minutes | 0 | Risk Ratio (M‐H, Fixed, 95% CI) | Subtotals only | |
| 10.1 Average number of massages per week < 1.5 | 0 | 0 | Risk Ratio (M‐H, Fixed, 95% CI) | 0.0 [0.0, 0.0] |
| 10.2 Average number of massages per week = 1.5 to 3.4 | 0 | 0 | Risk Ratio (M‐H, Fixed, 95% CI) | 0.0 [0.0, 0.0] |
| 10.3 Average number of massages per week > 3.5 | 0 | 0 | Risk Ratio (M‐H, Fixed, 95% CI) | 0.0 [0.0, 0.0] |
| 10.4 Any frequency of massage | 0 | 0 | Risk Ratio (M‐H, Fixed, 95% CI) | 0.0 [0.0, 0.0] |
| 11 Woman's satisfaction with perineal massage | 0 | Risk Ratio (M‐H, Fixed, 95% CI) | Subtotals only | |
| 11.1 Average number of massages per week < 1.5 | 0 | 0 | Risk Ratio (M‐H, Fixed, 95% CI) | 0.0 [0.0, 0.0] |
| 11.2 Average number of massages per week = 1.5 to 3.4 | 0 | 0 | Risk Ratio (M‐H, Fixed, 95% CI) | 0.0 [0.0, 0.0] |
| 11.3 Average number of massages per week > 3.5 | 0 | 0 | Risk Ratio (M‐H, Fixed, 95% CI) | 0.0 [0.0, 0.0] |
| 11.4 Any frequency of massage | 0 | 0 | Risk Ratio (M‐H, Fixed, 95% CI) | 0.0 [0.0, 0.0] |
| 12 Perineal pain postpartum | 0 | Mean Difference (IV, Fixed, 95% CI) | Subtotals only | |
| 12.1 Average number of massages per week < 1.5 | 0 | 0 | Mean Difference (IV, Fixed, 95% CI) | 0.0 [0.0, 0.0] |
| 12.2 Average number of massages per week = 1.5 to 3.4 | 0 | 0 | Mean Difference (IV, Fixed, 95% CI) | 0.0 [0.0, 0.0] |
| 12.3 Average number of massages per week > 3.5 | 0 | 0 | Mean Difference (IV, Fixed, 95% CI) | 0.0 [0.0, 0.0] |
| 12.4 Any frequency of massage | 0 | 0 | Mean Difference (IV, Fixed, 95% CI) | 0.0 [0.0, 0.0] |
| 13 Perineal pain at 3 months postpartum Show forest plot | 1 | Risk Ratio (M‐H, Fixed, 95% CI) | Subtotals only | |
| 13.1 Average number of massages per week < 1.5 | 1 | 577 | Risk Ratio (M‐H, Fixed, 95% CI) | 1.01 [0.65, 1.56] |
| 13.2 Average number of massages per week = 1.5 to 3.4 | 1 | 595 | Risk Ratio (M‐H, Fixed, 95% CI) | 0.69 [0.42, 1.13] |
| 13.3 Average number of massages per week > 3.5 | 1 | 701 | Risk Ratio (M‐H, Fixed, 95% CI) | 0.51 [0.33, 0.79] |
| 13.4 Any frequency of massage | 1 | 931 | Risk Ratio (M‐H, Fixed, 95% CI) | 0.67 [0.50, 0.92] |
| 14 Painful sex at 3 months postpartum Show forest plot | 1 | Risk Ratio (M‐H, Fixed, 95% CI) | Subtotals only | |
| 14.1 Average number of massages per week < 1.5 | 1 | 521 | Risk Ratio (M‐H, Fixed, 95% CI) | 0.85 [0.67, 1.08] |
| 14.2 Average number of massages per week = 1.5 to 3.4 | 1 | 538 | Risk Ratio (M‐H, Fixed, 95% CI) | 1.03 [0.85, 1.25] |
| 14.3 Average number of massages per week > 3.5 | 1 | 622 | Risk Ratio (M‐H, Fixed, 95% CI) | 0.96 [0.81, 1.13] |
| 14.4 Any frequency of massage | 1 | 831 | Risk Ratio (M‐H, Fixed, 95% CI) | 0.95 [0.83, 1.09] |
| 15 Woman's sexual satisfaction at 3 months postpartum Show forest plot | 1 | Risk Ratio (M‐H, Fixed, 95% CI) | Subtotals only | |
| 15.1 Average number of massages per week < 1.5 | 1 | 569 | Risk Ratio (M‐H, Fixed, 95% CI) | 1.04 [0.93, 1.16] |
| 15.2 Average number of massages per week = 1.5 to 3.4 | 1 | 588 | Risk Ratio (M‐H, Fixed, 95% CI) | 1.08 [0.98, 1.19] |
| 15.3 Average number of massages per week > 3.5 | 1 | 692 | Risk Ratio (M‐H, Fixed, 95% CI) | 0.99 [0.90, 1.08] |
| 15.4 Any frequency of massage | 1 | 921 | Risk Ratio (M‐H, Fixed, 95% CI) | 1.02 [0.96, 1.10] |
| 16 Partner's sexual satisfaction at 3 months postpartum Show forest plot | 1 | Risk Ratio (M‐H, Fixed, 95% CI) | Subtotals only | |
| 16.1 Average number of massages per week < 1.5 | 1 | 576 | Risk Ratio (M‐H, Fixed, 95% CI) | 1.01 [0.91, 1.11] |
| 16.2 Average number of massages per week = 1.5 to 3.4 | 1 | 586 | Risk Ratio (M‐H, Fixed, 95% CI) | 1.03 [0.95, 1.13] |
| 16.3 Average number of massages per week > 3.5 | 1 | 688 | Risk Ratio (M‐H, Fixed, 95% CI) | 0.93 [0.86, 1.02] |
| 16.4 Any frequency of massage | 1 | 916 | Risk Ratio (M‐H, Fixed, 95% CI) | 0.97 [0.91, 1.04] |
| 17 Uncontrolled loss of urine at 3 months postpartum Show forest plot | 1 | Risk Ratio (M‐H, Fixed, 95% CI) | Subtotals only | |
| 17.1 Average number of massages per week < 1.5 | 1 | 587 | Risk Ratio (M‐H, Fixed, 95% CI) | 1.10 [0.83, 1.46] |
| 17.2 Average number of massages per week = 1.5 to 3.4 | 1 | 606 | Risk Ratio (M‐H, Fixed, 95% CI) | 0.84 [0.62, 1.15] |
| 17.3 Average number of massages per week > 3.5 | 1 | 714 | Risk Ratio (M‐H, Fixed, 95% CI) | 0.83 [0.65, 1.06] |
| 17.4 Any frequency of massage | 1 | 949 | Risk Ratio (M‐H, Fixed, 95% CI) | 0.90 [0.74, 1.08] |
| 18 Uncontrolled loss of faeces at 3 months postpartum Show forest plot | 1 | Risk Ratio (M‐H, Fixed, 95% CI) | Subtotals only | |
| 18.1 Average number of massages per week < 1.5 | 1 | 586 | Risk Ratio (M‐H, Fixed, 95% CI) | 1.04 [0.36, 3.03] |
| 18.2 Average number of massages per week = 1.5 to 3.4 | 1 | 605 | Risk Ratio (M‐H, Fixed, 95% CI) | 0.44 [0.10, 1.89] |
| 18.3 Average number of massages per week > 3.5 | 1 | 713 | Risk Ratio (M‐H, Fixed, 95% CI) | 0.72 [0.29, 1.80] |
| 18.4 Any frequency of massage | 1 | 948 | Risk Ratio (M‐H, Fixed, 95% CI) | 0.72 [0.35, 1.49] |
| 19 Uncontrolled loss of flatus at 3 months postpartum Show forest plot | 1 | 2854 | Risk Ratio (M‐H, Fixed, 95% CI) | 1.09 [0.95, 1.25] |
| 19.1 Average number of massages per week < 1.5 | 1 | 587 | Risk Ratio (M‐H, Fixed, 95% CI) | 1.40 [1.03, 1.90] |
| 19.2 Average number of massages per week = 1.5 to 3.4 | 1 | 606 | Risk Ratio (M‐H, Fixed, 95% CI) | 0.87 [0.60, 1.26] |
| 19.3 Average number of massages per week > 3.5 | 1 | 713 | Risk Ratio (M‐H, Fixed, 95% CI) | 1.07 [0.82, 1.39] |
| 19.4 Any frequency of massage | 1 | 948 | Risk Ratio (M‐H, Fixed, 95% CI) | 1.09 [0.88, 1.36] |