Dosis única oral de etoricoxib para el dolor posoperatorio agudo en pacientes adultos
Appendices
Appendix 1. MEDLINE via Ovid search strategy
-
Etoricoxib.sh.
-
(etoricoxib OR arcoxia).ti.ab.kw.
-
1 OR 2
-
Pain, Postoperative.sh.
-
((postoperative adj4 pain$) or (post‐operative adj4 pain$) or post‐operative‐pain$ or (post$ NEAR pain$) or (postoperative adj4 analgesi$) or (post‐operative adj4 analgesi$) or ("post‐operative analgesi$")).ti.ab.kw.
-
((post‐surgical adj4 pain$) or ("post surgical" adj4 pain$) or (post‐surgery adj4 pain$)).ti.ab.kw.
-
(("pain‐relief after surg$") or ("pain following surg$") or ("pain control after")).ti.ab.kw.
-
(("post surg$" or post‐surg$) AND (pain$ or discomfort)).ti.ab.kw.
-
((pain$ adj4 "after surg$") or (pain$ adj4 "after operat$") or (pain$ adj4 "follow$ operat$") or (pain$ adj4 "follow$ surg$")).ti.ab.kw.
-
((analgesi$ adj4 "after surg$") or (analgesi$ adj4 "after operat$") or (analgesi$ adj4 "follow$ operat$") or (analgesi$ adj4 "follow$ surg$")).ti.ab.kw.
-
OR/4‐10
-
randomized controlled trial.pt.
-
controlled clinical trial.pt.
-
randomized.ab.
-
placebo.ab.
-
drug therapy.fs.
-
randomly.ab.
-
trial.ab.
-
groups.ab.
-
OR/12‐19
-
humans.sh.
-
20 AND 21
-
3 AND 11 AND 22
Appendix 2. Search strategy for EMBASE via Ovid
-
Etoricoxib.sh.
-
(etoricoxib OR arcoxia).ti,ab,kw.
-
OR/1‐2
-
Postoperative pain.sh.
-
((postoperative adj4 pain$) or (post‐operative adj4 pain$) or post‐operative‐pain$ or (post$ NEAR pain$) or (postoperative adj4 analgesi$) or (post‐operative adj4 analgesi$) or ("post‐operative analgesi$")).ti.ab.kw.
-
((post‐surgical adj4 pain$) or ("post surgical" adj4 pain$) or (post‐surgery adj4 pain$)).ti.ab.kw.
-
(("pain‐relief after surg$") or ("pain following surg$") or ("pain control after")).ti.ab.kw.
-
(("post surg$" or post‐surg$) AND (pain$ or discomfort)).ti.ab.kw.
-
((pain$ adj4 "after surg$") or (pain$ adj4 "after operat$") or (pain$ adj4 "follow$ operat$") or (pain$ adj4 "follow$ surg$")).ti.ab.kw.
-
((analgesi$ adj4 "after surg$") or (analgesi$ adj4 "after operat$") or (analgesi$ adj4 "follow$ operat$") or (analgesi$ adj4 "follow$ surg$")).ti.ab.kw.
-
OR/4‐10
-
Clinical trials.sh.
-
Controlled Clinical Trials.sh.
-
Randomized Controlled Trial.sh.
-
Double‐blind procedure.sh.
-
(clin$ adj25 trial$).ab.
-
((doubl$ or trebl$ or tripl$) adj25 (blind$ or mask$)).ab.
-
placebo$.ab.
-
random$.ab.
-
OR/12‐19
-
3 AND 11 AND 20
Appendix 3. Search strategy for Cochrane CENTRAL
-
MESH descriptor Etoricoxib
-
(etoricoxib OR arcoxia):ti,ab,kw.
-
OR/1‐2
-
MESH descriptor Pain, Postoperative
-
((postoperative adj4 pain$) or (post‐operative adj4 pain$) or post‐operative‐pain$ or (post$ NEAR pain$) or (postoperative adj4 analgesi$) or (post‐operative adj4 analgesi$) or ("post‐operative analgesi$")):ti,ab,kw.
-
((post‐surgical adj4 pain$) or ("post surgical" adj4 pain$) or (post‐surgery adj4 pain$)):ti,ab,kw.
-
(("pain‐relief after surg$") or ("pain following surg$") or ("pain control after")):ti,ab,kw.
-
(("post surg$" or post‐surg$) AND (pain$ or discomfort)):ti,ab,kw.
-
((pain$ adj4 "after surg$") or (pain$ adj4 "after operat$") or (pain$ adj4 "follow$ operat$") or (pain$ adj4 "follow$ surg$")):ti,ab,kw.
-
((analgesi$ adj4 "after surg$") or (analgesi$ adj4 "after operat$") or (analgesi$ adj4 "follow$ operat$") or (analgesi$ adj4 "follow$ surg$")):ti,ab,kw.
-
OR/4‐10
-
Limit 11 to Clinical Trials (CENTRAL)
Appendix 4. Glossary
Categorical rating scale
The commonest is the five category scale (none, slight, moderate, good or lots, and complete). For analysis numbers are given to the verbal categories (for pain intensity, none = 0, mild = 1, moderate = 2 and severe = 3, and for relief none = 0, slight = 1, moderate = 2, good or lots = 3, and complete = 4). Data from different participants are then combined to produce means (rarely medians) and measures of dispersion (usually standard errors of means). The validity of converting categories into numerical scores was checked by comparison with concurrent visual analogue scale measurements. Good correlation was found, especially between pain relief scales using cross‐modality matching techniques. Results are usually reported as continuous data, mean or median pain relief or intensity. Few studies present results as discrete data, giving the number of participants who report a certain level of pain intensity or relief at any given assessment point. The main advantages of the categorical scales are that they are quick and simple. The small number of descriptors may force the scorer to choose a particular category when none describes the pain satisfactorily.
Visual analogue scale (VAS)
For pain intensity, lines with left end labelled "no pain" and right end labelled "worst pain imaginable", and for pain relief lines with left end labelled "no relief of pain" and right end labelled "complete relief of pain", seem to overcome the limitation of forcing patient descriptors into particular categories. Patients mark the line at the point which corresponds to their pain or pain relief. The scores are obtained by measuring the distance between the no relief end and the patient's mark, usually in millimetres. The main advantages of VAS are that they are simple and quick to score, avoid imprecise descriptive terms, and provide many points from which to choose. More concentration and co‐ordination are needed, which can be difficult postoperatively or with neurological disorders.
TOTPAR
Total pain relief (TOTPAR) is calculated as the sum of pain relief scores over a period of time. If a patient had complete pain relief immediately after taking an analgesic, and maintained that level of pain relief for six hours, they would have a six‐hour TOTPAR of the maximum of 24. Differences between pain relief values at the start and end of a measurement period are dealt with by the composite trapezoidal rule. This is a simple method that approximately calculates the definite integral of the area under the pain relief curve by calculating the sum of the areas of several trapezoids that together closely approximate to the area under the curve.
Summed pain intensity difference (SPID)
SPID is calculated as the sum of the differences between the pain scores over a period of time. Differences between pain intensity values at the start and end of a measurement period are dealt with by the trapezoidal rule.
VAS TOTPAR and VAS SPID are visual analogue versions of TOTPAR and SPID.
See 'Measuring pain' in Bandolier's Little Book of Pain, Oxford University Press, Oxford. 2003; pp 7‐13 (Moore 2003).
Appendix 5. Summary of outcomes in individual studies: efficacy
| Analgesia | Rescue medication | |||||
| Study ID | Treatment | PI or PR | Number with 50% PR | PGE: very good or excellent | Median time to use (h) | % using |
| (1) etoricoxib 120 mg, n = 100 (2) oxycodone + paracetamol 10/650 mg, n = 100 (3) placebo, n = 25 | TOTPAR 6: (1) 15.3 (3) 4.1 | (1) 73/100 (3) 3/25 | At 6 h: (1) 61/98 (3) 1/24 | (1) > 24 (3) 1.5 | At 6 h: (1) 22/100 (3) 18/25 At 24 h: (1) 45/100 (3) 19/25 | |
| (1) etoricoxib 90 mg, n = 191 (2) etoricoxib 120 mg, n = 97 (3) ibuprofen 600 mg, n = 192 (first dose) (4) paracetamol/codeine 600/60 mg, n = 62 (first dose) (5) placebo, n = 46 | TOTPAR 6: | (1) 148/191 | At 24 h: | (1) > 6 | At 6 h: | |
| (1) etoricoxib 60 mg, n = 75 (2) etoricoxib 120 mg, n = 76 (3) etoricoxib 180 mg, n = 74 (4) etoricoxib 240 mg, n = 76 (5) ibuprofen 400 mg, n = 48 (6) placebo, n = 49 | TOTPAR 6: (1) 12.6 (2) 16.6 (3) 17.6 (4) 15.2 (6) 4.2 | (1) 44/75 (2) 61/76 (3) 64/74 (4) 55/76 (6) 6/49 | At 8 h: (1) 35/75 (2) 48/76 (3) 51/74 (4) 51/76 (6) 2/49 | (1) 12.1 (2) > 24 (3) > 24 (4) > 24 (6) 2.1 | At 24 h: (1) 39/75 (2) 21/76 (3) 19/74 (4) 25/76 (6) 40/49 | |
| (1) etoricoxib 120 mg, n = 50 (2) sodium naproxen 550 mg, n = 51 (3) codeine + paracetamol 60/600 mg, n = 50 (4) placebo, n = 50 | TOTPAR 6: (1) 15.5 (4) 4.2 | (1) 37/50 (4) 6/50 | At 8 h: (1) 34/50 (4) 3/50 | (1) > 24 (4) 1.6 | At 24 h: (1) 22/50 (4) 45/50 | |
| (1) etoricoxib 120 mg, n = 100 (2) oxycodone + paracetamol 10/650 mg, n = 102 (3) codeine + paracetamol 60/600, n = 50 (4) placebo, n = 50 | TOTPAR 6: (1) 13.2 (4) 2.4 | (1) 62/100 (4) 1/50 | At 6 h: (1) 50/100 (4) 3/50 | (1) > 24 (4) 1.7 | At 6 h: (1) 25/100 (4) no data At 24 h: (1) 49/100 (4) no data | |
| (1) etoricoxib 120 mg, n = 80 (2) sodium naproxen (CR) 1100 mg, n = 73 (3) placebo, n = 75 | TOTPAR 6: (1) 7.9 (3) 4.6 | (1) 26/80 (3) 10/75 | At 8 h: (1) 19/80 (3)10/75 | (1) 3.6 (3) 2.6 | At 24 h: (1) 66/80 (3) 74/75 | |
| CR ‐ controlled release; n ‐ number in treatment arm; PI ‐ pain intensity; PR ‐ pain relief; PGE ‐ patient global evaluation; TOTPAR 6 ‐ total pain relief at 6 hours | ||||||
Appendix 6. Summary of outcomes in individual studies: adverse events and withdrawals
| Adverse events | Withdrawals | ||||
| Study ID | Treatment | Any | Serious | Adverse event | Other |
| (1) etoricoxib 120 mg, n = 100 (2) oxycodone + paracetamol 10/650 mg, n = 100 (3) placebo, n = 25 | At 24 hours: (1) 32/100 (3) 6/25 | None | None reported | None reported | |
| (1) etoricoxib 90 mg, n = 191 (2) etoricoxib 120 mg, n = 97 (3) ibuprofen 2400 mg/day, n = 192 (4) paracetamol/codeine 2400/240 mg/day, n = 62 (5) placebo, n = 46 | At 24 h: | None | (1) 1/191 | None reported | |
| (1) etoricoxib 60 mg, n = 75 (2) etoricoxib 120 mg, n = 76 (3) etoricoxib 180 mg, n = 74 (4) etoricoxib 240 mg, n = 76 (5) ibuprofen 400 mg, n = 48 (6) placebo, n = 49 | At 14 days: (1) 24/75 (2) 27/76 (3) 31/74 (4) 23/76 (6) 24/49 | None | None | Did not return for post study visit: (1) 0/75 (2) 0/76 (3) 0/74 (4) 2/76 (1 withdrew consent, 1 lost to follow‐up) (6) 0/49 | |
| (1) etoricoxib 120 mg, n = 50 (2) sodium naproxen 550 mg, n = 51 (3) codeine + paracetamol 60/600 mg, n = 50 (4) placebo, n = 50 | At 10 days: (1) 13/50 (4) 18/50 | None | None | Did not return for post study visit: (1) 1/50 (4) 1/50 | |
| (1) etoricoxib 120 mg, n = 100 (2) oxycodone + paracetamol 10/650 mg, n = 102 (3) codeine + paracetamol 60/600, n = 50 (4) placebo, n = 50 | At 7 days: (1) 40/100 (4) 19/50 | None | None reported | None reported | |
| (1) etoricoxib 120 mg, n = 80 (2) sodium naproxen (CR) 1100 mg, n = 73 (3) placebo, n = 75 | No single dose data | No single dose data | No single dose data | (1) 3/80 (3) 10/75 (no details) | |


'Risk of bias' graph: review authors' judgements about each risk of bias item presented as percentages across all included studies.

'Risk of bias' summary: review authors' judgements about each risk of bias item for each included study.
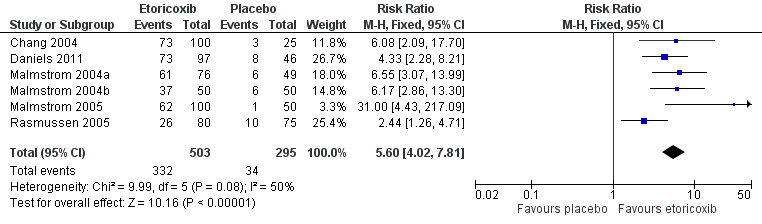
Forest plot of comparison: 1 Etoricoxib 120 mg versus placebo, outcome: 1.1 Participants with at least 50% pain relief over 6 hours

L'Abbé plot of etoricoxib 120 mg versus placebo for at least 50% pain relief. Size of circle is proportional to size of study (inset scale). Cream circles ‐ dental studies; pink circle ‐ orthopaedic study.

Forest plot of comparison: 1 Etoricoxib 120 mg vs placebo, outcome: 1.4 Participants using rescue medication within 24 hours

Forest plot of comparison: 2 Etoricoxib (all doses) versus placebo, outcome: 2.1 Participants with any adverse event

Comparison 1 Etoricoxib 120 mg vs placebo, Outcome 1 Participants with at least 50% pain relief over 6 hours.

Comparison 1 Etoricoxib 120 mg vs placebo, Outcome 2 Participants with at least 50% pain relief over 6 hours, dental.

Comparison 1 Etoricoxib 120 mg vs placebo, Outcome 3 Participants using rescue medication within 6 hours.

Comparison 1 Etoricoxib 120 mg vs placebo, Outcome 4 Participants using rescue medication within 24 hours.

Comparison 1 Etoricoxib 120 mg vs placebo, Outcome 5 Participants with any adverse event.

Comparison 2 Etoricoxib (all doses) versus placebo, Outcome 1 Participants with any adverse event.
| Etoricoxib compared with placebo for acute postoperative pain | ||||||
| Patient or population: adults with moderate or severe acute postoperative pain Settings: community or hospital Intervention: etoricoxib 120 mg Comparison: placebo | ||||||
| Outcomes | Probable outcome with | Relative effect and NNT or NNH (95% CI) | No of studies, events | Quality of the evidence | Comments | |
| comparator | intervention | |||||
| At least 50% of maximum pain relief over 4 to 6 hours | 120 in 1000 | 660 in 1000 | RR 5.6 (4.0 to 7.8) NNT 1.9 (1.7 to 2.1) | 6 studies 789 participants 366 events | High | Adequate numbers of studies, participants and events. Consistency across studies |
| Participants with at least 1 adverse event | 360 in 1000 | 330 in 1000 | RR 0.93 (0.74 to 1.2) NNH not calculated | 5 studies 643 participants 219 events | Moderate | Moderate numbers of studies, participants and events. Consistency across studies. Single dose studies may not reflect clinical practice |
| Participants with a serious adverse event | No serious adverse events | Low | Studies underpowered to detect rare events | |||
| Deaths | No deaths | Low | Studies underpowered to detect rare events | |||
| CI: Confidence interval; NNH: number needed to treat for harm; NNT: number needed to treat for benefit; RR: Risk Ratio | ||||||
| GRADE Working Group grades of evidence | ||||||
| Outcome or subgroup title | No. of studies | No. of participants | Statistical method | Effect size |
| 1 Participants with at least 50% pain relief over 6 hours Show forest plot | 6 | 798 | Risk Ratio (M‐H, Fixed, 95% CI) | 5.60 [4.02, 7.81] |
| 2 Participants with at least 50% pain relief over 6 hours, dental Show forest plot | 5 | 643 | Risk Ratio (M‐H, Fixed, 95% CI) | 6.68 [4.55, 9.82] |
| 3 Participants using rescue medication within 6 hours Show forest plot | 2 | 268 | Risk Ratio (M‐H, Fixed, 95% CI) | 0.24 [0.17, 0.34] |
| 4 Participants using rescue medication within 24 hours Show forest plot | 4 | 505 | Risk Ratio (M‐H, Fixed, 95% CI) | 0.60 [0.53, 0.67] |
| 5 Participants with any adverse event Show forest plot | 5 | 643 | Risk Ratio (M‐H, Fixed, 95% CI) | 0.93 [0.74, 1.17] |
| Outcome or subgroup title | No. of studies | No. of participants | Statistical method | Effect size |
| 1 Participants with any adverse event Show forest plot | 5 | 1059 | Risk Ratio (M‐H, Fixed, 95% CI) | 0.91 [0.74, 1.12] |