Tratamiento con toxina botulínica tipo A para la distonía cervical
Appendices
Appendix 1. CENTRAL search strategy
#1 MeSH descriptor: [Botulinum Toxins] explode all trees
#2 Botulinum Toxins, Type A
#3 (botul* near/2 tox*):ti,ab
#4 (botox or dysport or xeomin or myobloc or rimabotulinum* or abobotuli* or onabotulinum* or oculinum or purtox or CNBTX or Neuronox):ti,ab
#5 {or #1‐#4}
#6 MeSH descriptor: [Dystonic Disorders] explode all trees
#7 MeSH descriptor: [Dystonia] explode all trees
#8 MeSH descriptor: [Torticollis] explode all trees
#9 MeSH descriptor: [Blepharospasm] explode all trees
#10 MeSH descriptor: [Meige Syndrome] explode all trees
#11 MeSH descriptor: [Hemifacial Spasm] explode all trees
#12 (cervic* near/2 dysto*):ti,ab
#13 blepharosp*:ti,ab
#14 (hem* near/2 spasm*):ti,ab
#15 (meige and (dysto* or syndrom*)):ti,ab
#16 (crani* near/2 dysto*):ti,ab
#17 (foca* near/2 dysto*):ti,ab
#18 (write* and (cramp* or dysto*)):ti,ab
#19 torticol*:ti,ab
#20 {or #6‐#19}
#21 #5 and #20
#22 MeSH descriptor: [Animals] explode all trees
#23 MeSH descriptor: [Humans] explode all trees
#24 #22 not #23
#25 #21 not #24 in Trials
Appendix 2. MEDLINE search strategy
#1 randomized controlled trial.pt.
#2 controlled clinical trial.pt.
#3 randomized.ab.
#4 placebo.ab.
#5 clinical trials as topic.sh.
#6 randomly.ab.
#7 trial.ti.
#8 1 or 2 or 3 or 4 or 5 or 6 or 7
#9 exp botulinum toxins/
#10 exp botulinum toxins, type A/
#11 (botul$ adj2 tox$).ti,ab.
#12 (botox or dysport or xeomin or myobloc or rimabotulinum$ or abobotuli$ or onabotulinum$ or oculinum or purtox or CNBTX or Neuronox).ti,ab.
#13 9 or 10 or 11 or 12
#14 (cervic$ adj2 dysto$).ti,ab.
#15 blepharosp$.ti,ab.
#16 (hem$ adj2 spasm$).ti,ab.
#17 (meige and (dysto$ or syndrom$)).ti,ab.
#18 (crani$ adj2 dysto$).ti,ab.
#19 (foca$ adj2 dysto$).ti,ab.
#20 (write$ and (cramp$ or dysto$)).ti,ab.
#21 torticol$.ti,ab.
#22 exp dystonic disorders/
#23 exp dystonia/
#24 exp torticollis/
#25 exp blepharospasm/
#26 exp meige syndrome/
#27 exp hemifacial spasm/
#28 14 or 15 or 16 or 17 or 18 or 19 or 20 or 21 or 22 or 23 or 24 or 25 or 26 or 27
#29 8 and 3 and 28
#30 exp animals/ not humans/
#31 29 not 30
Appendix 3. Embase search strategy
#1 random$.tw.
#2 clinical trial:.mp.
#3 placebo$.mp.
#4 double‐blind$.tw.
#5 1 or 2 or 3 or 4
#6 exp Hemifacial Spasm/
#7 exp Meige Syndrome/
#8 exp blepharospasm/
#9 exp torticollis/
#10 exp Dystonia/
#11 exp Dystonic Disorders/
#12 (cervic$ adj2 dysto$).ti,ab.
#13 blepharosp$.ti,ab.
#14 (hem$ adj2 spasm$).ti,ab.
#15 (meige and (dysto$ or syndrom$)).ti,ab.
#16 (crani$ adj2 dysto$).ti,ab.
#17 (foca$ adj2 dysto$).ti,ab.
#18 (write$ and (cramp$ or dysto$)).ti,ab.
#19 torticol$.ti,ab.
#20 5 or 6 or 7 or 8 or 9 or 10 or 11 or 12 or 13 or 14 or 15 or 16 or 17 or 18
#21 exp Botulinum Toxins, Type A/
#22 exp Botulinum Toxins/
#23 (botul$ adj2 tox$).ti,ab.
#24 (botox or dysport or xeomin or myobloc or rimabotulinum$ or abobotuli$ or onabotulinum$ or oculinum or purtox or CNBTX or Neuronox).ti,ab.
#25 21 or 22 or 23 or 24
#26 19 and 20 and 25
#27 limit 26 to human

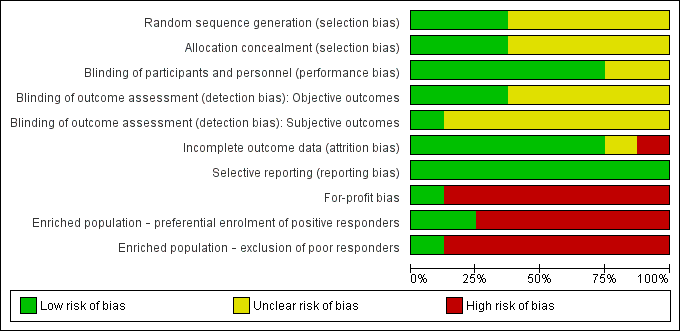
Risk of bias of included studies: review authors' judgements about each risk of bias item presented as percentages across all included studies
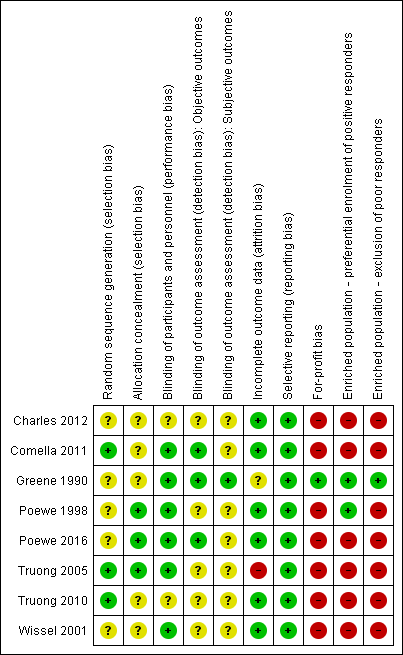
'Risk of bias' summary: review authors' judgements about each risk of bias item for each included study
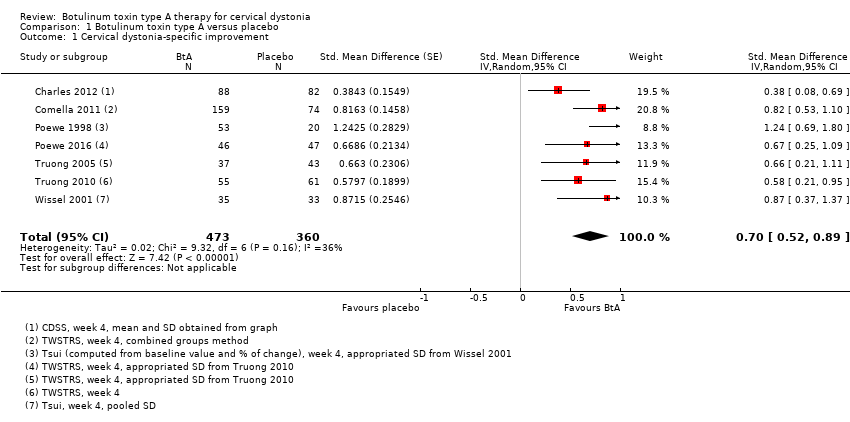
Comparison 1 Botulinum toxin type A versus placebo, Outcome 1 Cervical dystonia‐specific improvement.

Comparison 1 Botulinum toxin type A versus placebo, Outcome 2 Cervical dystonia‐specific improvement ‐ TWSTRS subgroup analysis.
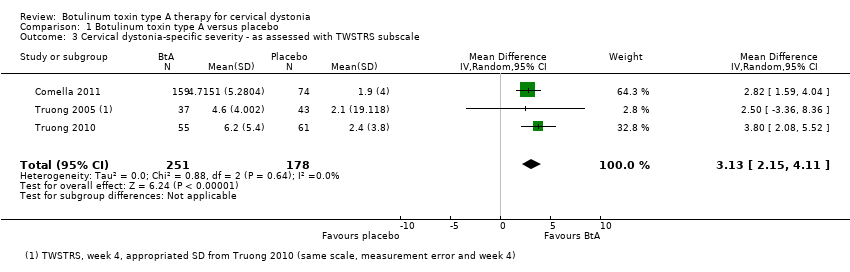
Comparison 1 Botulinum toxin type A versus placebo, Outcome 3 Cervical dystonia‐specific severity ‐ as assessed with TWSTRS subscale.

Comparison 1 Botulinum toxin type A versus placebo, Outcome 4 Cervical dystonia‐specific disability ‐ as assessed with TWSTRS subscale.

Comparison 1 Botulinum toxin type A versus placebo, Outcome 5 Cervical dystonia‐specific improvement ‐ doses subgroup analysis.

Comparison 1 Botulinum toxin type A versus placebo, Outcome 6 Cervical dystonia‐specific improvement ‐ BtA formulation subgroup analysis.

Comparison 1 Botulinum toxin type A versus placebo, Outcome 7 Cervical dystonia‐specific improvement ‐ EMG‐guided versus non‐EMG‐guided subgroup analysis.

Comparison 1 Botulinum toxin type A versus placebo, Outcome 8 Adverse events.

Comparison 1 Botulinum toxin type A versus placebo, Outcome 9 Adverse events ‐ doses subgroup analysis.

Comparison 1 Botulinum toxin type A versus placebo, Outcome 10 Adverse events ‐ BtA formulation subgroup analysis.
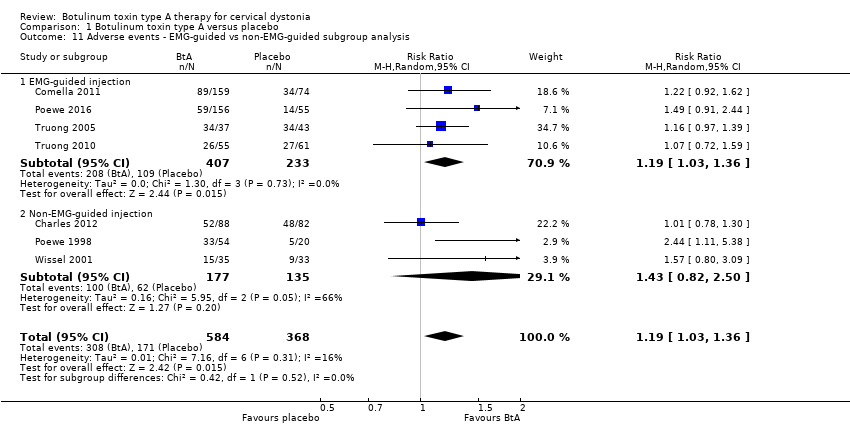
Comparison 1 Botulinum toxin type A versus placebo, Outcome 11 Adverse events ‐ EMG‐guided vs non‐EMG‐guided subgroup analysis.
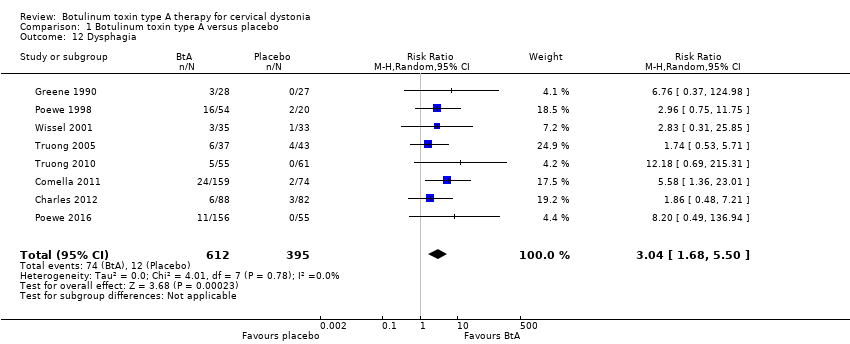
Comparison 1 Botulinum toxin type A versus placebo, Outcome 12 Dysphagia.

Comparison 1 Botulinum toxin type A versus placebo, Outcome 13 Diffuse weakness/tiredness.
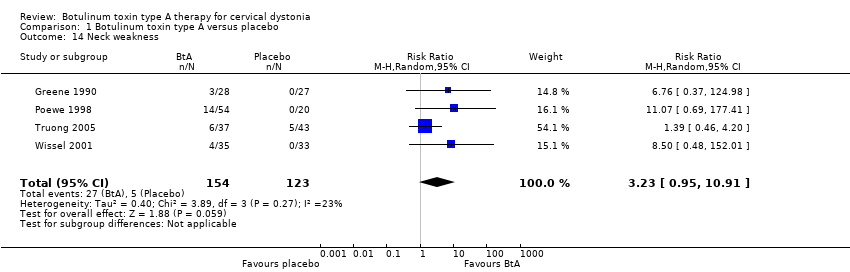
Comparison 1 Botulinum toxin type A versus placebo, Outcome 14 Neck weakness.

Comparison 1 Botulinum toxin type A versus placebo, Outcome 15 Voice change/hoarseness.
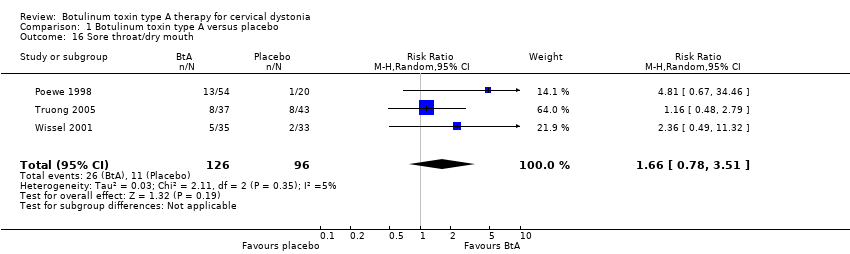
Comparison 1 Botulinum toxin type A versus placebo, Outcome 16 Sore throat/dry mouth.
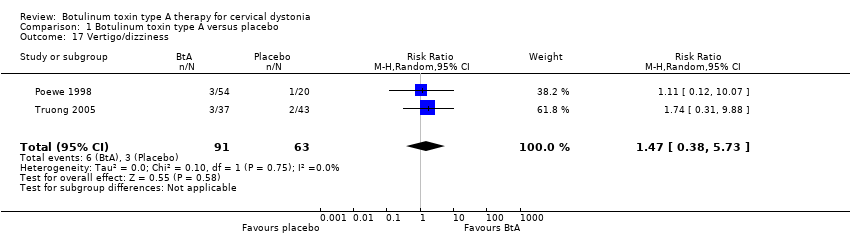
Comparison 1 Botulinum toxin type A versus placebo, Outcome 17 Vertigo/dizziness.

Comparison 1 Botulinum toxin type A versus placebo, Outcome 18 Malaise/upper respiratory infection.
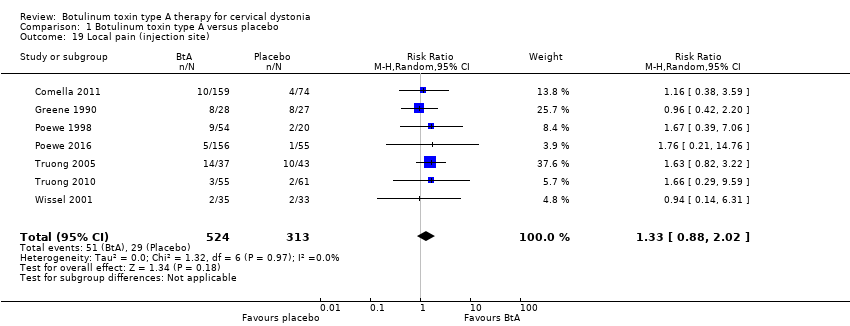
Comparison 1 Botulinum toxin type A versus placebo, Outcome 19 Local pain (injection site).
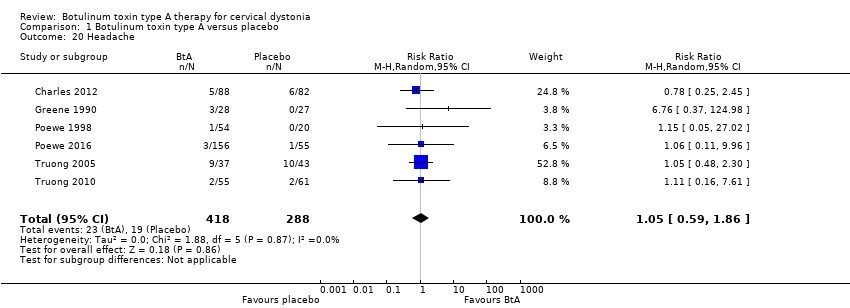
Comparison 1 Botulinum toxin type A versus placebo, Outcome 20 Headache.

Comparison 1 Botulinum toxin type A versus placebo, Outcome 21 Any improvement by subjective clinician assessment.
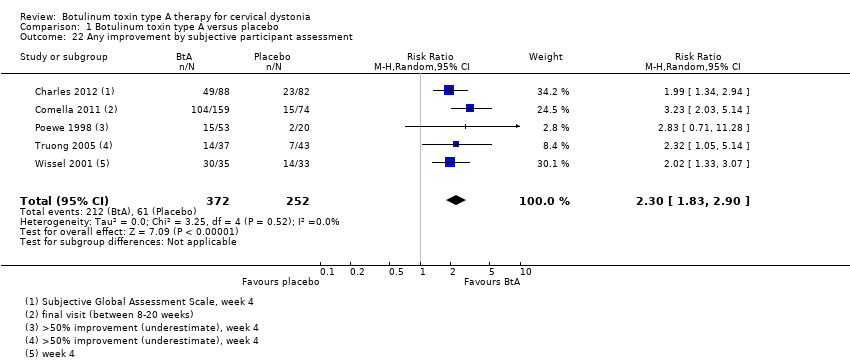
Comparison 1 Botulinum toxin type A versus placebo, Outcome 22 Any improvement by subjective participant assessment.

Comparison 1 Botulinum toxin type A versus placebo, Outcome 23 Any improvement by subjective participant assessment ‐ doses subgroup analysis.
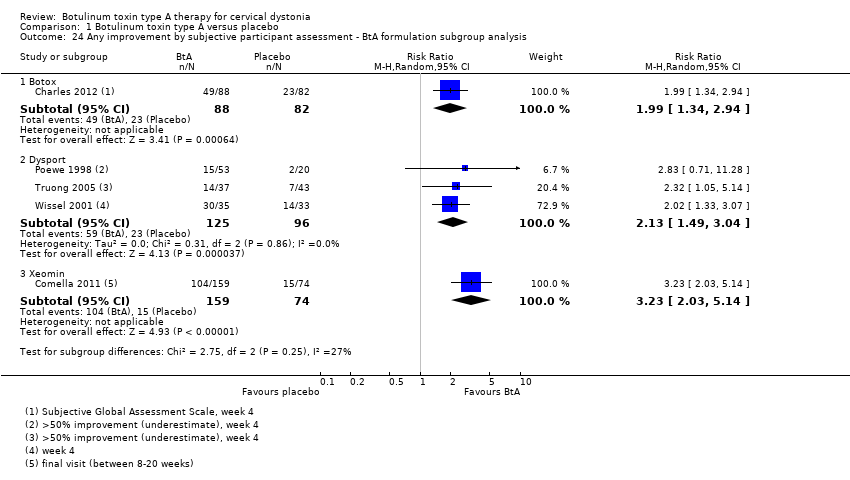
Comparison 1 Botulinum toxin type A versus placebo, Outcome 24 Any improvement by subjective participant assessment ‐ BtA formulation subgroup analysis.
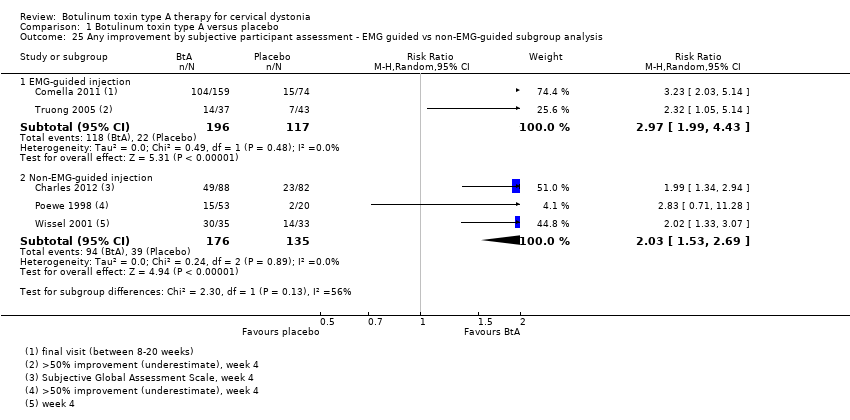
Comparison 1 Botulinum toxin type A versus placebo, Outcome 25 Any improvement by subjective participant assessment ‐ EMG guided vs non‐EMG‐guided subgroup analysis.

Comparison 1 Botulinum toxin type A versus placebo, Outcome 26 Cervical dystonia‐specific pain.

Comparison 1 Botulinum toxin type A versus placebo, Outcome 27 Cervical dystonia‐specific pain ‐ TWSTRS pain subscale subgroup analysis.
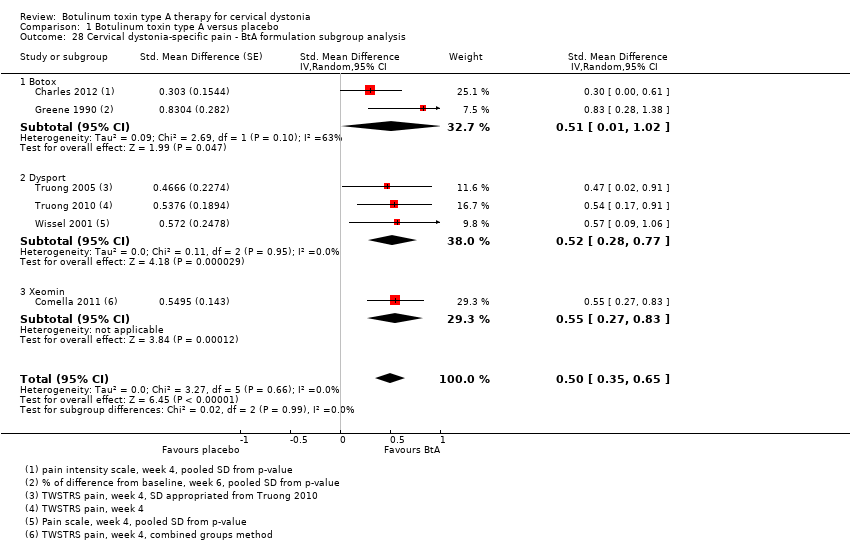
Comparison 1 Botulinum toxin type A versus placebo, Outcome 28 Cervical dystonia‐specific pain ‐ BtA formulation subgroup analysis.
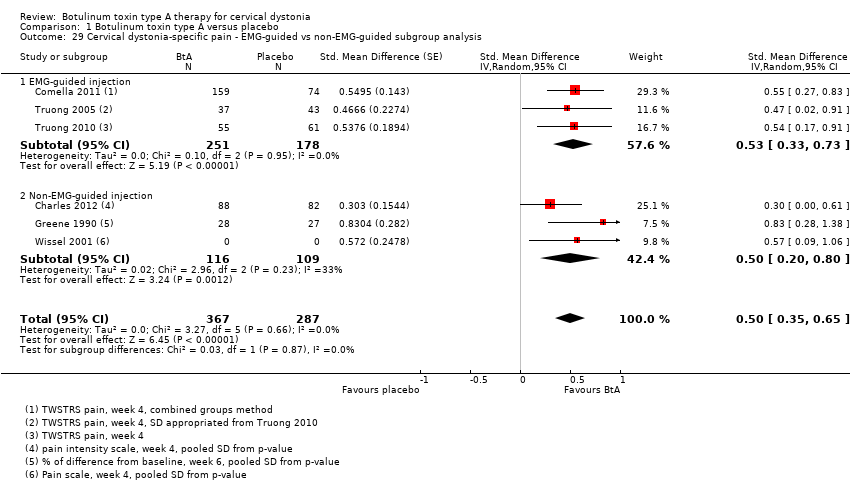
Comparison 1 Botulinum toxin type A versus placebo, Outcome 29 Cervical dystonia‐specific pain ‐ EMG‐guided vs non‐EMG‐guided subgroup analysis.

Comparison 1 Botulinum toxin type A versus placebo, Outcome 30 Tolerability ‐ withdrawals.

Comparison 1 Botulinum toxin type A versus placebo, Outcome 31 Tolerability ‐ withdrawals due lack of efficacy subgroup analysis.

Comparison 1 Botulinum toxin type A versus placebo, Outcome 32 Tolerability ‐ withdrawals due to adverse events subgroup analysis.
| Botulinum toxin type A compared to placebo for cervical dystonia | ||||||
| Patient or population: adults with cervical dystonia | ||||||
| Outcomes | Relative effect | Anticipated absolute effects* (95% CI) | Certainty in the evidence | What happens | ||
| With placebo | With botulinum toxin type A | Difference | ||||
| Cervical dystonia‐specific impairment Assessed 3 to 6 weeks post‐injection using TWSTRS total score | ‐ | 3.9 TWSTRS units decrease | 12.45 TWSTRS units decrease | The mean change from baseline was 8.06 TWSTRS units higher (6.08 higher to 10.05 higher) in the BtA group compared to the placebo group | ⊕⊕⊕⊝ | BtA treatment probably improves cervical dystonia‐specific impairment |
| Adverse events Assessed at any point during follow‐up | RR 1.19 | 46.5% | 55.3% | 8.8% more | ⊕⊕⊕⊝ | BtA treatment probably increases the risk of adverse events |
| Subjective participant assessment Assessed 3 to 6 weeks post‐injection | RR 2.30 | 24.2% | 55.7% | 31.5% more | ⊕⊕⊕⊝ | BtA treatment probably increases the likelihood that patients will detect any form of improvement |
| Pain relief Assessed 3 to 6 weeks post‐injection using TWSTRS pain subscore | ‐b | ‐b | ‐b | The mean change from baseline was 2.11 TWSTRS units higher (1.38 higher to 2.83 higher) in the BtA group compared to the placebo group | ⊕⊕⊕⊝ | BtA treatment probably improves cervical dystonia‐related pain |
| Tolerability Assessed at any point during follow‐up | RR 0.38 | 20.5% | 7.8% (4.7 to 12.7) | 12.7% fewer (15.8 to 7.8) | ⊕⊕⊕⊝ | BtA treatment probably slightly decreases the risk of withdrawal of clinical trials |
| Dysphagia Assessed at any point during follow‐up | RR 3.04 | 3.0% | 9.2% | 6.2% more | ⊕⊕⊕⊝ | BtA treatment probably increases the risk of dysphagia |
| Diffuse weakness/tiredness Assessed at any point during follow‐up | RR 1.78 | 5.6% | 10.1% | 4.4% more | ⊕⊕⊕⊝ | BtA treatment probably increases the risk of diffuse weakness/tiredness |
| *The risk in the intervention group (and its 95% confidence interval) is based on the assumed risk in the comparison group and the relative effect of the intervention (and its 95% CI). | ||||||
| GRADE Working Group grades of evidence | ||||||
| a Downgraded one level due to serious study limitations, namely concerns with randomisation procedures and other biases such as 'for‐profit' bias. | ||||||
| Term | Definition |
| BtA‐non‐responsive | People who do not experience the expected benefit from treatment with botulinum toxin type A |
| Cervical dystonia or spasmodic torticollis | A common movement disorder in which people have abnormal movements or postures of the head and neck that they cannot control. It is frequently accompanied by social embarrassment and pain. |
| Chemodenervation | The process by which botulinum toxin causes muscular paralysis. Although all the anatomical elements necessary for muscular control are intact (i.e. nerve, synapse and muscle), there is a chemical process that disables the transmission of the electrical signal from the nerve to the muscle. |
| Dysphagia | A discomfort or difficulty when swallowing. |
| Electromyography | An examination that displays the electrical activity of muscles using pieces of metal attached to the skin or inserted into the muscle. |
| Non‐naive | People who have been treated in the past with botulinum toxin. |
| Voluntary action | Movements that people are able to control, start and stop when they want to. |
| Study ID | Number of participants | Total dropouts | Age mean, range (years) | Baseline CD impairment BtA/placebo | % participants naive to Bt | BtA formulation | Total dose per participant | EMG‐guidance | Study duration (weeks) |
| Charles 2012 | 170 | 35 (11 in BtA) | 55, 31‐76 | 9.2/9.3 (CDSS) | 0 | Botox (OnaBtA) | 236 | No | 10 |
| Comella 2011 | 233 | 14 (8 in BtA) | 53 | 42.4/41.8 (TWSTRS) | 39 | Xeomin (IncoBtA) | 120 or 240 | At discretion | 20 |
| Greene 1990 | 55 | 3 (3 in BtA) | 50 | 21% severe/ 41% severe | 100 | Botox (OnaBtA) | 150 to 165 | No | 12 |
| Poewe 1998 | 75 | 2 (2 in BtA) | 47, 26‐82 | 13.9/14.4 (Tsui scale) | 100 | Dysport (AboBtA) | 250, 500 or 1000 | No | 8 |
| Poewe 2016 | 213 | N/A | 49 | 46/47 (TWSTRS) | 10 | Dysport (AboBtA) | 500 | N/A | 12 |
| Truong 2005 | 80 | 56 (22 in BtA) | 54, 27‐78 | 45.1/46.2 (TWSTRS) | 26 | Dysport (AboBtA) | 500 | At discretion | 20 |
| Truong 2010 | 116 | 33 (10 in BtA) | 53, 20‐79 | 43.8/45.8 (TWSTRS) | 17 | Dysport (AboBtA) | 500 | At discretion | 12 |
| Wissel 2001 | 68 | 0 | 48, 18‐75 | 11.1/11.5 (Tsui scale) | 31 | Dysport (AboBtA) | 500 | No | 16 |
| Bt: botulinum toxin; CD: cervical dystonia; CDSS: Cervical Dystonia Severity Scale; EMG: electromyography; TWSTRS: Toronto Western Spasmodic Torticollis Rating Scale | |||||||||
| Outcome or subgroup title | No. of studies | No. of participants | Statistical method | Effect size |
| 1 Cervical dystonia‐specific improvement Show forest plot | 7 | 833 | Std. Mean Difference (Random, 95% CI) | 0.70 [0.52, 0.89] |
| 2 Cervical dystonia‐specific improvement ‐ TWSTRS subgroup analysis Show forest plot | 4 | 522 | Mean Difference (IV, Random, 95% CI) | 8.06 [6.08, 10.05] |
| 3 Cervical dystonia‐specific severity ‐ as assessed with TWSTRS subscale Show forest plot | 3 | 429 | Mean Difference (IV, Random, 95% CI) | 3.13 [2.15, 4.11] |
| 4 Cervical dystonia‐specific disability ‐ as assessed with TWSTRS subscale Show forest plot | 3 | 429 | Mean Difference (IV, Random, 95% CI) | 2.52 [1.72, 3.31] |
| 5 Cervical dystonia‐specific improvement ‐ doses subgroup analysis Show forest plot | 6 | 777 | Std. Mean Difference (Random, 95% CI) | 0.84 [0.68, 1.00] |
| 5.1 Low dose | 1 | 39 | Std. Mean Difference (Random, 95% CI) | 1.24 [0.55, 1.94] |
| 5.2 Medium dose | 6 | 545 | Std. Mean Difference (Random, 95% CI) | 0.76 [0.59, 0.94] |
| 5.3 High dose | 2 | 193 | Std. Mean Difference (Random, 95% CI) | 1.08 [0.53, 1.63] |
| 6 Cervical dystonia‐specific improvement ‐ BtA formulation subgroup analysis Show forest plot | 7 | 833 | Std. Mean Difference (Random, 95% CI) | 0.70 [0.52, 0.89] |
| 6.1 Botox | 1 | 170 | Std. Mean Difference (Random, 95% CI) | 0.38 [0.08, 0.69] |
| 6.2 Dysport | 5 | 430 | Std. Mean Difference (Random, 95% CI) | 0.75 [0.54, 0.96] |
| 6.3 Xeomin | 1 | 233 | Std. Mean Difference (Random, 95% CI) | 0.82 [0.53, 1.10] |
| 7 Cervical dystonia‐specific improvement ‐ EMG‐guided versus non‐EMG‐guided subgroup analysis Show forest plot | 7 | 833 | Std. Mean Difference (Random, 95% CI) | 0.70 [0.52, 0.89] |
| 7.1 EMG‐guided injection | 4 | 522 | Std. Mean Difference (Random, 95% CI) | 0.71 [0.52, 0.89] |
| 7.2 Non‐EMG‐guided injection | 3 | 311 | Std. Mean Difference (Random, 95% CI) | 0.79 [0.27, 1.31] |
| 8 Adverse events Show forest plot | 7 | 952 | Risk Ratio (M‐H, Random, 95% CI) | 1.19 [1.03, 1.36] |
| 9 Adverse events ‐ doses subgroup analysis Show forest plot | 6 | Risk Ratio (M‐H, Random, 95% CI) | Subtotals only | |
| 9.1 Low dose | 1 | 39 | Risk Ratio (M‐H, Random, 95% CI) | 1.47 [0.56, 3.85] |
| 9.2 Medium dose | 6 | 664 | Risk Ratio (M‐H, Random, 95% CI) | 1.23 [1.06, 1.44] |
| 9.3 High dose | 2 | 193 | Risk Ratio (M‐H, Random, 95% CI) | 1.90 [0.72, 5.02] |
| 10 Adverse events ‐ BtA formulation subgroup analysis Show forest plot | 7 | 952 | Risk Ratio (M‐H, Random, 95% CI) | 1.19 [1.03, 1.36] |
| 10.1 Botox | 1 | 170 | Risk Ratio (M‐H, Random, 95% CI) | 1.01 [0.78, 1.30] |
| 10.2 Dysport | 5 | 549 | Risk Ratio (M‐H, Random, 95% CI) | 1.30 [1.02, 1.66] |
| 10.3 Xeomin | 1 | 233 | Risk Ratio (M‐H, Random, 95% CI) | 1.22 [0.92, 1.62] |
| 11 Adverse events ‐ EMG‐guided vs non‐EMG‐guided subgroup analysis Show forest plot | 7 | 952 | Risk Ratio (M‐H, Random, 95% CI) | 1.19 [1.03, 1.36] |
| 11.1 EMG‐guided injection | 4 | 640 | Risk Ratio (M‐H, Random, 95% CI) | 1.19 [1.03, 1.36] |
| 11.2 Non‐EMG‐guided injection | 3 | 312 | Risk Ratio (M‐H, Random, 95% CI) | 1.43 [0.82, 2.50] |
| 12 Dysphagia Show forest plot | 8 | 1007 | Risk Ratio (M‐H, Random, 95% CI) | 3.04 [1.68, 5.50] |
| 13 Diffuse weakness/tiredness Show forest plot | 6 | 823 | Risk Ratio (M‐H, Random, 95% CI) | 1.78 [1.08, 2.94] |
| 14 Neck weakness Show forest plot | 4 | 277 | Risk Ratio (M‐H, Random, 95% CI) | 3.23 [0.95, 10.91] |
| 15 Voice change/hoarseness Show forest plot | 2 | 154 | Risk Ratio (M‐H, Random, 95% CI) | 1.83 [0.37, 8.95] |
| 16 Sore throat/dry mouth Show forest plot | 3 | 222 | Risk Ratio (M‐H, Random, 95% CI) | 1.66 [0.78, 3.51] |
| 17 Vertigo/dizziness Show forest plot | 2 | 154 | Risk Ratio (M‐H, Random, 95% CI) | 1.47 [0.38, 5.73] |
| 18 Malaise/upper respiratory infection Show forest plot | 7 | 952 | Risk Ratio (M‐H, Random, 95% CI) | 1.29 [0.63, 2.64] |
| 19 Local pain (injection site) Show forest plot | 7 | 837 | Risk Ratio (M‐H, Random, 95% CI) | 1.33 [0.88, 2.02] |
| 20 Headache Show forest plot | 6 | 706 | Risk Ratio (M‐H, Random, 95% CI) | 1.05 [0.59, 1.86] |
| 21 Any improvement by subjective clinician assessment Show forest plot | 4 | 544 | Risk Ratio (M‐H, Random, 95% CI) | 1.91 [1.47, 2.49] |
| 22 Any improvement by subjective participant assessment Show forest plot | 5 | 624 | Risk Ratio (M‐H, Random, 95% CI) | 2.30 [1.83, 2.90] |
| 23 Any improvement by subjective participant assessment ‐ doses subgroup analysis Show forest plot | 4 | Risk Ratio (M‐H, Random, 95% CI) | Subtotals only | |
| 23.1 Low dose | 1 | 39 | Risk Ratio (M‐H, Random, 95% CI) | 1.58 [0.30, 8.43] |
| 23.2 Medium dose | 4 | 336 | Risk Ratio (M‐H, Random, 95% CI) | 2.44 [1.82, 3.25] |
| 23.3 High dose | 2 | 193 | Risk Ratio (M‐H, Random, 95% CI) | 3.39 [2.16, 5.33] |
| 24 Any improvement by subjective participant assessment ‐ BtA formulation subgroup analysis Show forest plot | 5 | Risk Ratio (M‐H, Random, 95% CI) | Subtotals only | |
| 24.1 Botox | 1 | 170 | Risk Ratio (M‐H, Random, 95% CI) | 1.99 [1.34, 2.94] |
| 24.2 Dysport | 3 | 221 | Risk Ratio (M‐H, Random, 95% CI) | 2.13 [1.49, 3.04] |
| 24.3 Xeomin | 1 | 233 | Risk Ratio (M‐H, Random, 95% CI) | 3.23 [2.03, 5.14] |
| 25 Any improvement by subjective participant assessment ‐ EMG guided vs non‐EMG‐guided subgroup analysis Show forest plot | 5 | Risk Ratio (M‐H, Random, 95% CI) | Subtotals only | |
| 25.1 EMG‐guided injection | 2 | 313 | Risk Ratio (M‐H, Random, 95% CI) | 2.97 [1.99, 4.43] |
| 25.2 Non‐EMG‐guided injection | 3 | 311 | Risk Ratio (M‐H, Random, 95% CI) | 2.03 [1.53, 2.69] |
| 26 Cervical dystonia‐specific pain Show forest plot | 6 | Std. Mean Difference (Random, 95% CI) | 0.50 [0.35, 0.65] | |
| 27 Cervical dystonia‐specific pain ‐ TWSTRS pain subscale subgroup analysis Show forest plot | 3 | Mean Difference (Random, 95% CI) | 2.11 [1.38, 2.83] | |
| 28 Cervical dystonia‐specific pain ‐ BtA formulation subgroup analysis Show forest plot | 6 | Std. Mean Difference (Random, 95% CI) | 0.50 [0.35, 0.65] | |
| 28.1 Botox | 2 | Std. Mean Difference (Random, 95% CI) | 0.51 [0.01, 1.02] | |
| 28.2 Dysport | 3 | Std. Mean Difference (Random, 95% CI) | 0.52 [0.28, 0.77] | |
| 28.3 Xeomin | 1 | Std. Mean Difference (Random, 95% CI) | 0.55 [0.27, 0.83] | |
| 29 Cervical dystonia‐specific pain ‐ EMG‐guided vs non‐EMG‐guided subgroup analysis Show forest plot | 6 | 654 | Std. Mean Difference (Random, 95% CI) | 0.50 [0.35, 0.65] |
| 29.1 EMG‐guided injection | 3 | 429 | Std. Mean Difference (Random, 95% CI) | 0.53 [0.33, 0.73] |
| 29.2 Non‐EMG‐guided injection | 3 | 225 | Std. Mean Difference (Random, 95% CI) | 0.50 [0.20, 0.80] |
| 30 Tolerability ‐ withdrawals Show forest plot | 4 | 574 | Risk Ratio (IV, Random, 95% CI) | 0.38 [0.23, 0.62] |
| 31 Tolerability ‐ withdrawals due lack of efficacy subgroup analysis Show forest plot | 3 | 519 | Risk Ratio (IV, Random, 95% CI) | 0.30 [0.17, 0.53] |
| 32 Tolerability ‐ withdrawals due to adverse events subgroup analysis Show forest plot | 2 | 288 | Risk Ratio (IV, Random, 95% CI) | 3.10 [0.36, 26.74] |