Music‐based therapeutic interventions for people with dementia
Information
- DOI:
- https://doi.org/10.1002/14651858.CD003477.pub4Copy DOI

- Database:
-
- Cochrane Database of Systematic Reviews
- Version published:
-
- 23 July 2018see what's new
- Type:
-
- Intervention
- Stage:
-
- Review
- Cochrane Editorial Group:
-
Cochrane Dementia and Cognitive Improvement Group
- Copyright:
-
- Copyright © 2018 The Cochrane Collaboration. Published by John Wiley & Sons, Ltd.
Article metrics
Altmetric:
Cited by:
Authors
Contributions of authors
-
JS, HS, JCW, RS and AV contributed to all aspects of the review.
-
MB assisted with data‐extraction and commenting on drafts.
Consumer editor: Joost de Haas.
Contact editor: Leon Flicker.
The review was peer reviewed anonymously.
Sources of support
Internal sources
-
Rijksuniversiteit Groningen, Netherlands.
-
ArtEZ School of Music, Enschede, Netherlands.
External sources
-
The Netherlands Organisation for Scientific Research (NWO); Innovational Research Incentives Scheme: Vidi grant number 917.11.339, Netherlands.
-
NIHR, UK.
This update was supported by the National Institute for Health Research (NIHR), via Cochrane Infrastructure funding to the Cochrane Dementia and Cognitive Improvement group. The views and opinions expressed therein are those of the authors and do not necessarily reflect those of the Systematic Reviews Programme, NIHR, National Health Service or the Department of Health
Declarations of interest
AV and MB are involved in music therapy research and dementia. We included a study of AV, which was, however, evaluated by two other review authors. The lead author and the co‐authors, who are Cochrane experts, made the final decisions about analyses, presentation and interpretation of the data and they do not have a conflict of interest related to finding effects of music therapy.
Acknowledgements
We gratefully acknowledge the contributions of the following.
-
Dr Mirjam van Soest‐Poortvliet for her contribution to the previous update of this review.
-
The Cochrane Dementia and Cognitive Improvement Group and their peer reviewers.
-
Ingrid Riphagen, clinical librarian of the University of Groningen for her kind assistance to earlier versions of this review.
-
Prof Dr Joris Slaets (Leyden Academy, the Netherlands) for methodological and clinical advice to earlier versions of this review.
-
The music therapy students from the Conservatory Enschede, ArtEZ School of music, the Netherlands for their help in retrieving possible studies.
-
Our lay reviewer Mr Joost de Haas who contributed to earlier versions of this review.
-
Jacqueline Birks for her valuable contribution to the first two versions of this review.
-
We are grateful to the authors who provided additional data for inclusion in meta‐analyses: Dr Alfredo Raglio, Istituti Clinici Scientifici Maugeri, Pavia, Italy; Dr Ming Hung Hsu, Methodist Homes (MHA), Derby, UK and Anglia Ruskin University, Cambridge, UK; Joanna Thornley, University of Windsor, Masters of Social Work, Ontario, Canada; Dr Séverine Samson, University of Lille and La Pitié‐Salpêtrière Hospital, Paris, France; Jón Snædal, Professor in Geriatric Medicine, Landspitali, University Hospital, Reykjavik, Iceland.
-
For help with data extraction, we thank Miao Wan, The First Clinical Medical College of Lanzhou University, Lanzhou, Gansu Province, China, and Dang Wei, Evidence Based Medicine Center, School of Basic Medical Science, Lanzhou University, Lanzhou, Gansu Province, China and Karolinska Institutet, Sweden. We also thank Hyeong Sik Ahn, MD, PhD, Department of Preventive Medicine, College of Medicine, Korea University, and Heather Swan, School of Sociological and Anthropological Studies, Faculty of Social Sciences, University of Ottawa, Canada.
Version history
| Published | Title | Stage | Authors | Version |
| 2018 Jul 23 | Music‐based therapeutic interventions for people with dementia | Review | Jenny T van der Steen, Hanneke JA Smaling, Johannes C van der Wouden, Manon S Bruinsma, Rob JPM Scholten, Annemiek C Vink | |
| 2017 May 02 | Music‐based therapeutic interventions for people with dementia | Review | Jenny T van der Steen, Mirjam C van Soest‐Poortvliet, Johannes C van der Wouden, Manon S Bruinsma, Rob JPM Scholten, Annemiek C Vink | |
| 2003 Oct 20 | Music therapy for people with dementia | Review | Annemiek C Vink, Manon S Bruinsma, Rob JPM Scholten | |
| 2002 Jan 21 | Music therapy in the care of people with dementia | Protocol | Annemiek C Vink, M S Bruinsma, Rob Scholten | |
Differences between protocol and review
We adapted terminology for relevant outcomes. The protocol formulated the objective in terms of problems only while emotions and (social) behaviour were broader than that (protocol: "To assess the effects of music therapy in the treatment of behavioural, social, cognitive and emotional problems in older people with dementia"). In the updates of the review, we consistently referred to: 1. emotional well‐being including quality of life; mood disturbance or negative affect, which included 2. depression and 3. anxiety; behavioural problems which included 4. agitation or aggression, and 5. behaviour overall; 6. social behaviour; and 7. cognition. We also searched for any (other) possible adverse effects. We adapted the objectives in the abstract to cover both the original aims and how we broadened it to include more positive outcomes as well. Also, the protocol referred to effects in "older people" but there has not been an exclusion criterion based on age. Therefore, we removed reference to "older" people.
Two and not three review authors independently assessed publications. Two review authors extracted data and if needed, in consultation with other review authors as per protocol. We included only RCTs because, unlike at the time the protocol was written, we expected more RCTs to be available. We accepted a physician's diagnosis of dementia if no data on formal criteria such as DSM‐IV, DSM‐5 (major neurocognitive disorders) or comparable instruments were available for reason of relevance to clinical practice and known under‐reporting. We did not analyse by length of treatment (months, length in three groups as in the protocol), but we analysed end‐of‐treatment data accepting variable durations and number of sessions as long as the outcomes were assessed after a minimum of five sessions. Rather, we aimed at assessing long‐term effects, analysing data about assessments at a minimum of four weeks after the end of treatment.
We used more stringent criteria with respect to: 1. assessing whether an article reported about a music intervention with an individual therapeutic intent, including – but not limited to – interventions provided by qualified music therapists, 2. analyses referring to outcome assessments after a minimum of five sessions or analyses that included earlier assessments if there was evidence of no different effect over time, 3. control group, and 4. risk of bias. Regarding point 4., if no research protocol was available, risk of reporting bias was set to either unclear or, for specific reasons, as high (also if rated as low in previous versions of the review). With regard to point 1., we defined music‐based therapeutic interventions or music therapy as: therapy provided by a qualified music therapist, or an intervention meeting at least two of the following criteria: a. therapeutic objective which may include communication, relationships, learning, mobilisation, expression, mobilisation and other relevant therapeutic objectives; b. music matches individual preferences; c. active participation of the people with dementia using music instruments; d. participants had a clinical indication for the interventions or were referred to the intervention by a clinician. We also required music to be a main element of the intervention (e.g. not moving with use of music). Therefore, we focused on therapeutic aspects and elements that are more complex and required special skills while also targeted to the individual compared with, for example, playing recorded music for a group activity. We did not require a certified music therapist to provide the intervention, because the profession, exact qualification, training and experience was often unclear, and training programmes may vary between countries. Moreover, the importance of requiring a qualification is unclear in relation to the importance of having experience with the specific needs of people with dementia (e.g. a trained music therapist with no experience in comparison with a musician with years of experience in providing therapy to people with dementia). Further (point 3.), we required control groups to not receive any music‐based therapeutic intervention (even if fewer sessions than the active intervention group). We reassessed previously included studies by the new criteria and when in doubt, we consulted the lead author of the earlier versions.
Finally, we conducted a series of post hoc sensitivity analyses to explore possible effects of using more stringent criteria with respect to a requirement of a music therapist to deliver the intervention, and funding by parties with a possible interest in effectiveness of music therapy.
Notes
2018: this version was written with another review author who worked on data collection and analyses with the first review author. Studies awaiting classification were included when available, and a study identified through a new search in 2017.
2017: this new citation version was written with three additional review authors. Inclusion of studies until the 2011 update were reconsidered according to the new and more stringent criteria. A further update would incorporate studies awaiting classification since a search in 2016.
2004: this is a completely new review of music‐based interventions for people with dementia written by a new and different team of review authors (Vink and colleagues) from the previous, now permanently withdrawn review of music therapy (Koger and colleagues).
Keywords
MeSH
Medical Subject Headings (MeSH) Keywords
Medical Subject Headings Check Words
Aged; Humans;
PICOs


Methodological quality summary: review authors' judgements about each methodological quality item for each included study.

Methodological quality graph: review authors' judgements about each methodological quality item presented as percentages across all included studies.

Funnel plot of comparison: 1 Music‐based therapeutic interventions versus usual care or versus other activities: end of treatment, outcome: 1.3 Negative affect or mood disturbances: anxiety (13 studies, 15 dots because 2 studies used 2 control groups, 1 with usual care and 1 with other activities).

Funnel plot of comparison: 1 Music‐based therapeutic interventions versus usual care or versus other activities: end of treatment, outcome: 1.4 Problematic behaviour: agitation or aggression (14 studies, 16 dots because 2 studies used 2 control groups, 1 with usual care and 1 with other activities).

Forest plot of comparison: 1 Music‐based therapeutic interventions versus usual care or versus other activities: end of treatment, outcome: 1.1 Emotional well‐being and quality of life. CI: confidence interval; SD: standard deviation.

Forest plot of comparison: 1 Music‐based therapeutic interventions versus usual care or versus other activities: end of treatment, outcome: 1.2 Negative affect or mood disturbances: depression. BEHAVE‐AD: Behavioural Pathology in Alzheimer's Disease; NPI: Neuropsychiatric Inventory; SD: standard deviation.

Forest plot of comparison: 1 Music‐based therapeutic interventions versus usual care or versus other activities: end of treatment, outcome: 1.3 Negative affect or mood disturbances: anxiety. BEHAVE‐AD: Behavioural Pathology in Alzheimer's Disease; NPI: Neuropsychiatric Inventory; SD: standard deviation; STAI‐A: State‐Trait Anxiety Inventory for Adults.

Forest plot of comparison: 1 Music‐based therapeutic interventions versus usual care or versus other activities: end of treatment, outcome: 1.4 Problematic behaviour: agitation or aggression. BEHAVE‐AD: Behavioural Pathology in Alzheimer's Disease; CI: confidence interval; CMAI: Cohen‐Mansfield Agitation Inventory; NPI: Neuropsychiatric Inventory; SD: standard deviation.

Forest plot of comparison: 1 Music‐based therapeutic interventions versus usual care or versus other activities: end of treatment, outcome: 1.5 Problematic behaviour overall. NPI: Neuropsychiatric Inventory; SD: standard deviation.

Forest plot of comparison: 1 Music‐based therapeutic interventions versus usual care or versus other activities: end of treatment, outcome: 1.6 Social behaviour: music vs other activities. SD: standard deviation.
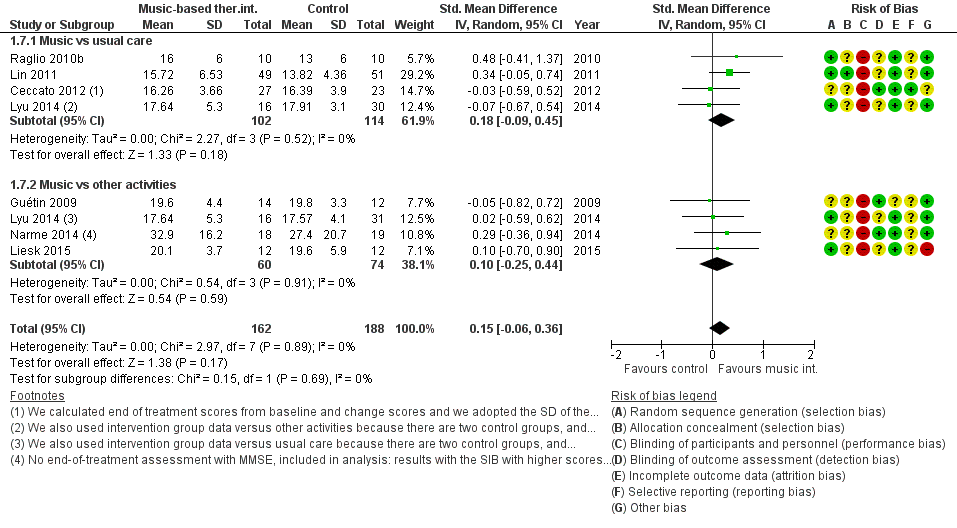
Forest plot of comparison: 1 Music‐based therapeutic interventions versus usual care or versus other activities: end of treatment, outcome: 1.7 Cognition. MMSE: Mini‐Mental State Examination; SD: standard deviation; SIB: Severe Impairment Battery.

Comparison 1 Music‐based therapeutic interventions versus usual care or versus other activities: end of treatment, Outcome 1 Emotional well‐being including quality of life.

Comparison 1 Music‐based therapeutic interventions versus usual care or versus other activities: end of treatment, Outcome 2 Mood disturbance or negative affect: depression.

Comparison 1 Music‐based therapeutic interventions versus usual care or versus other activities: end of treatment, Outcome 3 Mood disturbance or negative affect: anxiety.

Comparison 1 Music‐based therapeutic interventions versus usual care or versus other activities: end of treatment, Outcome 4 Behaviour problems: agitation or aggression.

Comparison 1 Music‐based therapeutic interventions versus usual care or versus other activities: end of treatment, Outcome 5 Behaviour problems: overall.

Comparison 1 Music‐based therapeutic interventions versus usual care or versus other activities: end of treatment, Outcome 6 Social behaviour: music vs other activities.

Comparison 1 Music‐based therapeutic interventions versus usual care or versus other activities: end of treatment, Outcome 7 Cognition.

Comparison 2 Music‐based therapeutic interventions versus usual care or versus other activities: long‐term effects, Outcome 1 Emotional well‐being including quality of life.

Comparison 2 Music‐based therapeutic interventions versus usual care or versus other activities: long‐term effects, Outcome 2 Mood disturbance or negative affect: depression.

Comparison 2 Music‐based therapeutic interventions versus usual care or versus other activities: long‐term effects, Outcome 3 Mood disturbance or negative affect: anxiety.

Comparison 2 Music‐based therapeutic interventions versus usual care or versus other activities: long‐term effects, Outcome 4 Behavioural problems: agitation or aggression.

Comparison 2 Music‐based therapeutic interventions versus usual care or versus other activities: long‐term effects, Outcome 5 Behavioural problems: overall.

Comparison 2 Music‐based therapeutic interventions versus usual care or versus other activities: long‐term effects, Outcome 6 Social behaviour: music versus other activities.
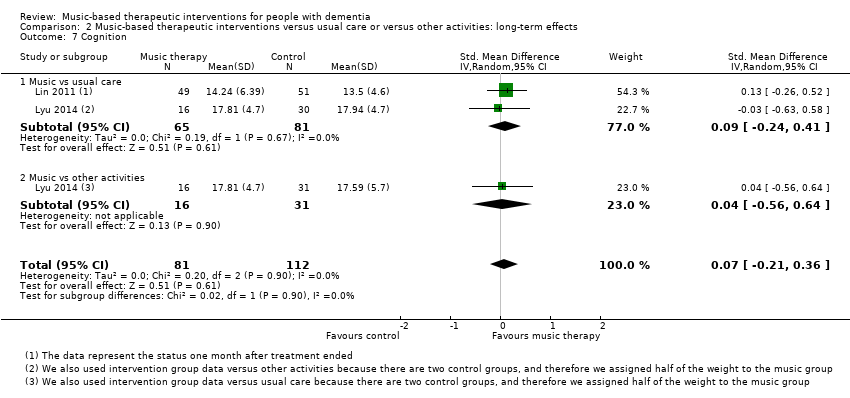
Comparison 2 Music‐based therapeutic interventions versus usual care or versus other activities: long‐term effects, Outcome 7 Cognition.
| Music‐based therapeutic interventions compared to usual care or other activities for people with dementia: end‐of‐treatment effects | |||
| Patient or population: people with dementia (all resided in institutional settings) | |||
| Outcomes (end of treatment) measured with a variety of scales except for social behaviour | Anticipated absolute effects, SMD* (95% CI) | № of participants | Quality of the evidence |
| Score with music therapy compared with usual care or other activities | |||
| Emotional well‐being including quality of life | The score in the intervention group was 0.32 SDs higher | 348 | ⊕⊕⊝⊝ |
| Mood disturbance or negative affect: depression | The score in the intervention group was 0.27 SDs lower | 503 | ⊕⊕⊕⊝ |
| Mood disturbance or negative affect: anxiety | The score in the intervention group was 0.43 SDs lower | 478 | ⊕⊕⊝⊝ |
| Behavioural problems: agitation or aggression | The score in the intervention group was 0.07 SDs lower | 626 | ⊕⊕⊕⊝ |
| Behavioural problems: overall | The score in the intervention group was 0.23 SDs lower | 442 | ⊕⊕⊕⊝ |
| Social behaviour: music vs other activities | The score in the intervention group was 0.54 SDs higher | 70 | ⊕⊝⊝⊝ |
| Cognition | The score in the intervention group was 0.15 SDs higher | 350 | ⊕⊕⊝⊝ |
| *Interpretation of SMD: a difference of < 0.40 SDs can be regarded as a small effect, 0.40–0.70 a moderate effect, and > 0.70 a large effect. CI: confidence interval; SMD: standardised mean difference; SD: standard deviation. | |||
| GRADE Working Group grades of evidence (GradePro) | |||
| aRisk of bias: no blinding of therapists and participants (not possible), and often no or unclear blinding of outcome assessment. bImprecision: small number of participants and broad CI. cRisk of bias: no blinding of therapists and participants (not possible), and sometimes no or unclear blinding of outcome assessment. dInconsistency: more non‐overlapping CIs. eImprecision: very small number of participants and broad CIs. fImprecision: small number of participants. | |||
| Music‐based therapeutic interventions compared to usual care or other activities for people with dementia: long‐term effects (scores 4 weeks or more after treatment ended) | |||
| Patient or population: people with dementia (all resided in institutional settings) | |||
| Outcomes (long‐term) measured with a variety of scales except for social behaviour | Anticipated absolute effects, SMD* (95% CI) | № of participants | Quality of the evidence |
| Score with music therapy compared with usual care or other activities | |||
| Emotional well‐being including quality of life | The score in the intervention group was 0.34 SDs higher | 180 | ⊕⊕⊝⊝ |
| Mood disturbance or negative affect: depression | The score in the intervention group was 0.03 SDs lower | 354 | ⊕⊕⊝⊝ |
| Mood disturbance or negative affect: anxiety | The score in the intervention group was 0.28 SDs lower | 265 | ⊕⊝⊝⊝ |
| Behavioural problems: agitation or aggression | The score in the intervention group was 0.10 SDs lower | 330 | ⊕⊕⊝⊝ |
| Behavioural problems: overall | The score in the intervention group was 0.19 SDs lower | 351 | ⊕⊕⊝⊝ |
| Social behaviour: music vs other activities | The score in the intervention group was 0.53 SDs higher | 48 | ⊕⊝⊝⊝ |
| Cognition | The score in the intervention group was 0.07 SDs higher | 193 | ⊕⊕⊝⊝ |
| *Interpretation of SMD: a difference of < 0.40 SDs can be regarded as a small effect, 0.40–0.70 a moderate effect, and > 0.70 a large effect. CI: confidence interval; SMD: standardised mean difference; SD: standard deviation. | |||
| GRADE Working Group grades of evidence (GradePro) | |||
| aRisk of bias: no blinding of therapists and participants (not possible), and sometimes no or unclear blinding of outcome assessment. bImprecision: small number of participants and broad CIs includes both benefit and harm. cImprecision: small number of participants. dRisk of bias: no blinding of therapists and participants (not possible). eInconsistency: non‐overlapping CIs. fImprecision: small number of participants and broad CIs includes both benefit and harm. gImprecision: very small number of participants and very broad CIs includes both benefit and harm. hRisk of bias: no blinding of therapists and participants (not possible), and unclear blinding of outcome assessment. | |||
| Outcome or subgroup title | No. of studies | No. of participants | Statistical method | Effect size |
| 1 Emotional well‐being including quality of life Show forest plot | 9 | 348 | Std. Mean Difference (IV, Random, 95% CI) | 0.32 [0.02, 0.62] |
| 1.1 Music vs usual care | 3 | 113 | Std. Mean Difference (IV, Random, 95% CI) | 0.47 [‐0.30, 1.25] |
| 1.2 Music vs other activities | 7 | 235 | Std. Mean Difference (IV, Random, 95% CI) | 0.30 [‐0.04, 0.64] |
| 2 Mood disturbance or negative affect: depression Show forest plot | 11 | 503 | Std. Mean Difference (IV, Random, 95% CI) | ‐0.27 [‐0.45, ‐0.09] |
| 2.1 Music vs usual care | 6 | 307 | Std. Mean Difference (IV, Random, 95% CI) | ‐0.28 [‐0.53, ‐0.04] |
| 2.2 Music vs other activities | 6 | 196 | Std. Mean Difference (IV, Random, 95% CI) | ‐0.23 [‐0.52, 0.06] |
| 3 Mood disturbance or negative affect: anxiety Show forest plot | 13 | 478 | Std. Mean Difference (IV, Random, 95% CI) | ‐0.43 [‐0.72, ‐0.14] |
| 3.1 Music vs usual care | 6 | 237 | Std. Mean Difference (IV, Random, 95% CI) | ‐0.22 [‐0.48, 0.04] |
| 3.2 Music vs other activities | 9 | 241 | Std. Mean Difference (IV, Random, 95% CI) | ‐0.63 [‐1.13, ‐0.12] |
| 4 Behaviour problems: agitation or aggression Show forest plot | 14 | 626 | Std. Mean Difference (IV, Random, 95% CI) | ‐0.07 [‐0.24, 0.10] |
| 4.1 Music vs usual care | 10 | 458 | Std. Mean Difference (IV, Random, 95% CI) | ‐0.10 [‐0.31, 0.11] |
| 4.2 Music vs other activities | 6 | 168 | Std. Mean Difference (IV, Random, 95% CI) | 0.01 [‐0.31, 0.32] |
| 5 Behaviour problems: overall Show forest plot | 10 | 442 | Std. Mean Difference (IV, Random, 95% CI) | ‐0.23 [‐0.46, ‐0.01] |
| 5.1 Music vs usual care | 7 | 251 | Std. Mean Difference (IV, Random, 95% CI) | ‐0.40 [‐0.71, ‐0.10] |
| 5.2 Music vs other activities | 6 | 191 | Std. Mean Difference (IV, Random, 95% CI) | ‐0.02 [‐0.32, 0.28] |
| 6 Social behaviour: music vs other activities Show forest plot | 3 | 70 | Std. Mean Difference (IV, Random, 95% CI) | 0.54 [0.06, 1.02] |
| 7 Cognition Show forest plot | 7 | 350 | Std. Mean Difference (IV, Random, 95% CI) | 0.15 [‐0.06, 0.36] |
| 7.1 Music vs usual care | 4 | 216 | Std. Mean Difference (IV, Random, 95% CI) | 0.18 [‐0.09, 0.45] |
| 7.2 Music vs other activities | 4 | 134 | Std. Mean Difference (IV, Random, 95% CI) | 0.10 [‐0.25, 0.44] |
| Outcome or subgroup title | No. of studies | No. of participants | Statistical method | Effect size |
| 1 Emotional well‐being including quality of life Show forest plot | 4 | 180 | Std. Mean Difference (IV, Random, 95% CI) | 0.34 [‐0.12, 0.80] |
| 1.1 Music vs usual care | 2 | 72 | Std. Mean Difference (IV, Random, 95% CI) | 0.91 [‐0.85, 2.67] |
| 1.2 Music vs other activities | 3 | 108 | Std. Mean Difference (IV, Random, 95% CI) | 0.18 [‐0.22, 0.58] |
| 2 Mood disturbance or negative affect: depression Show forest plot | 6 | 354 | Std. Mean Difference (IV, Random, 95% CI) | ‐0.03 [‐0.24, 0.19] |
| 2.1 Music vs usual care | 4 | 233 | Std. Mean Difference (IV, Random, 95% CI) | ‐0.02 [‐0.28, 0.24] |
| 2.2 Music vs other activities | 3 | 121 | Std. Mean Difference (IV, Random, 95% CI) | ‐0.04 [‐0.41, 0.33] |
| 3 Mood disturbance or negative affect: anxiety Show forest plot | 6 | 265 | Std. Mean Difference (IV, Random, 95% CI) | ‐0.28 [‐0.71, 0.15] |
| 3.1 Music vs usual care | 3 | 141 | Std. Mean Difference (IV, Random, 95% CI) | ‐0.06 [‐0.48, 0.37] |
| 3.2 Music vs other activities | 4 | 124 | Std. Mean Difference (IV, Random, 95% CI) | ‐0.53 [‐1.31, 0.25] |
| 4 Behavioural problems: agitation or aggression Show forest plot | 5 | 330 | Std. Mean Difference (IV, Random, 95% CI) | ‐0.10 [‐0.33, 0.13] |
| 4.1 Music vs usual care | 4 | 241 | Std. Mean Difference (IV, Random, 95% CI) | ‐0.17 [‐0.42, 0.09] |
| 4.2 Music vs other activities | 2 | 89 | Std. Mean Difference (IV, Random, 95% CI) | 0.10 [‐0.66, 0.86] |
| 5 Behavioural problems: overall Show forest plot | 6 | 351 | Std. Mean Difference (IV, Random, 95% CI) | ‐0.19 [‐0.51, 0.14] |
| 5.1 Music vs usual care | 5 | 207 | Std. Mean Difference (IV, Random, 95% CI) | ‐0.32 [‐0.85, 0.21] |
| 5.2 Music vs other activities | 3 | 144 | Std. Mean Difference (IV, Random, 95% CI) | ‐0.09 [‐0.44, 0.25] |
| 6 Social behaviour: music versus other activities Show forest plot | 2 | 48 | Std. Mean Difference (IV, Random, 95% CI) | 0.53 [‐0.53, 1.60] |
| 6.1 Music vs usual care | 0 | 0 | Std. Mean Difference (IV, Random, 95% CI) | 0.0 [0.0, 0.0] |
| 6.2 Music vs other activities | 2 | 48 | Std. Mean Difference (IV, Random, 95% CI) | 0.53 [‐0.53, 1.60] |
| 7 Cognition Show forest plot | 2 | 193 | Std. Mean Difference (IV, Random, 95% CI) | 0.07 [‐0.21, 0.36] |
| 7.1 Music vs usual care | 2 | 146 | Std. Mean Difference (IV, Random, 95% CI) | 0.09 [‐0.24, 0.41] |
| 7.2 Music vs other activities | 1 | 47 | Std. Mean Difference (IV, Random, 95% CI) | 0.04 [‐0.56, 0.64] |