Trombólisis para la trombosis venosa profunda aguda
References
References to studies included in this review
References to studies excluded from this review
References to ongoing studies
Additional references
References to other published versions of this review
Characteristics of studies
Characteristics of included studies [ordered by study ID]
Jump to:
| Methods | Allocation: random Single blind Exclusions after randomisation: 1 Loss to follow‐up: nil | |
| Participants | Country: Norway Participants: 43 Age: < 70 years Sex: Male and female Inclusion criteria: inpatients with venographically confirmed DVT extending proximally beyond the calf < 5 days duration Exclusion criteria: bleeding dysfunction; surgery within 7 days; GI/GU bleeding; stroke; diastolic BP > 120 mmHg; hypertensive retinopathy grade 3 ‐ 4; renal/hepatic insufficiency; pregnancy; malignancy; age > 70 | |
| Interventions | Treatment: streptokinase 250,000 U loading IV, then 100,000 IU/hour IV 72 ‐ 96 hours Control: heparin 15,000 IU IV bolus, 30,000 IU infusion IV 72 ‐ 90 hours Co‐treatment: hydrocortisone 100 mg IV, then prednisolone 10 mg three times daily during streptokinase infusion. Warfarin begun after streptokinase along with heparin until warfarin effective In control group, warfarin begun after 72 ‐ 90 hours with continuation of heparin until warfarin effective | |
| Outcomes | 21 days: mortality; PE; major bleeding; clot lysis 6 years: mortality; recurrent DVT; post‐thrombotic syndrome; leg ulceration | |
| Notes | 40 randomised, 1 excluded as diagnosis of DVT in error | |
| Risk of bias | ||
| Bias | Authors' judgement | Support for judgement |
| Random sequence generation (selection bias) | Low risk | "...performed by our statistician on the basis of random numbers" |
| Allocation concealment (selection bias) | Low risk | " ...allocation to the treatment groups was performed by using sealed envelopes" |
| Blinding of participants and personnel (performance bias) | Low risk | not possible due to intervention but judged low risk as outcome assessment well described |
| Blinding of outcome assessment (detection bias) | Low risk | "the radiologic evaluation was done without knowledge of the treatment given" |
| Incomplete outcome data (attrition bias) | Low risk | no missing data |
| Selective reporting (reporting bias) | Low risk | all outcomes reported |
| Other bias | Low risk | none |
| Methods | Allocation: random Single blind Exclusions after randomisation: nil Losses to follow‐up: 23 at 7 months | |
| Participants | Country: USA Participants: 50 Age: > 18 years Sex: Male and female Inclusion criteria: venographically confirmed DVT duration < 14 days Exclusion criteria: pregnancy; surgery or childbirth < 10 days; bleeding dysfunction; peptic ulcer; recent streptococcal infection; active TB; carotid bruit; stroke < 6 months; diastolic BP > 100 mmHg; atrial fibrillation; hypertensive retinopathy grade 3/4; hepatic/renal biopsy aortography < 14 days | |
| Interventions | Treatment: hydrocortisone 100 mg IV then streptokinase IV 250,000 U over 30 minutes, then 100,000 U/hour titrated for 72 hours. Followed by IV heparin titrated over 7 days Control: IV heparin 150 U/kg loading dose then titrated for 10 days Co‐treatment: warfarin given from day 6 ‐ 7 | |
| Outcomes | 3 ‐ 10 days: clot lysis; bleeding; stroke; mortality 7 months: clot lysis | |
| Notes | Did not specify whether arm vein thrombosis included or not | |
| Risk of bias | ||
| Bias | Authors' judgement | Support for judgement |
| Random sequence generation (selection bias) | Unclear risk | stated "randomized" but no further details given |
| Allocation concealment (selection bias) | Unclear risk | not described |
| Blinding of participants and personnel (performance bias) | Low risk | not described but judged as low risk of bias as outcome assessment blinding described |
| Blinding of outcome assessment (detection bias) | Low risk | "..two radiologists who were unaware of the patient's treatment were evaluated the venograms..." |
| Incomplete outcome data (attrition bias) | Low risk | no missing data |
| Selective reporting (reporting bias) | Low risk | all outcomes reported |
| Other bias | Low risk | none |
| Methods | A prospective, controlled, randomised, comparative study to compare conventional full dose heparin and streptokinase (Kabikinase) | |
| Participants | Country: South Africa Total randomised: 51 (strep 26, hep 25) Sex: Male (17) and female (34) Mean age hep group: 51 years; strep group: 48 years Inclusion criteria: proximal vein thrombosis diagnosed by bilateral ascending phlebograph and less than 8 days clinical history of DVT Exclusion criteria: any surgery within 7 days or neurosurgical within 2 months, pregnancy, menstruation, haemorrhagic diatheses, diastolic blood pressure of 110 mmHg, suspected or know bleeding lesions, cerebrovascular accident within 6 months, recent streptococcal infection, previous streptokinase therapy within 6 months, liver or renal disease 2 patients in strep group had axillary vein thrombosis | |
| Interventions | Treatment: 100 mg of hydrocortisone 15 mins prior to first streptokinase dose and repeated 6 hourly for duration of strep treatment. Strepokinase (Kabikinase) loading dose of 600,000 U given by infusion over a period of 30 mins. Then 100,000 U hourly for 3 days by infusion pump. Then heparin for 4 days dose adjusted to maintain Lee‐White clotting time to at least 2.5 ‐ 3 normal Control: At diagnosis 10,000 U of heparin given by iv injection. The 10,000 U iv 6 hourly using constant infusion pump. Dose adjusted to maintain Lee‐White clotting time to at least 2.5 ‐ 3 normal Treatment continued for 7 days 30 mg warfarin given as a loading dose to both groups 36 hours before heparin therapy terminated, warfarin continued for 8 weeks, dose adjusted to maintain pro‐thrombin index 40 ‐ 60 per cent All participants bed rest for duration, foot of bed raised by 60 cm, elastic support provided | |
| Outcomes | Mortality, complete lysis, bleeding, PE, valve function, PTS symptoms 6‐33 months (mean 19 months) | |
| Notes | ||
| Risk of bias | ||
| Bias | Authors' judgement | Support for judgement |
| Random sequence generation (selection bias) | Unclear risk | no details given |
| Allocation concealment (selection bias) | Unclear risk | no details given |
| Blinding of participants and personnel (performance bias) | Low risk | no details given but judged low risk as outcome assessment well described |
| Blinding of outcome assessment (detection bias) | Low risk | "..all radiographs were assessed on a blind basis" |
| Incomplete outcome data (attrition bias) | Low risk | no missing data |
| Selective reporting (reporting bias) | Low risk | all outcomes reported |
| Other bias | Low risk | none |
| Methods | Allocation: random Single blind Exclusions after randomisation ‐ nil Losses to follow‐up ‐ nil | |
| Participants | Country: Egypt Participants: 35 Age: < 70 years Sex: Male and female Inclusion criteria: iliofemoral venous thrombosis confirmed by duplex or venography duration < 10 days; life expectancy > 6 months Exclusion criteria: surgery < 14 days; previous CVA/CNS disease; GI bleed < 1 year; BP > 180/100; pregnancy etc.; other contraindications to thrombolysis not explicitly described | |
| Interventions | Treatment: catheter‐directed thrombolysis with streptokinase using popliteal approach. Pulse spray given then vein assessed using contrast every 15 minutes. In 1 hour 1 million U given. Followed by low dose infusion 100,000 U/hour, assessed every 12 hours. Stopped when complete lysis achieved, no progress in 12 hours or complication occurred. Followed by anticoagulation Control: heparin IV bolus 5000 U, then adjusted continuous infusion. Warfarin begun the same evening Co treatment: none described | |
| Outcomes | 1 week: clot lysis; bleeding; mortality; PE 6 months: clot lysis; venous function | |
| Notes | Catheter‐directed thrombolysis, as distinct from systemic or loco‐regional | |
| Risk of bias | ||
| Bias | Authors' judgement | Support for judgement |
| Random sequence generation (selection bias) | Low risk | "...computer designated cards assigning patients to either groups" |
| Allocation concealment (selection bias) | Unclear risk | not mentioned |
| Blinding of participants and personnel (performance bias) | Low risk | not possible due to intervention but judged low risk as outcome assessment well described |
| Blinding of outcome assessment (detection bias) | Low risk | " ..panel unaware of the sequencing of the studies or if images were obtained at baseline, 24 ‐ 48 hours after randomisation or before discharge" |
| Incomplete outcome data (attrition bias) | Low risk | complete data available |
| Selective reporting (reporting bias) | Low risk | pre‐specified outcomes reported |
| Other bias | Low risk | none |
| Methods | Multicentre, open label, randomised controlled trial of the efficacy and safety of additional catheter‐directed thrombolysis (CDT) with alteplase Three years duration (January 2006 to January 2009) Ethical approval obtained | |
| Participants | Country: Recruited from 20 centres, 8 hospital trusts in Norway Total randomised: 189 Age: 18 to 75 years Sex: Male and female Inclusion criteria: objectively verified (diagnostic imaging) first time DVT in the upper thigh, common iliac vein, or combined iliofemoral segment, symptom duration up to 21 days Exclusion criteria: Anticoagulant treatment before trial entry (> 7 days previous), contraindications to thrombolytic treatment, indications for thrombolytic treatment, severe anaemia, thrombocytopenia, severe renal failure, sever hypertension, pregnancy or thrombosis within 7 days postpartum, less than 14 days postsurgery or post‐trauma, history of subarachnoid or intracerebral bleeding, disease with life expectancy less than 24 months, drug misuse or mental disease that could interfere with treatment and follow‐up, former ipsilateral proximal DVT, malignant disease needing chemotherapy, any thrombolytic treatment within 7 days before trial inclusion | |
| Interventions | Treatment with CDT (number randomised 90) Anticoagulation with subcutaneous LMWH (dalteparin or enoxaparin) for at least 5 days, discontinued for at least 8 hours before CDTreintroduced with warfarin 1 hour after procedure. Infusion catheter covering thrombosed segments introduced under ultrasound. 20 mg alteplase diluted 500 mL 0.9% NaCl given at 0.01 mg/kg per hr for a maximum 96 hrs. Maximum dose 20 mg/24 hrs. Unfractionated heparin given simultaneously as a continuous iv infusion, dose adjusted to keep activated partial thromboplastin time at 1.2 to 1.7 times higher than the upper normal limit. No additional antiplatelet treatment given. Use of adjunctive angioplasty and stents to establish flow and obtain less than 50% residual stenosis left to the discretion of the operator. Advised to wear knee high elastic compression stockings (class II) daily for 24 months Control (number randomised 99) Anticoagulation with subcutaneous LMWH (dalteparin or enoxaparin) and warfarin for at least 5 days, followed by warfarin alone to target intensity INR 2 to 3. Advised to wear knee high elastic compression stockings (class II) daily for 24 months | |
| Outcomes | PTS at 6 and 24 months, and 5 years measured using Villalta score and classified as PTS if score 5 or over, or if venous ulcer present Bleeding complications defined as major if clinically overt, or haemoglobin decrease of 2 g per decilitre or more, transfusion of 2 or more units of red cells or whole blood, retroperitoneal or intracranial, occurred in a critical organ or contributed to death Venous function: at 6 months and 24 months, doppler ultrasound using pneumatic cuff with patient standing, standardised compression unit, venous incompetence with reflux valve closure time > 0.5 seconds Functionally significant venous obstruction was indicated by a decline in the plethysmographic curve measured by APG (Macrola, Norway). Iliofemoral patency was defined as regained when flow in the pelvic and femoral vein and complete compressibility of the femoral vein was assessed by ultrasound; and no functional venous obstruction was indicated by APG Recurrent VTE; verified with routine imaging at local trial site Mortality at 24 months and 5 years Health related quality of life: EQ‐5D measuring mobility, self care, activity, pain and anxiety at 6 month, 24 months and 5 years VEINES QoL/Sym specific to lower limb problems, measures symptoms, limitation, psychological impact over 4 weeks and change over a year, carried out at 6 months, 24 months and 5 years. VEINES‐QOL assesses QoL and VEINES‐Sym measures symptom severity only Cost effectiveness: Markov model, examining PTS, bleeding from CDT and post DVT states, costs in US$, third party payer and lifetime horizon. One way and probabilistic sensitivity analysis in hypothetical cohort age 50. Discounted costs and utilities 3% annually. Long term cumulative incidence after 8 years 30% PTS, 88% severe PTS. QALY, costs, incremental cost‐effectiveness ratio | |
| Notes | ||
| Risk of bias | ||
| Bias | Authors' judgement | Support for judgement |
| Random sequence generation (selection bias) | Low risk | "...multi‐centre, open label, randomised controlled trial..". Random sequence generated with the website www.randomization.com |
| Allocation concealment (selection bias) | Low risk | "...sealed opaque, numbered envelopes" |
| Blinding of participants and personnel (performance bias) | Low risk | blinding of participants not possible due to the nature of the interventions, judged not to effect outcome as these very well defined |
| Blinding of outcome assessment (detection bias) | Low risk | assessors had "no knowledge of patient history or treatment" |
| Incomplete outcome data (attrition bias) | Low risk | well described. "Missing outcome data because of withdrawal of consent or death from cancer or other causes not related to CDT or anticoagulation were assumed to be missing independently of treatment and not included in the analyses" |
| Selective reporting (reporting bias) | Low risk | all outcomes reported |
| Other bias | Low risk | other bias unlikely although we note that compliance with compression stockings is slightly higher in intervention group: 63% versus 52% |
| Methods | Allocation: random Single blind Exclusions after randomisation: nil Losses to follow‐up: nil | |
| Participants | Country: USA Participants: 64 patients, 65 randomisations Age: 18 to 75 years Sex: Male and female Inclusion criteria: venographically documented DVT, in popliteal or more proximal veins < 14 days duration Exclusion criteria: major bleeding; bleeding dysfunction; stroke; head trauma < 3 months; GI/GU bleed < 4 weeks; trauma/surgery < 14 days; renal/hepatic dysfunction; therapeutic warfarin; lactation/pregnancy; low platelet count; contraindication to contrast agent | |
| Interventions | Treatment (2 groups): tPA as above plus heparin concomitantly as above Control: heparin alone 100 U/kg bolus, then 1000 U/hour Co‐treatment: warfarin begun in all groups on second day | |
| Outcomes | 36 hours: clot lysis; bleeding | |
| Notes | 2 patients were not treated according to randomisation, one receiving tPA, one receiving heparin 5 of 65 venograms not analysed. 1 patient with recurrent DVT was re‐entered ‐ 64 patients 65 randomisations | |
| Risk of bias | ||
| Bias | Authors' judgement | Support for judgement |
| Random sequence generation (selection bias) | Low risk | "randomly assigned to (groups) by opening the appropriate consecutively numbered sealed envelope according to a 2:2:1 allocation scheme. Seperate treatment assignments were generated block random number sequences" |
| Allocation concealment (selection bias) | Unclear risk | open label trial |
| Blinding of participants and personnel (performance bias) | Low risk | "both patients and investigators knew which drug regimen was being utilized" but judged low risk as outcome assessment well described |
| Blinding of outcome assessment (detection bias) | Low risk | "images compared and assessed by a vascular imaging panel that was blinded to randomization assignment and unaware of whether images were obtained at baseline, 24 to 48 hours after randomization or before discharge" |
| Incomplete outcome data (attrition bias) | Low risk | all accounted for |
| Selective reporting (reporting bias) | Low risk | all outcomes reported |
| Other bias | Low risk | none |
| Methods | Randomised controlled trial to assess efficacy and safety of rUK compared to heparin alone September 1992 to April 1994 361 screened, total randomised: 17 Allocation on 1:1 basis on morning of treatment Open labelled study Written informed consent | |
| Participants | Country: USA Sex: Male and female Inclusion criteria: DVT diagnosed by ultrasonography or venography for proximal lower extremity (popliteal,femoral, iliac veins with or without calf vein thrombosis) or MRI for upper extremity (brachial, axillary, subclavian, internal jugular veins) Exclusion criteria: stroke, intracranial disease or trauma, major chronic bleeding, major GI bleeding within one year, major urological bleeding 1 month, trauma or major surgery at non‐compressible site within 14 days, hypertension > 180/110 mm Hg, haematocrit < 25% or platelet count < 100,000/mm3, pregnancy, nursing mothers, occult blood in stool, gross haematuria | |
| Interventions | Recombinant urokinase group: 3 bolus infusions of 250,000 U in 5 mins via peripheral vein followed by continuous infusion of 750,000 U over 25 mins and 8 hours after initial dose. Final dose 24 hours after initial dose. Heparin administered 12 hours after first rUK dose for 12 hours until final rUK dose. Three hours after final rUK hep resumed to maintain activated PPT time of 60 to 80 seconds. Warfarin started the same evening to maintain INR of 2 to 3 Heparin group: initial bolus of 5000 to 10,000 U if they were not already receiving IV hep, then continuous infusion adjusted to maintain activated PPT time of 60 to 80 seconds. First dose of warfarin given within 24 hours of randomisation, target INR was 2 to 3 | |
| Outcomes | Clot lysis, venous flow, blood count and bleeding complications, fibrinogen levels | |
| Notes | 1 patient in each group had upper extremity DVT UK group had longer duration of symptoms (6 days versus 3 days) | |
| Risk of bias | ||
| Bias | Authors' judgement | Support for judgement |
| Random sequence generation (selection bias) | Unclear risk | randomisation method not described |
| Allocation concealment (selection bias) | Unclear risk | open label |
| Blinding of participants and personnel (performance bias) | Low risk | no details given but judged low risk as outcome assessment well described |
| Blinding of outcome assessment (detection bias) | Low risk | "...images compared and assessed by vascular panel blinded to randomisation assignment and time point of image" |
| Incomplete outcome data (attrition bias) | Low risk | all data reported |
| Selective reporting (reporting bias) | Low risk | all outcomes reported |
| Other bias | Low risk | none |
| Methods | Allocation: random Single blind Exclusions after randomisation: 2 | |
| Participants | Country: UK Participants: 30 Age: 18 to 77 years Sex: Male and female Inclusion criteria: venographically confirmed DVT of leg duration < 4 days Exclusion criteria: surgery < 3 days; unhealed wound; peptic ulcer; diastolic BP > 100 mmHg | |
| Interventions | Treatment: (2 groups) streptokinase 500,000 U IV over 30 minutes, 900,000 U every 6 hours for 5 days or (Arwin) 80 U in 6 hours, then 80 units in 15 minutes, then 40 ‐ 80 U every 6 hours for 5 days Control: heparin 10,000 U over 5 minutes, then 10,000 to 15,000 U every 6 hours for 5 days Co‐treatment: oral anticoagulation commenced at end of infusions. Bed rest, leg elevation, bandages to all groups | |
| Outcomes | 1 month: mortality; PE; clot lysis; bleeding 6 to 12 months: clot lysis after partial lysis | |
| Notes | 1 excluded as died of PE in heparin group. 1 excluded due to bleeding in streptokinase group Included 7 patients with tibial vein thrombosis only (4 heparin, 2 streptokinase, 1 Arwin) | |
| Risk of bias | ||
| Bias | Authors' judgement | Support for judgement |
| Random sequence generation (selection bias) | Unclear risk | description not clear |
| Allocation concealment (selection bias) | Unclear risk | description not clear |
| Blinding of participants and personnel (performance bias) | High risk | not described |
| Blinding of outcome assessment (detection bias) | High risk | not described |
| Incomplete outcome data (attrition bias) | Low risk | no missing data |
| Selective reporting (reporting bias) | Low risk | all outcomes reported |
| Other bias | Low risk | none |
| Methods | Allocation: random Double blind Exclusions after randomisation: 1 Losses to follow‐up: nil | |
| Participants | Country: Denmark Participants: 20 Age: 17 to 79 years Sex: Male and female Inclusion criteria: venographically confirmed DVT duration < 72 hours Exclusion criteria: not described | |
| Interventions | Treatment: urokinase 200,000 U IV over 24 hours. After 18 hours, heparin loading dose of 15,000 units then 40,000 U/day for 5 days Control: heparin 40,000 U/day IV for 6 days Co‐treatment: not described | |
| Outcomes | 6 days: clot lysis; bleeding 2 weeks: mortality | |
| Notes | 1 excluded from heparin group due to bleeding. Low dose urokinase. Did not specify whether calf vein thrombosis was included | |
| Risk of bias | ||
| Bias | Authors' judgement | Support for judgement |
| Random sequence generation (selection bias) | Unclear risk | "randomly separated" but no further details given |
| Allocation concealment (selection bias) | Unclear risk | "allocation of the patients ... was performed by one of the participants" no further details given |
| Blinding of participants and personnel (performance bias) | Low risk | "mixture of liquids to be infused was performed by one of the participants" |
| Blinding of outcome assessment (detection bias) | Low risk | "clinical evaluation and interpretation of phlebograms were preformed in a double‐blind fashion" |
| Incomplete outcome data (attrition bias) | Low risk | exclusions explained |
| Selective reporting (reporting bias) | Low risk | all outcomes reported |
| Other bias | Low risk | none |
| Methods | Randomised controlled trial, single blind, "..to provide evidence that lytic agents are more effective than heparin in dissolving venous thrombi" Declaration of Helsinki, written and verbal explanation of procedures and risks of study, written and informed consent | |
| Participants | Country: USA Age over 18 years mean age in hep 50.2 and strep 54.7 years Mean symptom duration in heparin group was 6.2 days and 8.5 days for the strep group Patients were included in study if 'no evidence of hemorrhagic tendency, active gastrointestinal or genitourinary bleeding, severe system hypertension, atrial fibrillation, pregnancy, 10 days post partum, surgery, hepatic or renal biopsy, translumbar aortography. Four patients in strep group had tumours, three had obstructed venous return in veins which contained thrombus. Two patients (one each heparin and strep), had thrombosis of upper extremity | |
| Interventions | All patients iv bolus injection of 100 mg hydrocortisone prior to start of strep or hep Treatment: strep was administered as a priming dose of 250,000 U in 20 minute, followed by a maintenance infusion of 100,000 U/hour for 72 hours Control: heparin was administered as an initial iv dose of 150 U/kg of body weight over 5 minutes followed by a 72 hour infusion at a rate which prolonged the PTT to 60 to 100 seconds After 72 hours of treatment both groups received continuous or intermittent iv heparin according to guidelines. A maintenance dose of warfarin (coumadin) was administered on day seven and heparin was discontinued when the prothrombin time was prolonged to 1.5 to 2.5 times the control value. Warfarin was continued for three months or longer at physicians discretion | |
| Outcomes | Venography (pre‐treatment and five days post treatment), haemostasis, complications | |
| Notes | Three patients were added in a non‐randomised fashion to the streptokinase group. Mean age 56 years and symptom duration 8.7 days. These patients were added as three patients from the randomised group did not have follow‐up venograms | |
| Risk of bias | ||
| Bias | Authors' judgement | Support for judgement |
| Random sequence generation (selection bias) | Unclear risk | "..after entry patients were randomly allocated to either the heparin or the streptokinase group..." but it is not clear by which method this was done |
| Allocation concealment (selection bias) | Unclear risk | no information given |
| Blinding of participants and personnel (performance bias) | Low risk | no attempt to blind described but this judged low risk to be consistent with risk of bias assessing of other studies |
| Blinding of outcome assessment (detection bias) | Unclear risk | for assessment of venography "films were interpreted independently (by two authors)...without knowing the drug administered or whether the study was before or after treatment". For bleeding no clear definition for grading or assessment are given |
| Incomplete outcome data (attrition bias) | High risk | although possible to separate the non‐randomised data for venography, it is not possible to do so for bleeding outcomes |
| Selective reporting (reporting bias) | High risk | not possible to determine which results from randomised patients for all outcomes |
| Other bias | High risk | three non‐randomised patients added to study post‐randomisation |
| Methods | Allocation: random Single blind Exclusions after randomisation: 2 Losses to follow‐up: nil | |
| Participants | Country: Sweden Participants: 38 Age: 26 to 74 years Sex: Male and female Inclusion criteria: venographically confirmed calf vein thrombosis Exclusion criteria: previous thrombosis same leg; contraindication to thrombolysis | |
| Interventions | Treatment: streptokinase 50,000 IU IV over 15 minutes then 100,000 IU over 12 hours for up to 7 days, titrated. Given with 5000 IU heparin IV over 12 hours. Warfarin begun after streptokinase ended Control: heparin 5000 IU IV bolus then 30,000 IU per day, titrated for 7 days. Warfarin begun simultaneously Co‐treatment: paracetamol, hydrocortisone or moduretic if necessary. 24 hours bed rest. Warfarin given for 5 to 6 months. Leg elevation. Elastic bandages. Elastic stockings where swelling or venous insufficiency detected at discharge or follow‐up | |
| Outcomes | 1 week: bleeding; clot lysis (venographic score); mortality; stroke; PE 1 month: clot lysis 1 year: clot lysis Up to 5 years: post‐thrombotic syndrome; foot volumetry | |
| Notes | Low dose streptokinase. 2 patients excluded after randomisation, as they had previous thromboses | |
| Risk of bias | ||
| Bias | Authors' judgement | Support for judgement |
| Random sequence generation (selection bias) | Unclear risk | "randomised, prospective study" but no further details given |
| Allocation concealment (selection bias) | Low risk | "allocated using sealed envelopes" |
| Blinding of participants and personnel (performance bias) | Low risk | not possible due to the nature of the interventions but judged low risk as outcome assessment well described |
| Blinding of outcome assessment (detection bias) | Low risk | "..venograms were evaluated blindly in retrospect by one and the same radiologist" |
| Incomplete outcome data (attrition bias) | Low risk | no missing data |
| Selective reporting (reporting bias) | Low risk | all outcomes reported |
| Other bias | Low risk | none |
| Methods | Allocation: random Single blind Exclusions after randomisation: 2 Losses to follow‐up: 1 | |
| Participants | Country: Germany Participants: 69 Age: 22 to 58 years Sex: Male and female Inclusion criteria: venographically confirmed DVT of leg duration < 7 days Exclusion criteria: PE; calf vein thrombosis; recurrent DVT; GI/GU bleed; inflammatory bowel disease; acute pancreatitis; surgery within 4 weeks; IM injection within 10 days; hypertensive retinopathy grade 3 or 4; intracerebral disease; cerebral surgery or trauma within 3 months; malignancy not in remission; diabetic retinopathy stage 3 or 4; renal or hepatic failure; bleeding dysfunction; pregnancy, lactation, delivery within 20 days | |
| Interventions | Treatment: (2 groups) tPA 20 mg IV into pedal vein over 4 hours each day for 7 days. Heparin IV given concomitantly, with adjustment Urokinase 100,000 IU/hr IV into pedal vein continuously for 7 days. Heparin IV for 7 days. Plasminogen monitored Warfarin from day 7 to 12 months Control: heparin IV, adjusted for 7 days Co‐treatment: bed rest and compression treatment. Warfarin from day 7‐ 12 months in treatment groups. Warfarin begun immediately, for 12 months in control group. Compression for 12 months for all patients | |
| Outcomes | 7 days: bleeding; clot lysis (no results for control group) 1 year: post‐thrombotic syndrome | |
| Notes | Loco‐regional thrombolysis. 2 patients excluded due to bleeding, 1 tPA, 1 urokinase. 1 lost to follow‐up from control group | |
| Risk of bias | ||
| Bias | Authors' judgement | Support for judgement |
| Random sequence generation (selection bias) | Low risk | "...designed by a biometrician who was not involved in the study" |
| Allocation concealment (selection bias) | Unclear risk | no details |
| Blinding of participants and personnel (performance bias) | Low risk | not described but judged unlikely to influence outcome assessment as well described |
| Blinding of outcome assessment (detection bias) | Low risk | "...evaluated by an independent radiologist who was unaware of the treatment the patients had received" |
| Incomplete outcome data (attrition bias) | Low risk | no missing data |
| Selective reporting (reporting bias) | Low risk | all outcomes reported |
| Other bias | Low risk | none |
| Methods | Allocation: random Single blind Exclusions after randomisation: nil Losses to follow‐up: 12 | |
| Participants | Country: Germany Participants: 250 Age: mean 40 years Sex: Male and female Inclusion criteria: thrombosis of popliteal or more proximal veins confirmed by venogram at more than one level duration < 9 days Exclusion criteria: no PE; recurrent DVT; calf vein thrombosis only; GI/GU bleeding; inflammatory bowel disease < 12 months; acute pancreatitis; surgery or head trauma < 3 months; IM injection < 10 days; hypertension; diabetic retinopathy stage 3 ‐ 4; malignancy; renal or hepatic failure; bleeding dysfunction; pregnancy, lactation, delivery within 20 days | |
| Interventions | Treatment: (4 groups) local tPA 20 mg/day, over 4 hours via pedal vein for 4 to 7 days. IV heparin given simultaneously at 1000 IU/hour, adjusted Local urokinase 100,000 IU/day infused continuously. Fibrinogen and plasminogen monitored. Heparin IV given concomitantly Systemic streptokinase 3,000,000 U/day over 6 hours in conjunction with heparin for up to 7 days. Premedication: hydrocortisone 100 mg, ranitidine 50 mg, clemastine 2 mg Systemic urokinase 5,000,000 IU/day over 4 hours for up to 7 days. IV heparin given concomitantly Control: heparin IV, adjusted Co‐treatment: bedrest, compression bandages, warfarin and compression treatment continued for 12 months | |
| Outcomes | 7 days: PE; major bleeding; mortality; clot lysis 1 year: clot lysis | |
| Notes | 4 losses to follow‐up in systemic urokinase, systemic streptokinase and control groups | |
| Risk of bias | ||
| Bias | Authors' judgement | Support for judgement |
| Random sequence generation (selection bias) | Unclear risk | "patients were randomly assigned" no further details given |
| Allocation concealment (selection bias) | Unclear risk | no details given |
| Blinding of participants and personnel (performance bias) | Low risk | not described but judged low as outcome assessment well described |
| Blinding of outcome assessment (detection bias) | Low risk | "..one dedicated radiologist, blinded to the patient' treatment regimens, evaluated the venograms, while another assessed the sonographic data" |
| Incomplete outcome data (attrition bias) | Low risk | no missing data |
| Selective reporting (reporting bias) | Low risk | all outcomes reported |
| Other bias | Low risk | none |
| Methods | Allocation: random Not blind Exclusions after randomisation: nil Losses to follow‐up: nil | |
| Participants | Country: USA Participants: 34 Age: mean 57 years Sex: Male and female Inclusion criteria: DVT confirmed by venogram Exclusion criteria: diastolic BP > 120 mmHg; peptic ulceration; bleeding dysfunction; allergic condition; surgery < 7 days; recent streptococcal infection; streptokinase given < 6 months | |
| Interventions | Treatment: titrated dose of streptokinase IV into ankle vein 100 mg hydrocortisone IV prior to therapy and daily for 5 days. Streptokinase 100,000 U/hr maintained and adjusted up to 72 hours. IV heparin for 1 week 6 to 12 hours after streptokinase Control: heparin IV into affected limb, 7000 U bolus then 1500 U/hr adjusted. Continued for 7 days after 48 hours of treatment Co‐treatment: bed rest, elevation of leg. Warfarin 2 days before end of therapy, continued for 4 weeks | |
| Outcomes | 7 days: clot lysis | |
| Notes | Loco‐regional administration of streptokinase and heparin Calf vein thrombosis included, number not specified, equal in both groups | |
| Risk of bias | ||
| Bias | Authors' judgement | Support for judgement |
| Random sequence generation (selection bias) | Low risk | "based on a list of random numbers" |
| Allocation concealment (selection bias) | Unclear risk | "arranged by using sealed envelopes" |
| Blinding of participants and personnel (performance bias) | Unclear risk | not described |
| Blinding of outcome assessment (detection bias) | High risk | not described |
| Incomplete outcome data (attrition bias) | Low risk | no missing data |
| Selective reporting (reporting bias) | Low risk | all outcomes reported |
| Other bias | Low risk | none |
| Methods | Allocation: random Double blind Exclusions after randomisation: nil Losses to follow‐up: 37 | |
| Participants | Country: Canada Participants: 83 Age: < 75 years Sex: not described Inclusion criteria: venographically confirmed proximal DVT of lower limb Exclusion criteria: bleeding dysfunction; active bleeding; peptic ulcer; stroke or intracranial process < 2 months; surgery, trauma, childbirth, biopsy, vessel puncture < 7 days | |
| Interventions | Treatment: IV heparin 5000 U bolus then 30,000 U/24 hours, adjusted for 7 ‐ 10 days Control: identical placebo to tPA depending on phase, plus heparin as above Co‐treatment: warfarin commenced for 3 months | |
| Outcomes | 24 ‐ 48 hours: clot lysis; bleeding 3 years: post‐thrombotic syndrome | |
| Notes | 22 died, 15 "not available" for intermediate to late follow‐up | |
| Risk of bias | ||
| Bias | Authors' judgement | Support for judgement |
| Random sequence generation (selection bias) | Unclear risk | "randomly allocated" no further details |
| Allocation concealment (selection bias) | Unclear risk | not described clearly |
| Blinding of participants and personnel (performance bias) | Low risk | "identical appearing placebo" |
| Blinding of outcome assessment (detection bias) | Low risk | "venograms interpreted by an independent panel without knowledge of the clinical findings or the treatment group" |
| Incomplete outcome data (attrition bias) | Low risk | all reported |
| Selective reporting (reporting bias) | Low risk | all reported |
| Other bias | Low risk | none |
| Methods | Prospective study to compare efficacy and safety of low dose, slow infusion thrombolysis Randomised | |
| Participants | Country: Turkey Age: 18 to 70 years Number: 97, 50 low dose strep, 47 hep June 1995 to May 1999 Informed consent Baseline characteristics similar Inclusion criteria: DVT confirmed with high resolution colour duplex Exclusion criteria: history of stroke, intracranial haemorrhage, major GI, urological ir genital haemorrhage, major trauma or surgery within 20 days, hypertension, known bleeding diathesis, post partum, nursing or pregnant women | |
| Interventions | Strepokinase group: Methylprednisone 250 mg IV with IV antihistaminic prior to 250,000 U given in 30 mins via forearm vein, then infusion of 100,000 U/hour. Infusion stopped when a dose of 1,500,000 U. Then heparin according to prothrombin and partial thromboplastin times and duplex study done. Urokinase administered in 2 patients who had severe allergic reaction to strep ‐ bolus of 100,000 U then infusion of 100,000 U per hour for a total dose of either 1,500,000 or 3,000,000 U Heparin group: bolus of 5000 U, then infusion of 1‐1500 U/hr. Dose adjusted according to the activated partial thromboplastin time Both groups: bed rest and elevation, coumadin started 48 hours later according to prothrombin times, INR of 2 ‐ 3 | |
| Outcomes | Venous flow, clinical assessment, haemorrhagic complications, allergic reaction | |
| Notes | Recurrent DVT included (30% each group) | |
| Risk of bias | ||
| Bias | Authors' judgement | Support for judgement |
| Random sequence generation (selection bias) | Low risk | "randomised number table" |
| Allocation concealment (selection bias) | Unclear risk | not mentioned |
| Blinding of participants and personnel (performance bias) | Low risk | not possible but judged low risk as outcome assessment well described |
| Blinding of outcome assessment (detection bias) | Low risk | "...initial and post‐treatment duplex studies preformed by same radiologist unaware of groups.." |
| Incomplete outcome data (attrition bias) | Low risk | all accounted for |
| Selective reporting (reporting bias) | Low risk | all outcomes reported |
| Other bias | Low risk | none |
| Methods | Allocation: random Double blind Exclusions after randomisation: nil Losses to follow‐up: nil | |
| Participants | Country: France, Belgium, Switzerland Participants: 21 (in randomised phase only) Age: 22 to 74 years Sex: Male and female Inclusion criteria: hospitalised patients with DVT of popliteal or more proximal veins of the lower leg, confirmed by venography Exclusion criteria: pregnancy; major surgery < 72 hours; stroke < 6 months; head trauma < 1 month; diastolic BP > 120 mmHg; renal/hepatic disease; peptic ulcer; bleeding dysfunction; contraindication to heparin | |
| Interventions | Treatment: (2 groups) IV tPA 100 mg on day 1, 50 mg tPA on day 2. 10% of dose given as bolus IV tPA 50 mg on day 1, repeated on day 2. 10% of dose given as bolus Control: identical placebo infusion as above Co‐treatment: heparin 5000 U IV bolus then continuous infusion of 1000 U per hour for up to 72 hours | |
| Outcomes | 72 hours: clot lysis; bleeding | |
| Notes | Included initial open label phase in some results (11 additional patients) | |
| Risk of bias | ||
| Bias | Authors' judgement | Support for judgement |
| Random sequence generation (selection bias) | Unclear risk | "randomly allotted" not described further |
| Allocation concealment (selection bias) | Unclear risk | not clearly described |
| Blinding of participants and personnel (performance bias) | Low risk | "double‐blind" |
| Blinding of outcome assessment (detection bias) | Low risk | "Two radiologists interpreted all films without knowing the drug administered or whether the venography was before or after trial treatment" |
| Incomplete outcome data (attrition bias) | Low risk | "no protocol violations" |
| Selective reporting (reporting bias) | Low risk | all outcomes reported |
| Other bias | Low risk | none |
BP: blood pressure
CDT: catheter‐directed thrombolysis
CNS: central nervous system
CVA: cerebrovascular accident
DVT: deep vein thrombosis
GI: gastrointestinal
GU: genitourinary
hep: heparin
Hg: mercury
IM: intramuscular
IU: international unit
PE: pulmonary embolism
strep: streptokinase
TB: tuberculosis
tPA: tissue plasminogen activator
U: unit
Characteristics of excluded studies [ordered by study ID]
Jump to:
| Study | Reason for exclusion |
| Insufficient information despite contacting author | |
| Not randomised | |
| DVT not confirmed objectively | |
| Not randomised | |
| Thrombectomy not thrombolysis | |
| Not CDT versus anticoagulant | |
| Not truly randomised | |
| Both groups received thrombolysis | |
| Not truly randomised | |
| Included patients with DVT 0 ‐ 8 weeks, not clear if randomised, CDT in addition to thrombectomy | |
| Insufficient information, unable to contact author | |
| No thrombolytic | |
| Not truly randomised | |
| Prospective observational clinical study in children only | |
| Insufficient information, unable to contact author | |
| Control group not randomised | |
| Included patients with symptoms for more than 21 days | |
| Compares thrombolytics, not CDT versus anticoagulant | |
| Ancrod used as control | |
| All patients received streptokinase | |
| Only 33 out of 90 patients received thrombolysis | |
| CDT verses CDT plus angioplasty | |
| Both groups received thrombolysis |
DVT: deep vein thrombosis
Characteristics of ongoing studies [ordered by study ID]
Jump to:
| Trial name or title | Traditional medical treatment versus interventional approach in acute iliofemoral vein thrombosis |
| Methods | Single centre randomised controlled clinical trial comparing the effect of conventional therapy (heparin followed by warfarin) with interventional therapy (thrombolysis with or without angioplasty and stenting) on venous patency in patients admitted with acute iliofemoral DVT to Tehran Heart Center emergency department |
| Participants | Patients with acute extensive iliofemoral venous thrombosis |
| Interventions | Intervention: lytic therapy will be achieved by placing a catheter in the contralateral femoral vein, the right internal jugular vein, or the ipsilateral popliteal vein for direct intra‐clot infusion. Streptokinase will be given as a loading dose of 250,000 units followed by infusion of 100,000 units per hour for 24 to 48 hours. Heparin will be administered concomitantly with the lytic therapy and continued until therapeutic anticoagulation with warfarin will be accomplished. After lytic therapy, further intervention (PTA/stenting) will be performed if there is an underlying venous stenosis of 50% or more. Stent placement will be done with appropriate selected stents (self‐expanding stainless steel wall stents). All stented patients will be given warfarin indefinitely (INR 2 – 3). Lysis will be considered complete if there is less than 5% residual thrombus Control: conventional treatment will consist of intravenous heparin followed by warfarin. All patients will be treated with limb elevation and moist heat during their initial admission and maintained on prescription gradient compression stockings |
| Outcomes | Venous patency and symptom changes |
| Starting date | August 2011 |
| Contact information | Dr Yaser Jenab Tehran Heart Center [email protected] |
| Notes | http://www.irct.ir/searchresult.php?keyword=&id=5625&number=3&prt=2274&total=10&m=1 (accessed 29/02/2016) |
| Trial name or title | Acute Venous Thrombosis: Thrombus removal with adjunctive catheter‐directed thrombolysis (ATTRACT) |
| Methods | Optimal standard DVT therapy to standard plus CDT |
| Participants | Age 16 to 75 years old with symptomatic proximal DVT involving iliac, common femoral and or femoral vein |
| Interventions | Recombinant tissue plasminogen activator (rt‐PA) |
| Outcomes | Incidence of post‐thrombotic syndrome 24 months after intervention; major bleeding |
| Starting date | November 2009 |
| Contact information | Patty M Nieters [email protected] |
| Notes | NCT00790335 |
| Trial name or title | DUTCH CAVA‐trial: CAtheter Versus Anticoagulation Alone for Acute Primary (Ilio)Femoral DVT. (NL28394) |
| Methods | Study design: prospective, non blinded, randomised, controlled, multicentre, intervention study. To assess whether catheter directed thrombolytic therapy for the treatment of IFDVT can safely and effectively reduce post thrombotic morbidity after one year. The secondary objective is to study whether catheter directed thrombolytic intervention has a positive effect on the quality of life of patients with IFDVT and to assess late PTS |
| Participants | The study population includes all consecutive patients with IFDVT presenting at the emergency or outpatient departments of the participating centres. The thrombus should not be older than 14 days at randomisation |
| Interventions | After randomisation patients will be allocated to either conservative anticoagulant treatment or to catheter directed thrombolysis combined with conservative anticoagulant treatment |
| Outcomes | The primary efficacy outcome is the incidence of PTS at one year; a decline in PTS incidence from 25% to 8% is anticipated. The secondary outcome is the Health related Quality of life and late PTS during follow‐up. The principal safety outcome is major bleeding during anticoagulant therapy. Bleeding as well as events of recurrent thrombosis will be monitored. The patency of the venous system of the affected lower limb will be assessed as well as the percentage of clot lysis, after thrombolytic intervention. Additionally, measurements of markers of coagulation and inflammation will be performed during follow‐up |
| Starting date | May 2010 |
| Contact information | Rob Strijkers, MD |
| Notes | NCT00970619 |
CDT: catheter‐directed thrombolysis
DVT: deep vein thrombosis
IFDVT: ileofemoral deep vein thrombosis
INR: international normalised ratio
PTA: percutaneous transluminal angioplasty
PTS: post‐thrombotic syndrome
Data and analyses
| Outcome or subgroup title | No. of studies | No. of participants | Statistical method | Effect size |
| 1 Any improvement in venous patency (early) Show forest plot | 9 | 421 | Risk Ratio (M‐H, Random, 95% CI) | 2.48 [1.35, 4.57] |
| Analysis 1.1  Comparison 1 Any thrombolysis versus control, Outcome 1 Any improvement in venous patency (early). | ||||
| 2 Complete clot lysis (early) Show forest plot | 8 | 592 | Risk Ratio (M‐H, Random, 95% CI) | 4.91 [1.66, 14.53] |
| Analysis 1.2  Comparison 1 Any thrombolysis versus control, Outcome 2 Complete clot lysis (early). | ||||
| 3 Bleeding (early) Show forest plot | 17 | 1103 | Risk Ratio (M‐H, Fixed, 95% CI) | 2.23 [1.41, 3.52] |
| Analysis 1.3 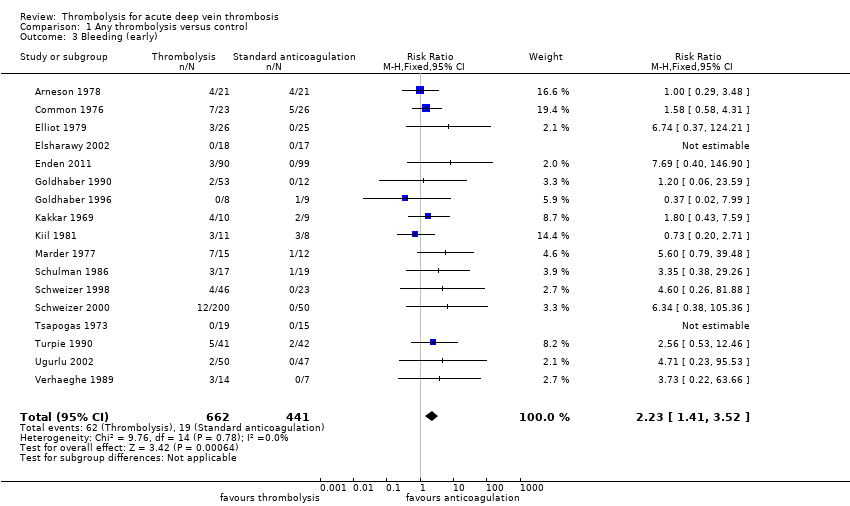 Comparison 1 Any thrombolysis versus control, Outcome 3 Bleeding (early). | ||||
| 4 Stroke/intracerebral haemorrhage (early) Show forest plot | 17 | 1103 | Risk Ratio (M‐H, Fixed, 95% CI) | 1.92 [0.34, 10.86] |
| Analysis 1.4  Comparison 1 Any thrombolysis versus control, Outcome 4 Stroke/intracerebral haemorrhage (early). | ||||
| 5 Mortality (early) Show forest plot | 9 | 529 | Risk Ratio (M‐H, Fixed, 95% CI) | 0.76 [0.31, 1.89] |
| Analysis 1.5 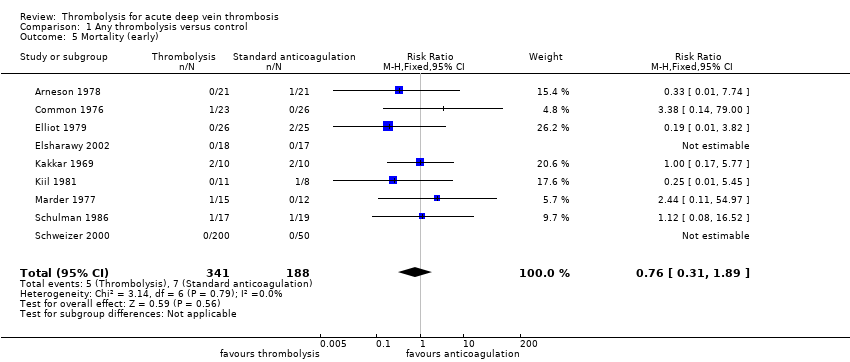 Comparison 1 Any thrombolysis versus control, Outcome 5 Mortality (early). | ||||
| 6 Pulmonary embolism (early) Show forest plot | 6 | 433 | Risk Ratio (M‐H, Fixed, 95% CI) | 1.00 [0.33, 3.05] |
| Analysis 1.6 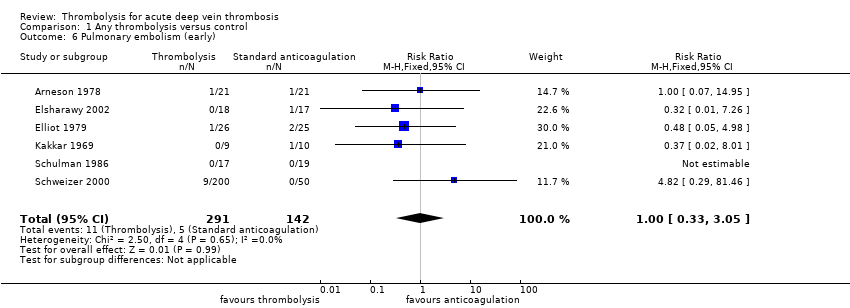 Comparison 1 Any thrombolysis versus control, Outcome 6 Pulmonary embolism (early). | ||||
| 7 Post‐thrombotic syndrome (intermediate) Show forest plot | 3 | 306 | Risk Ratio (M‐H, Fixed, 95% CI) | 0.66 [0.53, 0.81] |
| Analysis 1.7  Comparison 1 Any thrombolysis versus control, Outcome 7 Post‐thrombotic syndrome (intermediate). | ||||
| 8 Post‐thrombotic syndrome (late) Show forest plot | 2 | 211 | Risk Ratio (M‐H, Fixed, 95% CI) | 0.58 [0.45, 0.77] |
| Analysis 1.8  Comparison 1 Any thrombolysis versus control, Outcome 8 Post‐thrombotic syndrome (late). | ||||
| 9 Leg ulceration (intermediate) Show forest plot | 4 | 342 | Risk Ratio (M‐H, Fixed, 95% CI) | 0.87 [0.16, 4.73] |
| Analysis 1.9 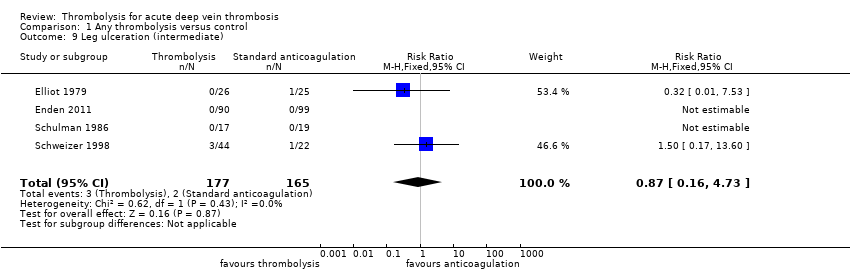 Comparison 1 Any thrombolysis versus control, Outcome 9 Leg ulceration (intermediate). | ||||
| 10 Leg ulceration (late) Show forest plot | 1 | Risk Ratio (M‐H, Fixed, 95% CI) | Totals not selected | |
| Analysis 1.10 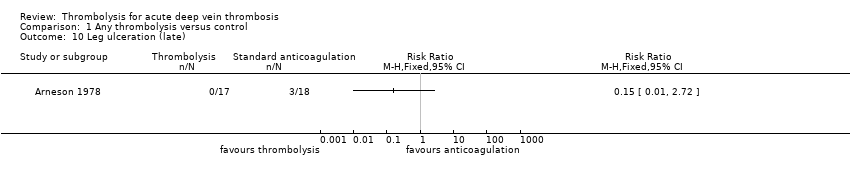 Comparison 1 Any thrombolysis versus control, Outcome 10 Leg ulceration (late). | ||||
| 11 Complete clot lysis (intermediate) Show forest plot | 7 | 630 | Risk Ratio (M‐H, Random, 95% CI) | 2.44 [1.40, 4.27] |
| Analysis 1.11 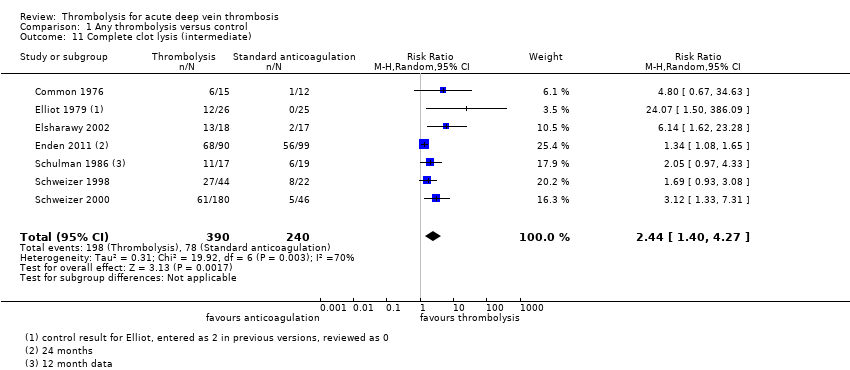 Comparison 1 Any thrombolysis versus control, Outcome 11 Complete clot lysis (intermediate). | ||||
| 12 Complete clot lysis (late) Show forest plot | 2 | 206 | Risk Ratio (M‐H, Random, 95% CI) | 3.25 [0.17, 62.63] |
| Analysis 1.12  Comparison 1 Any thrombolysis versus control, Outcome 12 Complete clot lysis (late). | ||||
| 13 Mortality (intermediate) Show forest plot | 2 | 289 | Risk Ratio (M‐H, Fixed, 95% CI) | 0.96 [0.27, 3.43] |
| Analysis 1.13  Comparison 1 Any thrombolysis versus control, Outcome 13 Mortality (intermediate). | ||||
| 14 Mortality (late) Show forest plot | 2 | 230 | Risk Ratio (M‐H, Fixed, 95% CI) | 0.61 [0.25, 1.50] |
| Analysis 1.14  Comparison 1 Any thrombolysis versus control, Outcome 14 Mortality (late). | ||||
| 15 Normal venous function (intermediate) Show forest plot | 3 | 255 | Risk Ratio (M‐H, Random, 95% CI) | 2.18 [0.86, 5.54] |
| Analysis 1.15  Comparison 1 Any thrombolysis versus control, Outcome 15 Normal venous function (intermediate). | ||||
| 16 Recurrent DVT (intermediate) Show forest plot | 1 | Risk Ratio (M‐H, Fixed, 95% CI) | Totals not selected | |
| Analysis 1.16 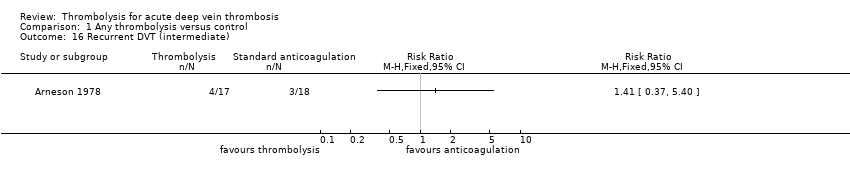 Comparison 1 Any thrombolysis versus control, Outcome 16 Recurrent DVT (intermediate). | ||||
| Outcome or subgroup title | No. of studies | No. of participants | Statistical method | Effect size |
| 1 Any improvement in venous patency (early) Show forest plot | 8 | 386 | Risk Ratio (M‐H, Random, 95% CI) | 2.18 [1.28, 3.70] |
| Analysis 2.1 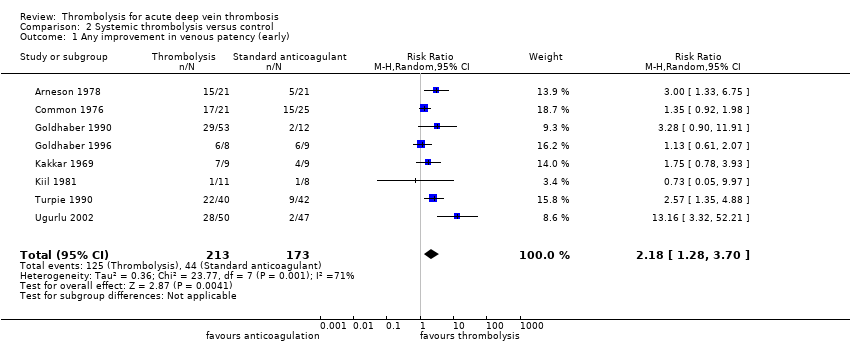 Comparison 2 Systemic thrombolysis versus control, Outcome 1 Any improvement in venous patency (early). | ||||
| 2 Complete clot lysis (early) Show forest plot | 7 | 457 | Risk Ratio (M‐H, Random, 95% CI) | 4.37 [1.40, 13.61] |
| Analysis 2.2  Comparison 2 Systemic thrombolysis versus control, Outcome 2 Complete clot lysis (early). | ||||
| 3 Bleeding (early) Show forest plot | 15 | 779 | Risk Ratio (M‐H, Fixed, 95% CI) | 2.18 [1.37, 3.47] |
| Analysis 2.3  Comparison 2 Systemic thrombolysis versus control, Outcome 3 Bleeding (early). | ||||
| 4 Stroke/intracerebral haemorrhage (early) Show forest plot | 15 | 779 | Risk Ratio (M‐H, Fixed, 95% CI) | 1.92 [0.34, 10.86] |
| Analysis 2.4  Comparison 2 Systemic thrombolysis versus control, Outcome 4 Stroke/intracerebral haemorrhage (early). | ||||
| 5 Mortality (early) Show forest plot | 8 | 394 | Risk Ratio (M‐H, Fixed, 95% CI) | 0.76 [0.31, 1.89] |
| Analysis 2.5 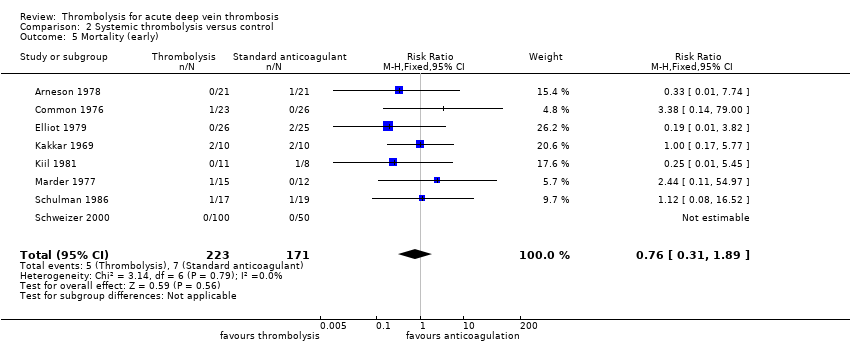 Comparison 2 Systemic thrombolysis versus control, Outcome 5 Mortality (early). | ||||
| 6 Pulmonary embolism (early) Show forest plot | 5 | 298 | Risk Ratio (M‐H, Fixed, 95% CI) | 1.73 [0.55, 5.40] |
| Analysis 2.6  Comparison 2 Systemic thrombolysis versus control, Outcome 6 Pulmonary embolism (early). | ||||
| 7 Post‐thrombotic syndrome (intermediate) Show forest plot | 2 | 117 | Risk Ratio (M‐H, Random, 95% CI) | 0.56 [0.30, 1.03] |
| Analysis 2.7  Comparison 2 Systemic thrombolysis versus control, Outcome 7 Post‐thrombotic syndrome (intermediate). | ||||
| 8 Post‐thrombotic syndrome (late) Show forest plot | 1 | Risk Ratio (M‐H, Fixed, 95% CI) | Totals not selected | |
| Analysis 2.8  Comparison 2 Systemic thrombolysis versus control, Outcome 8 Post‐thrombotic syndrome (late). | ||||
| 9 Leg ulceration (intermediate) Show forest plot | 3 | 153 | Risk Ratio (M‐H, Fixed, 95% CI) | 0.87 [0.16, 4.73] |
| Analysis 2.9  Comparison 2 Systemic thrombolysis versus control, Outcome 9 Leg ulceration (intermediate). | ||||
| 10 Leg ulceration (late) Show forest plot | 1 | Risk Ratio (M‐H, Fixed, 95% CI) | Totals not selected | |
| Analysis 2.10 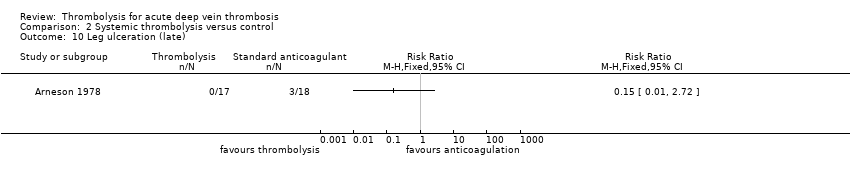 Comparison 2 Systemic thrombolysis versus control, Outcome 10 Leg ulceration (late). | ||||
| 11 Complete clot lysis (intermediate) Show forest plot | 5 | 300 | Risk Ratio (M‐H, Random, 95% CI) | 2.59 [1.27, 5.28] |
| Analysis 2.11 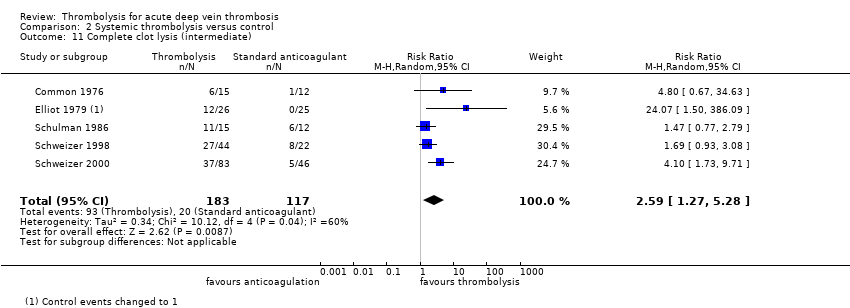 Comparison 2 Systemic thrombolysis versus control, Outcome 11 Complete clot lysis (intermediate). | ||||
| 12 Complete clot lysis (late) Show forest plot | 1 | Risk Ratio (M‐H, Fixed, 95% CI) | Totals not selected | |
| Analysis 2.12 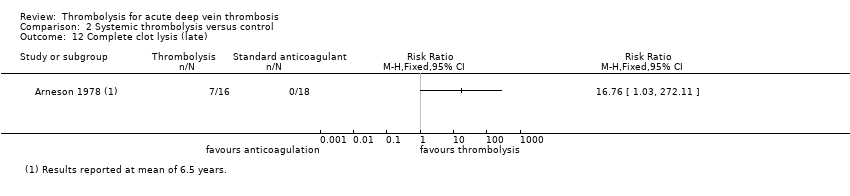 Comparison 2 Systemic thrombolysis versus control, Outcome 12 Complete clot lysis (late). | ||||
| 13 Mortality (intermediate) Show forest plot | 2 | 189 | Risk Ratio (M‐H, Fixed, 95% CI) | 0.96 [0.27, 3.43] |
| Analysis 2.13 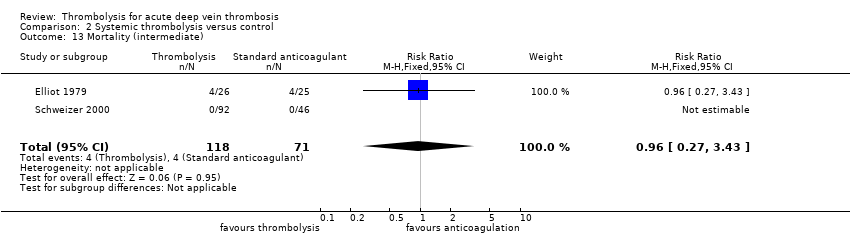 Comparison 2 Systemic thrombolysis versus control, Outcome 13 Mortality (intermediate). | ||||
| 14 Mortality (late) Show forest plot | 1 | Risk Ratio (M‐H, Fixed, 95% CI) | Totals not selected | |
| Analysis 2.14  Comparison 2 Systemic thrombolysis versus control, Outcome 14 Mortality (late). | ||||
| 15 Normal venous function (intermediate) Show forest plot | 1 | Risk Ratio (M‐H, Fixed, 95% CI) | Totals not selected | |
| Analysis 2.15  Comparison 2 Systemic thrombolysis versus control, Outcome 15 Normal venous function (intermediate). | ||||
| 16 Recurrent DVT (late) Show forest plot | 1 | Risk Ratio (M‐H, Fixed, 95% CI) | Totals not selected | |
| Analysis 2.16  Comparison 2 Systemic thrombolysis versus control, Outcome 16 Recurrent DVT (late). | ||||
| Outcome or subgroup title | No. of studies | No. of participants | Statistical method | Effect size |
| 1 Complete clot lysis (early) Show forest plot | 1 | Risk Ratio (M‐H, Fixed, 95% CI) | Totals not selected | |
| Analysis 3.1 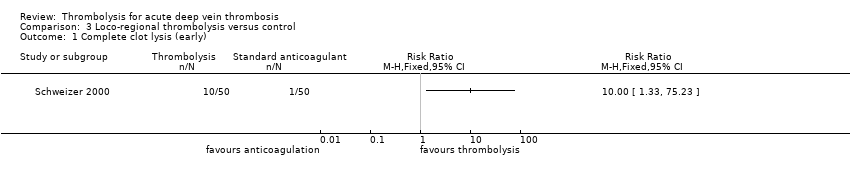 Comparison 3 Loco‐regional thrombolysis versus control, Outcome 1 Complete clot lysis (early). | ||||
| 2 Bleeding (early) Show forest plot | 2 | 146 | Risk Ratio (M‐H, Fixed, 95% CI) | 4.0 [0.46, 34.75] |
| Analysis 3.2  Comparison 3 Loco‐regional thrombolysis versus control, Outcome 2 Bleeding (early). | ||||
| 3 Stroke/intracerebral haemorrhage (early) Show forest plot | 2 | 146 | Risk Ratio (M‐H, Fixed, 95% CI) | 0.0 [0.0, 0.0] |
| Analysis 3.3  Comparison 3 Loco‐regional thrombolysis versus control, Outcome 3 Stroke/intracerebral haemorrhage (early). | ||||
| 4 Mortality (early) Show forest plot | 1 | Risk Ratio (M‐H, Fixed, 95% CI) | Totals not selected | |
| Analysis 3.4 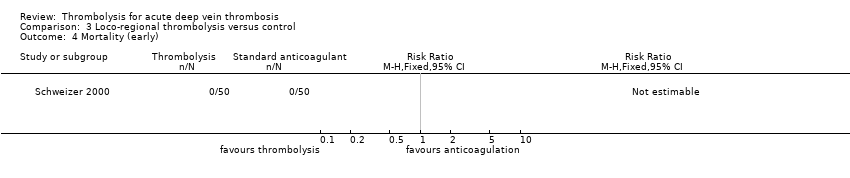 Comparison 3 Loco‐regional thrombolysis versus control, Outcome 4 Mortality (early). | ||||
| 5 Pulmonary embolism (early) Show forest plot | 1 | Risk Ratio (M‐H, Fixed, 95% CI) | Totals not selected | |
| Analysis 3.5  Comparison 3 Loco‐regional thrombolysis versus control, Outcome 5 Pulmonary embolism (early). | ||||
| 6 Post‐thrombotic syndrome (intermediate) Show forest plot | 1 | Risk Ratio (M‐H, Fixed, 95% CI) | Totals not selected | |
| Analysis 3.6 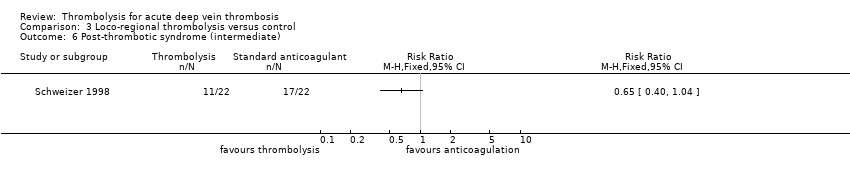 Comparison 3 Loco‐regional thrombolysis versus control, Outcome 6 Post‐thrombotic syndrome (intermediate). | ||||
| 7 Leg ulceration (intermediate) Show forest plot | 1 | Risk Ratio (M‐H, Fixed, 95% CI) | Totals not selected | |
| Analysis 3.7  Comparison 3 Loco‐regional thrombolysis versus control, Outcome 7 Leg ulceration (intermediate). | ||||
| 8 Complete clot lysis (intermediate) Show forest plot | 2 | 139 | Risk Ratio (M‐H, Fixed, 95% CI) | 2.25 [1.33, 3.80] |
| Analysis 3.8  Comparison 3 Loco‐regional thrombolysis versus control, Outcome 8 Complete clot lysis (intermediate). | ||||
| 9 Mortality (intermediate) Show forest plot | 1 | Risk Ratio (M‐H, Fixed, 95% CI) | Totals not selected | |
| Analysis 3.9  Comparison 3 Loco‐regional thrombolysis versus control, Outcome 9 Mortality (intermediate). | ||||
| Outcome or subgroup title | No. of studies | No. of participants | Statistical method | Effect size |
| 1 Any improvement in venous patency (early) Show forest plot | 1 | Risk Ratio (M‐H, Fixed, 95% CI) | Totals not selected | |
| Analysis 4.1 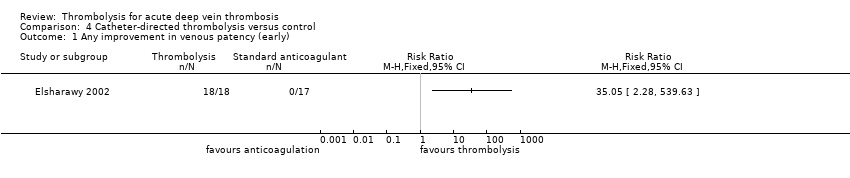 Comparison 4 Catheter‐directed thrombolysis versus control, Outcome 1 Any improvement in venous patency (early). | ||||
| 2 Complete clot lysis (early) Show forest plot | 1 | Risk Ratio (M‐H, Fixed, 95% CI) | Totals not selected | |
| Analysis 4.2  Comparison 4 Catheter‐directed thrombolysis versus control, Outcome 2 Complete clot lysis (early). | ||||
| 3 Bleeding (early) Show forest plot | 2 | 224 | Risk Ratio (M‐H, Fixed, 95% CI) | 7.69 [0.40, 146.90] |
| Analysis 4.3  Comparison 4 Catheter‐directed thrombolysis versus control, Outcome 3 Bleeding (early). | ||||
| 4 Stroke/intracerebral haemorrhage (early) Show forest plot | 1 | Risk Ratio (M‐H, Fixed, 95% CI) | Totals not selected | |
| Analysis 4.4  Comparison 4 Catheter‐directed thrombolysis versus control, Outcome 4 Stroke/intracerebral haemorrhage (early). | ||||
| 5 Mortality (early) Show forest plot | 1 | Risk Ratio (M‐H, Fixed, 95% CI) | Totals not selected | |
| Analysis 4.5  Comparison 4 Catheter‐directed thrombolysis versus control, Outcome 5 Mortality (early). | ||||
| 6 Pulmonary embolism (early) Show forest plot | 1 | Risk Ratio (M‐H, Fixed, 95% CI) | Totals not selected | |
| Analysis 4.6  Comparison 4 Catheter‐directed thrombolysis versus control, Outcome 6 Pulmonary embolism (early). | ||||
| 7 Post‐thrombotic syndrome (intermediate) Show forest plot | 1 | Risk Ratio (M‐H, Fixed, 95% CI) | Totals not selected | |
| Analysis 4.7  Comparison 4 Catheter‐directed thrombolysis versus control, Outcome 7 Post‐thrombotic syndrome (intermediate). | ||||
| 8 Post‐thrombotic syndrome (late) Show forest plot | 1 | Risk Ratio (M‐H, Fixed, 95% CI) | Totals not selected | |
| Analysis 4.8  Comparison 4 Catheter‐directed thrombolysis versus control, Outcome 8 Post‐thrombotic syndrome (late). | ||||
| 9 Leg ulceration (intermediate) Show forest plot | 1 | Risk Ratio (M‐H, Fixed, 95% CI) | Totals not selected | |
| Analysis 4.9  Comparison 4 Catheter‐directed thrombolysis versus control, Outcome 9 Leg ulceration (intermediate). | ||||
| 10 Complete clot lysis (intermediate) Show forest plot | 2 | 224 | Risk Ratio (M‐H, Random, 95% CI) | 2.52 [0.52, 12.17] |
| Analysis 4.10  Comparison 4 Catheter‐directed thrombolysis versus control, Outcome 10 Complete clot lysis (intermediate). | ||||
| 11 Complete clot lysis (late) Show forest plot | 1 | Risk Ratio (M‐H, Fixed, 95% CI) | Totals not selected | |
| Analysis 4.11  Comparison 4 Catheter‐directed thrombolysis versus control, Outcome 11 Complete clot lysis (late). | ||||
| 12 Normal venous function (intermediate) Show forest plot | 2 | 224 | Risk Ratio (M‐H, Fixed, 95% CI) | 2.98 [1.75, 5.08] |
| Analysis 4.12 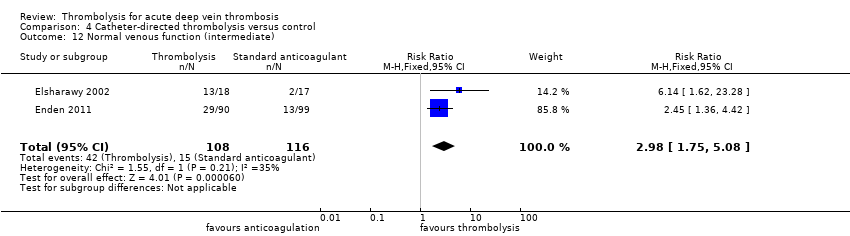 Comparison 4 Catheter‐directed thrombolysis versus control, Outcome 12 Normal venous function (intermediate). | ||||
| 13 Recurrent VTE (intermediate) Show forest plot | 1 | Risk Ratio (M‐H, Fixed, 95% CI) | Totals not selected | |
| Analysis 4.13  Comparison 4 Catheter‐directed thrombolysis versus control, Outcome 13 Recurrent VTE (intermediate). | ||||
| 14 Recurrent VTE (late) Show forest plot | 1 | Risk Ratio (M‐H, Fixed, 95% CI) | Totals not selected | |
| Analysis 4.14  Comparison 4 Catheter‐directed thrombolysis versus control, Outcome 14 Recurrent VTE (late). | ||||
| 15 Mortality (late) Show forest plot | 1 | Risk Ratio (M‐H, Fixed, 95% CI) | Totals not selected | |
| Analysis 4.15  Comparison 4 Catheter‐directed thrombolysis versus control, Outcome 15 Mortality (late). | ||||


Risk of bias graph: review authors' judgements about each risk of bias item presented as percentages across all included studies.
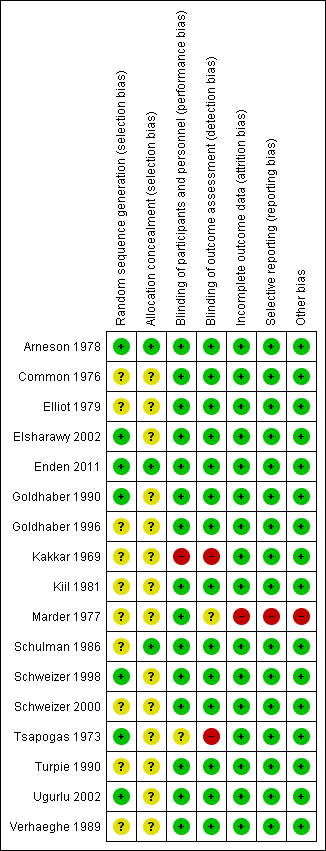
Risk of bias summary: review authors' judgements about each risk of bias item for each included study.
Comparison 1 Any thrombolysis versus control, Outcome 1 Any improvement in venous patency (early).
Comparison 1 Any thrombolysis versus control, Outcome 2 Complete clot lysis (early).
Comparison 1 Any thrombolysis versus control, Outcome 3 Bleeding (early).
Comparison 1 Any thrombolysis versus control, Outcome 4 Stroke/intracerebral haemorrhage (early).
Comparison 1 Any thrombolysis versus control, Outcome 5 Mortality (early).
Comparison 1 Any thrombolysis versus control, Outcome 6 Pulmonary embolism (early).
Comparison 1 Any thrombolysis versus control, Outcome 7 Post‐thrombotic syndrome (intermediate).
Comparison 1 Any thrombolysis versus control, Outcome 8 Post‐thrombotic syndrome (late).
Comparison 1 Any thrombolysis versus control, Outcome 9 Leg ulceration (intermediate).
Comparison 1 Any thrombolysis versus control, Outcome 10 Leg ulceration (late).
Comparison 1 Any thrombolysis versus control, Outcome 11 Complete clot lysis (intermediate).
Comparison 1 Any thrombolysis versus control, Outcome 12 Complete clot lysis (late).
Comparison 1 Any thrombolysis versus control, Outcome 13 Mortality (intermediate).
Comparison 1 Any thrombolysis versus control, Outcome 14 Mortality (late).
Comparison 1 Any thrombolysis versus control, Outcome 15 Normal venous function (intermediate).
Comparison 1 Any thrombolysis versus control, Outcome 16 Recurrent DVT (intermediate).
Comparison 2 Systemic thrombolysis versus control, Outcome 1 Any improvement in venous patency (early).
Comparison 2 Systemic thrombolysis versus control, Outcome 2 Complete clot lysis (early).
Comparison 2 Systemic thrombolysis versus control, Outcome 3 Bleeding (early).
Comparison 2 Systemic thrombolysis versus control, Outcome 4 Stroke/intracerebral haemorrhage (early).
Comparison 2 Systemic thrombolysis versus control, Outcome 5 Mortality (early).
Comparison 2 Systemic thrombolysis versus control, Outcome 6 Pulmonary embolism (early).
Comparison 2 Systemic thrombolysis versus control, Outcome 7 Post‐thrombotic syndrome (intermediate).
Comparison 2 Systemic thrombolysis versus control, Outcome 8 Post‐thrombotic syndrome (late).
Comparison 2 Systemic thrombolysis versus control, Outcome 9 Leg ulceration (intermediate).
Comparison 2 Systemic thrombolysis versus control, Outcome 10 Leg ulceration (late).
Comparison 2 Systemic thrombolysis versus control, Outcome 11 Complete clot lysis (intermediate).
Comparison 2 Systemic thrombolysis versus control, Outcome 12 Complete clot lysis (late).
Comparison 2 Systemic thrombolysis versus control, Outcome 13 Mortality (intermediate).
Comparison 2 Systemic thrombolysis versus control, Outcome 14 Mortality (late).
Comparison 2 Systemic thrombolysis versus control, Outcome 15 Normal venous function (intermediate).
Comparison 2 Systemic thrombolysis versus control, Outcome 16 Recurrent DVT (late).
Comparison 3 Loco‐regional thrombolysis versus control, Outcome 1 Complete clot lysis (early).
Comparison 3 Loco‐regional thrombolysis versus control, Outcome 2 Bleeding (early).
Comparison 3 Loco‐regional thrombolysis versus control, Outcome 3 Stroke/intracerebral haemorrhage (early).
Comparison 3 Loco‐regional thrombolysis versus control, Outcome 4 Mortality (early).
Comparison 3 Loco‐regional thrombolysis versus control, Outcome 5 Pulmonary embolism (early).
Comparison 3 Loco‐regional thrombolysis versus control, Outcome 6 Post‐thrombotic syndrome (intermediate).
Comparison 3 Loco‐regional thrombolysis versus control, Outcome 7 Leg ulceration (intermediate).
Comparison 3 Loco‐regional thrombolysis versus control, Outcome 8 Complete clot lysis (intermediate).
Comparison 3 Loco‐regional thrombolysis versus control, Outcome 9 Mortality (intermediate).
Comparison 4 Catheter‐directed thrombolysis versus control, Outcome 1 Any improvement in venous patency (early).
Comparison 4 Catheter‐directed thrombolysis versus control, Outcome 2 Complete clot lysis (early).
Comparison 4 Catheter‐directed thrombolysis versus control, Outcome 3 Bleeding (early).
Comparison 4 Catheter‐directed thrombolysis versus control, Outcome 4 Stroke/intracerebral haemorrhage (early).
Comparison 4 Catheter‐directed thrombolysis versus control, Outcome 5 Mortality (early).
Comparison 4 Catheter‐directed thrombolysis versus control, Outcome 6 Pulmonary embolism (early).
Comparison 4 Catheter‐directed thrombolysis versus control, Outcome 7 Post‐thrombotic syndrome (intermediate).
Comparison 4 Catheter‐directed thrombolysis versus control, Outcome 8 Post‐thrombotic syndrome (late).
Comparison 4 Catheter‐directed thrombolysis versus control, Outcome 9 Leg ulceration (intermediate).
Comparison 4 Catheter‐directed thrombolysis versus control, Outcome 10 Complete clot lysis (intermediate).
Comparison 4 Catheter‐directed thrombolysis versus control, Outcome 11 Complete clot lysis (late).
Comparison 4 Catheter‐directed thrombolysis versus control, Outcome 12 Normal venous function (intermediate).
Comparison 4 Catheter‐directed thrombolysis versus control, Outcome 13 Recurrent VTE (intermediate).
Comparison 4 Catheter‐directed thrombolysis versus control, Outcome 14 Recurrent VTE (late).
Comparison 4 Catheter‐directed thrombolysis versus control, Outcome 15 Mortality (late).
| Treatment with any thrombolysis for acute DVT | ||||||
| Patient or population: patients diagnosed with acute DVT | ||||||
| Outcomes | Anticipated absolute effects* (95% CI) | Relative effect | № of participants | Quality of the evidence | Comments | |
| Risk with control | Risk with any thrombolysis | |||||
| Complete clot lysis (intermediate, 6 months to under 5 years after treatment) | Study population | RR 2.44 (1.4 to 4.27) | 630 | ⊕⊕⊕⊝ | 78 (of 240) patients treated with standard anticoagulation had complete clot lysis compared to 198 (of 390) in the thrombolysis group | |
| 325 per 1000 | 793 per 1000 (455 to 1000) | |||||
| Bleeding (early, up to 1 month after treatment) | Study population | RR 2.23 | 1103 | ⊕⊕⊕⊝ | Although 17 studies reported on bleeding, these were small studies | |
| 43 per 1000 | 96 per 1000 (61 to 152) | |||||
| Post‐thrombotic syndrome (intermediate, 6 months to under 5 years after treatment) | Study population | RR 0.66 | 306 | ⊕⊕⊕⊝ | 96 (of 146) patients treated with standard anticoagulation developed PTS compared to 72 (of 160) treated with thrombolysis | |
| 658 per 1000 | 434 per 1000 (348 to 533) | |||||
| Post‐thrombotic syndrome (late, 5 year follow‐up after treatment) | Study population | RR 0.58 | 211 | ⊕⊕⊕⊝ | 72 (of 107) patients treated with standard anticoagulation developed PTS compared to 41 (of 104) treated with thrombolysis | |
| 673 per 1000 | 390 per 1000 (303 to 518) | |||||
| *The risk in the intervention group (and its 95% confidence interval) is based on the assumed risk in the comparison group and the relative effect of the intervention (and its 95% CI). | ||||||
| GRADE Working Group grades of evidence | ||||||
| 1 Downgraded by one level as the number of participants in each study is small | ||||||
| Treatment with catheter directed thrombolysis for acute DVT | ||||||
| Patient or population: patients diagnosed with acute deep vein thrombosis | ||||||
| Outcomes | Anticipated absolute effects* (95% CI) | Relative effect | № of participants | Quality of the evidence | Comments | |
| Risk with control | Risk with catheter directed thrombolysis | |||||
| Complete clot lysis (intermediate, 6 months to under 5 years after treatment) | Study population | RR 2.52 | 224 | ⊕⊕⊕⊝ | ||
| 58 (of 116) patients treated with standard anticoagulation had complete clot lysis compared to 81 (of 108) in the CDT group | ||||||
| Bleeding (early, up to 1 month after treatment) | Study population | RR 7.69 | 224 | ⊕⊕⊕⊝ | None (of 116) patients in the standard anticoagulation group had bleeding complications compared to 3 (of 108) in the CDT group. | |
| Cannot define risk as no events reported in the standard anticoagulation group | ||||||
| Post‐thrombotic syndrome (intermediate, 6 months to under 5 years after treatment) | Study population | RR 0.74 | 189 | ⊕⊕⊕⊝ | 55 (of 99) patients in the standard anticoagulation group developed PTS compared to 37 (of 90) in the CDT group. | |
| 556 per 1000 | 411 per 1000 (306 to 556) | |||||
| Post‐thrombotic syndrome (late, 5 year follow‐up after treatment) | Study population | RR 0.60 | 176 | ⊕⊕⊕⊝ | 63 (of 89) patients in the standard anticoagulation group developed PTS compared to 37 (of 87) in the CDT group. | |
| 708 per 1000 | 425 per 1000 (319 to 559) | |||||
| *The risk in the intervention group (and its 95% confidence interval) is based on the assumed risk in the comparison group and the relative effect of the intervention (and its 95% CI). | ||||||
| GRADE Working Group grades of evidence | ||||||
| 1 Downgraded by one level as confidence intervals are wide around the estimate of the effect | ||||||
| Study | Potential levels of leg vein included |
| proximal to calf | |
| not specified | |
| proximal | |
| femoral and iliofemoral | |
| pelvic, iliofemoral, femoral | |
| popliteal or more proximal | |
| proximal | |
| not specified | |
| not specified | |
| calf up to iliac vein | |
| calf vein thrombosis only | |
| not specified | |
| popliteal or more proximal | |
| not specified | |
| proximal | |
| popliteal up to inferior vena cava | |
| popliteal or more proximal |
| Outcome or subgroup title | No. of studies | No. of participants | Statistical method | Effect size |
| 1 Any improvement in venous patency (early) Show forest plot | 9 | 421 | Risk Ratio (M‐H, Random, 95% CI) | 2.48 [1.35, 4.57] |
| 2 Complete clot lysis (early) Show forest plot | 8 | 592 | Risk Ratio (M‐H, Random, 95% CI) | 4.91 [1.66, 14.53] |
| 3 Bleeding (early) Show forest plot | 17 | 1103 | Risk Ratio (M‐H, Fixed, 95% CI) | 2.23 [1.41, 3.52] |
| 4 Stroke/intracerebral haemorrhage (early) Show forest plot | 17 | 1103 | Risk Ratio (M‐H, Fixed, 95% CI) | 1.92 [0.34, 10.86] |
| 5 Mortality (early) Show forest plot | 9 | 529 | Risk Ratio (M‐H, Fixed, 95% CI) | 0.76 [0.31, 1.89] |
| 6 Pulmonary embolism (early) Show forest plot | 6 | 433 | Risk Ratio (M‐H, Fixed, 95% CI) | 1.00 [0.33, 3.05] |
| 7 Post‐thrombotic syndrome (intermediate) Show forest plot | 3 | 306 | Risk Ratio (M‐H, Fixed, 95% CI) | 0.66 [0.53, 0.81] |
| 8 Post‐thrombotic syndrome (late) Show forest plot | 2 | 211 | Risk Ratio (M‐H, Fixed, 95% CI) | 0.58 [0.45, 0.77] |
| 9 Leg ulceration (intermediate) Show forest plot | 4 | 342 | Risk Ratio (M‐H, Fixed, 95% CI) | 0.87 [0.16, 4.73] |
| 10 Leg ulceration (late) Show forest plot | 1 | Risk Ratio (M‐H, Fixed, 95% CI) | Totals not selected | |
| 11 Complete clot lysis (intermediate) Show forest plot | 7 | 630 | Risk Ratio (M‐H, Random, 95% CI) | 2.44 [1.40, 4.27] |
| 12 Complete clot lysis (late) Show forest plot | 2 | 206 | Risk Ratio (M‐H, Random, 95% CI) | 3.25 [0.17, 62.63] |
| 13 Mortality (intermediate) Show forest plot | 2 | 289 | Risk Ratio (M‐H, Fixed, 95% CI) | 0.96 [0.27, 3.43] |
| 14 Mortality (late) Show forest plot | 2 | 230 | Risk Ratio (M‐H, Fixed, 95% CI) | 0.61 [0.25, 1.50] |
| 15 Normal venous function (intermediate) Show forest plot | 3 | 255 | Risk Ratio (M‐H, Random, 95% CI) | 2.18 [0.86, 5.54] |
| 16 Recurrent DVT (intermediate) Show forest plot | 1 | Risk Ratio (M‐H, Fixed, 95% CI) | Totals not selected | |
| Outcome or subgroup title | No. of studies | No. of participants | Statistical method | Effect size |
| 1 Any improvement in venous patency (early) Show forest plot | 8 | 386 | Risk Ratio (M‐H, Random, 95% CI) | 2.18 [1.28, 3.70] |
| 2 Complete clot lysis (early) Show forest plot | 7 | 457 | Risk Ratio (M‐H, Random, 95% CI) | 4.37 [1.40, 13.61] |
| 3 Bleeding (early) Show forest plot | 15 | 779 | Risk Ratio (M‐H, Fixed, 95% CI) | 2.18 [1.37, 3.47] |
| 4 Stroke/intracerebral haemorrhage (early) Show forest plot | 15 | 779 | Risk Ratio (M‐H, Fixed, 95% CI) | 1.92 [0.34, 10.86] |
| 5 Mortality (early) Show forest plot | 8 | 394 | Risk Ratio (M‐H, Fixed, 95% CI) | 0.76 [0.31, 1.89] |
| 6 Pulmonary embolism (early) Show forest plot | 5 | 298 | Risk Ratio (M‐H, Fixed, 95% CI) | 1.73 [0.55, 5.40] |
| 7 Post‐thrombotic syndrome (intermediate) Show forest plot | 2 | 117 | Risk Ratio (M‐H, Random, 95% CI) | 0.56 [0.30, 1.03] |
| 8 Post‐thrombotic syndrome (late) Show forest plot | 1 | Risk Ratio (M‐H, Fixed, 95% CI) | Totals not selected | |
| 9 Leg ulceration (intermediate) Show forest plot | 3 | 153 | Risk Ratio (M‐H, Fixed, 95% CI) | 0.87 [0.16, 4.73] |
| 10 Leg ulceration (late) Show forest plot | 1 | Risk Ratio (M‐H, Fixed, 95% CI) | Totals not selected | |
| 11 Complete clot lysis (intermediate) Show forest plot | 5 | 300 | Risk Ratio (M‐H, Random, 95% CI) | 2.59 [1.27, 5.28] |
| 12 Complete clot lysis (late) Show forest plot | 1 | Risk Ratio (M‐H, Fixed, 95% CI) | Totals not selected | |
| 13 Mortality (intermediate) Show forest plot | 2 | 189 | Risk Ratio (M‐H, Fixed, 95% CI) | 0.96 [0.27, 3.43] |
| 14 Mortality (late) Show forest plot | 1 | Risk Ratio (M‐H, Fixed, 95% CI) | Totals not selected | |
| 15 Normal venous function (intermediate) Show forest plot | 1 | Risk Ratio (M‐H, Fixed, 95% CI) | Totals not selected | |
| 16 Recurrent DVT (late) Show forest plot | 1 | Risk Ratio (M‐H, Fixed, 95% CI) | Totals not selected | |
| Outcome or subgroup title | No. of studies | No. of participants | Statistical method | Effect size |
| 1 Complete clot lysis (early) Show forest plot | 1 | Risk Ratio (M‐H, Fixed, 95% CI) | Totals not selected | |
| 2 Bleeding (early) Show forest plot | 2 | 146 | Risk Ratio (M‐H, Fixed, 95% CI) | 4.0 [0.46, 34.75] |
| 3 Stroke/intracerebral haemorrhage (early) Show forest plot | 2 | 146 | Risk Ratio (M‐H, Fixed, 95% CI) | 0.0 [0.0, 0.0] |
| 4 Mortality (early) Show forest plot | 1 | Risk Ratio (M‐H, Fixed, 95% CI) | Totals not selected | |
| 5 Pulmonary embolism (early) Show forest plot | 1 | Risk Ratio (M‐H, Fixed, 95% CI) | Totals not selected | |
| 6 Post‐thrombotic syndrome (intermediate) Show forest plot | 1 | Risk Ratio (M‐H, Fixed, 95% CI) | Totals not selected | |
| 7 Leg ulceration (intermediate) Show forest plot | 1 | Risk Ratio (M‐H, Fixed, 95% CI) | Totals not selected | |
| 8 Complete clot lysis (intermediate) Show forest plot | 2 | 139 | Risk Ratio (M‐H, Fixed, 95% CI) | 2.25 [1.33, 3.80] |
| 9 Mortality (intermediate) Show forest plot | 1 | Risk Ratio (M‐H, Fixed, 95% CI) | Totals not selected | |
| Outcome or subgroup title | No. of studies | No. of participants | Statistical method | Effect size |
| 1 Any improvement in venous patency (early) Show forest plot | 1 | Risk Ratio (M‐H, Fixed, 95% CI) | Totals not selected | |
| 2 Complete clot lysis (early) Show forest plot | 1 | Risk Ratio (M‐H, Fixed, 95% CI) | Totals not selected | |
| 3 Bleeding (early) Show forest plot | 2 | 224 | Risk Ratio (M‐H, Fixed, 95% CI) | 7.69 [0.40, 146.90] |
| 4 Stroke/intracerebral haemorrhage (early) Show forest plot | 1 | Risk Ratio (M‐H, Fixed, 95% CI) | Totals not selected | |
| 5 Mortality (early) Show forest plot | 1 | Risk Ratio (M‐H, Fixed, 95% CI) | Totals not selected | |
| 6 Pulmonary embolism (early) Show forest plot | 1 | Risk Ratio (M‐H, Fixed, 95% CI) | Totals not selected | |
| 7 Post‐thrombotic syndrome (intermediate) Show forest plot | 1 | Risk Ratio (M‐H, Fixed, 95% CI) | Totals not selected | |
| 8 Post‐thrombotic syndrome (late) Show forest plot | 1 | Risk Ratio (M‐H, Fixed, 95% CI) | Totals not selected | |
| 9 Leg ulceration (intermediate) Show forest plot | 1 | Risk Ratio (M‐H, Fixed, 95% CI) | Totals not selected | |
| 10 Complete clot lysis (intermediate) Show forest plot | 2 | 224 | Risk Ratio (M‐H, Random, 95% CI) | 2.52 [0.52, 12.17] |
| 11 Complete clot lysis (late) Show forest plot | 1 | Risk Ratio (M‐H, Fixed, 95% CI) | Totals not selected | |
| 12 Normal venous function (intermediate) Show forest plot | 2 | 224 | Risk Ratio (M‐H, Fixed, 95% CI) | 2.98 [1.75, 5.08] |
| 13 Recurrent VTE (intermediate) Show forest plot | 1 | Risk Ratio (M‐H, Fixed, 95% CI) | Totals not selected | |
| 14 Recurrent VTE (late) Show forest plot | 1 | Risk Ratio (M‐H, Fixed, 95% CI) | Totals not selected | |
| 15 Mortality (late) Show forest plot | 1 | Risk Ratio (M‐H, Fixed, 95% CI) | Totals not selected | |