Intravenous midazolam infusion for sedation of infants in the neonatal intensive care unit
Information
- DOI:
- https://doi.org/10.1002/14651858.CD002052.pub3Copy DOI

- Database:
-
- Cochrane Database of Systematic Reviews
- Version published:
-
- 31 January 2017see what's new
- Type:
-
- Intervention
- Stage:
-
- Review
- Cochrane Editorial Group:
-
Cochrane Neonatal Group
- Copyright:
-
- Copyright © 2020 The Cochrane Collaboration. Published by John Wiley & Sons, Ltd.
Article metrics
Altmetric:
Cited by:
Authors
Contributions of authors
E Ng.
-
Development and writing of the protocol.
-
Literature search and identification of trials for inclusion.
-
Evaluation of methodological quality of included trials.
-
Abstraction of data independent of co‐review author.
-
Entry of data into RevMan.
-
Writing of Results section.
-
Writing of Discussion section.
-
Writing of all updates.
A Taddio.
-
Development of the protocol.
-
Literature search and identification of trials for inclusion.
-
Evaluation of methodological quality of included trials.
-
Abstraction of data independent of co‐review author.
-
Verification of data entered into RevMan.
-
Revision of the 2016 update.
A Ohlsson.
-
Development of the protocol.
-
Literature search and identification of trials for inclusion.
-
Verification of data entered into RevMan.
-
Writing the text of the update of the review.
-
Development of 'Summary of findings' tables.
-
Revision of risk of bias tables in 2016.
-
Revision of the final review and of 2009, 2012 and 2016 updates.
All review authors participated in completion of the 2009 and 2016 updates. However, only two review authors (E Ng, A Ohlsson) participated in completion of the 2012 update.
Sources of support
Internal sources
-
Sunnybrook Health Sciences Centre, Toronto, Canada.
-
The Hospital for Sick Children, Toronto, Canada.
-
Mount Sinai Hospital, Toronto, Canada.
External sources
-
Eunice Kennedy Shriver National Institute of Child Health and Human Development, National Institutes of Health, Department of Health and Human Services, USA.
Editorial support of the Cochrane Neonatal Review Group has been funded with Federal funds from the Eunice Kennedy Shriver National Institute of Child Health and Human Development, National Institutes of Health, Department of Health and Human Services, USA, under Contract No. HHSN275201100016C
Declarations of interest
E Ng ‐ no conflicts of interest to declare.
A Taddio ‐ no conflicts of interest to declare.
A Ohlsson ‐ no conflicts of interest to declare.
Acknowledgements
We acknowledge Joseph Beyene, Biostatistician, University of Toronto, Ontario, Canada, for performing statistical analyses of the data provided by Anand 1999 in previous versions of this review.
Version history
| Published | Title | Stage | Authors | Version |
| 2017 Jan 31 | Intravenous midazolam infusion for sedation of infants in the neonatal intensive care unit | Review | Eugene Ng, Anna Taddio, Arne Ohlsson | |
| 2012 Jun 13 | Intravenous midazolam infusion for sedation of infants in the neonatal intensive care unit | Review | Eugene Ng, Anna Taddio, Arne Ohlsson | |
| 2003 Jan 20 | Intravenous midazolam infusion for sedation of infants in the neonatal intensive care unit | Review | Eugene Ng, Anna Taddio, Arne Ohlsson | |
Differences between protocol and review
We added the method and the plan for 'Summary of findings' tables and GRADE recommendations, which were not included in the original protocol nor in the last published review.
Keywords
MeSH
Medical Subject Headings (MeSH) Keywords
Medical Subject Headings Check Words
Humans; Infant, Newborn;
PICOs
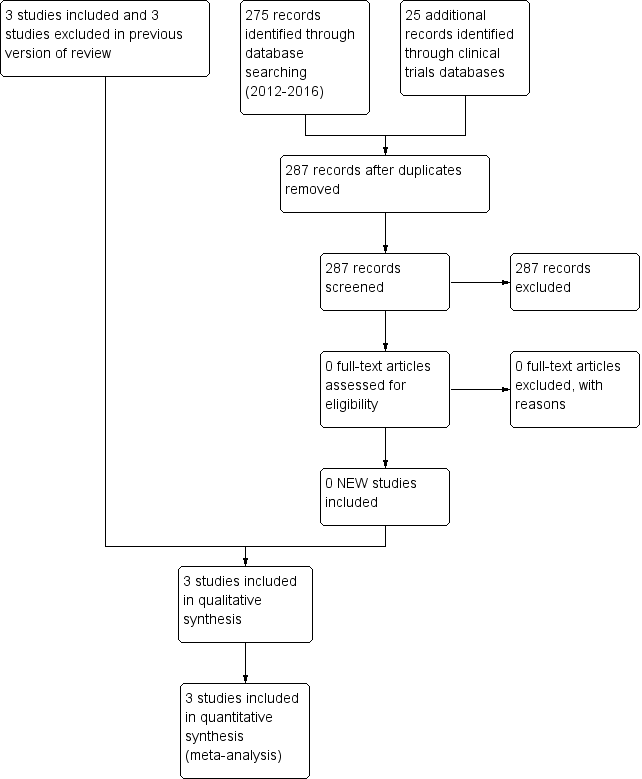
Study flow diagram: review update.

Risk of bias graph: review authors' judgements about each risk of bias item presented as percentages across all included studies.
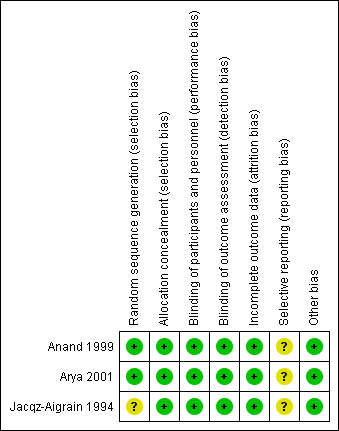
Risk of bias summary: review authors' judgements about each risk of bias item for each included study.

Forest plot of comparison: 1 Midazolam versus placebo, outcome: 1.6 Length of NICU stay (days).

Forest plot of comparison: 1 Midazolam versus placebo, outcome: 1.9 PIPP score during drug infusion.

Forest plot of comparison: 2 Midazolam versus morphine, outcome: 2.2 Poor neurological outcome up to 28 days' postnatal age.

Comparison 1 Midazolam versus placebo, Outcome 1 Intraventricular haemorrhage (any grade).
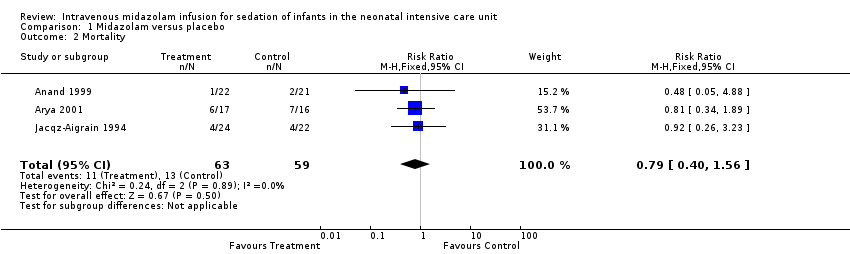
Comparison 1 Midazolam versus placebo, Outcome 2 Mortality.
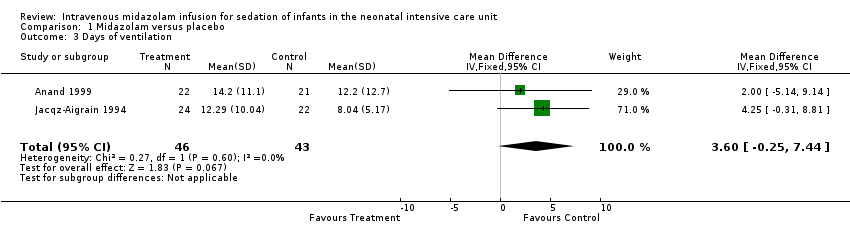
Comparison 1 Midazolam versus placebo, Outcome 3 Days of ventilation.

Comparison 1 Midazolam versus placebo, Outcome 4 Days of supplemental oxygen use.

Comparison 1 Midazolam versus placebo, Outcome 5 Pneumothorax.

Comparison 1 Midazolam versus placebo, Outcome 6 Length of NICU stay (days).

Comparison 1 Midazolam versus placebo, Outcome 7 Average NAPI scores at 36 weeks' PMA.

Comparison 1 Midazolam versus placebo, Outcome 8 Poor neurological outcome by 28 days' postnatal age.
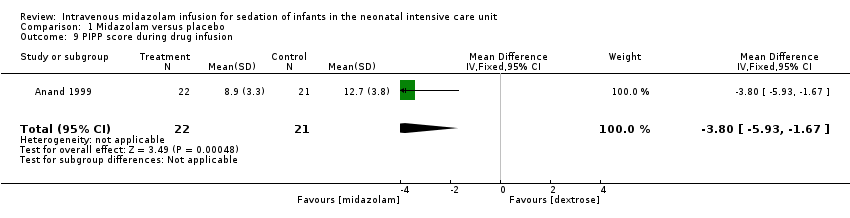
Comparison 1 Midazolam versus placebo, Outcome 9 PIPP score during drug infusion.
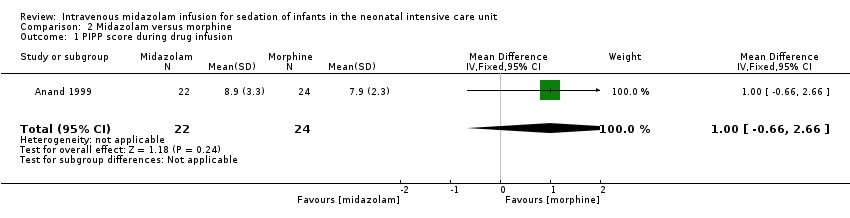
Comparison 2 Midazolam versus morphine, Outcome 1 PIPP score during drug infusion.

Comparison 2 Midazolam versus morphine, Outcome 2 Poor neurological outcome up to 28 days' postnatal age.
| Midazolam infusion compared with placebo for sedation in neonates | ||||||
| Patient or population: neonates requiring intubation and ventilation Setting: neonatal intensive care unit Intervention: midazolam infusion Comparison: placebo infusion | ||||||
| Outcomes | Illustrative comparative risks* (95% CI) | Relative effect | Number of participants | Quality of the evidence | Comments | |
| Assumed risk | Corresponding risk | |||||
| Placebo | Midazolam | |||||
| Mortality during hospital stay | High‐risk population | RR 0.79 (0.40 to 1.56) | 122 | ⊕⊕⊕⊝ | Risk of bias for these 3 studies was low. We noted no heterogeneity in the results (I2 = 0%). Precision for the point estimate was low, so we downgraded the quality of the evidence 1 step. The 3 studies were conducted in the target population of newborn infants. | |
| 220 per 1000 | 165 per 1000 | |||||
| Length of NICU stay (days) | Mean length of NICU stay ranged across control groups from 9 to 37.5 days. | WMD of NICU stay for intervention groups was 5.4 days longer. | WMD 5.4 days (0.4 to 10.5) | 89 | ⊕⊕⊕⊝ | Risk of bias for these 2 studies was low. We noted no heterogeneity in the results (I2 = 0%). Precision for the point estimate was low, so we downgraded the quality of the evidence 1 step. The 2 studies were conducted in the target population of newborn infants. |
| PIPP score during drug infusion Range of scale 0‐21 for infants | Mean PIPP score in the control group was 12.7. | Mean PIPP score in the intervention group was lower at 8.9. | MD ‐3.80 | 43 | ⊕⊕⊕⊝ | Risk of bias for this study was low. As we identified only 1 study, tests for heterogeneity were not applicable. Precision for the point estimate was low, so we downgraded the quality of the evidence 1 step. This study was conducted in the target population of newborn infants. |
| Poor neurological outcome by 28 days' postnatal age | High‐risk population | RR 1.34 | 43 | ⊕⊕⊕⊝ | Risk of bias for this study was low. As we identified only 1 study, tests for heterogeneity were not applicable. Precision for the point estimate was low, so we downgraded the quality of the evidence 1 step. This study was conducted in the target population of newborn infants. | |
| 230 per 1000 | 310 per 1000 | |||||
| *The basis for the assumed risk (e.g. median control group risk across studies) is provided in footnotes. The corresponding risk (and its 95% confidence interval) is based on assumed risk in the comparison group and the relative effect of the intervention (and its 95% CI). | ||||||
| GRADE Working Group grades of evidence. | ||||||
| Midazolam infusion compared with morphine infusion for sedation in neonates | ||||||
| Patient or population: neonates requiring intubation and ventilation Setting: neonatal intensive care unit Intervention: midazolam infusion Comparison: morphine infusion | ||||||
| Outcomes | Illustrative comparative risks* (95% CI) | Relative effect | Number of participants | Quality of the evidence | Comments | |
| Assumed risk | Corresponding risk | |||||
| Morphine | Midazolam | |||||
| PIPP score during drug infusion Range of scale 0‐21 for infants | Mean PIPP score in the control group was 7.9. | Mean PIPP score in the intervention group was 8.9. | MD 1.00 | 46 | ⊕⊕⊕⊝ | Risk of bias for this study was low. As we identified only 1 study, tests for heterogeneity were not applicable. Precision for the point estimate was low, so we downgraded the quality of the evidence 1 step. This study was conducted in the target population of newborn infants. |
| Poor neurological outcome by 28 days' postnatal age | High‐risk population | RR 7.64 | 46 | ⊕⊕⊕⊝ | Risk of bias for this study was low. As we identified only 1 study, tests for heterogeneity were not applicable. Precision for the point estimate was low, so we downgraded the quality of the evidence 1 step. This study was conducted in the target population of newborn infants. | |
| 318 per 1000 | 41 per 1000 | |||||
| *The basis for the assumed risk (e.g. median control group risk across studies) is provided in footnotes. The corresponding risk (and its 95% confidence interval) is based on assumed risk in the comparison group and the relative effect of the intervention (and its 95% CI). | ||||||
| GRADE Working Group grades of evidence. | ||||||
| Study reference for included trial | Name of score used | Reference for the score | Age of infants/children subjected to the score | Score validated in newborns? |
| COMFORT Scale | Ambuel 1992 ‐ 37 participants (age newborn to 204 months (mean 37.1; SD 52.7)) Marx 1994 ‐ children (age 0 to 102 months (mean age > 1 year) | No | ||
| Sedation score | Barrier 1989 ‐ 23 infants (age 1 to 7 months) | No | ||
| Behaviour score | Craig 1984 ‐ 30 children (age 2 to 24 months) Barrier 1989; Robieux 1991 ‐ 41 infants and toddlers (age 3 to 36 months) | No |
| Outcome or subgroup title | No. of studies | No. of participants | Statistical method | Effect size |
| 1 Intraventricular haemorrhage (any grade) Show forest plot | 3 | 122 | Risk Ratio (M‐H, Fixed, 95% CI) | 1.68 [0.87, 3.24] |
| 2 Mortality Show forest plot | 3 | 122 | Risk Ratio (M‐H, Fixed, 95% CI) | 0.79 [0.40, 1.56] |
| 3 Days of ventilation Show forest plot | 2 | 89 | Mean Difference (IV, Fixed, 95% CI) | 3.60 [‐0.25, 7.44] |
| 4 Days of supplemental oxygen use Show forest plot | 2 | 89 | Mean Difference (IV, Fixed, 95% CI) | 0.64 [‐5.30, 6.57] |
| 5 Pneumothorax Show forest plot | 3 | 122 | Risk Ratio (M‐H, Fixed, 95% CI) | 1.08 [0.41, 2.84] |
| 6 Length of NICU stay (days) Show forest plot | 2 | 89 | Mean Difference (IV, Fixed, 95% CI) | 5.44 [0.40, 10.49] |
| 7 Average NAPI scores at 36 weeks' PMA Show forest plot | 1 | 43 | Mean Difference (IV, Fixed, 95% CI) | ‐2.10 [‐14.38, 10.18] |
| 8 Poor neurological outcome by 28 days' postnatal age Show forest plot | 1 | 43 | Risk Ratio (M‐H, Fixed, 95% CI) | 1.34 [0.50, 3.56] |
| 9 PIPP score during drug infusion Show forest plot | 1 | 43 | Mean Difference (IV, Fixed, 95% CI) | ‐3.80 [‐5.93, ‐1.67] |
| Outcome or subgroup title | No. of studies | No. of participants | Statistical method | Effect size |
| 1 PIPP score during drug infusion Show forest plot | 1 | 46 | Mean Difference (IV, Fixed, 95% CI) | 1.0 [‐0.66, 2.66] |
| 2 Poor neurological outcome up to 28 days' postnatal age Show forest plot | 1 | 46 | Risk Ratio (M‐H, Fixed, 95% CI) | 7.64 [1.02, 57.21] |