Lamotrigina complementaria para la epilepsia parcial resistente a los fármacos
Appendices
Appendix 1. Cochrane Epilepsy Group Specialized Register search strategy
#1 (lamotrigine OR lamictal) AND >2011:YR
Appendix 2. CENTRAL search strategy
#1 lamotrigine or lamictal
#2 (epilep* or seizure* or convulsion*):ti,ab,kw (Word variations have been searched)
#3 MeSH descriptor: [Epilepsy] explode all trees
#4 MeSH descriptor: [Seizures] explode all trees
#5 (#2 or #3 or #4) in Trials
#6 #1 and #5 from 2012
Appendix 3. MEDLINE search strategy
This strategy is based on the Cochrane Highly Sensitive Search Strategy for identifying randomized trials (Lefebvre 2011).
1. (randomized controlled trial or controlled clinical trial).pt. or (randomi?ed or placebo or randomly).ab.
2. clinical trials as topic.sh.
3. trial.ti.
4. 1 or 2 or 3
5. exp animals/ not humans.sh.
6. 4 not 5
7. exp Epilepsy/
8. exp Seizures/
9. (epilep$ or seizure$ or convuls$).tw.
10. 7 or 8 or 9
11. (lamotrigine or lamictal).ti,ab.
12. 6 and 10 and 11
13. limit 12 to ed=20120701‐20150528

Study flow diagram for update.

Risk of bias graph: review authors' judgements about each risk of bias item presented as percentages across all included studies.
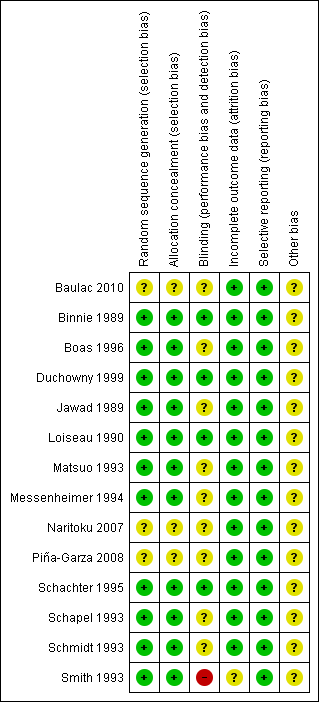
Risk of bias summary: review authors' judgements about each risk of bias item for each included study.

Comparison 1 Efficacy of add‐on lamotrigine versus placebo ‐ 50% responders, Outcome 1 Intention‐to‐treat analysis.
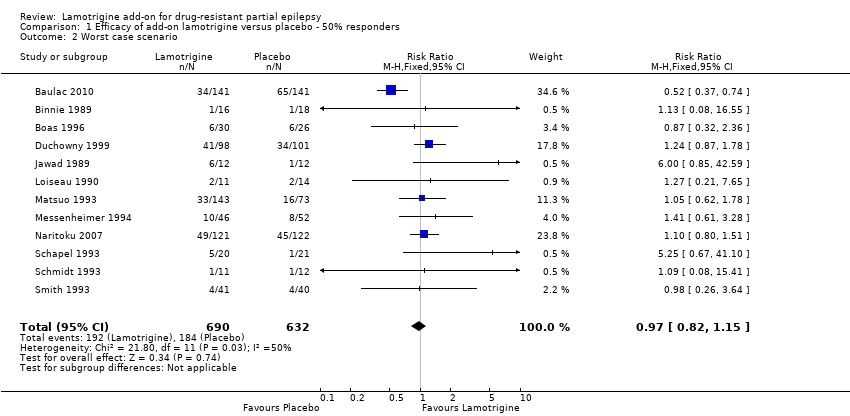
Comparison 1 Efficacy of add‐on lamotrigine versus placebo ‐ 50% responders, Outcome 2 Worst case scenario.

Comparison 1 Efficacy of add‐on lamotrigine versus placebo ‐ 50% responders, Outcome 3 Best case scenario.

Comparison 2 Treatment withdrawal (global outcome), Outcome 1 Withdrawal from treatment.

Comparison 3 Adverse effects, Outcome 1 Ataxia.
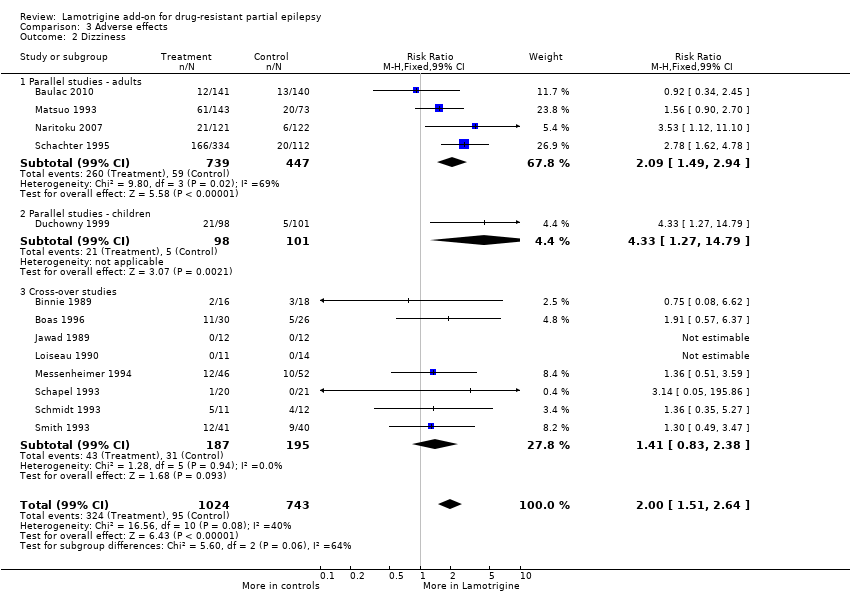
Comparison 3 Adverse effects, Outcome 2 Dizziness.
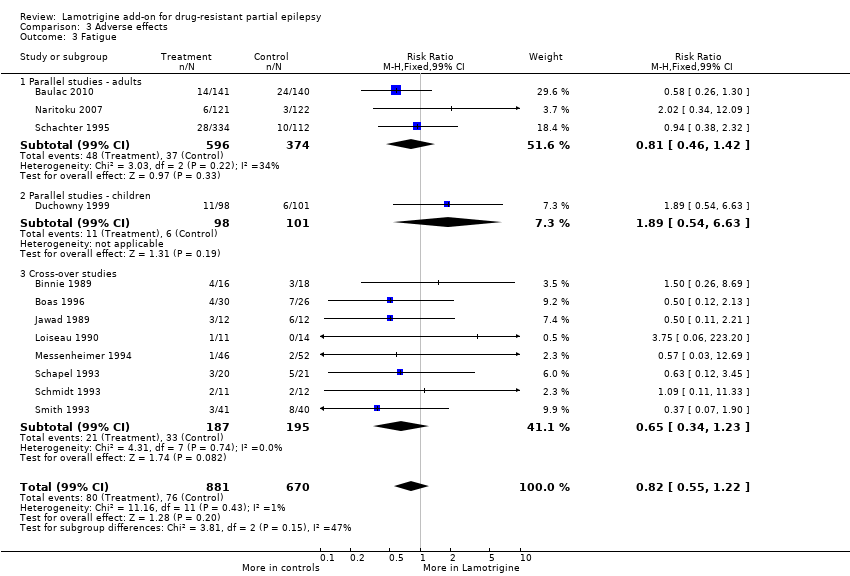
Comparison 3 Adverse effects, Outcome 3 Fatigue.

Comparison 3 Adverse effects, Outcome 4 Nausea.
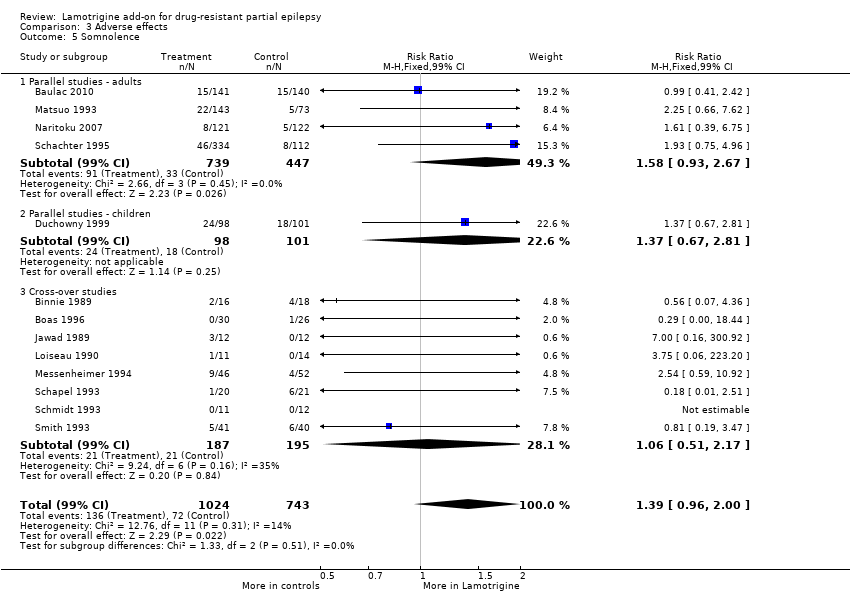
Comparison 3 Adverse effects, Outcome 5 Somnolence.
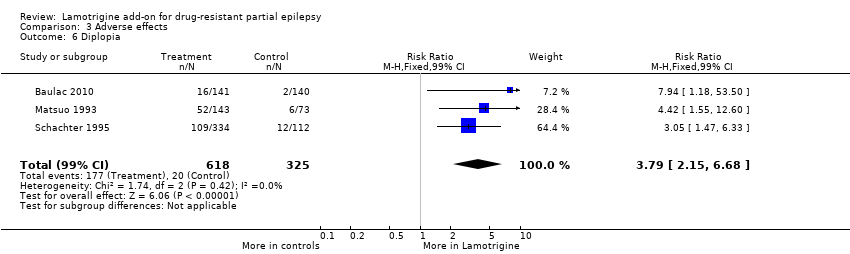
Comparison 3 Adverse effects, Outcome 6 Diplopia.

Comparison 3 Adverse effects, Outcome 7 Headache.
| Lamotrigine versus placebo for drug‐resistant partial epilepsy | ||||||
| Patient or population: participants with drug‐resistant partial epilepsy Settings: outpatient setting Intervention: Lamotrigine versus placebo | ||||||
| Outcomes | Illustrative comparative risks* (95% CI) | Relative effect | No of Participants | Quality of the evidence | Comments | |
| Assumed risk | Corresponding risk | |||||
| Placebo | Lamotrigine | |||||
| 50% or greater reduction in seizure frequency ‐ ITT analysis | 157 per 1000 | 283 per 1000 | RR 1.80 (95% CI 1.45 to 2.23) | 1322 | ⊕⊕⊕⊕ | RR >1 indicates outcome is more likely in Lamotrigine group |
| Treatment withdrawal | 159 per 1000 | 176 per 1000 | RR 1.11 (95% CI 0.90 to 1.36) | 1805 | ⊕⊕⊕⊕ | RR >1 indicates outcome is more likely in Lamotrigine group |
| Ataxia | 45 per 1000 | 150 per 1000 | RR 3.34 (99% CI 2.01 to 5.55) | 1524 | ⊕⊕⊕⊝ | RR >1 indicates outcome is more likely in Lamotrigine group |
| Dizziness | 128 per 1000 | 256 per 1000 | RR 2.00 (99% CI 1.51 to 2.64) | 1767 | ⊕⊕⊕⊕ | RR >1 indicates outcome is more likely in Lamotrigine group |
| Fatigue | 113 per 1000 | 93 per 1000 | RR 0.82 (99% CI 0.55 to 1.22) | 1551 (12 studies) | ⊕⊕⊕⊕ | RR >1 indicates outcome is more likely in Lamotrigine group |
| Nausea | 83 per 1000 | 150 per 1000 | RR 1.81 (99% CI 1.22 to 2.68) | 1486 | ⊕⊕⊕⊕ | RR >1 indicates outcome is more likely in Lamotrigine group |
| *The basis for the assumed risk (e.g. the median control group risk across studies) is provided in footnotes4. The corresponding risk (and its 95% confidence interval) is based on the assumed risk in the comparison group and the relative effect of the intervention (and its 95% CI). | ||||||
| GRADE Working Group grades of evidence | ||||||
| 1 One or two studies do not contribute to the analysis, but no other bias. 2 All studies contributed to the analysis. 3 Wide confidence intervals. 4Assumed risk is calculated as the event rate in the control group per 1000 people (number of events divided by the number of participants receiving control treatment). | ||||||
| Outcome | Study | Number tested | Lamotrigine mean | Placebo mean |
| Stroop time | 41 | 93.98 | 98.39 | |
| Stroop error | 44 | 2.18 | 2.41 | |
| Stroop colour word (Total score) | 10 | 32.4+/‐10.9 | 35.6+/‐9.42 | |
| Number cancellation: AC | 44 | 51.36 | 49.7 | |
| Number cancellation: AE | 43 | 3.6 | 3.04 | |
| Number cancellation: BC | 42 | 48.21 | 48.54 | |
| Number cancellation: C | 42 | 38.19 | 39.29 | |
| Critical flicker fusion | 40 | 30.44 | 30.37 | |
| Choice reaction time | 40 | 0.675 | 0.669 | |
| Digit symbol (Scaled score) | 10 | 5 +/‐2.45 | 6.6 +/‐ 2.71 | |
| Rey complex figure recall percentile | 10 | 22+/‐17.51 | 30.5+/‐27.33 | |
| Trail making part B percentile | 10 | 26+/‐30.35 | 30.5+/‐32.09 |
| Outcome | Number tested | Lamotrigine ‐ Mean | Placebo ‐ Mean | Clinical relevance |
| PSYCHOLOGICAL: | ||||
| Depression | 54 | 4.24 | 4.26 | No significant difference |
| Happiness | 51 | 3.8 | 1.96 | Higher scores in LTG group; P = 0.003 |
| Mood | 50 | 24.36 | 26.8 | No significant difference |
| Self‐esteem | 50 | 30.06 | 29.16 | No significant difference |
| Mastery | 50 | 20.02 | 18.78 | Higher scores in LTG group; P = 0.003 |
| Anxiety | 54 | 6.87 | 6.83 | No significant difference |
| PHYSICAL (Nottingham Health Profile): | ||||
| Energy | 53 | 0.68 | 0.68 | No significant difference |
| Pain | 53 | 0.6 | 0.69 | No significant difference |
| Emotional reaction | 53 | 1.96 | 1.96 | No significant difference |
| Sleep | 53 | 0.89 | 0.76 | No significant difference |
| Social isolation | 53 | 0.92 | 0.94 | No significant difference |
| Physical mobility | 53 | 0.96 | 0.91 | No significant difference |
| SEIZURE SEVERITY SCALE: | ||||
| Percept | 53 | 25.19 | 25.47 | No significant difference |
| Ictal | 53 | 19.47 | 20.53 | Less severe seizures in LTG group; P = 0.017 |
| Caregivers | 53 | 20.35 | 21.80 | Less severe seizures in LTG group; P = 0.035 |
| Outcome or subgroup title | No. of studies | No. of participants | Statistical method | Effect size |
| 1 Intention‐to‐treat analysis Show forest plot | 12 | Risk Ratio (M‐H, Fixed, 95% CI) | Subtotals only | |
| 1.1 Cross‐over | 8 | 382 | Risk Ratio (M‐H, Fixed, 95% CI) | 2.58 [1.44, 4.61] |
| 1.2 Parallel group lamotrigine ‐ 300 mg | 1 | 144 | Risk Ratio (M‐H, Fixed, 95% CI) | 1.23 [0.57, 2.67] |
| 1.3 Parallel group lamotrigine ‐ 500 mg | 1 | 145 | Risk Ratio (M‐H, Fixed, 95% CI) | 2.13 [1.08, 4.20] |
| 1.4 Parallel group (children) | 1 | 199 | Risk Ratio (M‐H, Fixed, 95% CI) | 2.64 [1.59, 4.38] |
| 1.5 Parallel Group ‐Adults‐Lamotrigine ER | 1 | 243 | Risk Ratio (M‐H, Fixed, 95% CI) | 1.70 [1.16, 2.50] |
| 1.6 Parallel Group 300 to 600mg | 1 | 282 | Risk Ratio (M‐H, Fixed, 95% CI) | 1.13 [0.74, 1.75] |
| 1.7 Any dose lamotrigine, adults or children | 12 | 1322 | Risk Ratio (M‐H, Fixed, 95% CI) | 1.80 [1.45, 2.23] |
| 2 Worst case scenario Show forest plot | 12 | 1322 | Risk Ratio (M‐H, Fixed, 95% CI) | 0.97 [0.82, 1.15] |
| 3 Best case scenario Show forest plot | 12 | 1322 | Risk Ratio (M‐H, Fixed, 95% CI) | 2.88 [2.36, 3.50] |
| Outcome or subgroup title | No. of studies | No. of participants | Statistical method | Effect size |
| 1 Withdrawal from treatment Show forest plot | 14 | 1805 | Risk Ratio (M‐H, Fixed, 95% CI) | 1.11 [0.90, 1.36] |
| 1.1 Parallel studies ‐ adults | 4 | 1186 | Risk Ratio (M‐H, Fixed, 95% CI) | 1.16 [0.90, 1.50] |
| 1.2 Parallel studies in children | 1 | 199 | Risk Ratio (M‐H, Fixed, 95% CI) | 0.80 [0.42, 1.52] |
| 1.3 Cross‐over studies | 8 | 382 | Risk Ratio (M‐H, Fixed, 95% CI) | 1.82 [0.89, 3.72] |
| 1.4 Parallel Studies in Infants | 1 | 38 | Risk Ratio (M‐H, Fixed, 95% CI) | 0.69 [0.45, 1.06] |
| Outcome or subgroup title | No. of studies | No. of participants | Statistical method | Effect size |
| 1 Ataxia Show forest plot | 12 | 1524 | Risk Ratio (M‐H, Fixed, 99% CI) | 3.34 [2.01, 5.55] |
| 1.1 Parallel studies ‐ adults | 3 | 943 | Risk Ratio (M‐H, Fixed, 99% CI) | 3.40 [1.67, 6.90] |
| 1.2 Parallel studies ‐ children | 1 | 199 | Risk Ratio (M‐H, Fixed, 99% CI) | 5.15 [0.72, 36.64] |
| 1.3 Cross‐over studies | 8 | 382 | Risk Ratio (M‐H, Fixed, 99% CI) | 2.98 [1.38, 6.41] |
| 2 Dizziness Show forest plot | 13 | 1767 | Risk Ratio (M‐H, Fixed, 99% CI) | 2.00 [1.51, 2.64] |
| 2.1 Parallel studies ‐ adults | 4 | 1186 | Risk Ratio (M‐H, Fixed, 99% CI) | 2.09 [1.49, 2.94] |
| 2.2 Parallel studies ‐ children | 1 | 199 | Risk Ratio (M‐H, Fixed, 99% CI) | 4.33 [1.27, 14.79] |
| 2.3 Cross‐over studies | 8 | 382 | Risk Ratio (M‐H, Fixed, 99% CI) | 1.41 [0.83, 2.38] |
| 3 Fatigue Show forest plot | 12 | 1551 | Risk Ratio (M‐H, Fixed, 99% CI) | 0.82 [0.55, 1.22] |
| 3.1 Parallel studies ‐ adults | 3 | 970 | Risk Ratio (M‐H, Fixed, 99% CI) | 0.81 [0.46, 1.42] |
| 3.2 Parallel studies ‐ children | 1 | 199 | Risk Ratio (M‐H, Fixed, 99% CI) | 1.89 [0.54, 6.63] |
| 3.3 Cross‐over studies | 8 | 382 | Risk Ratio (M‐H, Fixed, 99% CI) | 0.65 [0.34, 1.23] |
| 4 Nausea Show forest plot | 12 | 1486 | Risk Ratio (M‐H, Fixed, 99% CI) | 1.81 [1.22, 2.68] |
| 4.1 Parallel Studies ‐ adults | 3 | 905 | Risk Ratio (M‐H, Fixed, 99% CI) | 1.68 [1.02, 2.78] |
| 4.2 Parallel studies ‐ children | 1 | 199 | Risk Ratio (M‐H, Fixed, 99% CI) | 5.67 [0.81, 39.69] |
| 4.3 Cross‐over studies | 8 | 382 | Risk Ratio (M‐H, Fixed, 99% CI) | 1.67 [0.85, 3.29] |
| 5 Somnolence Show forest plot | 13 | 1767 | Risk Ratio (M‐H, Fixed, 99% CI) | 1.39 [0.96, 2.00] |
| 5.1 Parallel studies ‐ adults | 4 | 1186 | Risk Ratio (M‐H, Fixed, 99% CI) | 1.58 [0.93, 2.67] |
| 5.2 Parallel studies ‐ children | 1 | 199 | Risk Ratio (M‐H, Fixed, 99% CI) | 1.37 [0.67, 2.81] |
| 5.3 Cross‐over studies | 8 | 382 | Risk Ratio (M‐H, Fixed, 99% CI) | 1.06 [0.51, 2.17] |
| 6 Diplopia Show forest plot | 3 | 943 | Risk Ratio (M‐H, Fixed, 99% CI) | 3.79 [2.15, 6.68] |
| 7 Headache Show forest plot | 5 | 1385 | Risk Ratio (M‐H, Fixed, 99% CI) | 1.13 [0.87, 1.45] |