Graft type for femoro‐popliteal bypass surgery
Information
- DOI:
- https://doi.org/10.1002/14651858.CD001487.pub3Copy DOI

- Database:
-
- Cochrane Database of Systematic Reviews
- Version published:
-
- 11 February 2018see what's new
- Type:
-
- Intervention
- Stage:
-
- Review
- Cochrane Editorial Group:
-
Cochrane Vascular Group
- Copyright:
-
- Copyright © 2018 The Cochrane Collaboration. Published by John Wiley & Sons, Ltd.
Article metrics
Altmetric:
Cited by:
Authors
Contributions of authors
GA: identified relevant trials, assessed quality for all included trials, extracted data and updated the text of review.
CT: identified relevant trials, assessed quality, extracted data, wrote text of previous version of review, and reviewed updated text.
Sources of support
Internal sources
-
No sources of support supplied
External sources
-
Chief Scientist Office, Scottish Government Health Directorates, The Scottish Government, UK.
The editorial base of Cochrane Vascular is supported by the Chief Scientist Office.
Declarations of interest
GA: has declared that he previously held a National Institute for Health Research Academic clinical fellowship (2011‐2014) and that he received funds for a grant from Heath and Care Research Wales regarding research for patient and public benefit (grant number 1198); there are no known conflicts of interest with this review.
CT: has declared that he received money from Cook Medical for travel/accommodation/meeting expenses unrelated to this review and that he received funds for a grant from Heath and Care Research Wales regarding research for patient and public benefit (grant number 1198); there are no known conflicts of interest with this review.
Acknowledgements
We are grateful to Drs Cathryn Broderick, Marlene Stewart and Karen Welch for their invaluable help and assistance in the preparation of this review.
Version history
| Published | Title | Stage | Authors | Version |
| 2018 Feb 11 | Graft type for femoro‐popliteal bypass surgery | Review | Graeme K Ambler, Christopher P Twine | |
| 2010 May 12 | Graft type for femoro‐popliteal bypass surgery | Review | Christopher P Twine, Alexander D McLain | |
| 1999 Apr 26 | Graft type for femoro‐popliteal bypass surgery | Review | Nizam Mamode, Roy N Scott | |
Differences between protocol and review
For this update, the risk of bias in all included studies was assessed using Cochrane's 'Risk of bias' tool and a 'Summary of findings' table has been added.
We reworded the objective so to adhere better to the Cochane guidelines.
We amended the 'types of studies' to include all possible graft types.
We provided definitions of the outcomes primary and secondary patency.
We analysed and presented data into groups according to whether the distal anastomosis was above or below the knee.
Keywords
MeSH
Medical Subject Headings (MeSH) Keywords
- Arterial Occlusive Diseases [*surgery];
- Blood Vessel Prosthesis Implantation;
- Femoral Artery [*surgery];
- Intermittent Claudication [surgery];
- Leg [*blood supply];
- Polyethylene Terephthalates;
- Polytetrafluoroethylene;
- Popliteal Artery [*surgery];
- Randomized Controlled Trials as Topic;
- Saphenous Vein [*transplantation];
- Transplantation, Autologous;
- Umbilical Veins [*transplantation];
- Vascular Surgical Procedures;
Medical Subject Headings Check Words
Humans;
PICOs


Risk of bias graph: review authors' judgements about each risk of bias item presented as percentages across all included studies.

Risk of bias summary: review authors' judgements about each risk of bias item for each included study.

Comparison 1 Above‐knee autologous vein versus all other graft materials, Outcome 1 Primary patency at 3 months.

Comparison 1 Above‐knee autologous vein versus all other graft materials, Outcome 2 Primary patency at 6 months.
Comparison 1 Above‐knee autologous vein versus all other graft materials, Outcome 3 Primary patency at 12 months.

Comparison 1 Above‐knee autologous vein versus all other graft materials, Outcome 4 Primary patency at 24 months.

Comparison 1 Above‐knee autologous vein versus all other graft materials, Outcome 5 Primary patency at 60 months.

Comparison 1 Above‐knee autologous vein versus all other graft materials, Outcome 6 Secondary patency at 3 months.

Comparison 1 Above‐knee autologous vein versus all other graft materials, Outcome 7 Secondary patency at 6 months.
Comparison 1 Above‐knee autologous vein versus all other graft materials, Outcome 8 Secondary patency at 12 months.
Comparison 1 Above‐knee autologous vein versus all other graft materials, Outcome 9 Secondary patency at 24 months.
Comparison 1 Above‐knee autologous vein versus all other graft materials, Outcome 10 Secondary patency at 60 months.

Comparison 2 Above‐knee PTFE versus all other graft materials, Outcome 1 Primary patency at 3 months.

Comparison 2 Above‐knee PTFE versus all other graft materials, Outcome 2 Primary patency at 6 months.

Comparison 2 Above‐knee PTFE versus all other graft materials, Outcome 3 Primary patency at 12 months.
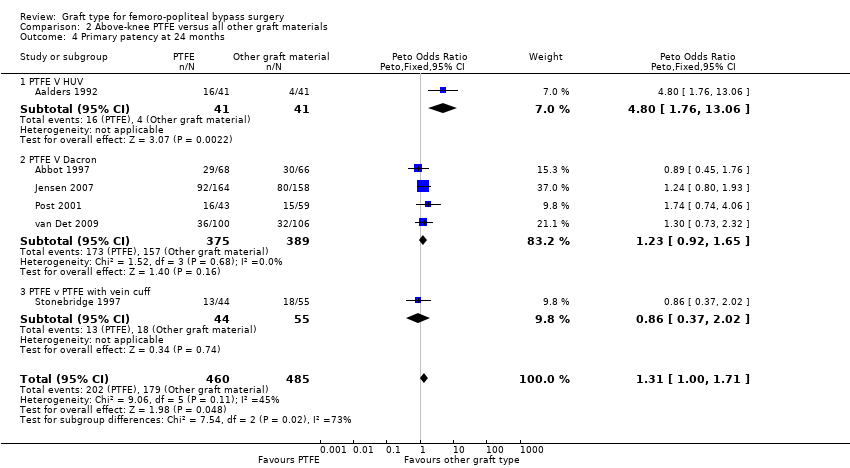
Comparison 2 Above‐knee PTFE versus all other graft materials, Outcome 4 Primary patency at 24 months.

Comparison 2 Above‐knee PTFE versus all other graft materials, Outcome 5 Primary patency at 60 months.

Comparison 2 Above‐knee PTFE versus all other graft materials, Outcome 6 Secondary patency at 3 months.

Comparison 2 Above‐knee PTFE versus all other graft materials, Outcome 7 Secondary patency at 6 months.

Comparison 2 Above‐knee PTFE versus all other graft materials, Outcome 8 Secondary patency at 12 months.

Comparison 2 Above‐knee PTFE versus all other graft materials, Outcome 9 Secondary patency at 24 months.

Comparison 2 Above‐knee PTFE versus all other graft materials, Outcome 10 Secondary patency at 60 months.

Comparison 2 Above‐knee PTFE versus all other graft materials, Outcome 11 Limb salvage at 1 month.

Comparison 2 Above‐knee PTFE versus all other graft materials, Outcome 12 Limb salvage at 24 months.

Comparison 3 Above‐knee heparin bonded Dacron versus all other graft materials, Outcome 1 Primary patency at 12 months.

Comparison 3 Above‐knee heparin bonded Dacron versus all other graft materials, Outcome 2 Primary patency at 24 months.
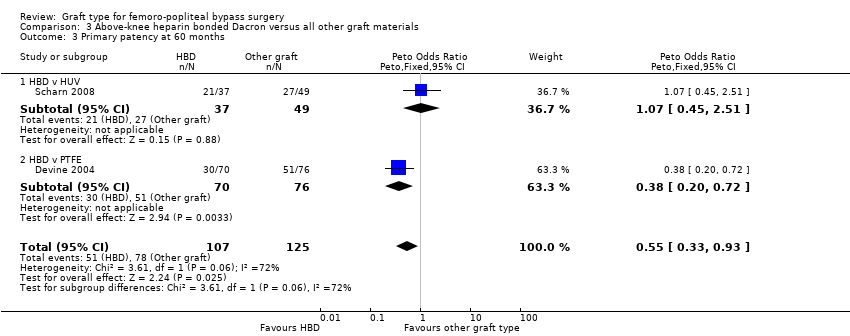
Comparison 3 Above‐knee heparin bonded Dacron versus all other graft materials, Outcome 3 Primary patency at 60 months.

Comparison 4 Above‐knee externally supported graft versus unsupported graft materials, Outcome 1 Primary patency at 6 months.

Comparison 4 Above‐knee externally supported graft versus unsupported graft materials, Outcome 2 Primary patency at 12 months.

Comparison 4 Above‐knee externally supported graft versus unsupported graft materials, Outcome 3 Primary patency at 24 months.

Comparison 4 Above‐knee externally supported graft versus unsupported graft materials, Outcome 4 Secondary patency at 6 months.

Comparison 4 Above‐knee externally supported graft versus unsupported graft materials, Outcome 5 Secondary patency at 12 months.

Comparison 4 Above‐knee externally supported graft versus unsupported graft materials, Outcome 6 Secondary patency at 24 months.

Comparison 5 Above‐knee polyurethane (PUR) versus all other graft materials, Outcome 1 Primary patency at 3 months.

Comparison 5 Above‐knee polyurethane (PUR) versus all other graft materials, Outcome 2 Primary patency at 6 months.

Comparison 5 Above‐knee polyurethane (PUR) versus all other graft materials, Outcome 3 Primary patency at 12 months.

Comparison 5 Above‐knee polyurethane (PUR) versus all other graft materials, Outcome 4 Secondary patency at 3 months.

Comparison 5 Above‐knee polyurethane (PUR) versus all other graft materials, Outcome 5 Secondary patency at 6 months.

Comparison 5 Above‐knee polyurethane (PUR) versus all other graft materials, Outcome 6 Secondary patency at 12 months.

Comparison 6 Below‐knee PTFE versus all other graft materials, Outcome 1 Primary patency at 6 months.

Comparison 6 Below‐knee PTFE versus all other graft materials, Outcome 2 Primary patency at 12 months.

Comparison 6 Below‐knee PTFE versus all other graft materials, Outcome 3 Primary patency at 24 months.
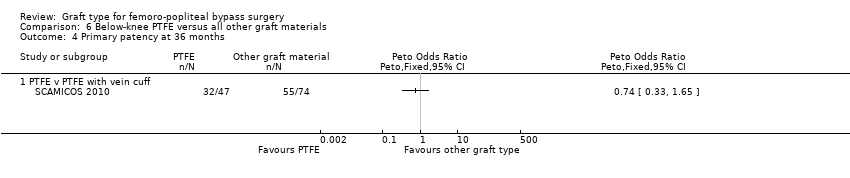
Comparison 6 Below‐knee PTFE versus all other graft materials, Outcome 4 Primary patency at 36 months.

Comparison 6 Below‐knee PTFE versus all other graft materials, Outcome 5 Secondary patency at 3 months.

Comparison 6 Below‐knee PTFE versus all other graft materials, Outcome 6 Secondary patency at 6 months.

Comparison 6 Below‐knee PTFE versus all other graft materials, Outcome 7 Secondary patency at 12 months.

Comparison 6 Below‐knee PTFE versus all other graft materials, Outcome 8 Secondary patency at 24 months.

Comparison 6 Below‐knee PTFE versus all other graft materials, Outcome 9 Secondary patency at 36 months.

Comparison 6 Below‐knee PTFE versus all other graft materials, Outcome 10 Limb salvage at 12 months.
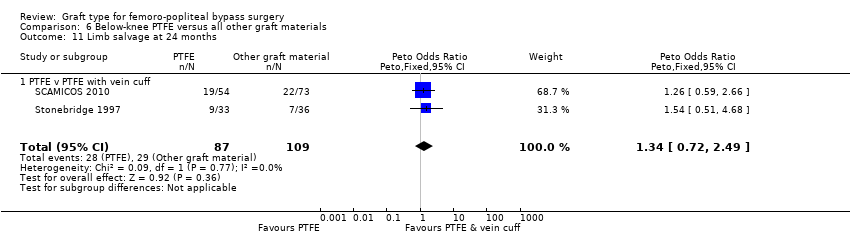
Comparison 6 Below‐knee PTFE versus all other graft materials, Outcome 11 Limb salvage at 24 months.

Comparison 7 Below‐knee heparin bonded Dacron versus all other graft materials, Outcome 1 Primary patency at 3 months.

Comparison 7 Below‐knee heparin bonded Dacron versus all other graft materials, Outcome 2 Primary patency at 6 months.

Comparison 7 Below‐knee heparin bonded Dacron versus all other graft materials, Outcome 3 Primary patency at 12 months.

Comparison 7 Below‐knee heparin bonded Dacron versus all other graft materials, Outcome 4 Primary patency at 24 months.

Comparison 7 Below‐knee heparin bonded Dacron versus all other graft materials, Outcome 5 Primary patency at 60 months.
| Autologous vein compared to other graft types for above‐knee femoro‐popliteal bypass surgery | ||||||
| Patient or population: people with peripheral vascular disease requiring above‐knee femoro‐popliteal bypass surgery | ||||||
| Outcomes | Anticipated absolute effects* (95% CI) | Relative effect | № of limbs | Quality of the evidence | Comments | |
| Risk with other graft types | Risk with autologous vein | |||||
| Primary patency (24 months) | Study population | OR 0.59 | 422 | ⊕⊕⊝⊝ | 92 fewer autologous vein grafts per 1000 (10 to 152 grafts per 1000) lose primary patency by 24 months compared to other grafts studied | |
| 275 per 1000 | 183 per 1000 | |||||
| Primary patency (60 months) | Study population | OR 0.47 | 269 | ⊕⊕⊕⊝ | 172 fewer autologous vein grafts per 1000 (54 to 264 grafts per 1000) lose primary patency by 60 months compared to other grafts studied | |
| 451 per 1000 | 279 per 1000 | |||||
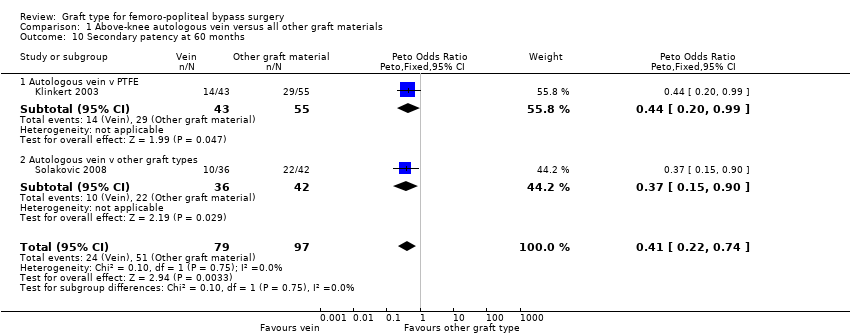
| Secondary patency (60 months) | Study population | OR 0.41 | 176 | ⊕⊕⊝⊝ | 213 fewer autologous vein grafts per 1000 (75 to 330 grafts per 1000) lose secondary patency by 60 months compared to other grafts studied | |
| 526 per 1000 | 313 per 1000 | |||||
| Limb salvage | ‐ | ‐ | ‐ | ‐ | ‐ | No studies of these graft types reported on this outcome |
| *The risk in the intervention group (and its 95% confidence interval) is based on the assumed risk in the comparison group and the relative effect of the intervention (and its 95% CI). | ||||||
| GRADE Working Group grades of evidence | ||||||
| 1 Downgraded due to serious risk of bias resulting from lack of blinding and poor randomisation techniques | ||||||
| PTFE compared to Dacron for above‐knee femoro‐popliteal bypass surgery | ||||||
| Patient or population: people with peripheral vascular disease requiring above‐knee femoro‐popliteal bypass surgery | ||||||
| Outcomes | Anticipated absolute effects* (95% CI) | Relative effect | № of limbs | Quality of the evidence | Comments | |
| Risk with Dacron | Risk with PTFE | |||||
| Primary patency (24 months) | Study population | OR 1.23 | 764 | ⊕⊕⊝⊝ | Our confidence in the effect is limited and this may differ substantially from the estimate of the effect | |
| 404 per 1000 | 454 per 1000 | |||||
| Primary patency (60 months) | Study population | OR 1.67 | 247 | ⊕⊕⊝⊝ | Our confidence in the effect is limited and this may differ substantially from the estimate of the effect | |
| 606 per 1000 | 720 per 1000 | |||||
| Secondary patency (24 months) | Study population | OR 1.54 | 528 | ⊕⊕⊝⊝ | 81 more PTFE grafts per 1000 (7 to 168 per 1000) suffer from failed secondary patency by 24 months compared to Dacron | |
| 212 per 1000 | 293 per 1000 | |||||
| Limb salvage (24 months) | Study population | OR 0.82 | 322 | ⊕⊕⊝⊝ | Our confidence in the effect is limited and this may differ substantially from the estimate of the effect | |
| 44 per 1000 | 37 per 1000 | |||||
| *The risk in the intervention group (and its 95% confidence interval) is based on the assumed risk in the comparison group and the relative effect of the intervention (and its 95% CI). | ||||||
| GRADE Working Group grades of evidence | ||||||
| 1 Downgraded because of serious risk of bias due to lack of blinding and poor randomisation techniques | ||||||
| Externally supported graft compared to unsupported graft for above‐knee femoro‐popliteal bypass surgery | ||||||
| Patient or population: people with peripheral vascular disease requiring above‐knee femoro‐popliteal bypass surgery | ||||||
| Outcomes | Anticipated absolute effects* (95% CI) | Relative effect | № of limbs | Quality of the evidence | Comments | |
| Risk with unsupported graft | Risk with externally supported graft | |||||
| Primary patency (24 months) | Study population | OR 2.08 | 270 | ⊕⊕⊝⊝ | 180 fewer unsupported prosthetic grafts per 1000 (61 to 293 grafts per 1000) lose primary patency by 24 months compared to externally supported prosthetic grafts | |
| 376 per 1000 | 556 per 1000 | |||||
| Primary patency (60 months) | ‐ | ‐ | ‐ | ‐ | ‐ | No studies comparing supported and unsupported Dacron reported on primary patency at 60 months |
| Secondary patency (24 months) | Study population | OR 2.25 | 236 | ⊕⊕⊝⊝ | 143 fewer unsupported Dacron grafts per 1000 (32 to 281 grafts per 1,000) lose secondary patency by 24 months compared to externally supported Dacron grafts | |
| 165 per 1000 | 308 per 1000 | |||||
| Limb salvage | ‐ | ‐ | ‐ | ‐ | ‐ | No studies of these graft types reported on this outcome |
| *The risk in the intervention group (and its 95% confidence interval) is based on the assumed risk in the comparison group and the relative effect of the intervention (and its 95% CI). | ||||||
| GRADE Working Group grades of evidence | ||||||
| 1 Downgraded because of serious risk of bias due to lack of blinding and poor randomisation techniques | ||||||
| PTFE compared to PTFE with vein cuff for below‐knee femoro‐popliteal bypass surgery | ||||||
| Patient or population: people with peripheral vascular disease requiring below‐knee femoro‐popliteal bypass surgery | ||||||
| Outcomes | Anticipated absolute effects* (95% CI) | Relative effect | № of limbs | Quality of the evidence | Comments | |
| Risk with PTFE with vein cuff | Risk with PTFE | |||||
| Primary patency (24 months) | Study population | OR 1.08 | 182 | ⊕⊝⊝⊝ | Findings from two small trials were inconsistent so our confidence in the effect is limited and this may differ substantially from the estimate of the effect | |
| 626 per 1000 | 644 per 1000 | |||||
| Primary patency (60 months) | ‐ | ‐ | ‐ | ‐ | ‐ | No studies comparing PTFE with and without a vein cuff for below‐knee bypass reported on primary patency at 60 months |
| Secondary patency (24 months) | Study population | OR 1.22 | 181 | ⊕⊝⊝⊝ | Findings from two small trials were inconsistent so our confidence in the effect is limited and this may differ substantially from the estimate of the effect | |
| 557 per 1000 | 605 per 1000 | |||||
| Limb salvage (24 months) | Study population | OR 1.34 | 196 | ⊕⊕⊝⊝ | Our confidence in the effect is limited and this may differ substantially from the estimate of the effect | |
| 266 per 1000 | 327 per 1000 | |||||
| *The risk in the intervention group (and its 95% confidence interval) is based on the assumed risk in the comparison group and the relative effect of the intervention (and its 95% CI). | ||||||
| GRADE Working Group grades of evidence | ||||||
| 1 Downgraded due to serious risk of bias resulting from lack of blinding and poor randomisation techniques | ||||||
| Outcome or subgroup title | No. of studies | No. of participants | Statistical method | Effect size |
| 1 Primary patency at 3 months Show forest plot | 4 | 466 | Peto Odds Ratio (Peto, Fixed, 95% CI) | 1.20 [0.58, 2.48] |
| 1.1 Autologous vein v PTFE | 2 | 249 | Peto Odds Ratio (Peto, Fixed, 95% CI) | 1.27 [0.41, 3.97] |
| 1.2 Autologous vein v other graft types | 2 | 217 | Peto Odds Ratio (Peto, Fixed, 95% CI) | 1.16 [0.45, 2.96] |
| 2 Primary patency at 6 months Show forest plot | 4 | 452 | Peto Odds Ratio (Peto, Fixed, 95% CI) | 1.01 [0.56, 1.83] |
| 2.1 Autologous vein v PTFE | 2 | 245 | Peto Odds Ratio (Peto, Fixed, 95% CI) | 1.12 [0.45, 2.78] |
| 2.2 Autologous vein v other graft types | 2 | 207 | Peto Odds Ratio (Peto, Fixed, 95% CI) | 0.94 [0.43, 2.05] |
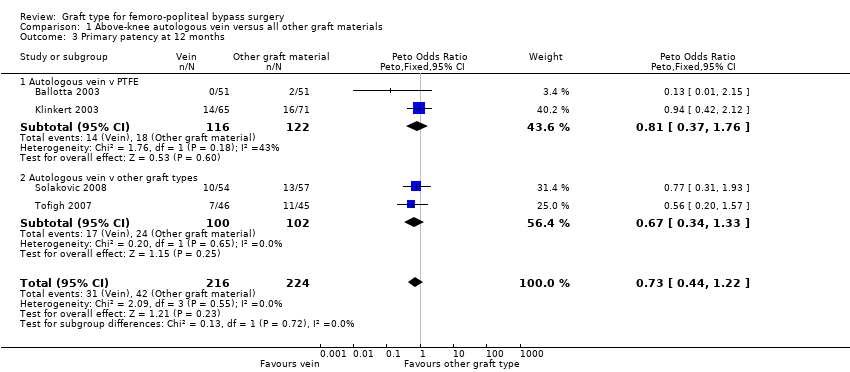
| 3 Primary patency at 12 months Show forest plot | 4 | 440 | Peto Odds Ratio (Peto, Fixed, 95% CI) | 0.73 [0.44, 1.22] |
| 3.1 Autologous vein v PTFE | 2 | 238 | Peto Odds Ratio (Peto, Fixed, 95% CI) | 0.81 [0.37, 1.76] |
| 3.2 Autologous vein v other graft types | 2 | 202 | Peto Odds Ratio (Peto, Fixed, 95% CI) | 0.67 [0.34, 1.33] |
| 4 Primary patency at 24 months Show forest plot | 4 | 422 | Peto Odds Ratio (Peto, Fixed, 95% CI) | 0.59 [0.37, 0.94] |
| 4.1 Autologous vein vs PTFE | 2 | 232 | Peto Odds Ratio (Peto, Fixed, 95% CI) | 0.67 [0.34, 1.33] |
| 4.2 Autologous vein vs other graft types | 2 | 190 | Peto Odds Ratio (Peto, Fixed, 95% CI) | 0.52 [0.28, 0.99] |
| 5 Primary patency at 60 months Show forest plot | 3 | 269 | Peto Odds Ratio (Peto, Fixed, 95% CI) | 0.47 [0.28, 0.80] |
| 5.1 Autologous vein v PTFE | 2 | 191 | Peto Odds Ratio (Peto, Fixed, 95% CI) | 0.48 [0.25, 0.95] |
| 5.2 Autologous vein vs other graft type | 1 | 78 | Peto Odds Ratio (Peto, Fixed, 95% CI) | 0.44 [0.18, 1.07] |
| 6 Secondary patency at 3 months Show forest plot | 3 | 364 | Peto Odds Ratio (Peto, Fixed, 95% CI) | 1.05 [0.47, 2.32] |
| 6.1 Autologous vein v PTFE | 1 | 147 | Peto Odds Ratio (Peto, Fixed, 95% CI) | 1.08 [0.30, 3.87] |
| 6.2 Autologous vein v other graft types | 2 | 217 | Peto Odds Ratio (Peto, Fixed, 95% CI) | 1.03 [0.37, 2.83] |
| 7 Secondary patency at 6 months Show forest plot | 3 | 351 | Peto Odds Ratio (Peto, Fixed, 95% CI) | 0.95 [0.49, 1.82] |
| 7.1 Autologous vein v PTFE | 1 | 143 | Peto Odds Ratio (Peto, Fixed, 95% CI) | 0.98 [0.36, 2.69] |
| 7.2 Autologous vein v other graft types | 2 | 208 | Peto Odds Ratio (Peto, Fixed, 95% CI) | 0.92 [0.39, 2.19] |
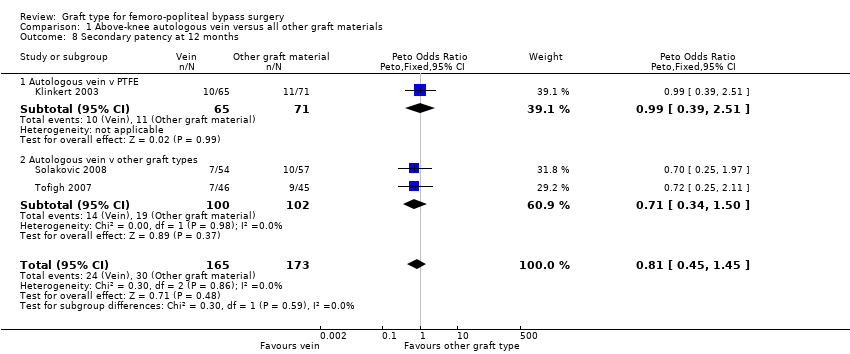
| 8 Secondary patency at 12 months Show forest plot | 3 | 338 | Peto Odds Ratio (Peto, Fixed, 95% CI) | 0.81 [0.45, 1.45] |
| 8.1 Autologous vein v PTFE | 1 | 136 | Peto Odds Ratio (Peto, Fixed, 95% CI) | 0.99 [0.39, 2.51] |
| 8.2 Autologous vein v other graft types | 2 | 202 | Peto Odds Ratio (Peto, Fixed, 95% CI) | 0.71 [0.34, 1.50] |
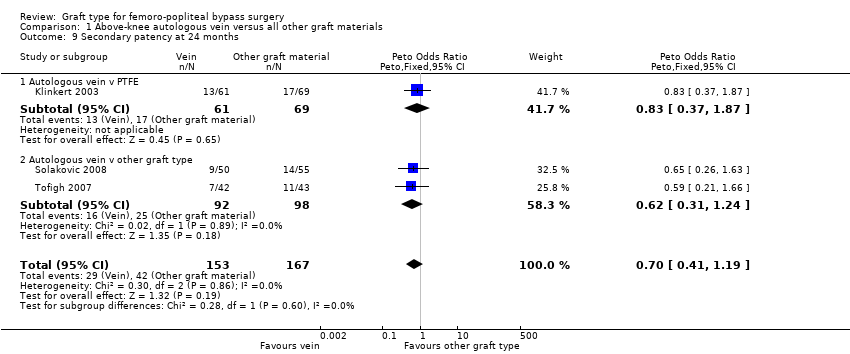
| 9 Secondary patency at 24 months Show forest plot | 3 | 320 | Peto Odds Ratio (Peto, Fixed, 95% CI) | 0.70 [0.41, 1.19] |
| 9.1 Autologous vein v PTFE | 1 | 130 | Peto Odds Ratio (Peto, Fixed, 95% CI) | 0.83 [0.37, 1.87] |
| 9.2 Autologous vein v other graft type | 2 | 190 | Peto Odds Ratio (Peto, Fixed, 95% CI) | 0.62 [0.31, 1.24] |
| 10 Secondary patency at 60 months Show forest plot | 2 | 176 | Peto Odds Ratio (Peto, Fixed, 95% CI) | 0.41 [0.22, 0.74] |
| 10.1 Autologous vein v PTFE | 1 | 98 | Peto Odds Ratio (Peto, Fixed, 95% CI) | 0.44 [0.20, 0.99] |
| 10.2 Autologous vein v other graft types | 1 | 78 | Peto Odds Ratio (Peto, Fixed, 95% CI) | 0.37 [0.15, 0.90] |
| Outcome or subgroup title | No. of studies | No. of participants | Statistical method | Effect size |
| 1 Primary patency at 3 months Show forest plot | 2 | 312 | Peto Odds Ratio (Peto, Fixed, 95% CI) | 2.36 [0.81, 6.87] |
| 1.1 PTFE v HUV | 1 | 93 | Peto Odds Ratio (Peto, Fixed, 95% CI) | 1.55 [0.26, 9.33] |
| 1.2 PTFE v Dacron | 1 | 219 | Peto Odds Ratio (Peto, Fixed, 95% CI) | 2.97 [0.78, 11.25] |
| 2 Primary patency at 6 months Show forest plot | 5 | 824 | Peto Odds Ratio (Peto, Fixed, 95% CI) | 2.11 [1.37, 3.25] |
| 2.1 PTFE v HUV | 1 | 90 | Peto Odds Ratio (Peto, Fixed, 95% CI) | 2.56 [0.69, 9.47] |
| 2.2 PTFE v Dacron | 2 | 421 | Peto Odds Ratio (Peto, Fixed, 95% CI) | 1.57 [0.79, 3.11] |
| 2.3 PTFE v PTFE with vein cuff | 1 | 139 | Peto Odds Ratio (Peto, Fixed, 95% CI) | 1.80 [0.57, 5.60] |
| 2.4 PTFE v FUSION BIOLINE | 1 | 174 | Peto Odds Ratio (Peto, Fixed, 95% CI) | 2.99 [1.43, 6.26] |
| 3 Primary patency at 12 months Show forest plot | 6 | 1088 | Peto Odds Ratio (Peto, Fixed, 95% CI) | 1.23 [0.93, 1.64] |
| 3.1 PTFE v HUV | 1 | 83 | Peto Odds Ratio (Peto, Fixed, 95% CI) | 3.17 [1.04, 9.64] |
| 3.2 PTFE v Dacron | 4 | 875 | Peto Odds Ratio (Peto, Fixed, 95% CI) | 1.24 [0.91, 1.70] |
| 3.3 PTFE v PTFE with vein cuff | 1 | 130 | Peto Odds Ratio (Peto, Fixed, 95% CI) | 0.64 [0.26, 1.56] |
| 4 Primary patency at 24 months Show forest plot | 6 | 945 | Peto Odds Ratio (Peto, Fixed, 95% CI) | 1.31 [1.00, 1.71] |
| 4.1 PTFE V HUV | 1 | 82 | Peto Odds Ratio (Peto, Fixed, 95% CI) | 4.80 [1.76, 13.06] |
| 4.2 PTFE V Dacron | 4 | 764 | Peto Odds Ratio (Peto, Fixed, 95% CI) | 1.23 [0.92, 1.65] |
| 4.3 PTFE v PTFE with vein cuff | 1 | 99 | Peto Odds Ratio (Peto, Fixed, 95% CI) | 0.86 [0.37, 2.02] |
| 5 Primary patency at 60 months Show forest plot | 3 | 316 | Peto Odds Ratio (Peto, Fixed, 95% CI) | 2.06 [1.28, 3.31] |
| 5.1 PTFE v HUV | 1 | 69 | Peto Odds Ratio (Peto, Fixed, 95% CI) | 3.75 [1.46, 9.62] |
| 5.2 PTFE v Dacron | 2 | 247 | Peto Odds Ratio (Peto, Fixed, 95% CI) | 1.67 [0.96, 2.90] |
| 6 Secondary patency at 3 months Show forest plot | 1 | Peto Odds Ratio (Peto, Fixed, 95% CI) | Totals not selected | |
| 6.1 PTFE v HUV | 1 | Peto Odds Ratio (Peto, Fixed, 95% CI) | 0.0 [0.0, 0.0] | |
| 7 Secondary patency at 6 months Show forest plot | 2 | 318 | Peto Odds Ratio (Peto, Fixed, 95% CI) | 1.32 [0.48, 3.62] |
| 7.1 PTFE v HUV | 1 | 93 | Peto Odds Ratio (Peto, Fixed, 95% CI) | 1.76 [0.42, 7.44] |
| 7.2 PTFE v Dacron | 1 | 225 | Peto Odds Ratio (Peto, Fixed, 95% CI) | 1.01 [0.25, 4.13] |
| 8 Secondary patency at 12 months Show forest plot | 4 | 806 | Peto Odds Ratio (Peto, Fixed, 95% CI) | 1.18 [0.80, 1.74] |
| 8.1 PTFE v HUV | 1 | 93 | Peto Odds Ratio (Peto, Fixed, 95% CI) | 1.60 [0.43, 5.89] |
| 8.2 PTFE v Dacron | 2 | 581 | Peto Odds Ratio (Peto, Fixed, 95% CI) | 1.19 [0.76, 1.86] |
| 8.3 PTFE v PTFE with vein cuff | 1 | 132 | Peto Odds Ratio (Peto, Fixed, 95% CI) | 0.99 [0.39, 2.52] |
| 9 Secondary patency at 24 months Show forest plot | 4 | 700 | Peto Odds Ratio (Peto, Fixed, 95% CI) | 1.66 [1.18, 2.33] |
| 9.1 PTFE V HUV | 1 | 93 | Peto Odds Ratio (Peto, Fixed, 95% CI) | 4.01 [1.44, 11.17] |
| 9.2 PTFE v Dacron | 2 | 528 | Peto Odds Ratio (Peto, Fixed, 95% CI) | 1.54 [1.04, 2.28] |
| 9.3 PTFE v PTFE with vein cuff | 1 | 79 | Peto Odds Ratio (Peto, Fixed, 95% CI) | 1.22 [0.48, 3.06] |
| 10 Secondary patency at 60 months Show forest plot | 2 | 260 | Peto Odds Ratio (Peto, Fixed, 95% CI) | 2.86 [1.73, 4.72] |
| 10.1 PTFE v HUV | 1 | 93 | Peto Odds Ratio (Peto, Fixed, 95% CI) | 3.87 [1.65, 9.05] |
| 10.2 PTFE v Dacron | 1 | 167 | Peto Odds Ratio (Peto, Fixed, 95% CI) | 2.43 [1.31, 4.53] |
| 11 Limb salvage at 1 month Show forest plot | 2 | 560 | Peto Odds Ratio (Peto, Fixed, 95% CI) | 0.68 [0.12, 3.98] |
| 11.1 PTFE v Dacron | 1 | 410 | Peto Odds Ratio (Peto, Fixed, 95% CI) | 0.14 [0.01, 2.20] |
| 11.2 PTFE v PTFE with vein cuff | 1 | 150 | Peto Odds Ratio (Peto, Fixed, 95% CI) | 2.02 [0.21, 19.72] |
| 12 Limb salvage at 24 months Show forest plot | 2 | 389 | Peto Odds Ratio (Peto, Fixed, 95% CI) | 0.73 [0.33, 1.62] |
| 12.1 PTFE v Dacron | 1 | 322 | Peto Odds Ratio (Peto, Fixed, 95% CI) | 0.82 [0.27, 2.48] |
| 12.2 PTFE v PTFE with vein cuff | 1 | 67 | Peto Odds Ratio (Peto, Fixed, 95% CI) | 0.64 [0.20, 2.04] |
| Outcome or subgroup title | No. of studies | No. of participants | Statistical method | Effect size |
| 1 Primary patency at 12 months Show forest plot | 2 | 294 | Peto Odds Ratio (Peto, Fixed, 95% CI) | 0.58 [0.34, 0.98] |
| 1.1 HBD v HUV | 1 | 123 | Peto Odds Ratio (Peto, Fixed, 95% CI) | 0.47 [0.20, 1.12] |
| 1.2 HBD v PTFE | 1 | 171 | Peto Odds Ratio (Peto, Fixed, 95% CI) | 0.65 [0.34, 1.25] |
| 2 Primary patency at 24 months Show forest plot | 2 | 282 | Peto Odds Ratio (Peto, Fixed, 95% CI) | 0.62 [0.38, 1.02] |
| 2.1 HBD v HUV | 1 | 117 | Peto Odds Ratio (Peto, Fixed, 95% CI) | 0.59 [0.26, 1.33] |
| 2.2 HBD v PTFE | 1 | 165 | Peto Odds Ratio (Peto, Fixed, 95% CI) | 0.64 [0.34, 1.19] |
| 3 Primary patency at 60 months Show forest plot | 2 | 232 | Peto Odds Ratio (Peto, Fixed, 95% CI) | 0.55 [0.33, 0.93] |
| 3.1 HBD v HUV | 1 | 86 | Peto Odds Ratio (Peto, Fixed, 95% CI) | 1.07 [0.45, 2.51] |
| 3.2 HBD v PTFE | 1 | 146 | Peto Odds Ratio (Peto, Fixed, 95% CI) | 0.38 [0.20, 0.72] |
| Outcome or subgroup title | No. of studies | No. of participants | Statistical method | Effect size |
| 1 Primary patency at 6 months Show forest plot | 2 | 299 | Peto Odds Ratio (Peto, Fixed, 95% CI) | 1.28 [0.71, 2.31] |
| 1.1 Externally supported dacron versus unsupported dacron | 1 | 253 | Peto Odds Ratio (Peto, Fixed, 95% CI) | 1.29 [0.69, 2.39] |
| 1.2 Externally supported PTFE versus unsupported PTFE | 1 | 46 | Peto Odds Ratio (Peto, Fixed, 95% CI) | 1.21 [0.16, 9.25] |
| 2 Primary patency at 12 months Show forest plot | 2 | 286 | Peto Odds Ratio (Peto, Fixed, 95% CI) | 1.78 [1.06, 2.98] |
| 2.1 Externally supported dacron versus unsupported dacron | 1 | 246 | Peto Odds Ratio (Peto, Fixed, 95% CI) | 1.71 [0.99, 2.93] |
| 2.2 Externally supported PTFE versus unsupported PTFE | 1 | 40 | Peto Odds Ratio (Peto, Fixed, 95% CI) | 2.73 [0.49, 15.28] |
| 3 Primary patency at 24 months Show forest plot | 2 | 270 | Peto Odds Ratio (Peto, Fixed, 95% CI) | 2.08 [1.29, 3.35] |
| 3.1 Externally supported dacron versus unsupported dacron | 1 | 240 | Peto Odds Ratio (Peto, Fixed, 95% CI) | 2.09 [1.26, 3.46] |
| 3.2 Externally supported PTFE versus unsupported PTFE | 1 | 30 | Peto Odds Ratio (Peto, Fixed, 95% CI) | 2.01 [0.46, 8.76] |
| 4 Secondary patency at 6 months Show forest plot | 1 | Peto Odds Ratio (Peto, Fixed, 95% CI) | Totals not selected | |
| 5 Secondary patency at 12 months Show forest plot | 1 | Peto Odds Ratio (Peto, Fixed, 95% CI) | Totals not selected | |
| 6 Secondary patency at 24 months Show forest plot | 1 | Peto Odds Ratio (Peto, Fixed, 95% CI) | Totals not selected | |
| Outcome or subgroup title | No. of studies | No. of participants | Statistical method | Effect size |
| 1 Primary patency at 3 months Show forest plot | 1 | Peto Odds Ratio (Peto, Fixed, 95% CI) | Totals not selected | |
| 2 Primary patency at 6 months Show forest plot | 1 | Peto Odds Ratio (Peto, Fixed, 95% CI) | Totals not selected | |
| 3 Primary patency at 12 months Show forest plot | 1 | Peto Odds Ratio (Peto, Fixed, 95% CI) | Totals not selected | |
| 4 Secondary patency at 3 months Show forest plot | 1 | Peto Odds Ratio (Peto, Fixed, 95% CI) | Totals not selected | |
| 5 Secondary patency at 6 months Show forest plot | 1 | Peto Odds Ratio (Peto, Fixed, 95% CI) | Totals not selected | |
| 6 Secondary patency at 12 months Show forest plot | 1 | Peto Odds Ratio (Peto, Fixed, 95% CI) | Totals not selected | |
| Outcome or subgroup title | No. of studies | No. of participants | Statistical method | Effect size |
| 1 Primary patency at 6 months Show forest plot | 4 | 319 | Peto Odds Ratio (Peto, Fixed, 95% CI) | 1.12 [0.67, 1.87] |
| 1.1 PTFE v ringed PTFE | 1 | 44 | Peto Odds Ratio (Peto, Fixed, 95% CI) | 1.47 [0.32, 6.71] |
| 1.2 PTFE v PTFE with vein cuff | 2 | 247 | Peto Odds Ratio (Peto, Fixed, 95% CI) | 1.00 [0.56, 1.78] |
| 1.3 PTFE v FUSION BIOLINE | 1 | 28 | Peto Odds Ratio (Peto, Fixed, 95% CI) | 1.96 [0.39, 9.83] |
| 2 Primary patency at 12 months Show forest plot | 4 | 305 | Peto Odds Ratio (Peto, Fixed, 95% CI) | 0.96 [0.60, 1.55] |
| 2.1 PTFE v Dacron | 1 | 45 | Peto Odds Ratio (Peto, Fixed, 95% CI) | 0.47 [0.12, 1.79] |
| 2.2 PTFE v PTFE with vein cuff | 2 | 224 | Peto Odds Ratio (Peto, Fixed, 95% CI) | 1.02 [0.59, 1.76] |
| 2.3 PTFE v ringed PTFE | 1 | 36 | Peto Odds Ratio (Peto, Fixed, 95% CI) | 1.48 [0.35, 6.24] |
| 3 Primary patency at 24 months Show forest plot | 4 | 250 | Peto Odds Ratio (Peto, Fixed, 95% CI) | 0.94 [0.56, 1.57] |
| 3.1 PTFE v Dacron | 1 | 40 | Peto Odds Ratio (Peto, Fixed, 95% CI) | 0.41 [0.12, 1.42] |
| 3.2 PTFE v PTFE with vein cuff | 2 | 182 | Peto Odds Ratio (Peto, Fixed, 95% CI) | 1.08 [0.58, 2.01] |
| 3.3 PTFE v ringed PTFE | 1 | 28 | Peto Odds Ratio (Peto, Fixed, 95% CI) | 1.32 [0.31, 5.67] |
| 4 Primary patency at 36 months Show forest plot | 1 | Peto Odds Ratio (Peto, Fixed, 95% CI) | Totals not selected | |
| 4.1 PTFE v PTFE with vein cuff | 1 | Peto Odds Ratio (Peto, Fixed, 95% CI) | 0.0 [0.0, 0.0] | |
| 5 Secondary patency at 3 months Show forest plot | 1 | Peto Odds Ratio (Peto, Fixed, 95% CI) | Totals not selected | |
| 5.1 PTFE v HUV | 1 | Peto Odds Ratio (Peto, Fixed, 95% CI) | 0.0 [0.0, 0.0] | |
| 6 Secondary patency at 6 months Show forest plot | 2 | 242 | Peto Odds Ratio (Peto, Fixed, 95% CI) | 1.21 [0.69, 2.13] |
| 6.1 PTFE v HUV | 1 | 71 | Peto Odds Ratio (Peto, Fixed, 95% CI) | 3.01 [1.12, 8.07] |
| 6.2 PTFE v PTFE with vein cuff | 1 | 171 | Peto Odds Ratio (Peto, Fixed, 95% CI) | 0.79 [0.40, 1.56] |
| 7 Secondary patency at 12 months Show forest plot | 3 | 325 | Peto Odds Ratio (Peto, Fixed, 95% CI) | 1.48 [0.94, 2.34] |
| 7.1 PTFE v HUV | 1 | 101 | Peto Odds Ratio (Peto, Fixed, 95% CI) | 2.46 [1.10, 5.49] |
| 7.2 PTFE v PTFE with vein cuff | 2 | 224 | Peto Odds Ratio (Peto, Fixed, 95% CI) | 1.16 [0.66, 2.03] |
| 8 Secondary patency at 24 months Show forest plot | 3 | 269 | Peto Odds Ratio (Peto, Fixed, 95% CI) | 1.72 [1.05, 2.80] |
| 8.1 PTFE v HUV | 1 | 88 | Peto Odds Ratio (Peto, Fixed, 95% CI) | 3.40 [1.45, 7.97] |
| 8.2 PTFE v PTFE with vein cuff | 2 | 181 | Peto Odds Ratio (Peto, Fixed, 95% CI) | 1.22 [0.67, 2.23] |
| 9 Secondary patency at 36 months Show forest plot | 1 | Peto Odds Ratio (Peto, Fixed, 95% CI) | Totals not selected | |
| 9.1 PTFE v PTFE with vein cuff | 1 | Peto Odds Ratio (Peto, Fixed, 95% CI) | 0.0 [0.0, 0.0] | |
| 10 Limb salvage at 12 months Show forest plot | 2 | 225 | Peto Odds Ratio (Peto, Fixed, 95% CI) | 1.35 [0.72, 2.55] |
| 10.1 PTFE v PTFE with vein cuff | 2 | 225 | Peto Odds Ratio (Peto, Fixed, 95% CI) | 1.35 [0.72, 2.55] |
| 11 Limb salvage at 24 months Show forest plot | 2 | 196 | Peto Odds Ratio (Peto, Fixed, 95% CI) | 1.34 [0.72, 2.49] |
| 11.1 PTFE v PTFE with vein cuff | 2 | 196 | Peto Odds Ratio (Peto, Fixed, 95% CI) | 1.34 [0.72, 2.49] |
| Outcome or subgroup title | No. of studies | No. of participants | Statistical method | Effect size |
| 1 Primary patency at 3 months Show forest plot | 1 | Peto Odds Ratio (Peto, Fixed, 95% CI) | Totals not selected | |
| 1.1 HBD v PTFE | 1 | Peto Odds Ratio (Peto, Fixed, 95% CI) | 0.0 [0.0, 0.0] | |
| 2 Primary patency at 6 months Show forest plot | 1 | Peto Odds Ratio (Peto, Fixed, 95% CI) | Totals not selected | |
| 2.1 HBD v PTFE | 1 | Peto Odds Ratio (Peto, Fixed, 95% CI) | 0.0 [0.0, 0.0] | |
| 3 Primary patency at 12 months Show forest plot | 1 | Peto Odds Ratio (Peto, Fixed, 95% CI) | Totals not selected | |
| 3.1 HBD v PTFE | 1 | Peto Odds Ratio (Peto, Fixed, 95% CI) | 0.0 [0.0, 0.0] | |
| 4 Primary patency at 24 months Show forest plot | 1 | Peto Odds Ratio (Peto, Fixed, 95% CI) | Totals not selected | |
| 4.1 HBD v PTFE | 1 | Peto Odds Ratio (Peto, Fixed, 95% CI) | 0.0 [0.0, 0.0] | |
| 5 Primary patency at 60 months Show forest plot | 1 | Peto Odds Ratio (Peto, Fixed, 95% CI) | Totals not selected | |
| 5.1 HBD v PTFE | 1 | Peto Odds Ratio (Peto, Fixed, 95% CI) | 0.0 [0.0, 0.0] | |