Tipo de injertos para la cirugía de revascularización femoropoplítea
Resumen
Antecedentes
El bypass femoropoplíteo se utiliza para salvar las extremidades que de lo contrario requerirían amputación en pacientes con dolor isquémico en reposo o pérdida de tejido; y para mejorar la distancia de caminata en pacientes con claudicación grave que limita la vida. En la práctica contemporánea se utilizan injertos con vena autóloga, politetrafluoroetileno (PTFE) o Dacron como conducto de derivación. Esta es la segunda actualización de una revisión Cochrane publicada por primera vez en 1999 y actualizada por última vez en 2010.
Objetivos
Evaluar los efectos del tipo de injerto de bypass en el tratamiento de la estenosis u oclusión del segmento arterial femoropoplíteo, para los injertos de bypass femoropoplíteo por encima y por debajo de la rodilla.
Métodos de búsqueda
Para esta actualización, el Especialista en Información Vascular Cochrane realizó búsquedas en el Registro Especializado en Vascular (13 de marzo de 2017) y en CENTRAL (2017, Número 2). También se realizaron búsquedas en los registros de ensayos.
Criterios de selección
Se incluyeron ensayos aleatorios que comparaban al menos dos tipos diferentes de injertos femoropoplíteos para la reconstrucción arterial en pacientes con isquemia femoropoplítea. No se incluyeron los ensayos controlados aleatorizados que comparaban el injerto de bypass con la angioplastia u otras intervenciones.
Obtención y análisis de los datos
Ambos autores de la revisión (GKA y CPT) seleccionaron los estudios de forma independiente, extrajeron los datos, evaluaron los ensayos en cuanto al riesgo de sesgo y calificaron la calidad de la evidencia mediante los criterios de GRADE.
Resultados principales
Se incluyeron diecinueve ensayos controlados aleatorizados, con un total de 3123 pacientes (2547 por encima de la rodilla, 576 por debajo de la rodilla). En total, se compararon nueve tipos de injertos (vena autóloga, politetrafluoretileno (PTFE) con y sin manguito de vena, vena umbilical humana (HUV), poliuretano (PUR), Dacrón y Dacrón con heparina (HBD); FUSION BIOLINE y Dacrón con soporte externo). Los estudios difirieron en cuanto a los tipos de injertos que comparaban y el seguimiento varió entre seis meses y 10 años.
Revascularización por encima de la rodilla
Para la derivación por encima de la rodilla, hubo evidencia de calidad moderada de que los injertos de vena autóloga mejoran la permeabilidad primaria en comparación con los injertos protésicos a los 60 meses (odds‐ratio (OR) 0,47; intervalo de confianza (IC) del 95%: 0,28 a 0,80; 3 estudios, 269 miembros; P = 0,005). Se encontró baja calidad de la evidencia que sugiere que este beneficio se tradujo en una mejora de la permeabilidad secundaria a los 60 meses (OR 0,41; IC del 95%: 0,22 a 0,74; 2 estudios, 176 miembros; P = 0,003).
No se encontraron diferencias claras entre los tipos de injertos de Dacron y PTFE para la permeabilidad primaria a los 60 meses (OR 1,67; IC del 95%: 0,96 a 2,90; 2 estudios, 247 miembros; baja calidad de la evidencia). Se encontró baja calidad de la evidencia de que los injertos de dacrón mejoraron la permeabilidad secundaria sobre la PTFE a los 24 meses (OR 1,54; IC del 95%: 1,04 a 2,28; 2 estudios, 528 miembros; P = 0,03), un efecto que continuó a los 60 meses en el único ensayo que informó este punto de tiempo (OR 2,43; IC del 95%: 1,31 a 4,53; 167 miembros; P = 0,005).
Los injertos protésicos con soporte externo tuvieron una permeabilidad primaria inferior a los 24 meses en comparación con los injertos protésicos sin soporte (OR 2,08; IC del 95%: 1,29 a 3,35; 2 estudios, 270 miembros; P = 0,003). La permeabilidad secundaria se vio afectada de forma similar en el único ensayo que informó de este resultado (OR 2,25; IC del 95%: 1,24 a 4,07; 236 miembros; P = 0,008). No se disponía de datos a los 60 meses de seguimiento.
El VHU mostró beneficios en la permeabilidad primaria sobre el PTFE a los 24 meses (OR 4,80; IC del 95%: 1,76 a 13,06; 82 miembros; P = 0,002). Este beneficio se observó todavía a los 60 meses (OR 3,75; IC del 95%: 1,46 a 9,62; 69 miembros; P = 0,006), pero sólo se comparó en un ensayo. Los resultados fueron similares para la permeabilidad secundaria a los 24 meses (OR 4,01; IC del 95%: 1,44 a 11,17; 93 miembros) y a los 60 meses (OR 3,87; IC del 95%: 1,65 a 9,05; 93 miembros).
Se encontró que la HBD era superior a la PTFE para la permeabilidad primaria a los 60 meses para el bypass por encima de la rodilla, pero estos resultados se basaron en un único ensayo (OR 0,38, IC del 95%: 0,20 a 0,72; 146 miembros; muy baja calidad de la evidencia). No hubo diferencias en la permeabilidad primaria entre el HBD y el HUV para el bypass por encima de la rodilla en el único estudio pequeño que informó de este resultado.
Sólo encontramos un pequeño ensayo que estudiaba el PUR y que mostraba unas tasas de permeabilidad primaria y secundaria muy pobres, inferiores a las del Dacron en todos los puntos temporales.
Revascularización por debajo de la rodilla
En el caso del bypass por debajo de la rodilla, no se encontró ningún tipo de injerto superior a ningún otro en cuanto a la permeabilidad primaria, aunque un ensayo mostró una mejor permeabilidad secundaria del HUV sobre el PTFE en todos los puntos temporales a 24 meses (OR 3,40; IC del 95%: 1,45 a 7,97; 88 miembros; P = 0,005).
Un estudio comparó la PTFE sola con la PTFE con el manguito de la vena; la muy baja calidad de la evidencia indica que no hay efecto en la permeabilidad primaria o secundaria a los 24 meses (OR 1,08; IC del 95%: 0,58 a 2,01; 182 miembros; 2 estudios; P = 0,80 y OR de Peto 1,22; IC del 95%: 0,67 a 2,23; 181 miembros; 2 estudios; P = 0,51 respectivamente)
Se disponía de datos limitados sobre la supervivencia de las extremidades, y los estudios que informaron sobre este resultado no mostraron diferencias claras entre los tipos de injertos para este resultado. Los protocolos antiplaquetarios y anticoagulantes variaron ampliamente entre los ensayos y, en algunos casos, dentro de los mismos.
La calidad general de la evidencia varió de muy baja a moderada. Las cuestiones que afectaron a la calidad de la evidencia incluyeron diferencias en el diseño de los ensayos y diferencias en los tipos de injertos que compararon. Estas diferencias significaban que a menudo sólo se podía combinar y analizar un pequeño número de participantes, lo que provocaba incertidumbre sobre los verdaderos efectos del tipo de injerto utilizado.
Conclusiones de los autores
Hubo moderada calidad de la evidencia de una mejor permeabilidad primaria a largo plazo (60 meses) para los injertos de venas autólogas en comparación con los materiales de prótesis para la revascularización por encima de la rodilla. A largo plazo (de dos a cinco años) hubo baja calidad de la evidencia de que el dacrón confiere un pequeño beneficio de permeabilidad secundaria sobre la PTFE para el bypass por encima de la rodilla. Sólo existen datos de muy baja calidad sobre las derivaciones por debajo de la rodilla, por lo que no existe certeza de qué tipo de injerto es el mejor. Se necesitan más datos aleatorizados para determinar si esta información se traduce en una mejora de la supervivencia de las extremidades.
PICOs
Resumen en términos sencillos
Elección del material de injerto para la revascularización arterial de los miembros inferiores
Antecedentes
Una persona con arterias gravemente enfermas en una o ambas piernas puede experimentar dolor al caminar (claudicación intermitente), dolor en reposo o muerte de los tejidos de la pierna. Cuando la arteria principal del muslo tiene una obstrucción larga, la mejor opción es colocar una bypass para llevar la sangre de una arteria con buen flujo sanguíneo a la arteria afectada que está debajo de la obstrucción. El bypass tiene como objetivo mejorar la marcha, o salvar extremidades que de otra manera podrían requerir una amputación. Los diferentes tipos de material disponibles para crear el bypass incluyen la propia vena de la persona (vena autóloga), la vena umbilical humana y los materiales protésicos politetrafluoroetileno (PTFE) o Dacron, solos o con el agente anticoagulante heparina unido al interior del injerto. Los injertos de bypass que se extienden hasta debajo de la rodilla no son tan efectivos para permanecer patentes (abiertos) con un buen flujo sanguíneo como los que están por encima de la rodilla. El objetivo de esta revisión fue determinar el tipo de material más efectivo para utilizar en los injertos de revascularización por encima y por debajo de la rodilla.
Características de los estudios y resultados clave
Se identificaron 19 ensayos controlados aleatorizados que incluyeron un total de 3123 personas. De estas personas, 2547 recibieron injertos de bypass por encima de la rodilla y 576 injertos de bypass por debajo de la rodilla. La evidencia de esta revisión están vigente hasta el 13 de marzo de 2017. A partir del análisis, se encontró que los injertos hechos de la propia vena de una persona tenían una mejor tasa de permeabilidad primaria (flujo sanguíneo) que los materiales protésicos PTFE o Dacron para los injertos de bypass por encima de la rodilla. Mientras tanto, el Dacron (y posiblemente también la vena umbilical humana) logró un mejor flujo sanguíneo (permeabilidad) que el PTFE. También se encontró que el Dacron con anillos de soporte alrededor (diseñado para prevenir la compresión externa) mostró peor permeabilidad que el Dacron sin soporte cuando se usó en injertos por encima de la rodilla.
Añadir un "manguito" de vena no mejoró la permeabilidad del PTFE para los injertos que se extienden hasta debajo de la rodilla. Los ensayos incluidos proporcionaron pocos resultados sobre el tiempo que las extremidades de las personas sobrevivieron después del procedimiento de revascularización. No hubo mucha consistencia entre los ensayos (y a veces dentro de los mismos) con respecto a las personas que tomaban medicamentos adicionales como antiplaquetarios o anticoagulantes, y esto podría haber afectado los resultados.
Calidad de la evidencia
La calidad general de la evidencia varió de muy baja a moderada. Las cuestiones que afectaron a la calidad de la evidencia incluyeron diferencias en el diseño de los ensayos y diferencias en los tipos de injertos que compararon. Estas diferencias significaban que a menudo sólo se podía combinar y analizar un pequeño número de participantes, lo que provocaba incertidumbre sobre los verdaderos efectos del tipo de injerto utilizado.
Authors' conclusions
Summary of findings
| Autologous vein compared to other graft types for above‐knee femoro‐popliteal bypass surgery | ||||||
| Patient or population: people with peripheral vascular disease requiring above‐knee femoro‐popliteal bypass surgery | ||||||
| Outcomes | Anticipated absolute effects* (95% CI) | Relative effect | № of limbs | Quality of the evidence | Comments | |
| Risk with other graft types | Risk with autologous vein | |||||
| Primary patency (24 months) | Study population | OR 0.59 | 422 | ⊕⊕⊝⊝ | 92 fewer autologous vein grafts per 1000 (10 to 152 grafts per 1000) lose primary patency by 24 months compared to other grafts studied | |
| 275 per 1000 | 183 per 1000 | |||||
| Primary patency (60 months) | Study population | OR 0.47 | 269 | ⊕⊕⊕⊝ | 172 fewer autologous vein grafts per 1000 (54 to 264 grafts per 1000) lose primary patency by 60 months compared to other grafts studied | |
| 451 per 1000 | 279 per 1000 | |||||
| Secondary patency (60 months) | Study population | OR 0.41 | 176 | ⊕⊕⊝⊝ | 213 fewer autologous vein grafts per 1000 (75 to 330 grafts per 1000) lose secondary patency by 60 months compared to other grafts studied | |
| 526 per 1000 | 313 per 1000 | |||||
| Limb salvage | ‐ | ‐ | ‐ | ‐ | ‐ | No studies of these graft types reported on this outcome |
| *The risk in the intervention group (and its 95% confidence interval) is based on the assumed risk in the comparison group and the relative effect of the intervention (and its 95% CI). | ||||||
| GRADE Working Group grades of evidence | ||||||
| 1 Downgraded due to serious risk of bias resulting from lack of blinding and poor randomisation techniques | ||||||
| PTFE compared to Dacron for above‐knee femoro‐popliteal bypass surgery | ||||||
| Patient or population: people with peripheral vascular disease requiring above‐knee femoro‐popliteal bypass surgery | ||||||
| Outcomes | Anticipated absolute effects* (95% CI) | Relative effect | № of limbs | Quality of the evidence | Comments | |
| Risk with Dacron | Risk with PTFE | |||||
| Primary patency (24 months) | Study population | OR 1.23 | 764 | ⊕⊕⊝⊝ | Our confidence in the effect is limited and this may differ substantially from the estimate of the effect | |
| 404 per 1000 | 454 per 1000 | |||||
| Primary patency (60 months) | Study population | OR 1.67 | 247 | ⊕⊕⊝⊝ | Our confidence in the effect is limited and this may differ substantially from the estimate of the effect | |
| 606 per 1000 | 720 per 1000 | |||||
| Secondary patency (24 months) | Study population | OR 1.54 | 528 | ⊕⊕⊝⊝ | 81 more PTFE grafts per 1000 (7 to 168 per 1000) suffer from failed secondary patency by 24 months compared to Dacron | |
| 212 per 1000 | 293 per 1000 | |||||
| Limb salvage (24 months) | Study population | OR 0.82 | 322 | ⊕⊕⊝⊝ | Our confidence in the effect is limited and this may differ substantially from the estimate of the effect | |
| 44 per 1000 | 37 per 1000 | |||||
| *The risk in the intervention group (and its 95% confidence interval) is based on the assumed risk in the comparison group and the relative effect of the intervention (and its 95% CI). | ||||||
| GRADE Working Group grades of evidence | ||||||
| 1 Downgraded because of serious risk of bias due to lack of blinding and poor randomisation techniques | ||||||
| Externally supported graft compared to unsupported graft for above‐knee femoro‐popliteal bypass surgery | ||||||
| Patient or population: people with peripheral vascular disease requiring above‐knee femoro‐popliteal bypass surgery | ||||||
| Outcomes | Anticipated absolute effects* (95% CI) | Relative effect | № of limbs | Quality of the evidence | Comments | |
| Risk with unsupported graft | Risk with externally supported graft | |||||
| Primary patency (24 months) | Study population | OR 2.08 | 270 | ⊕⊕⊝⊝ | 180 fewer unsupported prosthetic grafts per 1000 (61 to 293 grafts per 1000) lose primary patency by 24 months compared to externally supported prosthetic grafts | |
| 376 per 1000 | 556 per 1000 | |||||
| Primary patency (60 months) | ‐ | ‐ | ‐ | ‐ | ‐ | No studies comparing supported and unsupported Dacron reported on primary patency at 60 months |
| Secondary patency (24 months) | Study population | OR 2.25 | 236 | ⊕⊕⊝⊝ | 143 fewer unsupported Dacron grafts per 1000 (32 to 281 grafts per 1,000) lose secondary patency by 24 months compared to externally supported Dacron grafts | |
| 165 per 1000 | 308 per 1000 | |||||
| Limb salvage | ‐ | ‐ | ‐ | ‐ | ‐ | No studies of these graft types reported on this outcome |
| *The risk in the intervention group (and its 95% confidence interval) is based on the assumed risk in the comparison group and the relative effect of the intervention (and its 95% CI). | ||||||
| GRADE Working Group grades of evidence | ||||||
| 1 Downgraded because of serious risk of bias due to lack of blinding and poor randomisation techniques | ||||||
| PTFE compared to PTFE with vein cuff for below‐knee femoro‐popliteal bypass surgery | ||||||
| Patient or population: people with peripheral vascular disease requiring below‐knee femoro‐popliteal bypass surgery | ||||||
| Outcomes | Anticipated absolute effects* (95% CI) | Relative effect | № of limbs | Quality of the evidence | Comments | |
| Risk with PTFE with vein cuff | Risk with PTFE | |||||
| Primary patency (24 months) | Study population | OR 1.08 | 182 | ⊕⊝⊝⊝ | Findings from two small trials were inconsistent so our confidence in the effect is limited and this may differ substantially from the estimate of the effect | |
| 626 per 1000 | 644 per 1000 | |||||
| Primary patency (60 months) | ‐ | ‐ | ‐ | ‐ | ‐ | No studies comparing PTFE with and without a vein cuff for below‐knee bypass reported on primary patency at 60 months |
| Secondary patency (24 months) | Study population | OR 1.22 | 181 | ⊕⊝⊝⊝ | Findings from two small trials were inconsistent so our confidence in the effect is limited and this may differ substantially from the estimate of the effect | |
| 557 per 1000 | 605 per 1000 | |||||
| Limb salvage (24 months) | Study population | OR 1.34 | 196 | ⊕⊕⊝⊝ | Our confidence in the effect is limited and this may differ substantially from the estimate of the effect | |
| 266 per 1000 | 327 per 1000 | |||||
| *The risk in the intervention group (and its 95% confidence interval) is based on the assumed risk in the comparison group and the relative effect of the intervention (and its 95% CI). | ||||||
| GRADE Working Group grades of evidence | ||||||
| 1 Downgraded due to serious risk of bias resulting from lack of blinding and poor randomisation techniques | ||||||
Background
Description of the condition
Femoro‐popliteal bypass grafting for lower limb ischaemia is one of the most common procedures undertaken by vascular surgeons. Since its inception in the 1940s the procedure has evolved significantly in terms of technical intricacy, graft type, anticoagulant medication use and patient selection. Various graft types have been used, including: autologous vein (in situ or reversed), human umbilical vein (HUV), synthetic polymers, polytetrafluoroethylene (PTFE) and Dacron; and more recently heparin‐bonded synthetic polymers.
During femoro‐popliteal bypass grafting, the proximal anastomosis is taken from the common, superficial or profunda femoris artery and the distal anastomosis may be to the popliteal artery either above or below the knee (referred to as above‐ and below‐knee grafts).
Description of the intervention
Controversy still exists over the most appropriate type of graft to use in bypass surgery. It is generally accepted that autologous vein should be used wherever possible, but there are surgeons who believe that using vein is a more demanding and time‐consuming operation that involves a longer duration of anaesthesia in relatively frail patients. When vein is unavailable there are widespread differences in the material used. This is due, in part, to a lack of relevant randomised evidence. Early trials did not separate above‐ and below‐knee grafts, were underpowered, had inadequate randomisation and the patient populations were less relevant to modern practice. As new materials became available they were implemented as standard practice for many surgeons, but with a lack of high‐quality supporting evidence. Even fairly recent meta‐analyses have relied heavily on non‐randomised, retrospective data (Pereira 2006).
How the intervention might work
Arterial bypass grafting works by routing arterial blood around blocked or narrow sections of artery using an alternative conduit. This conduit may either be a section of the patient's own vein (reversed or with the valves cut and disrupted); or an alternative biological conduit such as human umbilical vein; or an artificial material.
Why it is important to do this review
Outcomes from infrainguinal bypass grafting continue to be poor; at a median follow‐up of five years, the landmark randomised trial comparing bypass surgery to angioplasty in severe limb ischaemia reported overall survival of less than 50% (Bradbury 2010). There are economic and patient advantages to successful bypass grafting (Luther 1997; Perler 1995). When this is considered in the context of the controversy surrounding choice of graft material and differences in surgical practice, it is vital to make decisions based on the best evidence currently available.
Objectives
To assess the effects of bypass graft type in the treatment of stenosis or occlusion of the femoro‐popliteal arterial segment, for above‐ and below‐knee femoro‐popliteal bypass grafts.
Methods
Criteria for considering studies for this review
Types of studies
We included randomised controlled trials (RCTs) comparing at least two different graft types. All graft types were eligible for inclusion.
Types of participants
We included patients with femoro‐popliteal ischaemia requiring arterial reconstruction. These were mainly patients with critical claudication, rest pain or tissue loss (Rutherford category 3 to 6 Consensus Document), but could also include some stable claudicants (Rutherford grade 1 to 2) in earlier trials. Trials in which a clear distinction was not made between patients receiving grafts to the popliteal artery and to the tibial arteries were excluded. For trials analysing above‐ and below‐knee procedures together, trialists were contacted for data and excluded if the results were inseparable.
Types of interventions
We included studies comparing two or more graft materials. Randomised controlled trials comparing bypass grafting to angioplasty or to other interventions were not included.
Types of outcome measures
Primary outcomes
-
Primary patency, defined as continuous patency of the graft without need for further intervention (including primary assisted patency if performed during the primary procedure)
Secondary outcomes
-
Secondary patency, defined as continuous patency of the graft, with or without further procedures such as angioplasty or surgical patching to prevent occlusion
-
Limb survival or limb salvage
We assessed these outcomes at three months, six months, one year, two years, three years and five years after surgery.
Search methods for identification of studies
We placed no restrictions on language.
Electronic searches
For this update, the Cochrane Vascular Information Specialist (CIS) searched the following databases for relevant trials:
-
the Cochrane Vascular Specialised Register (13 March 2017);
-
the Cochrane Central Register of Controlled Trials (CENTRAL (2017, Issue 2)) via the Cochrane Register of Studies Online.
See Appendix 1 for details of the search strategy used to search CENTRAL.
The Cochrane Vascular Specialised Register is maintained by the CIS and is constructed from weekly electronic searches of MEDLINE Ovid, EMBASE Ovid, CINAHL, AMED, and through handsearching relevant journals. The full list of the databases, journals and conference proceedings which have been searched, as well as the search strategies used are described in the Specialised Register section of the Cochrane Vascular module in the Cochrane Library (www.cochranelibrary.com).
The CIS also searched the following trial registries for details of ongoing and unpublished studies (13 March 2017); See Appendix 2 for details.
-
ClinicalTrials.gov (www.clinicaltrials.gov)
-
World Health Organization International Clinical Trials Registry Platform (www.who.int/trialsearch)
-
ISRCTN Register (www.isrctn.com/)
Searching other resources
We searched the reference lists of relevant articles identified through the electronic searches to identify further trials.
Data collection and analysis
Selection of studies
For this update, both review authors (GKA and CPT) independently selected trials for inclusion in the review. The section 'Criteria for considering studies for this review' details the inclusion criteria used for the selection process.
Data extraction and management
Data were independently extracted by GKA then cross checked by CPT. The following information was extracted on each trial.
-
Trial methods: method of randomisation, method of allocation.
-
Participants: country of origin, age, sex distribution, severity of disease as measured by the ankle brachial index (ABI) and the European Consensus definition of critical ischaemia (Consensus Document), presence of diabetes, inclusion and exclusion criteria.
-
Interventions: type of graft, level of anastomosis, use of aspirin or anticoagulants, smoking habit after surgery, attendance at a graft surveillance programme.
-
Outcomes: primary and secondary patency, limb survival.
Assessment of risk of bias in included studies
For this update, both review authors independently assessed the risk of bias in the included studies according to the guidelines given in the Cochrane Handbook for Systematic Reviews of Interventions, (Higgins 2011). We assessed the new studies included in the updated review and we re‐assessed the studies already included from the previous versions of the review.
We assessed the following domains as low risk of bias, unclear risk of bias, or high risk of bias:
-
sequence generation;
-
allocation concealment;
-
blinding of participants and personnel;
-
blinding of outcome assessment;
-
incomplete outcome data;
-
selective outcome reporting;
-
other bias.
These assessments are reported for each individual study in the Characteristics of included studies tables.
Measures of treatment effect
We presented the results from the dichotomous outcomes (primary or secondary patency; limb salvage) as odds ratios (ORs) with 95% confidence intervals (CIs).
Unit of analysis issues
The unit of analysis was the limb. Some participants in some trials were enrolled more than once, as each lower limb was allowed to be entered into some of the trials independently. This created a unit of analysis issue when considering survival with intact limb, but it was felt that effects on both primary patency (our primary outcome) and secondary patency would be small, so these trials were not excluded. None of the included studies allowed previous bypass in the affected limb. Survival data were only considered where it was clear that participants could not be enrolled in the same trial more than once.
Dealing with missing data
Where data were missing we attempted to determine the reasons for this. If data were missing due to participants being lost to follow up or because participants were not followed up to a certain time point prior to publication (censoring) and reasons were clearly described, we assumed the data were missing at random.
Assessment of heterogeneity
Heterogeneity was assessed visually (for methodological or clinical heterogeneity) by inspecting the forest plots and statistically by using Review Manager 5 software (Higgins 2003). We obtained P values comparing the test statistic with a Chi2 distribution. The Chi2 statistic describes the percentage of total variation across studies due to heterogeneity rather than by chance. A value of 0% indicates no observed heterogeneity and larger values show increasing heterogeneity.
Assessment of reporting biases
We planned to assess reporting bias by presenting funnel plots if more than 10 studies were included in the analysis. We also searched trial registries to look for unreported studies.
Data synthesis
We analysed and presented data into groups according to whether the distal anastomosis was above or below the knee.
We only undertook meta‐analysis when we felt there was no significant methodological heterogeneity, and statistical heterogeneity was not revealed by either calculation of I2 or performing Chi2 tests. The effect estimate was calculated using Peto ORs with 95% CIs. Peto ORs were used as it was anticipated that intervention effects would mainly be small, and that most trials would have similar numbers in experimental and control groups. We used fixed‐effect methods as there was no significant heterogeneity detected. All analyses were based on endpoint data from the individual clinical trials, which all quoted intention‐to‐treat results. The data were synthesised by comparing group results. Individual patient data from different trials were not amalgamated.
Subgroup analysis and investigation of heterogeneity
We performed subgroup analysis according to graft type.
Sensitivity analysis
We performed sensitivity analysis to consider whether excluding studies with higher risk of bias led to significant changes in the results.
Summary of findings
We created 'Summary of findings' tables using GRADEpro software (GRADEpro GDT 2015). The study population consisted of patients with femoro‐popliteal ischaemia requiring arterial reconstruction, and we created tables for the comparisons of 'Autologous vein compared to other graft types for above‐knee femoro‐popliteal bypass surgery' (summary of findings Table for the main comparison); 'PTFE compared to Dacron for above‐knee femoro‐popliteal bypass surgery' (summary of findings Table 2); 'Externally supported Dacron compared to unsupported Dacron for above‐knee femoro‐popliteal bypass surgery' (summary of findings Table 3) and 'PTFE compared to PTFE with vein cuff for below‐knee femoro‐popliteal bypass surgery' (summary of findings Table 4). The most important and clinically relevant outcomes (both desirable and undesirable) that were thought to be essential for decision‐making were the outcomes primary patency (at 24 and 60 months follow‐up), secondary patency (at 60 months follow‐up) and limb salvage (at 24 months follow‐up). Assumed control intervention risks were calculated by the mean number of events in the control groups of the selected studies for each outcome. We used the system developed by the Grades of Recommendation, Assessment, Development and Evaluation working group (GRADE working group) for grading the quality of evidence as high, moderate, low or very low, based on within‐study risk of bias, inconsistency, directness of evidence, imprecision, and publication bias (GRADE 2004; GRADEpro GDT 2015).
Results
Description of studies
Results of the search
See Figure 1.

Study flow diagram.
Included studies
For summarised details of the included studies, see Characteristics of included studies.
We included seven additional studies in this review update (Davidovic 2010; Gloor 1996; Gupta 1991; Lumsden 2015; SCAMICOS 2010; Solakovic 2008; Vriens 2013), making a total of 19 randomised controlled trials which met the criteria for inclusion (Aalders 1992; Abbot 1997; Ballotta 2003; Davidovic 2010; Devine 2004; Eickhoff 1987; Gloor 1996; Gupta 1991; Jensen 2007; Klinkert 2003; Lumsden 2015; Post 2001; SCAMICOS 2010; Scharn 2008; Solakovic 2008; Stonebridge 1997; Tofigh 2007; van Det 2009; Vriens 2013). We had excluded three of the studies from the previous version of this review due to unclear randomisation methods (Gloor 1996; Gupta 1991; Solakovic 2008), but we were able to include them in this version due to the use of Cochrane's 'Risk of bias' tool. Follow‐up was reported to six months (Lumsden 2015), one year (Davidovic 2010; Gloor 1996), two years (Jensen 2007; Post 2001; Scharn 2008; Tofigh 2007; Vriens 2013), three years (Gupta 1991; SCAMICOS 2010), four years (Eickhoff 1987), five years (Aalders 1992; Abbot 1997; Ballotta 2003; Devine 2004; Klinkert 2003; Solakovic 2008; Stonebridge 1997) and 10 years (van Det 2009). There were a total of 3123 patients (2547 above‐knee, 576 below‐knee), with bypasses being performed on 3238 limbs (2662 above‐knee, 576 below‐knee). Nine types of graft were compared: autologous vein; polytetrafluoroethylene (PTFE) with and without vein cuff and with or without external support; human umbilical vein (HUV); Dacron and heparin bonded Dacron (HBD); FUSION BIOLINE and Dacron with external support).
Above‐knee bypass
Two trials compared autologous vein and PTFE grafts above the knee (Ballotta 2003; Klinkert 2003). In Ballotta 2003, 102 limbs (51 patients) with bilateral disabling claudication were randomised to receive reversed saphenous vein or PTFE. Klinkert 2003 also compared reversed saphenous vein with PTFE, in 151 limbs. Anticoagulation protocols and medication checks varied between these trials; see Characteristics of included studies for details.
In Tofigh 2007 autologous vein was compared with a polyester graft, while Solakovic 2008 compared autologous vein with a prosthetic graft, which was allowed to be either PTFE of Dacron. These have been considered separately for analysis from those trials where the prosthetic material was more clearly specified.
One trial compared PTFE with HUV in 93 limbs (Aalders 1992). Five trials compared PTFE with Dacron (Abbot 1997; Davidovic 2010; Jensen 2007; Post 2001; van Det 2009). We did not use Davidovic 2010 the quantitative analysis due to concerns over risk of bias in outcome data (see Characteristics of included studies). The trial with the largest number of limbs was Jensen 2007, in which 205 PTFE grafts were compared with 208 Dacron grafts. Unfortunately, anticoagulant and follow‐up protocols varied between departments in this study. In van Det 2009, 114 limbs were randomised to PTFE and 114 limbs to Dacron; the trialists used warfarin with a consistent protocol for anticoagulation, and they continued follow‐up for 10 years. One trial compared PTFE with the FUSION BIOLINE graft (Lumsden 2015), which is a two‐layer graft, the inner layer being heparin‐bonded expanded PTFE (ePTFE) which is glued to an outer knitted polyester textile. Above the knee, 88 limbs were randomised to FUSION BIOLINE graft, whilst 86 received standard ePTFE. Gupta 1991 considered PTFE with or without ringed support; 29 limbs received ringed grafts and 30 limbs received unringed grafts above the knee.
One trial looked at fluoropolymer‐coated Dacron graft with or without external support (Vriens 2013), with 134 limbs assigned to externally supported graft and 119 treated with unsupported graft.
One trial compared PTFE with PTFE and vein cuff in above‐knee bypass (Stonebridge 1997). The study included 74 limbs with PTFE and 76 with PTFE and vein cuff. The numbers of continuing smokers and of participants on antiplatelet and anticoagulant therapy were not given. Peri‐operative complications were not stated.
One study compared HBD with HUV (Scharn 2008) and one trial compared HBD with PTFE (Devine 2004). The anticoagulant protocol was not stated in the latter (Devine 2004).
One study compared polyurethane (PUR) with Dacron (Gloor 1996). Both primary and secondary patency rates were poor for the PUR grafts and the trial was stopped early due to safety concerns after only 20 limbs had been randomised.
Below‐knee bypass
There were far less data available for below‐knee bypass, with 651 procedures analysed. No studies compared autologous vein with PTFE, HUV or other graft types. One trial compared PTFE with Dacron (Post 2001), however there were low numbers of participants in each group (26 in the PTFE group, 27 in the Dacron group). Two trials (Stonebridge 1997; SCAMICOS 2010) compared PTFE with PTFE and vein cuff. One study (Lumsden 2015) compared standard ePTFE with the FUSION BIOLINE graft, though numbers of below‐knee popliteal procedures were low in each group (14 in the FUSION BIOLINE group, 14 in the PTFE group). Gupta 1991 included 63 below‐knee bypasses, and compared PTFE with or without ringed support in 29 and 34 limbs respectively.
One study (Eickhoff 1987) compared PTFE with HUV. This trial also separately analysed patency rates in claudicants and those with good distal runoff, and found those patients to have a patency advantage. The study authors did not state the anticoagulants used. Devine 2004 gave separate below‐knee data.
There were no statistically significant differences in the major cofounders of sex, age, smoking, dyslipidaemia (abnormal concentrations of lipids or lipoproteins in the blood), diabetes or hypertension reported between groups in any of the above‐ or below‐knee trials.
Excluded studies
For this update, we excluded six additional studies (Lindholt 2011; Linni 2015; Lundgren 2013; Midy 2016; NCT00617279; NCT00845585); we also excluded a study which had been included in previous versions of the review (Watelet 1997). We excluded three studies because above‐ and below‐the‐knee data could not be separated for analyses (Lindholt 2011, Linni 2015; Watelet 1997) . We excluded Lundgren 2013 because it included a mixture of femoro‐popliteal and femoro‐tibial bypass patients, and results for the subset of patients treated with femoro‐popliteal bypass were not presented separately. We excluded one study (Midy 2016) as it failed to recruit even 30% of the planned number of patients, and more than 25% of those recruited had no follow‐up. We excluded NCT00617279 and NCT00845585 for similar reasons; the former trial was terminated by the sponsor due to slow recruitment and no results were ever presented, whereas the latter trial was terminated before a single patient was recruited. Full reasons for trials being excluded can be found in the Characteristics of excluded studies table.
Ongoing studies
We identified two ongoing studies as being relevant to this review and these may be included in future updates (NCT00205790; NCT00147979). See Characteristics of ongoing studies.
Risk of bias in included studies

Risk of bias graph: review authors' judgements about each risk of bias item presented as percentages across all included studies.

Risk of bias summary: review authors' judgements about each risk of bias item for each included study.
Overall, the risk of bias was significant, principally due to a lack of blinding. There were issues to do with attrition and it was unclear whether there might have been issues of selection bias in some studies.
Allocation
Random sequence generation
Seven studies were at low risk of bias as their sequence generation was adequate (Aalders 1992; Ballotta 2003; Devine 2004; Jensen 2007; Post 2001; Scharn 2008; van Det 2009). We judged the remaining 12 studies to have unclear risk of bias as they failed to describe the method of randomisation, or used a non‐standard technique (Abbot 1997; Davidovic 2010; Eickhoff 1987; Gloor 1996; Gupta 1991; Klinkert 2003; Lumsden 2015; SCAMICOS 2010; Scharn 2008; Solakovic 2008; Stonebridge 1997; Tofigh 2007; Vriens 2013).
Allocation concealment
Eleven studies had adequate allocation concealment (Ballotta 2003; Devine 2004; Eickhoff 1987; Jensen 2007; Klinkert 2003; Post 2001; SCAMICOS 2010; Scharn 2008; Solakovic 2008; van Det 2009; Vriens 2013). The remaining eight were at unclear risk of bias as allocation concealment was not clearly discussed (Aalders 1992; Abbot 1997; Davidovic 2010; Gloor 1996; Gupta 1991; Lumsden 2015; Stonebridge 1997; Tofigh 2007).
Blinding
Blinding for graft insertion is impossible in surgical trials of this nature. Outcome assessment may be blinded, however this was not the case in any of the included studies and we are unsure what effect this may have had on the outcomes in question. For this reason all included studies were judged to be at high risk of performance bias and at unclear risk of detection bias.
Incomplete outcome data
We judged one study (Abbot 1997) to be at high risk of attrition bias as 13 participants were lost following randomisation and results were reported without specifically stating what happened to these participants. Davidovic 2010 failed to present numbers at risk at different time points and secondary patency was presented as worse than primary patency, which is impossible. Due to these issues we judged this study to be at high risk of bias and did not include it in meta‐analysis. We assessed Gloor 1996 as having unclear risk of bias as they failed to include a CONSORT flow diagram and there was no mention of patients excluded prior to randomisation or after randomisation. All the remaining studies were at low risk of bias, since any losses were minimal or described clearly.
Selective reporting
One study (Gloor 1996) failed to present details of complications occurring within the first 30 days which did not lead to reintervention, though this was a stated secondary outcome. As this is a patient population with significant comorbidity, it is likely that there were some undisclosed complications, so we judged the study to be at unclear risk of reporting bias. There were no concerns over selective reporting in any of the other included studies.
Other potential sources of bias
Three trials had antiplatelet and anticoagulant protocols which obviously varied within the trial: Post 2001 used heparin, warfarin or antiplatelet agents (specific agent not stated); Scharn 2008 used aspirin or coumarin derivatives; and Jensen 2007 used different anticoagulation protocols in each centre. One study (Lumsden 2015) left decisions about heparin, protamine and topical haemostatics to the operating surgeon, but specified that postoperative aspirin therapy was compulsory in all participants. Five trials did not state their anticoagulation protocol (Abbot 1997; Devine 2004; Eickhoff 1987; SCAMICOS 2010; Stonebridge 1997). One study (Solakovic 2008) gave a clear protocol of anticoagulants in the perioperative period and antiplatelet agents following discharge, but gave no details of compliance checks. We considered all these studies to have unclear risk of other sources of bias.
Effects of interventions
See: Summary of findings for the main comparison Autologous vein compared to other graft types for above‐knee femoro‐popliteal bypass surgery; Summary of findings 2 PTFE compared to Dacron for above‐knee femoro‐popliteal bypass surgery; Summary of findings 3 Externally supported graft compared to unsupported graft for above‐knee femoro‐popliteal bypass surgery; Summary of findings 4 PTFE compared to PTFE with vein cuff for below‐knee femoro‐popliteal bypass surgery
Above‐knee bypass
Autologous vein compared to other graft types
Four studies compared autologous veins to other grafts prosthetic materials (Ballotta 2003; Klinkert 2003; Solakovic 2008; Tofigh 2007).
Primary patency
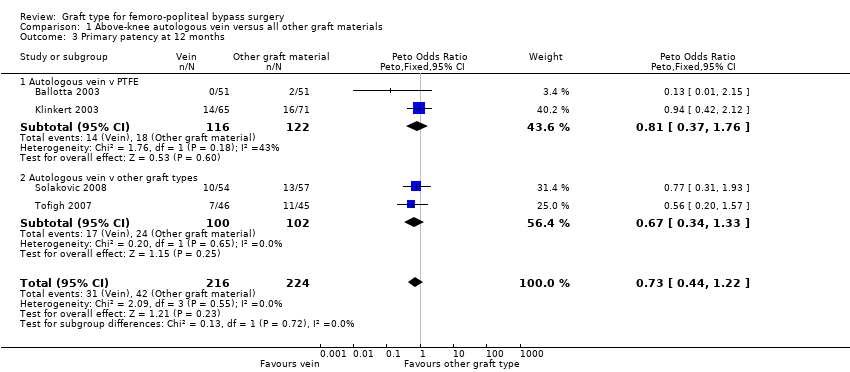
We were able to include four trials comparing autologous vein to prosthetic materials in a meta‐analysis (Ballotta 2003; Klinkert 2003; Solakovic 2008; Tofigh 2007). We found no clear difference between the groups in primary patency at 3, 6 or 12 months. See Analysis 1.1; Analysis 1.2; Analysis 1.3 respectively. Although individual trials failed to show clear benefit, once results of the four trials were combined a long‐term benefit for autologous vein was observed at 24 months (Peto odds ratio (OR) 0.59, 95% confidence interval (CI) 0.37 to 0.94; 422 limbs; 4 studies; P = 0.03; low‐quality evidence; Analysis 1.4). This was reflected in the continued benefit in primary patency for autologous vein over prosthetic grafts by five years (Peto OR 0.47, 95% CI 0.28 to 0.80; 269 limbs; 3 studies; P = 0.005; moderate‐quality evidence; Analysis 1.5). The comparison with polytetrafluoroethylen (PTFE) contributed the majority of weight to this result (weight 63.6%, OR 0.48, 95% CI 0.25 to 0.95).
Secondary patency
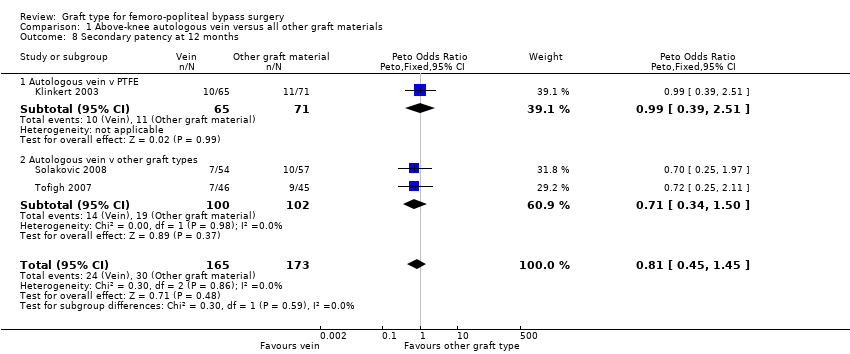
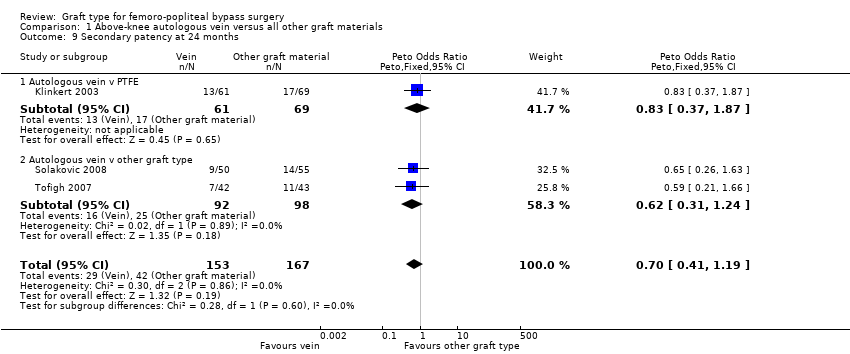
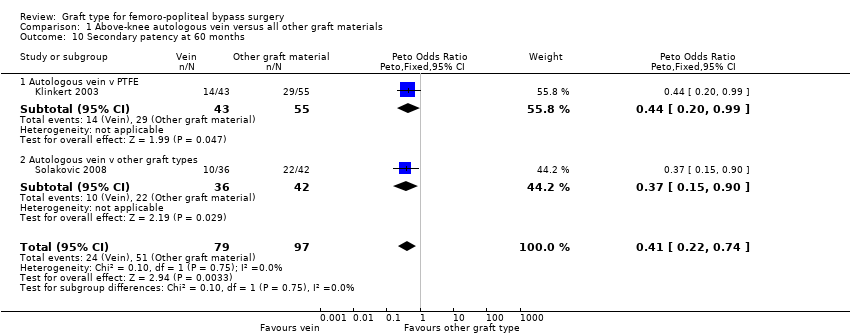
Three studies comparing autologous vein to prosthetic materials reported on this outcome and were pooled in a meta‐analysis (Klinkert 2003; Solakovic 2008; Tofigh 2007). No improvement in secondary patency was found at 3, 6, 12 or 24 months. See Analysis 1.6; Analysis 1.7; Analysis 1.8; Analysis 1.9 respectively. A benefit was seen at five years (Peto OR 0.41, 95% CI 0.22 to 0.74; 176 limbs; 2 studies; P = 0.003; low‐quality evidence; Analysis 1.10). However Ballotta 2003 and Tofigh 2007 were not included in analysis at this timepoint, reducing the power of the comparison. There was no evidence of significant statistical heterogeneity between these trials.
Limb survival or limb salvage
No data available
Polytetrafluoroethylen (PTFE) compared to other graft types
Eight studies compared PTFE to other grafts (Aalders 1992; Abbot 1997; Davidovic 2010; Jensen 2007; Lumsden 2015; Post 2001; Stonebridge 1997; van Det 2009).
Primary patency
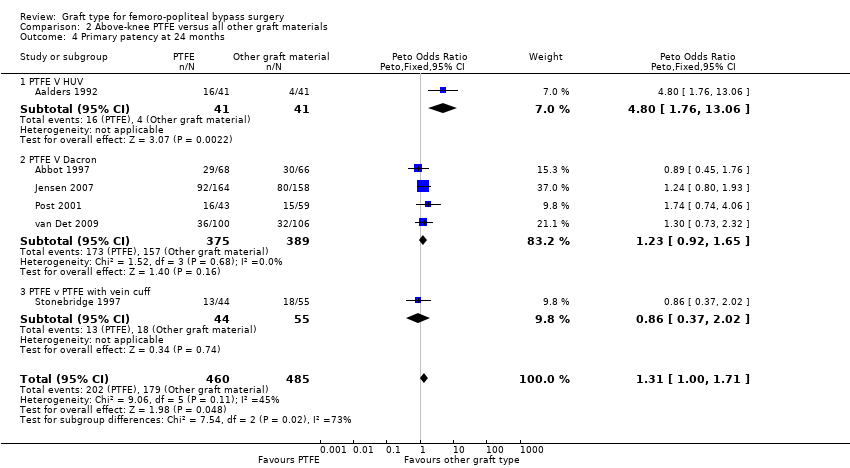
Of the five studies comparing PTFE with Dacron (Abbot 1997; Davidovic 2010; Jensen 2007; Post 2001; van Det 2009), four were considered suitable for meta‐analysis (Abbot 1997; Jensen 2007; Post 2001; van Det 2009). We did not include Davidovic 2010 because of concerns about risk of bias (see Incomplete outcome data (attrition bias)). All four studies reported at 12 and 24 months; the remaining timepoints had data available from one or two studies. Three studies (Jensen 2007; van Det 2009; Post 2001) showed a non‐significant trend towards a greater benefit with Dacron and Abbot 1997 showed a non‐significant trend in favour of PTFE. Abbot 1997 was the weakest trial in terms of potential bias; see Figure 3 and the table Characteristics of included studies.
Once combined, we found no significant difference in primary patency between PTFE and Dacron at any time point. Removing the one trial with significant bias issues (Abbot 1997) did not change this result, except at 60 months, where data from one study (van Det 2009) suggested that Dacron grafts may potentially have a small benefit in primary patency at this time point (OR 1.87; 95% CI 1.01 to 3.43; Analysis 2.5).
One study (Aalders 1992) compared PTFE with human umbilical vein (HUV). No difference in primary patency was seen at three or six months (Analysis 2.1 and Analysis 2.2 respectively). Our analysis suggests a benefit in primary patency for HUV by 12 months (Peto OR 3.17, 95% CI 1.04 to 9.64; P = 0.04; 83 limbs; 1 study), which continued to 24 months (Peto OR 4.80, 95% CI 1.76 to 13.06; 82 limbs; 1 study; P = 0.002 (Analysis 2.4)). This benefit was still evident at five years (Peto OR 3.75, 95% CI 1.46 to 9.62; 69 limbs; 1 study; P = 0.006), Analysis 2.5), but the results are limited because of small numbers of participants.
In Stonebridge 1997, there was no significant difference between PTFE and PTFE with vein cuff used above the knee for the outcome primary patency at any time point (Analysis 2.3; Analysis 2.4).
One study (Lumsden 2015) compared a new graft material, FUSION BIOLINE, which is composed of an inner heparin bonded PTFE layer glued to an outer knitted polyester layer. This study found a significant improvement in primary patency at six months for above‐knee bypass done with FUSION BIOLINE, when compared with a standard PTFE graft (Peto OR 2.99, 95% CI 1.43 to 6.26; 174 limbs; 1 study; P = 0.004; Analysis 2.2) . Results reported at other time points were only presented for both above‐ and below‐knee grafts combined, and failed to show a significant difference at either 90 days or 12 months, though the results at six months were also significant in the combined analysis.
Secondary patency
There was no clear difference in secondary patency between PTFE and Dacron at 6 months (Peto OR 1.01, 95% CI 0.25 to 4.13; 225 limbs; 1 study) or 12 months (Peto OR 1.19, 95% CI 0.76 to 1.86; 581 limbs; 2 studies). See Analysis 2.7 and Analysis 2.8. A benefit from the use of Dacron grafts was seen at 24 months (Peto OR 1.54, 95% CI 1.04 to 2.28; 528 limbs; 2 studies; P = 0.03) and 60 months (Peto OR 2.43, 95% CI 1.31 to 4.53; 167 limbs; 1 study; P = 0.005). See Analysis 2.9 and Analysis 2.10.
In Stonebridge 1997, there was no significant difference between PTFE and PTFE with vein cuff used above the knee for the outcome secondary patency at any time point (Analysis 2.8; Analysis 2.9).
One study (Aalders 1992) compared PTFE with human umbilical vein (HUV). No clear difference in secondary patency was seen at three, six and 12 months (Analysis 2.6; Analysis 2.7 and Analysis 2.8 respectively). Our analysis suggests a benefit in secondary patency for HUV by 24 months (Peto OR 4.01, 95% CI 1.44 to 11.17; 93 limbs; 1 study; P = 0.008), which continued to 60 months (Peto OR 3.87, 95% CI 1.65 to 9.05; 93 limbs; 1 study; P = 0.002) (Analysis 2.10).
Limb survival or limb salvage
Only two studies reported detailed limb salvage rates for above‐knee femoro‐popliteal bypass (Jensen 2007; Stonebridge 1997). Jensen 2007 compared PTFE with Dacron and Stonebridge 1997 compared PTFE with PTFE and vein cuff. Neither found differences in limb salvage rates between graft types at one month or 24 months (Analysis 2.11; Analysis 2.12).
Heparin bonded Dacron (HBD) versus other grafts
Two studies compared heparin bonded Dacron grafts with other grafts (Devine 2004; Scharn 2008). Devine 2004 compared heparin bonded Dacron to PTFE and Scharn 2008 compared HBD to HUV.
Primary patency
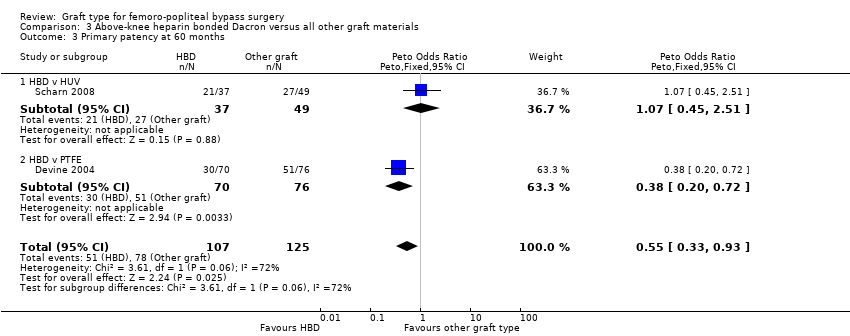
In Devine 2004, no difference in patency was detected at 12 or 24 months, though by 60 months, HBD showed improved patency compared to PTFE (Peto OR 0.38, 95% CI 0.20 to 0.72; 146 limbs; 1 study; P = 0.003). In Scharn 2008 there was no improvement in primary patency at any time interval when HBD was compared to HUV.
The combined overall primary patency for HBD compared to HUV/PTFE was improved at 12 months (Peto OR 0.58, 95% CI 0.34 to 0.98; 294 limbs; 2 studies); 24 months (Peto OR 0.62, 95% CI 0.38 to 1.02; 282 limbs; 2 studies); and 60 months (Peto OR 0.55, 95% CI 0.33 to 0.93; 232 limbs; 2 studies). See Analysis 3.1 to Analysis 3.3.
Secondary patency
No data available
Limb survival or limb salvage
No data available
Externally‐supported Dacron or PTFE grafts compared to other grafts
One trial examined whether adding external support to Dacron might improve outcomes in above‐knee femoro‐popliteal bypass (Vriens 2013), while another considered the same question for PTFE grafts (Gupta 1991).
Primary patency
Although short‐term primary patency rates were comparable (Analysis 4.1; Analysis 4.2), by 24 months the externally supported Dacron grafts showed worse primary patency when compared to their unsupported counterparts (Peto OR 2.09, 95% CI 1.26 to 3.46; 240 limbs; 1 study; P = 0.004; Analysis 4.3).
Results from Gupta 1991 showed similar primary patency for PTFE grafts with and without ringed support at 6, 12 and 24 months (Analysis 4.1; Analysis 4.2; Analysis 4.3).
Secondary patency
Although short‐term secondary patency rates were comparable, by 24 months the externally supported Dacron grafts showed worse secondary patency when compared to their unsupported counterparts (Peto OR 2.25, 95% CI 1.24 to 4.07; 236 limbs; 1 study; P = 0.008; Analysis 4.6).
Limb survival or limb salvage
No data available
Polyurethane (PUR) graft compared to other grafts
One trial examined a new PUR graft type (Gloor 1996).
Primary patency
Primary patency was worse for the PUR grafts at all time points and the trial was stopped due to safety concerns after only 20 limbs had been randomised. See Analysis 5.1; Analysis 5.2; Analysis 5.3.
Secondary patency
Secondary patency was worse for the PUR grafts at all time points and the trial was stopped due to safety concerns after only 20 limbs had been randomised. See Analysis 5.4; Analysis 5.5; Analysis 5.6.
Limb survival or limb salvage
No data available
Below‐knee bypass
PTFE compared to other graft types
Six studies reported on primary or secondary patency, or both, but analysis was limited by different graft comparisons and reporting at different timepoints (Eickhoff 1987; Gupta 1991; Lumsden 2015; Post 2001; SCAMICOS 2010; Stonebridge 1997).
Primary patency
There was no clear difference in primary patency for PTFE compared to Dacron at 12 months (Peto OR 0.47, 95% CI 0.12 to 1.79; P = 0.27; 45 limbs; 1 study; Analysis 6.2) and 24 months (Peto OR 0.41, 95% CI 0.12 to 1.42; 40 limbs; 1 study; P = 0.16; Analysis 6.3), however the analysis only included one trial (Post 2001).
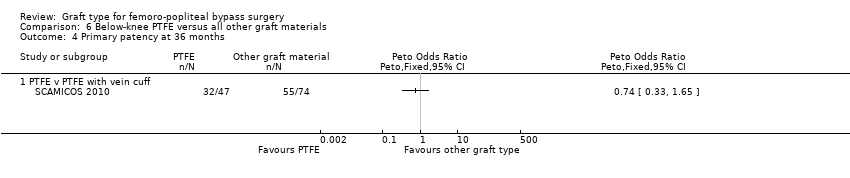
The two trials comparing PTFE with a vein cuff to PTFE alone in below‐knee femoro‐popliteal bypass were heterogeneous: Stonebridge 1997 suggested a benefit with the addition of a vein cuff, whilst SCAMICOS 2010 favoured no cuff. Pooling the data showed no difference in primary patency at six, 12 and 24 months (24 months: Peto OR 1.08, 95% CI 0.58 to 2.01; 182 limbs; 2 studies; Analysis 6.3). Allocation concealment and random sequence generation were not clearly described in Stonebridge 1997, so results may be attributable to selection bias in that trial.
One study (Gupta 1991) considered whether ringed support was of benefit in PTFE grafts below the knee. We found no difference of effect at any time point (Analysis 6.2).
A small number of patients in the FUSION BIOLINE trial had below‐knee bypass (Lumsden 2015). We found no significant difference in primary patency between FUSION BIOLINE and PTFE in this case (Analysis 6.1).
Secondary patency
One trial provided results on below‐the‐knee secondary patency for PTFE versus HUV (Eickhoff 1987).This trial showed improved patency rates for HUV grafts at all time intervals from three months to 24 months. See Analysis 6.5 to Analysis 6.8 (24 months: Peto OR 3.40; 95% CI 1.45 to 7.97, P = 0.005; 88 limbs; 1 study).
The two trials comparing PTFE with a vein cuff to PTFE alone in below‐knee femoro‐popliteal bypass were heterogeneous (SCAMICOS 2010; Stonebridge 1997). Pooling the data showed no difference in secondary patency at 12 and 24 months (24 months: (Peto OR 1.22, 95% CI 0.67 to 2.23; 181 limbs; 2 studies; Analysis 6.8). Allocation concealment and random sequence generation were not clearly described in Stonebridge 1997, so results may be attributable to selection bias in that trial.
Limb survival or limb salvage
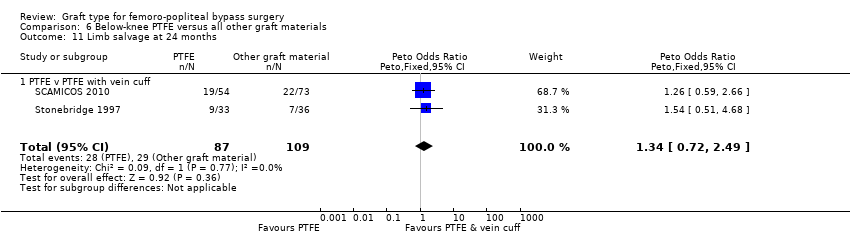
Limited information was available on limb survival for below‐knee femoro‐popliteal bypass. Only Stonebridge 1997 and SCAMICOS 2010 reported this outcome, for PTFE versus PTFE with vein cuff. They found no clear difference at 12 months (Peto OR 1.35, 95% CI 0.72 to 2.55; 225 limbs; 2 studies) or 24 months (Peto OR 1.34, 95% CI 0.72 to 2.49; 196 limbs; 2 studies; Analysis 6.10 and Analysis 6.11).
Heparin bonded Dacron versus all other graft materials
Primary patency
Only Devine 2004 compared HBD grafts with other grafts. No clear differences in primary patency were observed between HBD and PTFE below the knee at any time interval in this study (Devine 2004; Analysis 7.1; Analysis 7.2; Analysis 7.3; Analysis 7.4;Analysis 7.5).
Secondary patency
No data available
Limb survival or limb salvage
No data available
Discussion
Summary of main results
Our major findings were that autologous vein grafts have long‐term patency benefits over prosthetic grafts in above‐knee femoro‐popliteal bypass (moderate‐quality evidence). In the long term (greater than two years), we found that Dacron may confer a slight benefit in secondary patency over polytetrafluoroethylene (PTFE) for above‐knee bypasses (low‐quality evidence). There was no significant improvement in primary and secondary patency for below‐knee PTFE bypasses when a vein cuff was included. Limited evidence was available on below‐knee procedures for all graft types. There was also limited evidence on limb survival for both above‐ and below‐knee bypass surgery.
Overall completeness and applicability of evidence
While there have been many randomised controlled trials conducted for lower limb bypass surgery, the overall quality of these was poor and meant that we had to exclude 24 trials (see Characteristics of excluded studies). Some of the main reasons we excluded trials were because they failed to randomise patients, they did not report the data for above‐ and below‐knee procedures separately, or because they had severe methodological flaws which led to significant bias within the trial.
We only found low numbers of trials for some analyses, especially for below‐knee bypass, which is partly indicative of the numbers of new graft types being introduced and partly indicative of the reduced numbers of lower‐limb bypass procedures now performed. Inclusion criteria for randomised controlled trials produce the potential problem of reducing the applicability of the results to the overall patient population. This was especially a problem in older trials, which included stable or long‐distance claudicants, who are generally not offered surgery in contemporary practice. A subcomponent of any trial including such patients will therefore not be applicable to the overall patient population, but should have a minimal effect on the overall results as these trials have smaller numbers than the more recent included trials. The included trials are largely reflective of modern surgical practice in the UK and are therefore relevant.
Data on limb salvage and survival with limb intact were generally not included for analysis in trials. In the future this should be included as it is an important outcome, both for the patient and from a health economics point of view (Luther 1997; Perler 1995), and may therefore influence practice significantly. Quality‐of‐life data would also be useful in influencing treatment strategy (Nolan 2007). This information might augment the applicability of bypass surgery in general, as evidence is still lacking when comparing infrainguinal bypass with other treatments for lower limb ischaemia (Fowkes 2008).
Human umbilical vein (HUV) has primary patency results comparable with other non‐vein graft types, and may show an improvement in primary and secondary patency compared to polytetrafluoroethylene (PTFE) below the knee. However, in one trial up to 30% of HUV grafts showed graft dilation and aneurysm formation (Aalders 1992). This, in combination with other data at the time, has led to the diminished popularity of HUV in recent years. More recent reviews did not find these factors to be a significant issue (Dardik 2002) and the patency data from this meta‐analysis infer that HUV may be a suitable alternative to synthetic materials when no autologous vein is available.
Heparin bonded Dacron is showing promising early results in randomised trials (Devine 2004). Heparin bonded PTFE is also being widely utilised in contemporary practice. While there are case series data implying that this is an effective material, we could not include data from randomised trials in this review because the results are either awaited (see table Characteristics of ongoing studies), unavailable due to the trial being terminated early (NCT00617279), or reported in a way that does not separate above‐ and below‐knee results (Lindholt 2011).
A single small trial examined the use of polyurethane (PUR) grafts (Gloor 1996). The trial was stopped early due to astonishingly poor primary and secondary patency rates in the limbs treated with the new graft material, so this material cannot be recommended.
Several specific problems could not be assessed in this analysis. Firstly, infection of synthetic bypasses has disastrous consequences for the patient (Siracuse 2013), whereas infection of venous bypasses tends not to, and is easier to treat (Reifsnyder 1992). Occlusion of synthetic bypasses appears to lead to limb loss more frequently than venous (Jackson 2000), which is why it is so important that future trials measure limb survival. A second limitation of this review is the lack of information on antiplatelet and anticoagulant protocols in the included studies; this may have produced bias in the results and their interpretation. Finally, the majority of included studies were not stratified according to graft length, inflow site quality or inflow procedures, or patency of runoff vessels. While the randomisation of participants should have achieved balance with respect to these factors, the small numbers of participants could potentially have led to imbalance between treatment arms, in turn leading to biased results.
Quality of the evidence
While there were low numbers of trials for some comparisons, these trials are mainly of reasonable methodological quality with acceptable allocation concealment techniques, though often simple sealed envelopes were used and little—if any—effort appeared to have been made to blind participants, practitioners or outcome assessors (Figure 2; Figure 3). As a result, we assessed the majority of the evidence contributing to above‐knee bypass comparisons as low quality, which rose to moderate quality for one outcome. We assessed the quality of the evidence on below‐knee bypass comparisons as very low‐quality. Further details are included in summary of findings Table for the main comparison, summary of findings Table 2, summary of findings Table 3 and summary of findings Table 4.
All trials included a Kaplan‐Meier analysis, and most supplemented this with numbers‐at‐risk and life table analyses. The numbers of participants at each stage of the trial were usually clear. However, antiplatelet protocols were generally lacking. There is clear evidence for antiplatelet therapy in cardiovascular stenting (NICE 2003), which may be applicable to lower‐limb arterial stents (Twine 2009). While the evidence is less clear for lower‐limb bypass grafts (Brown 2008; Dorffler‐Melly 2003); clear protocols should be set in future trials to avoid the potential bias caused by individual preferences by surgeons or centres for particular antiplatelets or anticoagulants. Choice of anticoagulant for lower‐limb bypass grafts requires good‐quality randomised controlled trials to determine efficacy.
Potential biases in the review process
Although we are confident that a thorough search was carried out for all relevant studies, we were unable to separate data from trials from patients of below‐ and above‐the‐knee bypasses in all cases. It has been clear for some time that below‐knee bypass grafts have significantly inferior patency rates to above‐knee grafts (Cranley 1982; McCollum 1991). Most trials since the early 1990s have therefore separated the two types of bypass for reporting results, to avoid bias. This led to the division of above‐ and below‐knee procedures in this review. Three trials which were included in previous editions of the review have been excluded in this update or previous updates (or both) as the above‐ and below‐knee data were inseparable (McCollum 1991; Moody 1992; Watelet 1997). More recent trials with combined above‐ and below‐knee procedures had other severe methodological flaws which, in combination, led us to exclude them (Robinson 1999; Robinson 2003). In addition, we excluded two more recent trials either because of combined above‐ and below‐knee numbers (Lindholt 2011), or combined below‐knee and distal bypass numbers (Lundgren 2013). See the table Characteristics of excluded studies.
Agreements and disagreements with other studies or reviews
There are several recent meta‐analyses of graft type for femoro‐popliteal bypass grafts (Albers 2005; Pereira 2006; Roll 2008; Rychlik 2014a). In Albers 2005, alternative autologous vein (defined as any autologous venous conduit other than a single section of great saphenous vein) was compared with PTFE, HUV and cryopreserved vein. Randomised controlled trials and cohort controlled trials were considered for inclusion. The authors included retrospective data and combined above‐ and below‐knee bypasses. Thirty‐two articles with 2618 patients from studies conducted between 1982 and 2004 were included. Pooled estimate analysis was performed in which the authors found no difference in primary patency between autologous vein and PTFE, but reported a significant improvement in secondary patency and foot preservation for alternative autologous veins. While not directly comparable with our analysis, these data provide more evidence for autologous vein over prosthetic grafts.
In Pereira 2006, above‐knee autologous vein, PTFE and below‐knee autologous vein were compared. Randomised controlled trials and cohort trials were considered for inclusion. Forty‐nine retrospective articles and 24 prospective articles from 1986 to 2004 were included. As well as including retrospective data, the authors included several studies which we excluded from our analysis because of inadequate randomisation. Pooled estimate analysis was performed, in which the authors found a significant improvement in primary patency for above‐knee autologous vein when compared with PTFE. Secondary patency was lower for all graft types and showed no significant difference. Therefore, Pereira 2006 also broadly agrees with the findings of this analysis that autologous vein performs better than PTFE above the knee. The authors' findings should, however, be interpreted with caution due to the nature of the data included.
One meta‐analysis (Roll 2008), compared Dacron with PTFE and found no difference between the graft types. The authors included bypasses other than femoro‐popliteal (axillo‐bifemoral, aorto‐bifemoral, etc.) but had strict inclusion criteria and therefore included good‐quality trials. Our analysis is in broad agreement with the findings of Roll 2008 in terms of primary patency, though we did find an improvement in secondary patency at 24 months and five years, the latter as a result of data from the van Det study (van Det 2009), published after Roll (Roll 2008). Therefore, the findings of our analysis are broadly in agreement with Roll 2008. For this reason, the long‐term secondary patency benefit towards Dacon is tentative, as discussed throughout the text.
One meta‐analysis (Rychlik 2014a) compared Dacron with PTFE above the knee.It had similar exclusion criteria to our review and found results from five studies which are included in our analysis, in addition to one study which we excluded from our meta‐analysis due to its methodological flaws (Davidovic 2010). They chose to include the results of Devine 2004, which compared heparin bonded Dacron with PTFE, alongside the four studies comparing standard Dacron with PTFE (Abbot 1997; Jensen 2007; Post 2001; van Det 2009). Their conclusions were similar to our results in this context: that Dacron has superior patency to PTFE at 2 and 5 years follow‐up.
A previous meta‐analysis (Twine 2012) has shown benefit for PTFE with vein cuff for below‐knee bypass. This analysis included non‐randomised studies, and based on the results seen in our analysis, the benefit shown in Twine 2012 may be because of selection bias in the non‐randomised data. It is unlikely that another RCT of cuffed bypass will be performed, and most surgeons will perform a cuffed anastomosis for synthetic bypass distal to the knee. Registry data is becoming increasingly prevalent in vascular surgery and may help to answer this question more definitively in the future.
Risk of bias graph: review authors' judgements about each risk of bias item presented as percentages across all included studies.
Risk of bias summary: review authors' judgements about each risk of bias item for each included study.

Comparison 1 Above‐knee autologous vein versus all other graft materials, Outcome 1 Primary patency at 3 months.

Comparison 1 Above‐knee autologous vein versus all other graft materials, Outcome 2 Primary patency at 6 months.
Comparison 1 Above‐knee autologous vein versus all other graft materials, Outcome 3 Primary patency at 12 months.

Comparison 1 Above‐knee autologous vein versus all other graft materials, Outcome 4 Primary patency at 24 months.

Comparison 1 Above‐knee autologous vein versus all other graft materials, Outcome 5 Primary patency at 60 months.

Comparison 1 Above‐knee autologous vein versus all other graft materials, Outcome 6 Secondary patency at 3 months.

Comparison 1 Above‐knee autologous vein versus all other graft materials, Outcome 7 Secondary patency at 6 months.
Comparison 1 Above‐knee autologous vein versus all other graft materials, Outcome 8 Secondary patency at 12 months.
Comparison 1 Above‐knee autologous vein versus all other graft materials, Outcome 9 Secondary patency at 24 months.
Comparison 1 Above‐knee autologous vein versus all other graft materials, Outcome 10 Secondary patency at 60 months.

Comparison 2 Above‐knee PTFE versus all other graft materials, Outcome 1 Primary patency at 3 months.

Comparison 2 Above‐knee PTFE versus all other graft materials, Outcome 2 Primary patency at 6 months.

Comparison 2 Above‐knee PTFE versus all other graft materials, Outcome 3 Primary patency at 12 months.
Comparison 2 Above‐knee PTFE versus all other graft materials, Outcome 4 Primary patency at 24 months.

Comparison 2 Above‐knee PTFE versus all other graft materials, Outcome 5 Primary patency at 60 months.

Comparison 2 Above‐knee PTFE versus all other graft materials, Outcome 6 Secondary patency at 3 months.

Comparison 2 Above‐knee PTFE versus all other graft materials, Outcome 7 Secondary patency at 6 months.

Comparison 2 Above‐knee PTFE versus all other graft materials, Outcome 8 Secondary patency at 12 months.

Comparison 2 Above‐knee PTFE versus all other graft materials, Outcome 9 Secondary patency at 24 months.

Comparison 2 Above‐knee PTFE versus all other graft materials, Outcome 10 Secondary patency at 60 months.

Comparison 2 Above‐knee PTFE versus all other graft materials, Outcome 11 Limb salvage at 1 month.

Comparison 2 Above‐knee PTFE versus all other graft materials, Outcome 12 Limb salvage at 24 months.

Comparison 3 Above‐knee heparin bonded Dacron versus all other graft materials, Outcome 1 Primary patency at 12 months.

Comparison 3 Above‐knee heparin bonded Dacron versus all other graft materials, Outcome 2 Primary patency at 24 months.
Comparison 3 Above‐knee heparin bonded Dacron versus all other graft materials, Outcome 3 Primary patency at 60 months.

Comparison 4 Above‐knee externally supported graft versus unsupported graft materials, Outcome 1 Primary patency at 6 months.

Comparison 4 Above‐knee externally supported graft versus unsupported graft materials, Outcome 2 Primary patency at 12 months.

Comparison 4 Above‐knee externally supported graft versus unsupported graft materials, Outcome 3 Primary patency at 24 months.

Comparison 4 Above‐knee externally supported graft versus unsupported graft materials, Outcome 4 Secondary patency at 6 months.

Comparison 4 Above‐knee externally supported graft versus unsupported graft materials, Outcome 5 Secondary patency at 12 months.

Comparison 4 Above‐knee externally supported graft versus unsupported graft materials, Outcome 6 Secondary patency at 24 months.

Comparison 5 Above‐knee polyurethane (PUR) versus all other graft materials, Outcome 1 Primary patency at 3 months.

Comparison 5 Above‐knee polyurethane (PUR) versus all other graft materials, Outcome 2 Primary patency at 6 months.

Comparison 5 Above‐knee polyurethane (PUR) versus all other graft materials, Outcome 3 Primary patency at 12 months.

Comparison 5 Above‐knee polyurethane (PUR) versus all other graft materials, Outcome 4 Secondary patency at 3 months.

Comparison 5 Above‐knee polyurethane (PUR) versus all other graft materials, Outcome 5 Secondary patency at 6 months.

Comparison 5 Above‐knee polyurethane (PUR) versus all other graft materials, Outcome 6 Secondary patency at 12 months.

Comparison 6 Below‐knee PTFE versus all other graft materials, Outcome 1 Primary patency at 6 months.

Comparison 6 Below‐knee PTFE versus all other graft materials, Outcome 2 Primary patency at 12 months.

Comparison 6 Below‐knee PTFE versus all other graft materials, Outcome 3 Primary patency at 24 months.
Comparison 6 Below‐knee PTFE versus all other graft materials, Outcome 4 Primary patency at 36 months.

Comparison 6 Below‐knee PTFE versus all other graft materials, Outcome 5 Secondary patency at 3 months.

Comparison 6 Below‐knee PTFE versus all other graft materials, Outcome 6 Secondary patency at 6 months.

Comparison 6 Below‐knee PTFE versus all other graft materials, Outcome 7 Secondary patency at 12 months.

Comparison 6 Below‐knee PTFE versus all other graft materials, Outcome 8 Secondary patency at 24 months.

Comparison 6 Below‐knee PTFE versus all other graft materials, Outcome 9 Secondary patency at 36 months.

Comparison 6 Below‐knee PTFE versus all other graft materials, Outcome 10 Limb salvage at 12 months.
Comparison 6 Below‐knee PTFE versus all other graft materials, Outcome 11 Limb salvage at 24 months.

Comparison 7 Below‐knee heparin bonded Dacron versus all other graft materials, Outcome 1 Primary patency at 3 months.

Comparison 7 Below‐knee heparin bonded Dacron versus all other graft materials, Outcome 2 Primary patency at 6 months.

Comparison 7 Below‐knee heparin bonded Dacron versus all other graft materials, Outcome 3 Primary patency at 12 months.

Comparison 7 Below‐knee heparin bonded Dacron versus all other graft materials, Outcome 4 Primary patency at 24 months.

Comparison 7 Below‐knee heparin bonded Dacron versus all other graft materials, Outcome 5 Primary patency at 60 months.
| Autologous vein compared to other graft types for above‐knee femoro‐popliteal bypass surgery | ||||||
| Patient or population: people with peripheral vascular disease requiring above‐knee femoro‐popliteal bypass surgery | ||||||
| Outcomes | Anticipated absolute effects* (95% CI) | Relative effect | № of limbs | Quality of the evidence | Comments | |
| Risk with other graft types | Risk with autologous vein | |||||
| Primary patency (24 months) | Study population | OR 0.59 | 422 | ⊕⊕⊝⊝ | 92 fewer autologous vein grafts per 1000 (10 to 152 grafts per 1000) lose primary patency by 24 months compared to other grafts studied | |
| 275 per 1000 | 183 per 1000 | |||||
| Primary patency (60 months) | Study population | OR 0.47 | 269 | ⊕⊕⊕⊝ | 172 fewer autologous vein grafts per 1000 (54 to 264 grafts per 1000) lose primary patency by 60 months compared to other grafts studied | |
| 451 per 1000 | 279 per 1000 | |||||
| Secondary patency (60 months) | Study population | OR 0.41 | 176 | ⊕⊕⊝⊝ | 213 fewer autologous vein grafts per 1000 (75 to 330 grafts per 1000) lose secondary patency by 60 months compared to other grafts studied | |
| 526 per 1000 | 313 per 1000 | |||||
| Limb salvage | ‐ | ‐ | ‐ | ‐ | ‐ | No studies of these graft types reported on this outcome |
| *The risk in the intervention group (and its 95% confidence interval) is based on the assumed risk in the comparison group and the relative effect of the intervention (and its 95% CI). | ||||||
| GRADE Working Group grades of evidence | ||||||
| 1 Downgraded due to serious risk of bias resulting from lack of blinding and poor randomisation techniques | ||||||
| PTFE compared to Dacron for above‐knee femoro‐popliteal bypass surgery | ||||||
| Patient or population: people with peripheral vascular disease requiring above‐knee femoro‐popliteal bypass surgery | ||||||
| Outcomes | Anticipated absolute effects* (95% CI) | Relative effect | № of limbs | Quality of the evidence | Comments | |
| Risk with Dacron | Risk with PTFE | |||||
| Primary patency (24 months) | Study population | OR 1.23 | 764 | ⊕⊕⊝⊝ | Our confidence in the effect is limited and this may differ substantially from the estimate of the effect | |
| 404 per 1000 | 454 per 1000 | |||||
| Primary patency (60 months) | Study population | OR 1.67 | 247 | ⊕⊕⊝⊝ | Our confidence in the effect is limited and this may differ substantially from the estimate of the effect | |
| 606 per 1000 | 720 per 1000 | |||||
| Secondary patency (24 months) | Study population | OR 1.54 | 528 | ⊕⊕⊝⊝ | 81 more PTFE grafts per 1000 (7 to 168 per 1000) suffer from failed secondary patency by 24 months compared to Dacron | |
| 212 per 1000 | 293 per 1000 | |||||
| Limb salvage (24 months) | Study population | OR 0.82 | 322 | ⊕⊕⊝⊝ | Our confidence in the effect is limited and this may differ substantially from the estimate of the effect | |
| 44 per 1000 | 37 per 1000 | |||||
| *The risk in the intervention group (and its 95% confidence interval) is based on the assumed risk in the comparison group and the relative effect of the intervention (and its 95% CI). | ||||||
| GRADE Working Group grades of evidence | ||||||
| 1 Downgraded because of serious risk of bias due to lack of blinding and poor randomisation techniques | ||||||
| Externally supported graft compared to unsupported graft for above‐knee femoro‐popliteal bypass surgery | ||||||
| Patient or population: people with peripheral vascular disease requiring above‐knee femoro‐popliteal bypass surgery | ||||||
| Outcomes | Anticipated absolute effects* (95% CI) | Relative effect | № of limbs | Quality of the evidence | Comments | |
| Risk with unsupported graft | Risk with externally supported graft | |||||
| Primary patency (24 months) | Study population | OR 2.08 | 270 | ⊕⊕⊝⊝ | 180 fewer unsupported prosthetic grafts per 1000 (61 to 293 grafts per 1000) lose primary patency by 24 months compared to externally supported prosthetic grafts | |
| 376 per 1000 | 556 per 1000 | |||||
| Primary patency (60 months) | ‐ | ‐ | ‐ | ‐ | ‐ | No studies comparing supported and unsupported Dacron reported on primary patency at 60 months |
| Secondary patency (24 months) | Study population | OR 2.25 | 236 | ⊕⊕⊝⊝ | 143 fewer unsupported Dacron grafts per 1000 (32 to 281 grafts per 1,000) lose secondary patency by 24 months compared to externally supported Dacron grafts | |
| 165 per 1000 | 308 per 1000 | |||||
| Limb salvage | ‐ | ‐ | ‐ | ‐ | ‐ | No studies of these graft types reported on this outcome |
| *The risk in the intervention group (and its 95% confidence interval) is based on the assumed risk in the comparison group and the relative effect of the intervention (and its 95% CI). | ||||||
| GRADE Working Group grades of evidence | ||||||
| 1 Downgraded because of serious risk of bias due to lack of blinding and poor randomisation techniques | ||||||
| PTFE compared to PTFE with vein cuff for below‐knee femoro‐popliteal bypass surgery | ||||||
| Patient or population: people with peripheral vascular disease requiring below‐knee femoro‐popliteal bypass surgery | ||||||
| Outcomes | Anticipated absolute effects* (95% CI) | Relative effect | № of limbs | Quality of the evidence | Comments | |
| Risk with PTFE with vein cuff | Risk with PTFE | |||||
| Primary patency (24 months) | Study population | OR 1.08 | 182 | ⊕⊝⊝⊝ | Findings from two small trials were inconsistent so our confidence in the effect is limited and this may differ substantially from the estimate of the effect | |
| 626 per 1000 | 644 per 1000 | |||||
| Primary patency (60 months) | ‐ | ‐ | ‐ | ‐ | ‐ | No studies comparing PTFE with and without a vein cuff for below‐knee bypass reported on primary patency at 60 months |
| Secondary patency (24 months) | Study population | OR 1.22 | 181 | ⊕⊝⊝⊝ | Findings from two small trials were inconsistent so our confidence in the effect is limited and this may differ substantially from the estimate of the effect | |
| 557 per 1000 | 605 per 1000 | |||||
| Limb salvage (24 months) | Study population | OR 1.34 | 196 | ⊕⊕⊝⊝ | Our confidence in the effect is limited and this may differ substantially from the estimate of the effect | |
| 266 per 1000 | 327 per 1000 | |||||
| *The risk in the intervention group (and its 95% confidence interval) is based on the assumed risk in the comparison group and the relative effect of the intervention (and its 95% CI). | ||||||
| GRADE Working Group grades of evidence | ||||||
| 1 Downgraded due to serious risk of bias resulting from lack of blinding and poor randomisation techniques | ||||||
| Outcome or subgroup title | No. of studies | No. of participants | Statistical method | Effect size |
| 1 Primary patency at 3 months Show forest plot | 4 | 466 | Peto Odds Ratio (Peto, Fixed, 95% CI) | 1.20 [0.58, 2.48] |
| 1.1 Autologous vein v PTFE | 2 | 249 | Peto Odds Ratio (Peto, Fixed, 95% CI) | 1.27 [0.41, 3.97] |
| 1.2 Autologous vein v other graft types | 2 | 217 | Peto Odds Ratio (Peto, Fixed, 95% CI) | 1.16 [0.45, 2.96] |
| 2 Primary patency at 6 months Show forest plot | 4 | 452 | Peto Odds Ratio (Peto, Fixed, 95% CI) | 1.01 [0.56, 1.83] |
| 2.1 Autologous vein v PTFE | 2 | 245 | Peto Odds Ratio (Peto, Fixed, 95% CI) | 1.12 [0.45, 2.78] |
| 2.2 Autologous vein v other graft types | 2 | 207 | Peto Odds Ratio (Peto, Fixed, 95% CI) | 0.94 [0.43, 2.05] |
| 3 Primary patency at 12 months Show forest plot | 4 | 440 | Peto Odds Ratio (Peto, Fixed, 95% CI) | 0.73 [0.44, 1.22] |
| 3.1 Autologous vein v PTFE | 2 | 238 | Peto Odds Ratio (Peto, Fixed, 95% CI) | 0.81 [0.37, 1.76] |
| 3.2 Autologous vein v other graft types | 2 | 202 | Peto Odds Ratio (Peto, Fixed, 95% CI) | 0.67 [0.34, 1.33] |
| 4 Primary patency at 24 months Show forest plot | 4 | 422 | Peto Odds Ratio (Peto, Fixed, 95% CI) | 0.59 [0.37, 0.94] |
| 4.1 Autologous vein vs PTFE | 2 | 232 | Peto Odds Ratio (Peto, Fixed, 95% CI) | 0.67 [0.34, 1.33] |
| 4.2 Autologous vein vs other graft types | 2 | 190 | Peto Odds Ratio (Peto, Fixed, 95% CI) | 0.52 [0.28, 0.99] |
| 5 Primary patency at 60 months Show forest plot | 3 | 269 | Peto Odds Ratio (Peto, Fixed, 95% CI) | 0.47 [0.28, 0.80] |
| 5.1 Autologous vein v PTFE | 2 | 191 | Peto Odds Ratio (Peto, Fixed, 95% CI) | 0.48 [0.25, 0.95] |
| 5.2 Autologous vein vs other graft type | 1 | 78 | Peto Odds Ratio (Peto, Fixed, 95% CI) | 0.44 [0.18, 1.07] |
| 6 Secondary patency at 3 months Show forest plot | 3 | 364 | Peto Odds Ratio (Peto, Fixed, 95% CI) | 1.05 [0.47, 2.32] |
| 6.1 Autologous vein v PTFE | 1 | 147 | Peto Odds Ratio (Peto, Fixed, 95% CI) | 1.08 [0.30, 3.87] |
| 6.2 Autologous vein v other graft types | 2 | 217 | Peto Odds Ratio (Peto, Fixed, 95% CI) | 1.03 [0.37, 2.83] |
| 7 Secondary patency at 6 months Show forest plot | 3 | 351 | Peto Odds Ratio (Peto, Fixed, 95% CI) | 0.95 [0.49, 1.82] |
| 7.1 Autologous vein v PTFE | 1 | 143 | Peto Odds Ratio (Peto, Fixed, 95% CI) | 0.98 [0.36, 2.69] |
| 7.2 Autologous vein v other graft types | 2 | 208 | Peto Odds Ratio (Peto, Fixed, 95% CI) | 0.92 [0.39, 2.19] |
| 8 Secondary patency at 12 months Show forest plot | 3 | 338 | Peto Odds Ratio (Peto, Fixed, 95% CI) | 0.81 [0.45, 1.45] |
| 8.1 Autologous vein v PTFE | 1 | 136 | Peto Odds Ratio (Peto, Fixed, 95% CI) | 0.99 [0.39, 2.51] |
| 8.2 Autologous vein v other graft types | 2 | 202 | Peto Odds Ratio (Peto, Fixed, 95% CI) | 0.71 [0.34, 1.50] |
| 9 Secondary patency at 24 months Show forest plot | 3 | 320 | Peto Odds Ratio (Peto, Fixed, 95% CI) | 0.70 [0.41, 1.19] |
| 9.1 Autologous vein v PTFE | 1 | 130 | Peto Odds Ratio (Peto, Fixed, 95% CI) | 0.83 [0.37, 1.87] |
| 9.2 Autologous vein v other graft type | 2 | 190 | Peto Odds Ratio (Peto, Fixed, 95% CI) | 0.62 [0.31, 1.24] |
| 10 Secondary patency at 60 months Show forest plot | 2 | 176 | Peto Odds Ratio (Peto, Fixed, 95% CI) | 0.41 [0.22, 0.74] |
| 10.1 Autologous vein v PTFE | 1 | 98 | Peto Odds Ratio (Peto, Fixed, 95% CI) | 0.44 [0.20, 0.99] |
| 10.2 Autologous vein v other graft types | 1 | 78 | Peto Odds Ratio (Peto, Fixed, 95% CI) | 0.37 [0.15, 0.90] |
| Outcome or subgroup title | No. of studies | No. of participants | Statistical method | Effect size |
| 1 Primary patency at 3 months Show forest plot | 2 | 312 | Peto Odds Ratio (Peto, Fixed, 95% CI) | 2.36 [0.81, 6.87] |
| 1.1 PTFE v HUV | 1 | 93 | Peto Odds Ratio (Peto, Fixed, 95% CI) | 1.55 [0.26, 9.33] |
| 1.2 PTFE v Dacron | 1 | 219 | Peto Odds Ratio (Peto, Fixed, 95% CI) | 2.97 [0.78, 11.25] |
| 2 Primary patency at 6 months Show forest plot | 5 | 824 | Peto Odds Ratio (Peto, Fixed, 95% CI) | 2.11 [1.37, 3.25] |
| 2.1 PTFE v HUV | 1 | 90 | Peto Odds Ratio (Peto, Fixed, 95% CI) | 2.56 [0.69, 9.47] |
| 2.2 PTFE v Dacron | 2 | 421 | Peto Odds Ratio (Peto, Fixed, 95% CI) | 1.57 [0.79, 3.11] |
| 2.3 PTFE v PTFE with vein cuff | 1 | 139 | Peto Odds Ratio (Peto, Fixed, 95% CI) | 1.80 [0.57, 5.60] |
| 2.4 PTFE v FUSION BIOLINE | 1 | 174 | Peto Odds Ratio (Peto, Fixed, 95% CI) | 2.99 [1.43, 6.26] |
| 3 Primary patency at 12 months Show forest plot | 6 | 1088 | Peto Odds Ratio (Peto, Fixed, 95% CI) | 1.23 [0.93, 1.64] |
| 3.1 PTFE v HUV | 1 | 83 | Peto Odds Ratio (Peto, Fixed, 95% CI) | 3.17 [1.04, 9.64] |
| 3.2 PTFE v Dacron | 4 | 875 | Peto Odds Ratio (Peto, Fixed, 95% CI) | 1.24 [0.91, 1.70] |
| 3.3 PTFE v PTFE with vein cuff | 1 | 130 | Peto Odds Ratio (Peto, Fixed, 95% CI) | 0.64 [0.26, 1.56] |
| 4 Primary patency at 24 months Show forest plot | 6 | 945 | Peto Odds Ratio (Peto, Fixed, 95% CI) | 1.31 [1.00, 1.71] |
| 4.1 PTFE V HUV | 1 | 82 | Peto Odds Ratio (Peto, Fixed, 95% CI) | 4.80 [1.76, 13.06] |
| 4.2 PTFE V Dacron | 4 | 764 | Peto Odds Ratio (Peto, Fixed, 95% CI) | 1.23 [0.92, 1.65] |
| 4.3 PTFE v PTFE with vein cuff | 1 | 99 | Peto Odds Ratio (Peto, Fixed, 95% CI) | 0.86 [0.37, 2.02] |
| 5 Primary patency at 60 months Show forest plot | 3 | 316 | Peto Odds Ratio (Peto, Fixed, 95% CI) | 2.06 [1.28, 3.31] |
| 5.1 PTFE v HUV | 1 | 69 | Peto Odds Ratio (Peto, Fixed, 95% CI) | 3.75 [1.46, 9.62] |
| 5.2 PTFE v Dacron | 2 | 247 | Peto Odds Ratio (Peto, Fixed, 95% CI) | 1.67 [0.96, 2.90] |
| 6 Secondary patency at 3 months Show forest plot | 1 | Peto Odds Ratio (Peto, Fixed, 95% CI) | Totals not selected | |
| 6.1 PTFE v HUV | 1 | Peto Odds Ratio (Peto, Fixed, 95% CI) | 0.0 [0.0, 0.0] | |
| 7 Secondary patency at 6 months Show forest plot | 2 | 318 | Peto Odds Ratio (Peto, Fixed, 95% CI) | 1.32 [0.48, 3.62] |
| 7.1 PTFE v HUV | 1 | 93 | Peto Odds Ratio (Peto, Fixed, 95% CI) | 1.76 [0.42, 7.44] |
| 7.2 PTFE v Dacron | 1 | 225 | Peto Odds Ratio (Peto, Fixed, 95% CI) | 1.01 [0.25, 4.13] |
| 8 Secondary patency at 12 months Show forest plot | 4 | 806 | Peto Odds Ratio (Peto, Fixed, 95% CI) | 1.18 [0.80, 1.74] |
| 8.1 PTFE v HUV | 1 | 93 | Peto Odds Ratio (Peto, Fixed, 95% CI) | 1.60 [0.43, 5.89] |
| 8.2 PTFE v Dacron | 2 | 581 | Peto Odds Ratio (Peto, Fixed, 95% CI) | 1.19 [0.76, 1.86] |
| 8.3 PTFE v PTFE with vein cuff | 1 | 132 | Peto Odds Ratio (Peto, Fixed, 95% CI) | 0.99 [0.39, 2.52] |
| 9 Secondary patency at 24 months Show forest plot | 4 | 700 | Peto Odds Ratio (Peto, Fixed, 95% CI) | 1.66 [1.18, 2.33] |
| 9.1 PTFE V HUV | 1 | 93 | Peto Odds Ratio (Peto, Fixed, 95% CI) | 4.01 [1.44, 11.17] |
| 9.2 PTFE v Dacron | 2 | 528 | Peto Odds Ratio (Peto, Fixed, 95% CI) | 1.54 [1.04, 2.28] |
| 9.3 PTFE v PTFE with vein cuff | 1 | 79 | Peto Odds Ratio (Peto, Fixed, 95% CI) | 1.22 [0.48, 3.06] |
| 10 Secondary patency at 60 months Show forest plot | 2 | 260 | Peto Odds Ratio (Peto, Fixed, 95% CI) | 2.86 [1.73, 4.72] |
| 10.1 PTFE v HUV | 1 | 93 | Peto Odds Ratio (Peto, Fixed, 95% CI) | 3.87 [1.65, 9.05] |
| 10.2 PTFE v Dacron | 1 | 167 | Peto Odds Ratio (Peto, Fixed, 95% CI) | 2.43 [1.31, 4.53] |
| 11 Limb salvage at 1 month Show forest plot | 2 | 560 | Peto Odds Ratio (Peto, Fixed, 95% CI) | 0.68 [0.12, 3.98] |
| 11.1 PTFE v Dacron | 1 | 410 | Peto Odds Ratio (Peto, Fixed, 95% CI) | 0.14 [0.01, 2.20] |
| 11.2 PTFE v PTFE with vein cuff | 1 | 150 | Peto Odds Ratio (Peto, Fixed, 95% CI) | 2.02 [0.21, 19.72] |
| 12 Limb salvage at 24 months Show forest plot | 2 | 389 | Peto Odds Ratio (Peto, Fixed, 95% CI) | 0.73 [0.33, 1.62] |
| 12.1 PTFE v Dacron | 1 | 322 | Peto Odds Ratio (Peto, Fixed, 95% CI) | 0.82 [0.27, 2.48] |
| 12.2 PTFE v PTFE with vein cuff | 1 | 67 | Peto Odds Ratio (Peto, Fixed, 95% CI) | 0.64 [0.20, 2.04] |
| Outcome or subgroup title | No. of studies | No. of participants | Statistical method | Effect size |
| 1 Primary patency at 12 months Show forest plot | 2 | 294 | Peto Odds Ratio (Peto, Fixed, 95% CI) | 0.58 [0.34, 0.98] |
| 1.1 HBD v HUV | 1 | 123 | Peto Odds Ratio (Peto, Fixed, 95% CI) | 0.47 [0.20, 1.12] |
| 1.2 HBD v PTFE | 1 | 171 | Peto Odds Ratio (Peto, Fixed, 95% CI) | 0.65 [0.34, 1.25] |
| 2 Primary patency at 24 months Show forest plot | 2 | 282 | Peto Odds Ratio (Peto, Fixed, 95% CI) | 0.62 [0.38, 1.02] |
| 2.1 HBD v HUV | 1 | 117 | Peto Odds Ratio (Peto, Fixed, 95% CI) | 0.59 [0.26, 1.33] |
| 2.2 HBD v PTFE | 1 | 165 | Peto Odds Ratio (Peto, Fixed, 95% CI) | 0.64 [0.34, 1.19] |
| 3 Primary patency at 60 months Show forest plot | 2 | 232 | Peto Odds Ratio (Peto, Fixed, 95% CI) | 0.55 [0.33, 0.93] |
| 3.1 HBD v HUV | 1 | 86 | Peto Odds Ratio (Peto, Fixed, 95% CI) | 1.07 [0.45, 2.51] |
| 3.2 HBD v PTFE | 1 | 146 | Peto Odds Ratio (Peto, Fixed, 95% CI) | 0.38 [0.20, 0.72] |
| Outcome or subgroup title | No. of studies | No. of participants | Statistical method | Effect size |
| 1 Primary patency at 6 months Show forest plot | 2 | 299 | Peto Odds Ratio (Peto, Fixed, 95% CI) | 1.28 [0.71, 2.31] |
| 1.1 Externally supported dacron versus unsupported dacron | 1 | 253 | Peto Odds Ratio (Peto, Fixed, 95% CI) | 1.29 [0.69, 2.39] |
| 1.2 Externally supported PTFE versus unsupported PTFE | 1 | 46 | Peto Odds Ratio (Peto, Fixed, 95% CI) | 1.21 [0.16, 9.25] |
| 2 Primary patency at 12 months Show forest plot | 2 | 286 | Peto Odds Ratio (Peto, Fixed, 95% CI) | 1.78 [1.06, 2.98] |
| 2.1 Externally supported dacron versus unsupported dacron | 1 | 246 | Peto Odds Ratio (Peto, Fixed, 95% CI) | 1.71 [0.99, 2.93] |
| 2.2 Externally supported PTFE versus unsupported PTFE | 1 | 40 | Peto Odds Ratio (Peto, Fixed, 95% CI) | 2.73 [0.49, 15.28] |
| 3 Primary patency at 24 months Show forest plot | 2 | 270 | Peto Odds Ratio (Peto, Fixed, 95% CI) | 2.08 [1.29, 3.35] |
| 3.1 Externally supported dacron versus unsupported dacron | 1 | 240 | Peto Odds Ratio (Peto, Fixed, 95% CI) | 2.09 [1.26, 3.46] |
| 3.2 Externally supported PTFE versus unsupported PTFE | 1 | 30 | Peto Odds Ratio (Peto, Fixed, 95% CI) | 2.01 [0.46, 8.76] |
| 4 Secondary patency at 6 months Show forest plot | 1 | Peto Odds Ratio (Peto, Fixed, 95% CI) | Totals not selected | |
| 5 Secondary patency at 12 months Show forest plot | 1 | Peto Odds Ratio (Peto, Fixed, 95% CI) | Totals not selected | |
| 6 Secondary patency at 24 months Show forest plot | 1 | Peto Odds Ratio (Peto, Fixed, 95% CI) | Totals not selected | |
| Outcome or subgroup title | No. of studies | No. of participants | Statistical method | Effect size |
| 1 Primary patency at 3 months Show forest plot | 1 | Peto Odds Ratio (Peto, Fixed, 95% CI) | Totals not selected | |
| 2 Primary patency at 6 months Show forest plot | 1 | Peto Odds Ratio (Peto, Fixed, 95% CI) | Totals not selected | |
| 3 Primary patency at 12 months Show forest plot | 1 | Peto Odds Ratio (Peto, Fixed, 95% CI) | Totals not selected | |
| 4 Secondary patency at 3 months Show forest plot | 1 | Peto Odds Ratio (Peto, Fixed, 95% CI) | Totals not selected | |
| 5 Secondary patency at 6 months Show forest plot | 1 | Peto Odds Ratio (Peto, Fixed, 95% CI) | Totals not selected | |
| 6 Secondary patency at 12 months Show forest plot | 1 | Peto Odds Ratio (Peto, Fixed, 95% CI) | Totals not selected | |
| Outcome or subgroup title | No. of studies | No. of participants | Statistical method | Effect size |
| 1 Primary patency at 6 months Show forest plot | 4 | 319 | Peto Odds Ratio (Peto, Fixed, 95% CI) | 1.12 [0.67, 1.87] |
| 1.1 PTFE v ringed PTFE | 1 | 44 | Peto Odds Ratio (Peto, Fixed, 95% CI) | 1.47 [0.32, 6.71] |
| 1.2 PTFE v PTFE with vein cuff | 2 | 247 | Peto Odds Ratio (Peto, Fixed, 95% CI) | 1.00 [0.56, 1.78] |
| 1.3 PTFE v FUSION BIOLINE | 1 | 28 | Peto Odds Ratio (Peto, Fixed, 95% CI) | 1.96 [0.39, 9.83] |
| 2 Primary patency at 12 months Show forest plot | 4 | 305 | Peto Odds Ratio (Peto, Fixed, 95% CI) | 0.96 [0.60, 1.55] |
| 2.1 PTFE v Dacron | 1 | 45 | Peto Odds Ratio (Peto, Fixed, 95% CI) | 0.47 [0.12, 1.79] |
| 2.2 PTFE v PTFE with vein cuff | 2 | 224 | Peto Odds Ratio (Peto, Fixed, 95% CI) | 1.02 [0.59, 1.76] |
| 2.3 PTFE v ringed PTFE | 1 | 36 | Peto Odds Ratio (Peto, Fixed, 95% CI) | 1.48 [0.35, 6.24] |
| 3 Primary patency at 24 months Show forest plot | 4 | 250 | Peto Odds Ratio (Peto, Fixed, 95% CI) | 0.94 [0.56, 1.57] |
| 3.1 PTFE v Dacron | 1 | 40 | Peto Odds Ratio (Peto, Fixed, 95% CI) | 0.41 [0.12, 1.42] |
| 3.2 PTFE v PTFE with vein cuff | 2 | 182 | Peto Odds Ratio (Peto, Fixed, 95% CI) | 1.08 [0.58, 2.01] |
| 3.3 PTFE v ringed PTFE | 1 | 28 | Peto Odds Ratio (Peto, Fixed, 95% CI) | 1.32 [0.31, 5.67] |
| 4 Primary patency at 36 months Show forest plot | 1 | Peto Odds Ratio (Peto, Fixed, 95% CI) | Totals not selected | |
| 4.1 PTFE v PTFE with vein cuff | 1 | Peto Odds Ratio (Peto, Fixed, 95% CI) | 0.0 [0.0, 0.0] | |
| 5 Secondary patency at 3 months Show forest plot | 1 | Peto Odds Ratio (Peto, Fixed, 95% CI) | Totals not selected | |
| 5.1 PTFE v HUV | 1 | Peto Odds Ratio (Peto, Fixed, 95% CI) | 0.0 [0.0, 0.0] | |
| 6 Secondary patency at 6 months Show forest plot | 2 | 242 | Peto Odds Ratio (Peto, Fixed, 95% CI) | 1.21 [0.69, 2.13] |
| 6.1 PTFE v HUV | 1 | 71 | Peto Odds Ratio (Peto, Fixed, 95% CI) | 3.01 [1.12, 8.07] |
| 6.2 PTFE v PTFE with vein cuff | 1 | 171 | Peto Odds Ratio (Peto, Fixed, 95% CI) | 0.79 [0.40, 1.56] |
| 7 Secondary patency at 12 months Show forest plot | 3 | 325 | Peto Odds Ratio (Peto, Fixed, 95% CI) | 1.48 [0.94, 2.34] |
| 7.1 PTFE v HUV | 1 | 101 | Peto Odds Ratio (Peto, Fixed, 95% CI) | 2.46 [1.10, 5.49] |
| 7.2 PTFE v PTFE with vein cuff | 2 | 224 | Peto Odds Ratio (Peto, Fixed, 95% CI) | 1.16 [0.66, 2.03] |
| 8 Secondary patency at 24 months Show forest plot | 3 | 269 | Peto Odds Ratio (Peto, Fixed, 95% CI) | 1.72 [1.05, 2.80] |
| 8.1 PTFE v HUV | 1 | 88 | Peto Odds Ratio (Peto, Fixed, 95% CI) | 3.40 [1.45, 7.97] |
| 8.2 PTFE v PTFE with vein cuff | 2 | 181 | Peto Odds Ratio (Peto, Fixed, 95% CI) | 1.22 [0.67, 2.23] |
| 9 Secondary patency at 36 months Show forest plot | 1 | Peto Odds Ratio (Peto, Fixed, 95% CI) | Totals not selected | |
| 9.1 PTFE v PTFE with vein cuff | 1 | Peto Odds Ratio (Peto, Fixed, 95% CI) | 0.0 [0.0, 0.0] | |
| 10 Limb salvage at 12 months Show forest plot | 2 | 225 | Peto Odds Ratio (Peto, Fixed, 95% CI) | 1.35 [0.72, 2.55] |
| 10.1 PTFE v PTFE with vein cuff | 2 | 225 | Peto Odds Ratio (Peto, Fixed, 95% CI) | 1.35 [0.72, 2.55] |
| 11 Limb salvage at 24 months Show forest plot | 2 | 196 | Peto Odds Ratio (Peto, Fixed, 95% CI) | 1.34 [0.72, 2.49] |
| 11.1 PTFE v PTFE with vein cuff | 2 | 196 | Peto Odds Ratio (Peto, Fixed, 95% CI) | 1.34 [0.72, 2.49] |
| Outcome or subgroup title | No. of studies | No. of participants | Statistical method | Effect size |
| 1 Primary patency at 3 months Show forest plot | 1 | Peto Odds Ratio (Peto, Fixed, 95% CI) | Totals not selected | |
| 1.1 HBD v PTFE | 1 | Peto Odds Ratio (Peto, Fixed, 95% CI) | 0.0 [0.0, 0.0] | |
| 2 Primary patency at 6 months Show forest plot | 1 | Peto Odds Ratio (Peto, Fixed, 95% CI) | Totals not selected | |
| 2.1 HBD v PTFE | 1 | Peto Odds Ratio (Peto, Fixed, 95% CI) | 0.0 [0.0, 0.0] | |
| 3 Primary patency at 12 months Show forest plot | 1 | Peto Odds Ratio (Peto, Fixed, 95% CI) | Totals not selected | |
| 3.1 HBD v PTFE | 1 | Peto Odds Ratio (Peto, Fixed, 95% CI) | 0.0 [0.0, 0.0] | |
| 4 Primary patency at 24 months Show forest plot | 1 | Peto Odds Ratio (Peto, Fixed, 95% CI) | Totals not selected | |
| 4.1 HBD v PTFE | 1 | Peto Odds Ratio (Peto, Fixed, 95% CI) | 0.0 [0.0, 0.0] | |
| 5 Primary patency at 60 months Show forest plot | 1 | Peto Odds Ratio (Peto, Fixed, 95% CI) | Totals not selected | |
| 5.1 HBD v PTFE | 1 | Peto Odds Ratio (Peto, Fixed, 95% CI) | 0.0 [0.0, 0.0] | |