Interwencje w miejscu pracy stosowane w celu skrócenia czasu spędzanego w pozycji siedzącej
Información
- DOI:
- https://doi.org/10.1002/14651858.CD010912.pub3Copiar DOI

- Base de datos:
-
- Cochrane Database of Systematic Reviews
- Versión publicada:
-
- 17 marzo 2016see what's new
- Tipo:
-
- Intervention
- Etapa:
-
- Review
- Grupo Editorial Cochrane:
-
Grupo Cochrane de Salud laboral
- Copyright:
-
- Copyright © 2016 The Cochrane Collaboration. Published by John Wiley & Sons, Ltd.
Cifras del artículo
Altmetric:
Citado por:
Autores
Contributions of authors
Jos Verbeek, Sharea Ijaz and Nipun Shrestha conceptualised the review.
Nipun Shrestha took the lead in writing the protocol.
Kaisa Neuvonen (Trials Search Co‐ordinator, Cochrane Work Review Group) and Nipun Shrestha designed the systematic search strategies.
Nipun Shrestha and Katriina Kukkonen‐Harjula conducted the study selection.
Nipun Shrestha, Suresh Kumar and Chukwudi Nwankwo did the data extraction and risk of bias assessment for the previous version.
Nipun Shrestha, Veerle Hermans and Soumyadeep Bhaumik did the data extraction and risk of bias assessment for the current update.
Nipun Shrestha and Jos Verbeek conducted the data analysis.
Nipun Shrestha wrote the manuscript collaborating with Jos Verbeek, Katriina Kukkonen‐Harjula, Sharea Ijaz, Veerle Hermans and Soumyadeep Bhaumik.
Sources of support
Internal sources
-
Cochrane Work Review Group, Finland.
Nipun Shrestha attended a three‐month internship to learn about Cochrane systematic review methodology.
-
Cochrane, UK.
Nipun Shrestha received a developing country stipend for attending the 22nd Cochrane Colloquium in 2014 in Hyderabad India.
-
Mesenaatti.me, Finland.
The author team collected EUR 1600 through the Mesenaatti.me crowdfunding platform to support Nipun Shrestha complete the review
External sources
-
No sources of support supplied
Declarations of interest
Nipun Shrestha: None known.
Jos Verbeek: I am employed by the Finnish Institute of Occupational Health to coordinate the Cochrane Work Review Group.
Sharea Ijaz: None known.
Katriina T Kukkonen‐Harjula: None known.
Veerle Hermans: None known.
Soumyadeep Bhaumik: None known.
Acknowledgements
We thank Jani Ruotsalainen, Managing Editor, Cochrane Work Group for providing administrative and logistical support for the conduct of the current review, and Kaisa Neuvonen, Trials Search Co‐ordinator, Cochrane Work Group for developing and executing the search strategies.
We would also like to thank the Cochrane Work Group's Editors Esa‐Pekka Takala and Anneli Ojajärvi and external peer referees Kimi Sawada, Kristel King, Rintaro Mori and Hidde van der Ploeg for their comments. We thank Joey Kwong, Elizabeth Royle and Jani Ruotsalainen for copy editing the text.
We also like to thank Suresh Kumar and Chukwudi P Nwankwo for their contribution in the previous version of this review.
We would also like to thank all who donated in the crowdfunding campaign to support the review.
Version history
| Published | Title | Stage | Authors | Version |
| 2018 Dec 17 | Workplace interventions for reducing sitting at work | Review | Nipun Shrestha, Katriina T Kukkonen‐Harjula, Jos H Verbeek, Sharea Ijaz, Veerle Hermans, Zeljko Pedisic | |
| 2018 Jun 20 | Workplace interventions for reducing sitting at work | Review | Nipun Shrestha, Katriina T Kukkonen‐Harjula, Jos H Verbeek, Sharea Ijaz, Veerle Hermans, Zeljko Pedisic | |
| 2016 Mar 17 | Workplace interventions for reducing sitting at work | Review | Nipun Shrestha, Katriina T Kukkonen‐Harjula, Jos H Verbeek, Sharea Ijaz, Veerle Hermans, Soumyadeep Bhaumik | |
| 2015 Jan 26 | Workplace interventions for reducing sitting at work | Review | Nipun Shrestha, Sharea Ijaz, Katriina T Kukkonen‐Harjula, Suresh Kumar, Chukwudi P Nwankwo | |
| 2014 Jan 10 | Workplace interventions for reducing sitting at work | Protocol | Nipun Shrestha, Sharea Ijaz, Katriina T Kukkonen‐Harjula, Suresh Kumar, Chukwudi P Nwankwo | |
Differences between protocol and review
Even though in the protocol we stated that in cases where we would include more than one comparison from a trial with multiple arms in the same meta‐analysis, we would halve the numbers of control group participants to prevent them from being included twice, this does not work for the inverse variance input method. Neuhaus 2014a reported only the results from Ancova and could not provide us with the raw data. For this trial we modelled the means and standard deviations from the intervention and the control group in RevMan as closely to the real data as possible to achieve the same mean difference and standard error. Then we halved the number of participants in the control group and entered the resulting standard errors into RevMan.
We judged studies to be at low risk for selective outcome reporting if the final publications of the trial reported what had been planned and registered in international databases (trial registries), such as ClinicalTrials.gov, ANZCTR.org.au (Australia and New Zealand), NTR (Netherland’s Trial Registry). We judged those studies that were not registered in trial registries as being at low risk for selective outcome reporting if they reported all the outcomes mentioned in the methods section.
Initially we planned to pool interventions that were categorised under broad headings like physical changes in workplace environment, policy changes and information and counselling, but later we found that the interventions were quite different from one another and decided not to combine them under these broad headings. We also added a new category consisting of approaches that used multiple categories of interventions at the same time.
Keywords
MeSH
Medical Subject Headings (MeSH) Keywords
Medical Subject Headings Check Words
Humans;
PICO
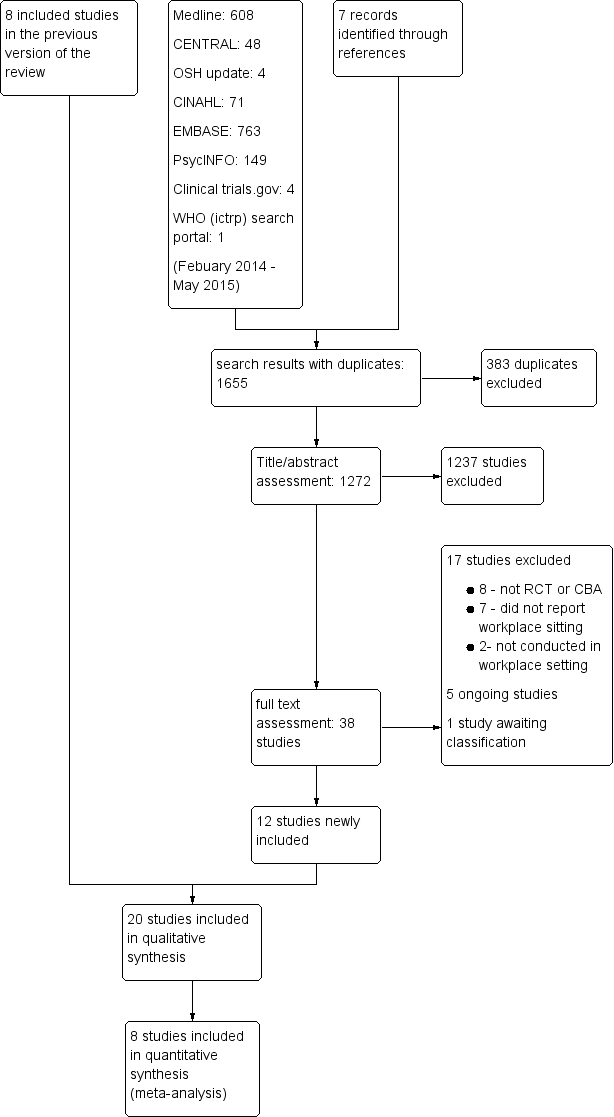
PRISMA Study flow diagram

Risk of bias graph: review authors' judgements about each risk of bias item presented as percentages across all included studies

Risk of bias summary: review authors' judgements about each risk of bias item for each included study

Comparison 1 Sit‐stand desks with or without counselling versus no intervention CBA, Outcome 1 Mean difference in time spent sitting at work, follow‐up three months.

Comparison 1 Sit‐stand desks with or without counselling versus no intervention CBA, Outcome 2 Mean difference in time spent sitting at work. follow‐up six months.
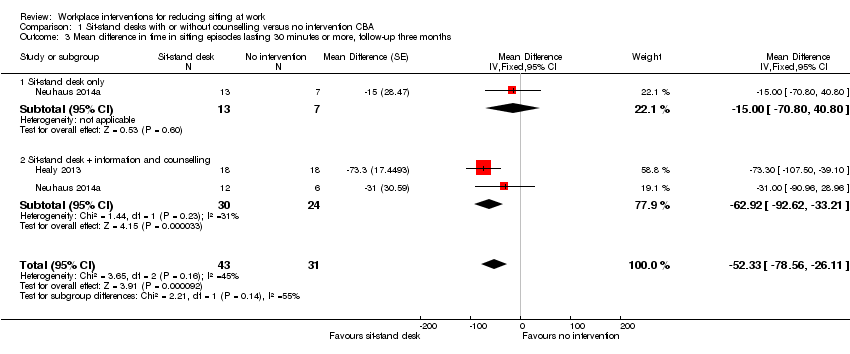
Comparison 1 Sit‐stand desks with or without counselling versus no intervention CBA, Outcome 3 Mean difference in time in sitting episodes lasting 30 minutes or more, follow‐up three months.

Comparison 1 Sit‐stand desks with or without counselling versus no intervention CBA, Outcome 4 Mean difference in total time spent sitting at and outside work, follow‐up three months.

Comparison 1 Sit‐stand desks with or without counselling versus no intervention CBA, Outcome 5 Work performance (1‐10 scale), follow‐up three months.

Comparison 1 Sit‐stand desks with or without counselling versus no intervention CBA, Outcome 6 Proportion with ≥ 1 sick days in the last three months.
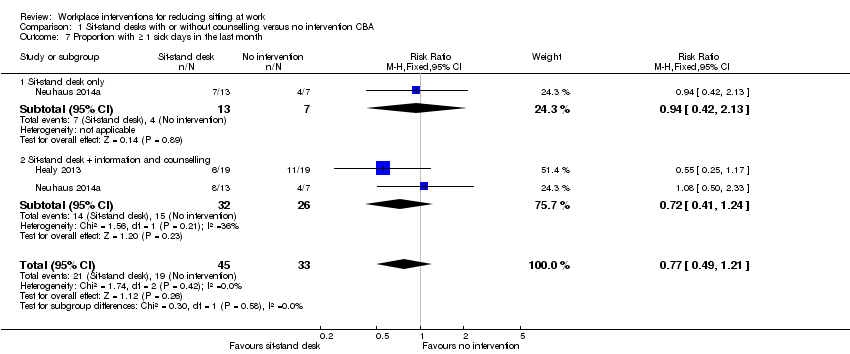
Comparison 1 Sit‐stand desks with or without counselling versus no intervention CBA, Outcome 7 Proportion with ≥ 1 sick days in the last month.

Comparison 1 Sit‐stand desks with or without counselling versus no intervention CBA, Outcome 8 Musculoskeletal symptoms.

Comparison 2 Sit‐stand desks +counselling versus sit‐stand desks CBA, Outcome 1 Mean difference in time spent sitting at work, follow‐up three months.

Comparison 2 Sit‐stand desks +counselling versus sit‐stand desks CBA, Outcome 2 Mean difference in time in sitting episodes lasting ≥ 30 minutes, follow‐up three months.

Comparison 2 Sit‐stand desks +counselling versus sit‐stand desks CBA, Outcome 3 Work performance (1‐10 scale), follow‐up three months.
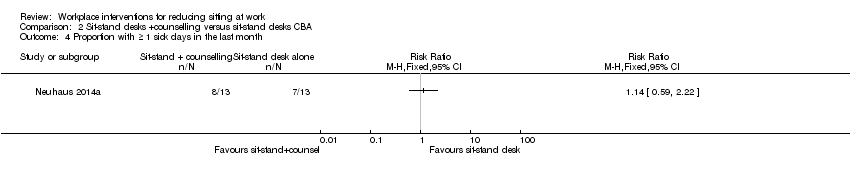
Comparison 2 Sit‐stand desks +counselling versus sit‐stand desks CBA, Outcome 4 Proportion with ≥ 1 sick days in the last month.

Comparison 3 Sit‐stand desks versus no intervention RCT, Outcome 1 Mean difference in time spent sitting at work, follow up short term.

Comparison 3 Sit‐stand desks versus no intervention RCT, Outcome 2 Mean difference in time spent sitting at work, follow‐up eight weeks.
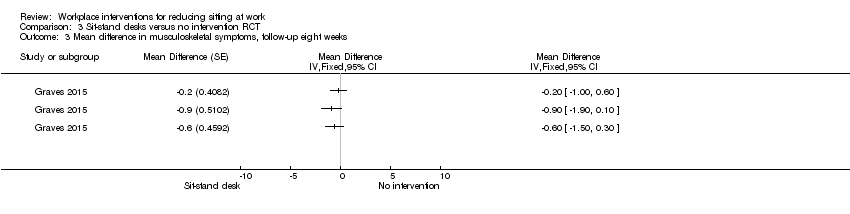
Comparison 3 Sit‐stand desks versus no intervention RCT, Outcome 3 Mean difference in musculoskeletal symptoms, follow‐up eight weeks.

Comparison 4 Treadmill desks plus counselling versus no intervention RCT, Outcome 1 Mean difference in time spent sitting at work, follow‐up three months.

Comparison 5 Cycling workstations + information and counselling versus information and counselling only RCT, Outcome 1 Mean difference in time spent in inactive sitting at work, follow‐up 16 weeks.

Comparison 6 Walking strategies versus no intervention RCT, Outcome 1 Mean difference in time spent sitting at work, follow‐up 10 weeks.

Comparison 6 Walking strategies versus no intervention RCT, Outcome 2 Mean difference in time spent sitting at work, follow‐up 21 weeks.
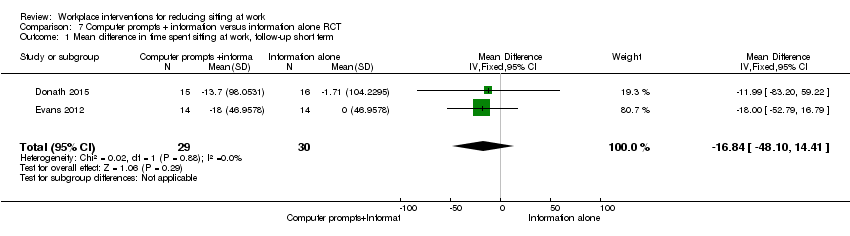
Comparison 7 Computer prompts + information versus information alone RCT, Outcome 1 Mean difference in time spent sitting at work, follow‐up short term.

Comparison 7 Computer prompts + information versus information alone RCT, Outcome 2 Mean difference in time spent sitting at work, follow‐up 13 weeks.

Comparison 7 Computer prompts + information versus information alone RCT, Outcome 3 Mean difference in number of sitting episodes lasting 30 minutes or more, follow‐up 10 days.

Comparison 7 Computer prompts + information versus information alone RCT, Outcome 4 Mean difference in time in sitting episodes lasting 30 minutes or more, follow‐up 10 days.

Comparison 7 Computer prompts + information versus information alone RCT, Outcome 5 Mean difference in energy expenditure, follow‐up 13 weeks.
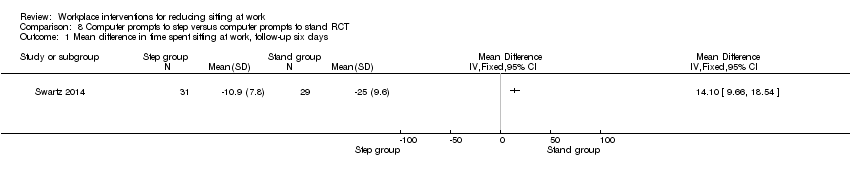
Comparison 8 Computer prompts to step versus computer prompts to stand RCT, Outcome 1 Mean difference in time spent sitting at work, follow‐up six days.

Comparison 8 Computer prompts to step versus computer prompts to stand RCT, Outcome 2 Mean difference in number of sitting episodes lasting 30 minutes or more, follow‐up six days.

Comparison 9 E‐newsletters on workplace sitting versus e‐newsletters on health education RCT, Outcome 1 Mean difference in time spent sitting at work, follow‐up 10 weeks.

Comparison 10 Counselling versus no intervention cluster RCT, Outcome 1 Mean difference in time spent sitting at work, follow‐up medium term.

Comparison 10 Counselling versus no intervention cluster RCT, Outcome 2 Mean difference in total time spent sitting at and outside work, follow‐up six months.

Comparison 10 Counselling versus no intervention cluster RCT, Outcome 3 Work engagement (0‐6 scale), follow‐up 12 months.

Comparison 11 Mindfulness training versus no intervention RCT, Outcome 1 Mean difference in time spent sitting at work, follow‐up six months.

Comparison 11 Mindfulness training versus no intervention RCT, Outcome 2 Mean difference in time spent sitting at work, follow‐up 12 months.

Comparison 11 Mindfulness training versus no intervention RCT, Outcome 3 Work engagement (0 ‐ 6 scale), follow‐up six months.

Comparison 11 Mindfulness training versus no intervention RCT, Outcome 4 Work engagement (0‐6 scale), follow‐up 12 months.
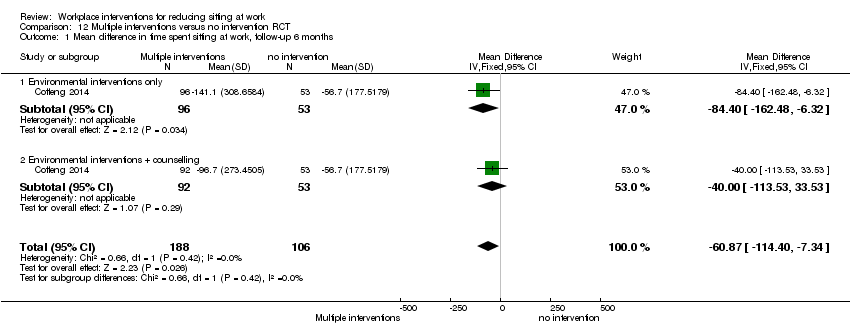
Comparison 12 Multiple interventions versus no intervention RCT, Outcome 1 Mean difference in time spent sitting at work, follow‐up 6 months.

Comparison 12 Multiple interventions versus no intervention RCT, Outcome 2 Mean difference in time spent sitting at work, follow‐up 12 months.
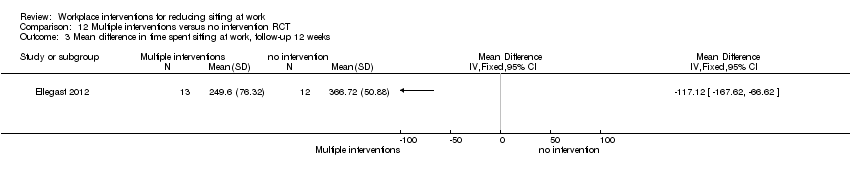
Comparison 12 Multiple interventions versus no intervention RCT, Outcome 3 Mean difference in time spent sitting at work, follow‐up 12 weeks.

Comparison 12 Multiple interventions versus no intervention RCT, Outcome 4 Work engagement (0‐6 scale), follow‐up 12 months.
| Sit‐stand desks with or without counselling versus no intervention for reducing sitting at work | ||||||
| Patient or population: employees who sit at work Settings: workplace Intervention: sit‐stand desk with or without counselling Comparison: no intervention | ||||||
| Outcomes | Illustrative comparative risks* (95% CI) | Relative effect | No of Participants | Quality of the evidence | Comments | |
| Assumed risk | Corresponding risk | |||||
| No intervention | Sit‐stand desk | |||||
| Time spent sitting at work /8‐hour workday | The mean time spent sitting at work in the control groups was | The mean time spent sitting at work in the intervention groups was | 61 | ⊕⊝⊝⊝ | ||
| Work performance (1‐10 scale) | The median work performance (1‐10 scale) in the control groups was 8.15 | The mean change in work performance (1‐10) in the intervention groups was | 109 | ⊕⊝⊝⊝ | ||
| Time spent sitting at work /8‐hour workday | The mean time spent sitting at work in the control group was | The mean time spent sitting at work in the intervention group was | 45 (1 study) | ⊕⊝⊝⊝ very | ||
| *The basis for the assumed risk (e.g. the median control group risk across studies) is provided in footnotes. The corresponding risk (and its 95% confidence interval) is based on the assumed risk in the comparison group and the relative effect of the intervention (and its 95% CI). CI: confidence interval; RR: risk ratio | ||||||
| GRADE Working Group grades of evidence | ||||||
| 1 Non‐randomised controlled before‐after study/studies with high risk of bias, downgraded one level 2 Small sample size, no further downgrading possible 3 Value from the control group 4 Mean value from control groups 5 Median of the scores in the three control groups | ||||||
| Sit‐stand desks versus no intervention for reducing sitting at work | ||||||
| Patient or population: employees who sit at work Comparison: no intervention | ||||||
| Outcomes | Illustrative comparative risks* (95% CI) | Relative effect | No of Participants | Quality of the evidence | Comments | |
| Assumed risk | Corresponding risk | |||||
| Sit‐stand desk | no intervention | |||||
| Time spent sitting at work /8‐hour workday Follow‐up: short term | The mean time spent sitting at work in the control group was | The mean time spent sitting at work in the intervention group was | 70 | ⊕⊕⊝⊝ | ||
| Time spent sitting at work /8‐hour workday Self‐reported questionnaires | The mean time spent sitting at work in the control group was 387 minutes5 | The mean time spent sitting at work in the intervention group was 80 minutes less (129 to 31 less) | 44 (1 study) | ⊕⊕⊝⊝ | ||
| *The basis for the assumed risk (e.g. the median control group risk across studies) is provided in footnotes. The corresponding risk (and its 95% confidence interval) is based on the assumed risk in the comparison group and the relative effect of the intervention (and its 95% CI). | ||||||
| GRADE Working Group grades of evidence | ||||||
| 1 Risk of bias high due to unconcealed allocation and lack of blinding of participants and personnel, downgraded one level 2 Unrealistic confidence interval, downgraded one level 3 Imprecision with wide confidence intervals, small sample size, downgraded one level 4 Mean value from control groups 5 Sitting time in the control group | ||||||
| Treadmill desks plus counselling versus no intervention for reducing sitting at work | ||||||
| Patient or population: employees who sit at work Comparison: no intervention | ||||||
| Outcomes | Illustrative comparative risks* (95% CI) | Relative effect | No of Participants | Quality of the evidence | Comments | |
| Assumed risk | Corresponding risk | |||||
| no intervention | Treadmill desk | |||||
| Time spent sitting at work /8‐hour workday | The mean time spent sitting at work in the control group was | The mean time spent sitting at work in the intervention group was | 31 | ⊕⊕⊝⊝ | ||
| *The basis for the assumed risk (e.g. the median control group risk across studies) is provided in footnotes. The corresponding risk (and its 95% confidence interval) is based on the assumed risk in the comparison group and the relative effect of the intervention (and its 95% CI). | ||||||
| GRADE Working Group grades of evidence | ||||||
| 1 lack of blinding of participants and personnel, downgraded one level 2 Imprecision with wide confidence intervals, small sample size, downgraded one level 3 Sitting time in the control group | ||||||
| Cycling workstations + information and counselling compared with information and counselling for reducing sitting at work | ||||||
| Patient or population: employees who sit at work Intervention: Cycling workstation + information and counselling Comparison: Information and counselling | ||||||
| Outcomes | Illustrative comparative risks* (95% CI) | Relative effect | No of Participants | Quality of the evidence | Comments | |
| Assumed risk | Corresponding risk | |||||
| Information and counselling | Pedalling workstation + information and counselling | |||||
| Time spent sitting at work /8‐hour workday Follow‐up: median 16 weeks | The mean time spent in sitting at work in the control group was 413 minutes3 | The mean time spent in sitting at work in the intervention groups was | 54 (1 study) | ⊕⊕⊝⊝ | ||
| *The basis for the assumed risk (e.g. the median control group risk across studies) is provided in footnotes. The corresponding risk (and its 95% confidence interval) is based on the assumed risk in the comparison group and the relative effect of the intervention (and its 95% CI). | ||||||
| GRADE Working Group grades of evidence | ||||||
| 1 Imprecision with wide confidence intervals, small sample size, downgraded with one level 2 Lack of blinding of participants and attrition bias, downgraded with one level 3 Sitting time in the control group | ||||||
| Walking strategies for reducing sitting at work | ||||||
| Patient or population: employees who sit at work Comparison: no intervention | ||||||
| Outcomes | Illustrative comparative risks* (95% CI) | Relative effect | No of participants | Quality of the evidence | Comments | |
| Assumed risk | Corresponding risk | |||||
| No intervention | Walking strategies | |||||
| Time spent sitting at work | The mean time spent sitting at work in the control group was | The mean time spent sitting at work in the intervention group was | 179 | ⊕⊕⊝⊝ | ||
| Time spent sitting at work | The mean time spent sitting at work in the control group was | The mean time spent sitting at work in the intervention group was | 190 (1 study) | ⊕⊕⊝⊝ | ||
| *The basis for the assumed risk (e.g. the median control group risk across studies) is provided in footnotes. The corresponding risk (and its 95% confidence interval) is based on the assumed risk in the comparison group and the relative effect of the intervention (and its 95% CI). | ||||||
| GRADE Working Group grades of evidence | ||||||
| 1 Risk of bias high due to unblinded outcome assessment and lack of allocation concealment, downgraded with one level 3 Lack of blinding of participants and personnel and attrition bias, downgraded with one level 4 Sitting time in the control group | ||||||
| Computer prompts + information compared to information alone for reducing sitting at work | ||||||
| Patient or population: employees who sit at work | ||||||
| Outcomes | Illustrative comparative risks* (95% CI) | Relative effect | No of participants | Quality of the evidence | Comments | |
| Assumed risk | Corresponding risk | |||||
| Information alone | Computer prompt + information | |||||
| Time spent sitting at work | The mean time spent sitting at work in the control group was | The mean time spent sitting at work in the intervention group was 17 minutes less | 59 | ⊕⊕⊕⊝ | ||
| Time spent sitting at work | The mean time spent sitting at work in the control group was | The mean time spent sitting at work in the intervention group was 55 minutes less | 34 | ⊕⊕⊝⊝ | ||
| *The basis for the assumed risk (e.g. the median control group risk across studies) is provided in footnotes. The corresponding risk (and its 95% confidence interval) is based on the assumed risk in the comparison group and the relative effect of the intervention (and its 95% CI). | ||||||
| GRADE Working Group grades of evidence | ||||||
| 1 Risk of bias high due to selective reporting and attrition bias, downgraded with one level 4 Sitting time in the control group | ||||||
| Counselling for reducing sitting at work | ||||||
| Patient or population: employees who sit at work | ||||||
| Outcomes | Illustrative comparative risks* (95% CI) | Relative effect | No of participants | Quality of the evidence | Comments | |
| Assumed risk | Corresponding risk | |||||
| Usual care | Counselling | |||||
| Time spent sitting at work | The mean time spent in sitting at work in the control group was 462 minutes/day3 | The mean time spent in sitting at work in the intervention groups was 28 minutes less (52 to 5 less) | 747 | ⊕⊕⊝⊝ | ||
| *The basis for the assumed risk (e.g. the median control group risk across studies) is provided in footnotes. The corresponding risk (and its 95% confidence interval) is based on the assumed risk in the comparison group and the relative effect of the intervention (and its 95% CI). | ||||||
| GRADE Working Group grades of evidence | ||||||
| 1 Risk of bias, allocation not concealed, lack of blinding, high attrition rate, downgraded with one level 2 Imprecision with wide confidence intervals, small sample size, downgraded with one level 3 Mean value from control groups | ||||||
| Mindfulness training versus no intervention for reducing sitting at work | ||||||
| Patient or population: employees who sit at work Comparison: no intervention | ||||||
| Outcomes | Illustrative comparative risks* (95% CI) | Relative effect | No of participants | Quality of the evidence | Comments | |
| Assumed risk | Corresponding risk | |||||
| No intervention | Mindful training | |||||
| Time spent sitting at work /day | The mean time spent in sitting at work in the control group was 295 minutes2 | The mean time spent in sitting at work in the intervention groups was | 257 | ⊕⊕⊝⊝ | ||
| Time spent sitting at work /day | The mean time spent in sitting at work in the control groups was | The mean time spent in sitting at work in the intervention groups was | 257 | ⊕⊕⊝⊝ | ||
| *The basis for the assumed risk (e.g. the median control group risk across studies) is provided in footnotes. The corresponding risk (and its 95% confidence interval) is based on the assumed risk in the comparison group and the relative effect of the intervention (and its 95% CI). | ||||||
| GRADE Working Group grades of evidence | ||||||
| 1 Risk of bias high due to unconcealed allocation and unblinded outcome assessment, downgraded with two levels 2 Sitting time in the control group | ||||||
| Multiple interventions versus no intervention for reducing sitting at work | ||||||
| Patient or population: employees who sit at work Comparison: no intervention | ||||||
| Outcomes | Illustrative comparative risks* (95% CI) | Relative effect | No of Participants | Quality of the evidence | Comments | |
| Assumed risk | Corresponding risk | |||||
| No intervention | Multiple environment interventions with or without counselling | |||||
| Time spent sitting at work | The mean time spent sitting at work in the control group was | The mean time spent sitting at work in the intervention group was | 294 (1 study) | ⊕⊕⊝⊝ | ||
| Time spent sitting at work | The mean time spent sitting at work in the control group was | The mean time spent sitting at work in the intervention group was | 294 (1 study) | ⊕⊕⊝⊝ | ||
| Time spent sitting at work /8‐hour workday Follow‐up: median 12 weeks | The mean time spent in sitting at work in the control group was 370 minutes5 | The mean time spent in sitting at work in the intervention groups was 117 minutes less | 25 (1 study) | ⊕⊕⊝⊝ | ||
| *The basis for the assumed risk (e.g. the median control group risk across studies) is provided in footnotes. The corresponding risk (and its 95% confidence interval) is based on the assumed risk in the comparison group and the relative effect of the intervention (and its 95% CI). | ||||||
| GRADE Working Group grades of evidence | ||||||
| 1 Risk of bias high due to un blinded outcome assessment and attrition bias, downgraded with one level 2 Imprecision with wide confidence intervals, downgraded with one level 3 Imprecision with wide confidence intervals, small sample size, downgraded with two levels 4 Lack of blinding of personnel, downgraded with one level 5 Sitting time in the control group | ||||||
| Outcome or subgroup title | No. of studies | No. of participants | Statistical method | Effect size |
| 1 Mean difference in time spent sitting at work, follow‐up three months Show forest plot | 2 | Mean Difference (Fixed, 95% CI) | Subtotals only | |
| 1.1 Sit‐stand desk + information and counselling | 2 | 61 | Mean Difference (Fixed, 95% CI) | ‐113.07 [‐142.59, ‐83.55] |
| 2 Mean difference in time spent sitting at work. follow‐up six months Show forest plot | 1 | Mean Difference (IV, Fixed, 95% CI) | Totals not selected | |
| 3 Mean difference in time in sitting episodes lasting 30 minutes or more, follow‐up three months Show forest plot | 2 | 74 | Mean Difference (Fixed, 95% CI) | ‐52.33 [‐78.56, ‐26.11] |
| 3.1 Sit‐stand desk only | 1 | 20 | Mean Difference (Fixed, 95% CI) | ‐13.00 [‐70.80, 40.80] |
| 3.2 Sit‐stand desk + information and counselling | 2 | 54 | Mean Difference (Fixed, 95% CI) | ‐62.92 [‐92.62, ‐33.21] |
| 4 Mean difference in total time spent sitting at and outside work, follow‐up three months Show forest plot | 1 | Mean Difference (Fixed, 95% CI) | Totals not selected | |
| 5 Work performance (1‐10 scale), follow‐up three months Show forest plot | 3 | 109 | Mean Difference (Random, 95% CI) | 0.35 [‐0.10, 0.79] |
| 5.1 Sit‐stand desk only | 2 | 52 | Mean Difference (Random, 95% CI) | 0.82 [0.00, 1.63] |
| 5.2 Sit‐stand desk + information and counselling | 2 | 57 | Mean Difference (Random, 95% CI) | 0.15 [‐0.38, 0.68] |
| 6 Proportion with ≥ 1 sick days in the last three months Show forest plot | 1 | Risk Ratio (M‐H, Fixed, 95% CI) | Totals not selected | |
| 7 Proportion with ≥ 1 sick days in the last month Show forest plot | 2 | 78 | Risk Ratio (M‐H, Fixed, 95% CI) | 0.77 [0.49, 1.21] |
| 7.1 Sit‐stand desk only | 1 | 20 | Risk Ratio (M‐H, Fixed, 95% CI) | 0.94 [0.42, 2.13] |
| 7.2 Sit‐stand desk + information and counselling | 2 | 58 | Risk Ratio (M‐H, Fixed, 95% CI) | 0.72 [0.41, 1.24] |
| 8 Musculoskeletal symptoms Show forest plot | 1 | Mean Difference (Fixed, 95% CI) | Totals not selected | |
| Outcome or subgroup title | No. of studies | No. of participants | Statistical method | Effect size |
| 1 Mean difference in time spent sitting at work, follow‐up three months Show forest plot | 1 | Mean Difference (Fixed, 95% CI) | Totals not selected | |
| 2 Mean difference in time in sitting episodes lasting ≥ 30 minutes, follow‐up three months Show forest plot | 1 | Mean Difference (Fixed, 95% CI) | Totals not selected | |
| 3 Work performance (1‐10 scale), follow‐up three months Show forest plot | 1 | Mean Difference (Fixed, 95% CI) | Totals not selected | |
| 4 Proportion with ≥ 1 sick days in the last month Show forest plot | 1 | Risk Ratio (M‐H, Fixed, 95% CI) | Totals not selected | |
| Outcome or subgroup title | No. of studies | No. of participants | Statistical method | Effect size |
| 1 Mean difference in time spent sitting at work, follow up short term Show forest plot | 2 | 70 | Mean Difference (Fixed, 95% CI) | ‐96.35 [‐109.55, ‐83.15] |
| 2 Mean difference in time spent sitting at work, follow‐up eight weeks Show forest plot | 1 | Mean Difference (IV, Fixed, 95% CI) | Totals not selected | |
| 3 Mean difference in musculoskeletal symptoms, follow‐up eight weeks Show forest plot | 1 | Mean Difference (Fixed, 95% CI) | Totals not selected | |
| Outcome or subgroup title | No. of studies | No. of participants | Statistical method | Effect size |
| 1 Mean difference in time spent sitting at work, follow‐up three months Show forest plot | 1 | Mean Difference (IV, Fixed, 95% CI) | Totals not selected | |
| Outcome or subgroup title | No. of studies | No. of participants | Statistical method | Effect size |
| 1 Mean difference in time spent in inactive sitting at work, follow‐up 16 weeks Show forest plot | 1 | Mean Difference (IV, Fixed, 95% CI) | Totals not selected | |
| Outcome or subgroup title | No. of studies | No. of participants | Statistical method | Effect size |
| 1 Mean difference in time spent sitting at work, follow‐up 10 weeks Show forest plot | 1 | Mean Difference (Fixed, 95% CI) | Totals not selected | |
| 1.1 Route versus no intervention | 1 | Mean Difference (Fixed, 95% CI) | 0.0 [0.0, 0.0] | |
| 1.2 Incidental versus no intervention | 1 | Mean Difference (Fixed, 95% CI) | 0.0 [0.0, 0.0] | |
| 2 Mean difference in time spent sitting at work, follow‐up 21 weeks Show forest plot | 1 | Mean Difference (IV, Fixed, 95% CI) | Totals not selected | |
| Outcome or subgroup title | No. of studies | No. of participants | Statistical method | Effect size |
| 1 Mean difference in time spent sitting at work, follow‐up short term Show forest plot | 2 | 59 | Mean Difference (IV, Fixed, 95% CI) | ‐16.84 [‐48.10, 14.41] |
| 2 Mean difference in time spent sitting at work, follow‐up 13 weeks Show forest plot | 1 | Mean Difference (Fixed, 95% CI) | Totals not selected | |
| 3 Mean difference in number of sitting episodes lasting 30 minutes or more, follow‐up 10 days Show forest plot | 1 | Mean Difference (Fixed, 95% CI) | Totals not selected | |
| 4 Mean difference in time in sitting episodes lasting 30 minutes or more, follow‐up 10 days Show forest plot | 1 | Mean Difference (Fixed, 95% CI) | Totals not selected | |
| 5 Mean difference in energy expenditure, follow‐up 13 weeks Show forest plot | 1 | Mean Difference (Fixed, 95% CI) | Totals not selected | |
| Outcome or subgroup title | No. of studies | No. of participants | Statistical method | Effect size |
| 1 Mean difference in time spent sitting at work, follow‐up six days Show forest plot | 1 | Mean Difference (IV, Fixed, 95% CI) | Totals not selected | |
| 2 Mean difference in number of sitting episodes lasting 30 minutes or more, follow‐up six days Show forest plot | 1 | Mean Difference (IV, Fixed, 95% CI) | Totals not selected | |
| Outcome or subgroup title | No. of studies | No. of participants | Statistical method | Effect size |
| 1 Mean difference in time spent sitting at work, follow‐up 10 weeks Show forest plot | 1 | Mean Difference (IV, Fixed, 95% CI) | Totals not selected | |
| Outcome or subgroup title | No. of studies | No. of participants | Statistical method | Effect size |
| 1 Mean difference in time spent sitting at work, follow‐up medium term Show forest plot | 2 | 747 | Mean Difference (Fixed, 95% CI) | ‐28.38 [‐51.49, ‐5.26] |
| 2 Mean difference in total time spent sitting at and outside work, follow‐up six months Show forest plot | 1 | Mean Difference (Fixed, 95% CI) | Totals not selected | |
| 3 Work engagement (0‐6 scale), follow‐up 12 months Show forest plot | 1 | Mean Difference (Fixed, 95% CI) | Totals not selected | |
| Outcome or subgroup title | No. of studies | No. of participants | Statistical method | Effect size |
| 1 Mean difference in time spent sitting at work, follow‐up six months Show forest plot | 1 | Mean Difference (Fixed, 95% CI) | Totals not selected | |
| 2 Mean difference in time spent sitting at work, follow‐up 12 months Show forest plot | 1 | Mean Difference (Fixed, 95% CI) | Totals not selected | |
| 3 Work engagement (0 ‐ 6 scale), follow‐up six months Show forest plot | 1 | Mean Difference (Fixed, 95% CI) | Totals not selected | |
| 4 Work engagement (0‐6 scale), follow‐up 12 months Show forest plot | 1 | Mean Difference (Fixed, 95% CI) | Totals not selected | |
| Outcome or subgroup title | No. of studies | No. of participants | Statistical method | Effect size |
| 1 Mean difference in time spent sitting at work, follow‐up 6 months Show forest plot | 1 | 294 | Mean Difference (IV, Fixed, 95% CI) | ‐60.87 [‐114.40, ‐7.34] |
| 1.1 Environmental interventions only | 1 | 149 | Mean Difference (IV, Fixed, 95% CI) | ‐84.40 [‐162.48, ‐6.32] |
| 1.2 Environmental interventions + counselling | 1 | 145 | Mean Difference (IV, Fixed, 95% CI) | ‐40.0 [‐113.53, 33.53] |
| 2 Mean difference in time spent sitting at work, follow‐up 12 months Show forest plot | 1 | 294 | Mean Difference (IV, Fixed, 95% CI) | ‐47.98 [‐103.42, 7.45] |
| 2.1 Environmental interventions only | 1 | 149 | Mean Difference (IV, Fixed, 95% CI) | ‐66.1 [‐146.03, 13.83] |
| 2.2 Environmental interventions + counselling | 1 | 145 | Mean Difference (IV, Fixed, 95% CI) | ‐31.20 [‐108.14, 45.74] |
| 3 Mean difference in time spent sitting at work, follow‐up 12 weeks Show forest plot | 1 | Mean Difference (IV, Fixed, 95% CI) | Totals not selected | |
| 4 Work engagement (0‐6 scale), follow‐up 12 months Show forest plot | 1 | Mean Difference (Fixed, 95% CI) | Totals not selected | |
| 4.1 Environmental interventions only | 1 | Mean Difference (Fixed, 95% CI) | 0.0 [0.0, 0.0] | |
| 4.2 Environmental interventions + counselling | 1 | Mean Difference (Fixed, 95% CI) | 0.0 [0.0, 0.0] | |