| 1 Fasting blood glucose level and dosage Show forest plot | 8 | | Mean Difference (IV, Random, 95% CI) | Subtotals only |
|
| 1.1 FBGL (cinnamon ≤ 1 g) | 3 | 116 | Mean Difference (IV, Random, 95% CI) | ‐1.35 [‐3.71, 1.01] |
| 1.2 FBGL (cinnamon 1.5‐2 g) | 4 | 157 | Mean Difference (IV, Random, 95% CI) | ‐0.51 [‐1.57, 0.56] |
| 1.3 FBGL (cinnamon 3 g) | 2 | 85 | Mean Difference (IV, Random, 95% CI) | ‐1.72 [‐4.80, 1.36] |
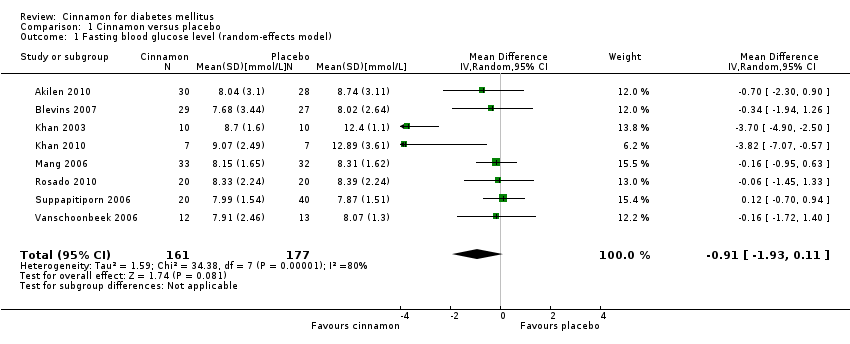
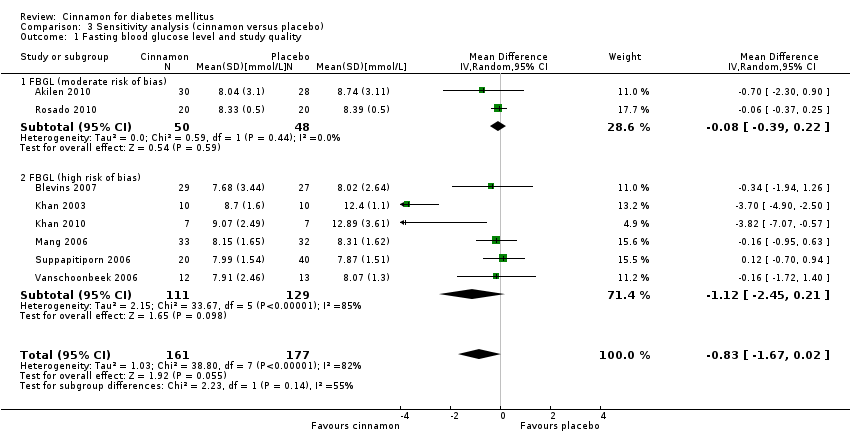
| 2 Fasting blood glucose level and study duration Show forest plot | 8 | 338 | Mean Difference (IV, Random, 95% CI) | ‐0.83 [‐1.67, 0.02] |
|
| 2.1 FBGL (< 12 weeks' duration) | 4 | 99 | Mean Difference (IV, Random, 95% CI) | ‐1.74 [‐3.89, 0.41] |
| 2.2 FBGL (12 weeks' duration or longer) | 4 | 239 | Mean Difference (IV, Random, 95% CI) | ‐0.13 [‐0.64, 0.38] |
| 3 Adverse events and dosage Show forest plot | 4 | 264 | Odds Ratio (M‐H, Random, 95% CI) | 0.82 [0.21, 3.23] |
|
| 3.1 Number of adverse events (cinnamon ≤ 1 g) | 3 | 206 | Odds Ratio (M‐H, Random, 95% CI) | 1.02 [0.22, 4.65] |
| 3.2 Number of adverse events (cinnamon 2 g) | 1 | 58 | Odds Ratio (M‐H, Random, 95% CI) | 0.30 [0.01, 7.69] |
| 4 Adverse events and study duration Show forest plot | 4 | 264 | Odds Ratio (M‐H, Random, 95% CI) | 0.82 [0.21, 3.23] |
|
| 4.1 Number of adverse events (6 weeks' duration or less) | 1 | 40 | Odds Ratio (M‐H, Random, 95% CI) | 0.32 [0.01, 8.26] |
| 4.2 Number of adverse events (12 weeks' duration or longer) | 3 | 224 | Odds Ratio (M‐H, Random, 95% CI) | 1.00 [0.22, 4.57] |
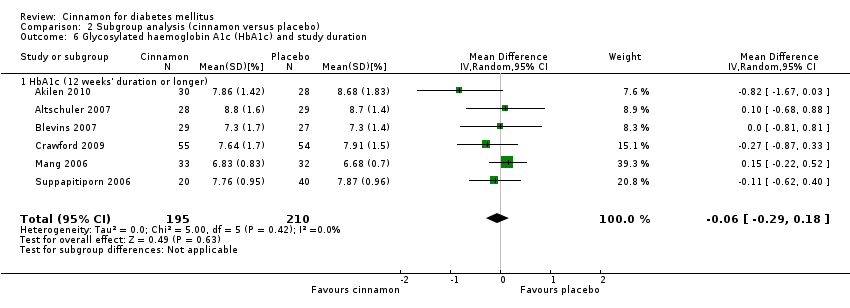
| 5 Glycosylated haemoglobin A1c (HbA1c) and dosage Show forest plot | 6 | 405 | Mean Difference (IV, Random, 95% CI) | ‐0.06 [‐0.29, 0.18] |
|
| 5.1 HbA1c (cinnamon 1 g) | 3 | 222 | Mean Difference (IV, Random, 95% CI) | ‐0.10 [‐0.51, 0.31] |
| 5.2 HbA1c (cinnamon 1.5‐2 g) | 2 | 118 | Mean Difference (IV, Random, 95% CI) | ‐0.38 [‐1.06, 0.29] |
| 5.3 HbA1c (cinnamon 3 g) | 1 | 65 | Mean Difference (IV, Random, 95% CI) | 0.15 [‐0.22, 0.52] |
| 6 Glycosylated haemoglobin A1c (HbA1c) and study duration Show forest plot | 6 | 405 | Mean Difference (IV, Random, 95% CI) | ‐0.06 [‐0.29, 0.18] |
|
| 6.1 HbA1c (12 weeks' duration or longer) | 6 | 405 | Mean Difference (IV, Random, 95% CI) | ‐0.06 [‐0.29, 0.18] |
| 7 Glycosylated haemoglobin A1c (HbA1c) and diabetes type Show forest plot | 6 | 405 | Mean Difference (IV, Random, 95% CI) | ‐0.06 [‐0.29, 0.18] |
|
| 7.1 HbA1c (type 1 diabetes only) | 1 | 57 | Mean Difference (IV, Random, 95% CI) | 0.10 [‐0.68, 0.88] |
| 7.2 HbA1c (type 2 diabetes only) | 5 | 348 | Mean Difference (IV, Random, 95% CI) | ‐0.10 [‐0.38, 0.18] |
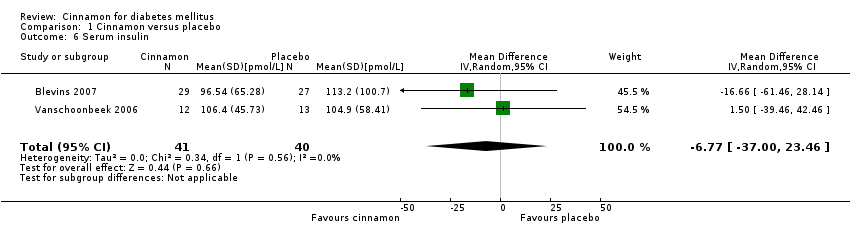
| 8 Serum insulin and dosage Show forest plot | 2 | 81 | Mean Difference (IV, Random, 95% CI) | ‐6.77 [‐35.00, 23.46] |
|
| 8.1 Serum insulin (cinnamon 1 g) | 1 | 56 | Mean Difference (IV, Random, 95% CI) | ‐16.66 [‐61.46, 28.14] |
| 8.2 Serum insulin (cinnamon 1.5 g) | 1 | 25 | Mean Difference (IV, Random, 95% CI) | 1.5 [‐39.46, 42.46] |
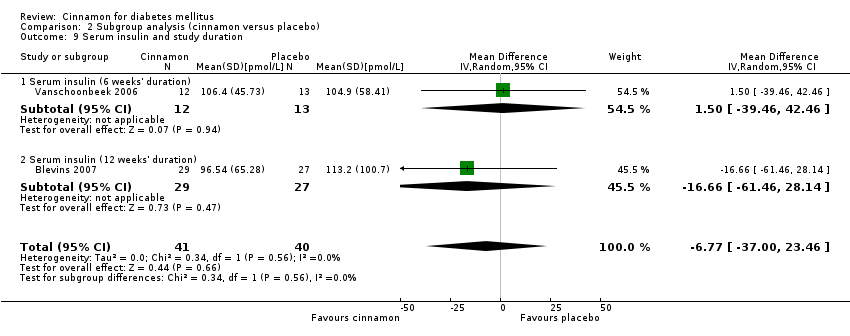
| 9 Serum insulin and study duration Show forest plot | 2 | 81 | Mean Difference (IV, Random, 95% CI) | ‐6.77 [‐35.00, 23.46] |
|
| 9.1 Serum insulin (6 weeks' duration) | 1 | 25 | Mean Difference (IV, Random, 95% CI) | 1.5 [‐39.46, 42.46] |
| 9.2 Serum insulin (12 weeks' duration) | 1 | 56 | Mean Difference (IV, Random, 95% CI) | ‐16.66 [‐61.46, 28.14] |