Miel para la tos aguda en niños
Información
- DOI:
- https://doi.org/10.1002/14651858.CD007094.pub5Copiar DOI

- Base de datos:
-
- Cochrane Database of Systematic Reviews
- Versión publicada:
-
- 10 abril 2018see what's new
- Tipo:
-
- Intervention
- Etapa:
-
- Review
- Grupo Editorial Cochrane:
-
Grupo Cochrane de Infecciones respiratorias agudas
- Copyright:
-
- Copyright © 2018 The Cochrane Collaboration. Published by John Wiley & Sons, Ltd.
Cifras del artículo
Altmetric:
Citado por:
Autores
Contributions of authors
Dr Olabisi Oduwole (OO) prepared the main text of this update and wrote the methods section of the update based on a template developed by the Cochrane Acute Respiratory Infections Group.
OO and Dr Ekong Udoh (EU) selected studies and extracted data.
Prof Martin Meremikwu (MM), OO, Prof Angela Oyo‐Ita (AO), and EU revised the text.
All review authors contributed to this update and read and agreed upon the final version.
Declarations of interest
Olabisi Oduwole: none known.
Ekong E Udoh: none known.
Angela Oyo‐Ita: none known.
Martin M Meremikwu: none known.
Acknowledgements
The review authors wish to thank Liz Dooley, Ann Jones, and David Honeyman from the Cochrane Acute Respiratory Infections Group for their contributions. We would also like to acknowledge the comments of the following referees: Matthew Thompson, Clare Jeffrey, Peter Molan, Jenny Wilkinson, David Gregory, Teresa Neeman, Mark Jones, and Lisa Baniran. We wish to thank Milad Tavakoli for translating Ahmadi 2013 from Farsi to English. We would also like to thank the authors of Paul 2007, Shadkam 2010, and Waris 2014 for their prompt responses to our requests for further information and clarification about their studies.
Version history
| Published | Title | Stage | Authors | Version |
| 2018 Apr 10 | Honey for acute cough in children | Review | Olabisi Oduwole, Ekong E Udoh, Angela Oyo‐Ita, Martin M Meremikwu | |
| 2014 Dec 23 | Honey for acute cough in children | Review | Olabisi Oduwole, Martin M Meremikwu, Angela Oyo‐Ita, Ekong E Udoh | |
| 2012 Mar 14 | Honey for acute cough in children | Review | Olabisi Oduwole, Martin M Meremikwu, Angela Oyo‐Ita, Ekong E Udoh | |
| 2010 Jan 20 | Honey for acute cough in children | Review | Olabisi Oduwole, Martin M Meremikwu, Angela Oyo‐Ita, Ekong E Udoh | |
| 2008 Apr 23 | Honey for acute cough in children | Protocol | Olabisi Oduwole, Martin M Meremikwu, Angela Oyo‐Ita, Ekong E Udoh | |
Differences between protocol and review
An inclusion criterion in our protocol was the inclusion of children aged from two to 18 years because of safety concerns for infants less than two years (Oduwole 2008). However, we included participants aged from 12 months because most included studies enrolled children aged from 12 months and over. Studies have reported that only infants aged less than 12 months are at risk when given honey due to poor immunity against Clostridium botulinum (Küplülü 2006), thus our safety concern was no longer valid. Including children aged less than two years did not change the conclusions of subsequent review updates (Oduwole 2012; Oduwole 2014a), from the first publication (Oduwole 2010).
We were unable to assess the effect of honey on children's quality of life, improvement in appetite, and cost of honey alone compared with other cough syrups because none of the included studies reported these outcomes.
Keywords
MeSH
Medical Subject Headings (MeSH) Keywords
- Albuterol [therapeutic use];
- Antitussive Agents [adverse effects, *therapeutic use];
- Apitherapy [adverse effects, *methods];
- Bromelains [therapeutic use];
- Bronchodilator Agents [therapeutic use];
- Cough [*therapy];
- Dextromethorphan [adverse effects, *therapeutic use];
- Diphenhydramine [adverse effects, *therapeutic use];
- Honey [adverse effects];
- Placebos [therapeutic use];
- Randomized Controlled Trials as Topic;
Medical Subject Headings Check Words
Adolescent; Child; Child, Preschool; Humans; Infant;
PICO
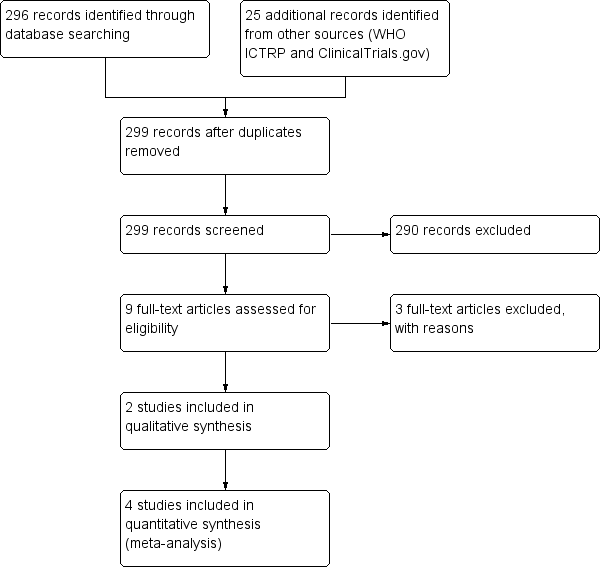
Study flow diagram (2018 update).

Risk of bias graph: review authors' judgements about each risk of bias item presented as percentages across all included studies.
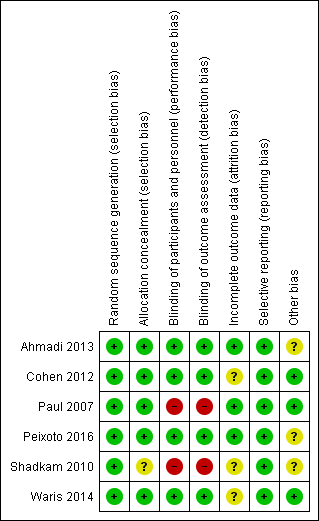
'Risk of bias' summary: review authors' judgements about each risk of bias item for each included study.
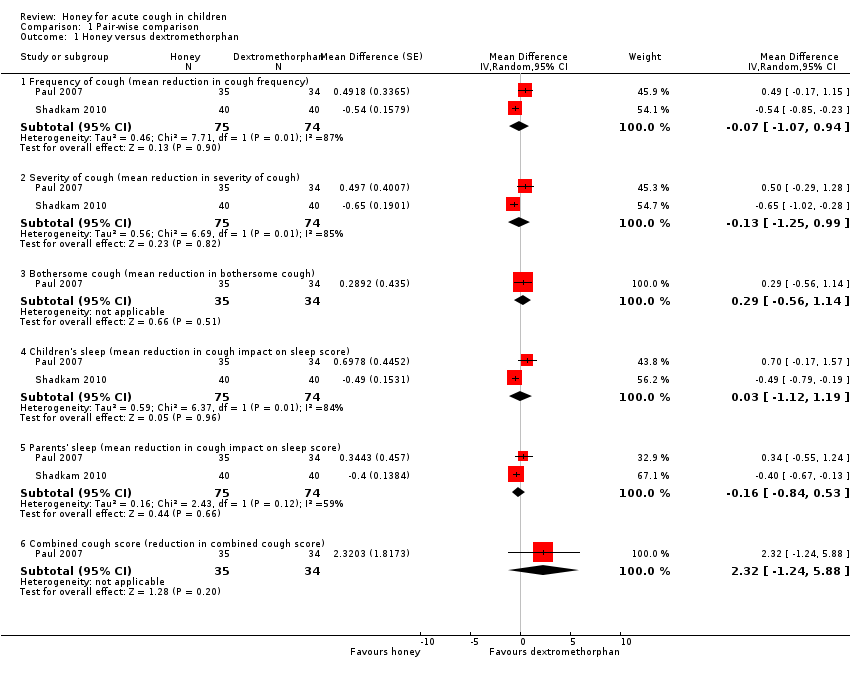
Comparison 1 Pair‐wise comparison, Outcome 1 Honey versus dextromethorphan.

Comparison 1 Pair‐wise comparison, Outcome 2 Honey versus diphenhydramine.
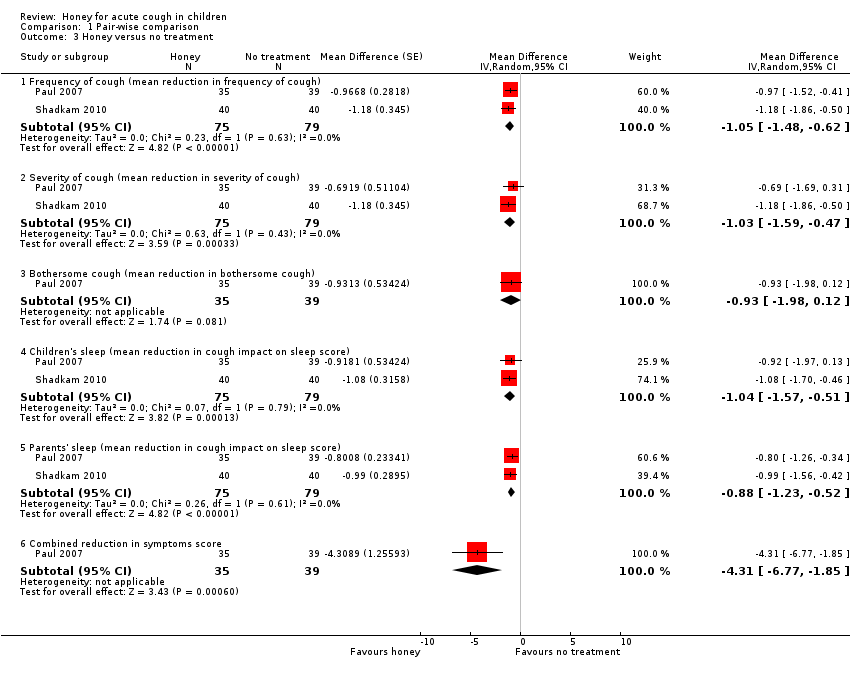
Comparison 1 Pair‐wise comparison, Outcome 3 Honey versus no treatment.
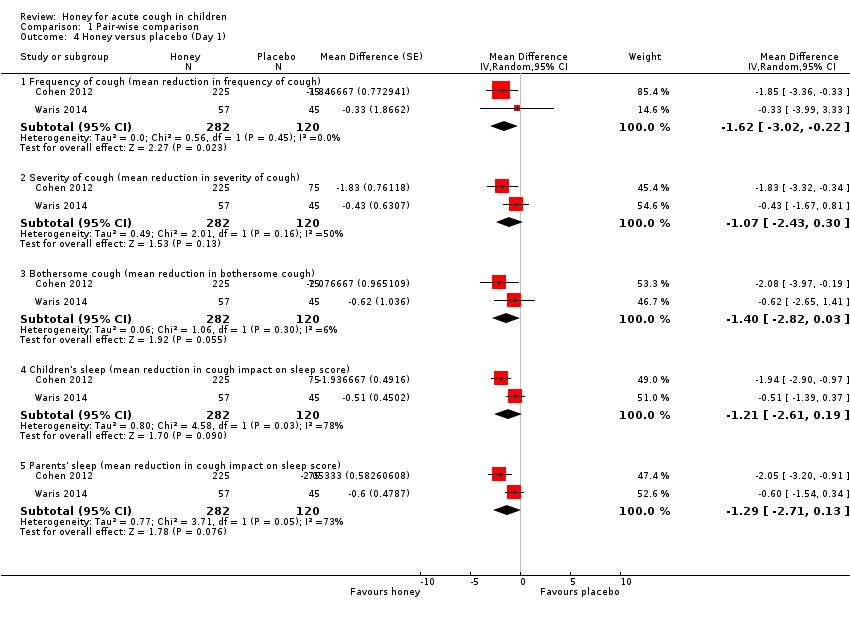
Comparison 1 Pair‐wise comparison, Outcome 4 Honey versus placebo (Day 1).
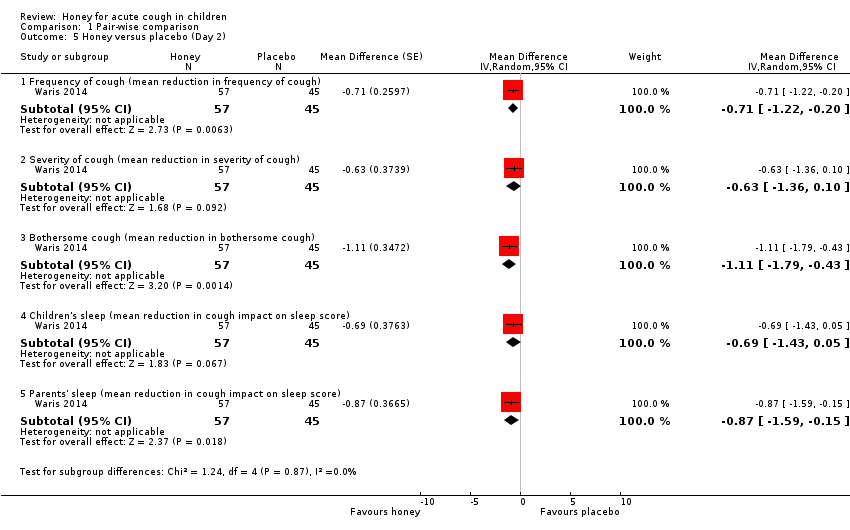
Comparison 1 Pair‐wise comparison, Outcome 5 Honey versus placebo (Day 2).
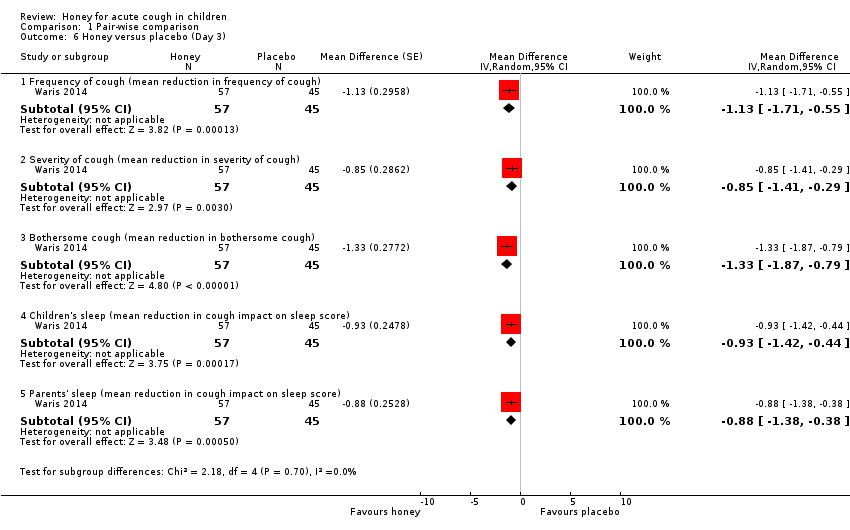
Comparison 1 Pair‐wise comparison, Outcome 6 Honey versus placebo (Day 3).

Comparison 1 Pair‐wise comparison, Outcome 7 Honey versus placebo (Day 4).
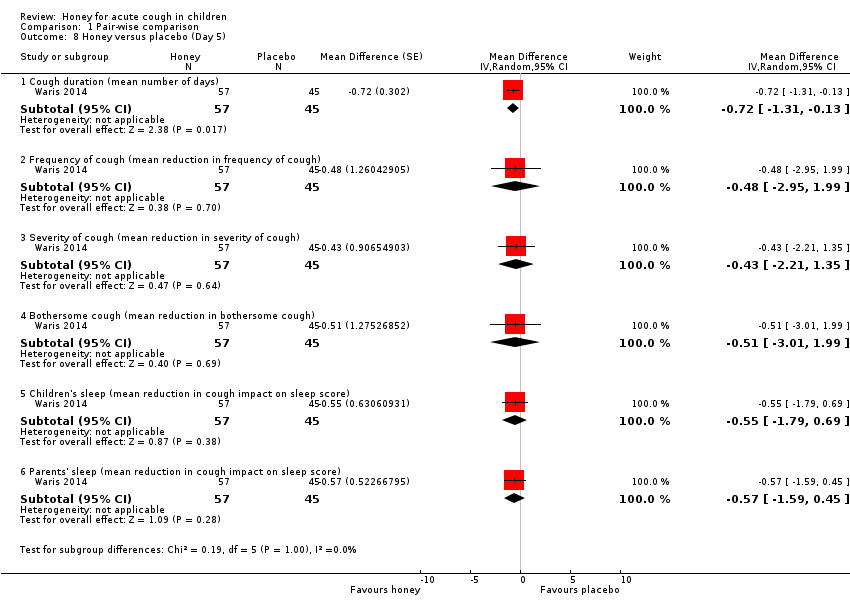
Comparison 1 Pair‐wise comparison, Outcome 8 Honey versus placebo (Day 5).

Comparison 1 Pair‐wise comparison, Outcome 9 Honey versus salbutamol (Day 1).
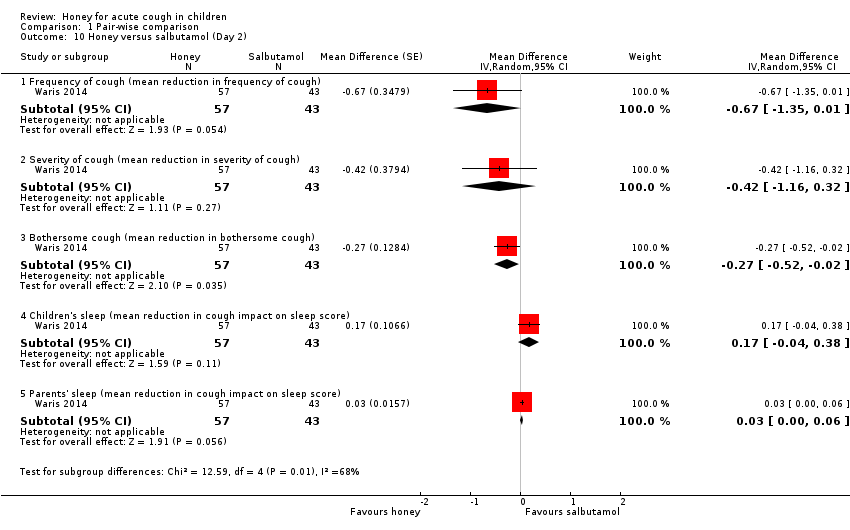
Comparison 1 Pair‐wise comparison, Outcome 10 Honey versus salbutamol (Day 2).

Comparison 1 Pair‐wise comparison, Outcome 11 Honey versus salbutamol (Day 3).
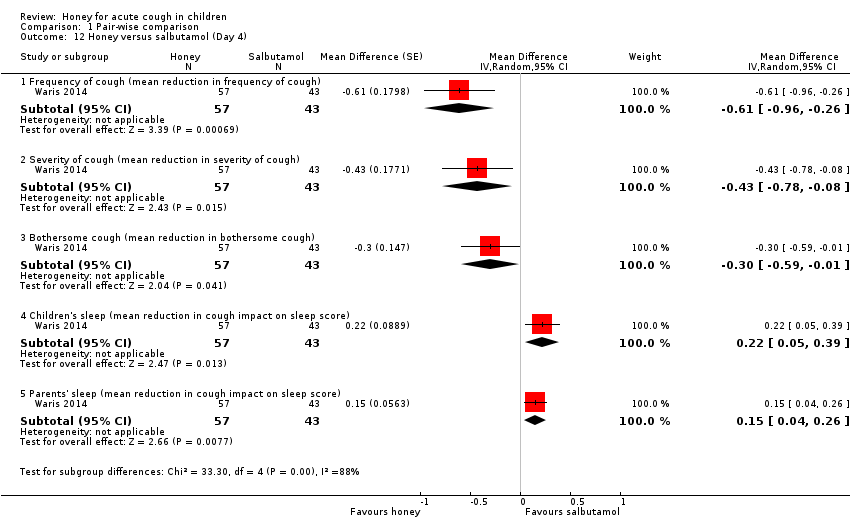
Comparison 1 Pair‐wise comparison, Outcome 12 Honey versus salbutamol (Day 4).

Comparison 1 Pair‐wise comparison, Outcome 13 Honey versus salbutamol (Day 5).

Comparison 2 Pre‐ and postintervention comparison, Outcome 1 Cough frequency (mean reduction in frequency).
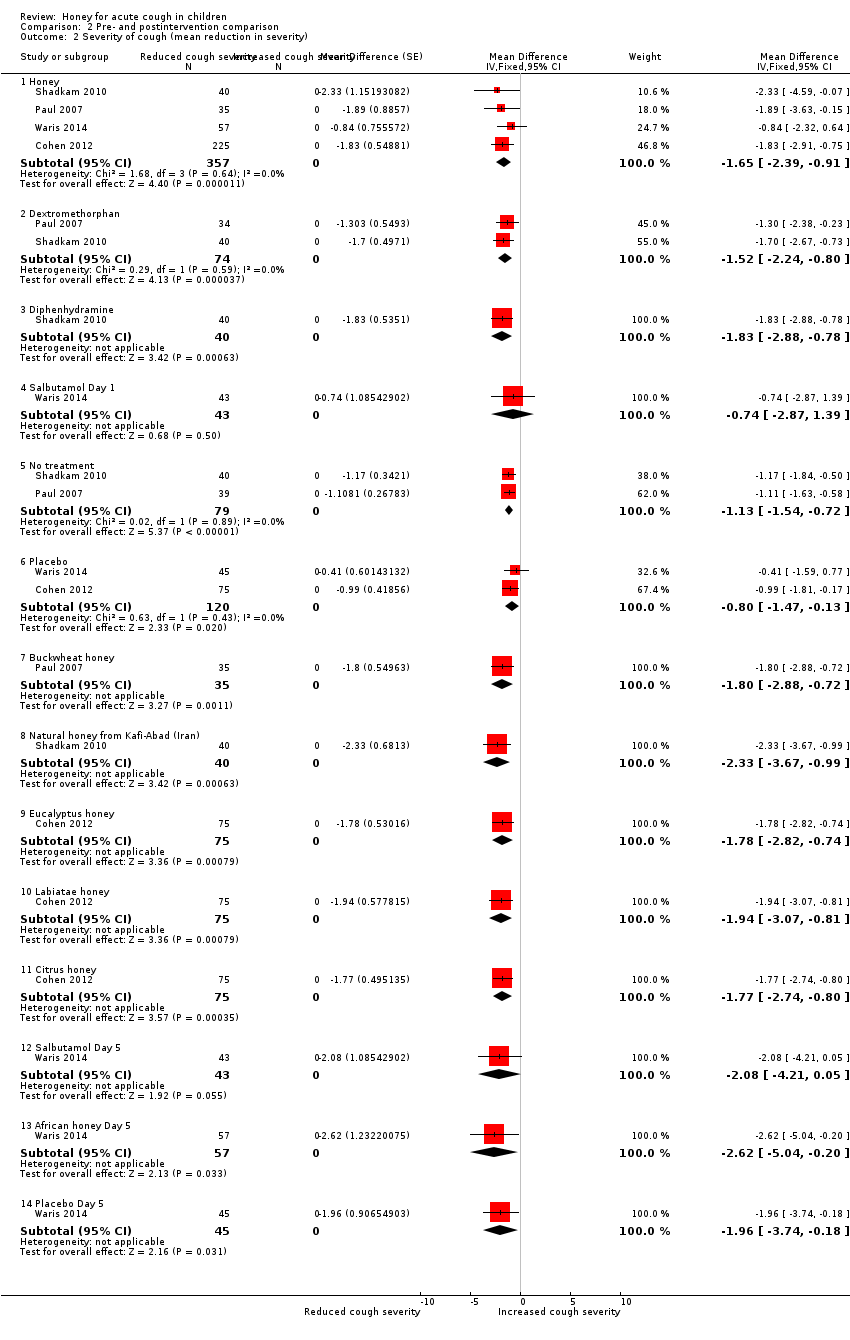
Comparison 2 Pre‐ and postintervention comparison, Outcome 2 Severity of cough (mean reduction in severity).
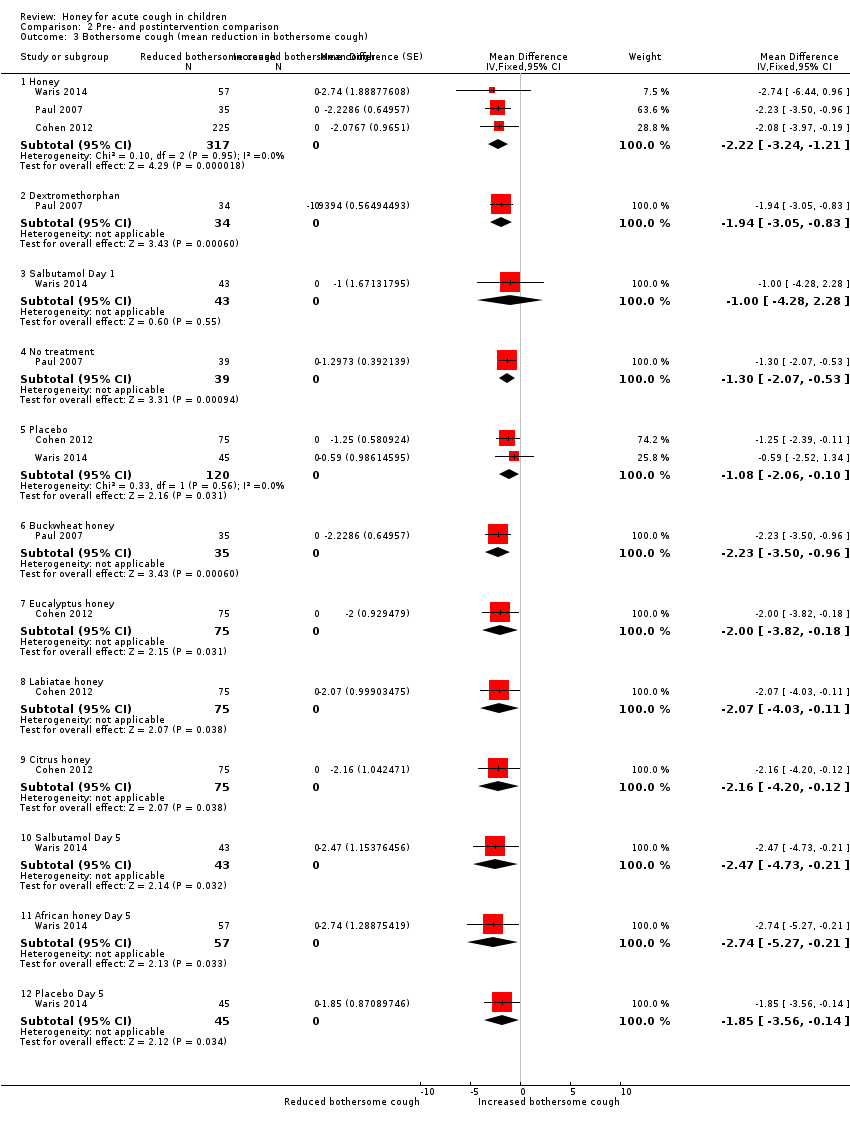
Comparison 2 Pre‐ and postintervention comparison, Outcome 3 Bothersome cough (mean reduction in bothersome cough).

Comparison 2 Pre‐ and postintervention comparison, Outcome 4 Children's sleep (mean reduction in cough impact on sleep score).
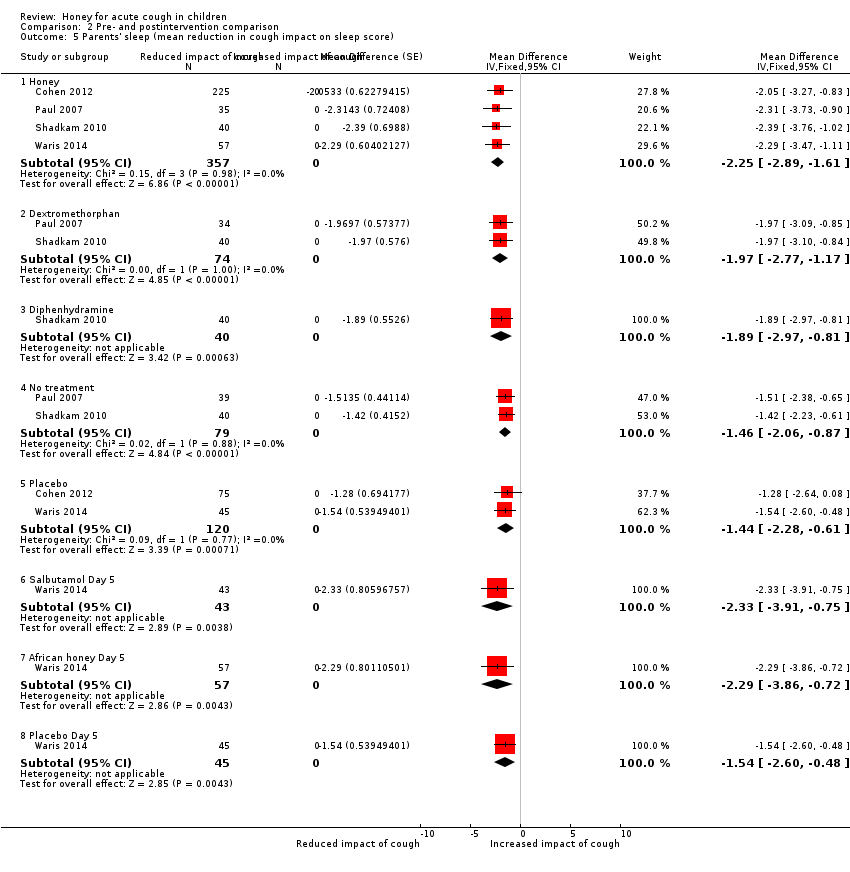
Comparison 2 Pre‐ and postintervention comparison, Outcome 5 Parents' sleep (mean reduction in cough impact on sleep score).
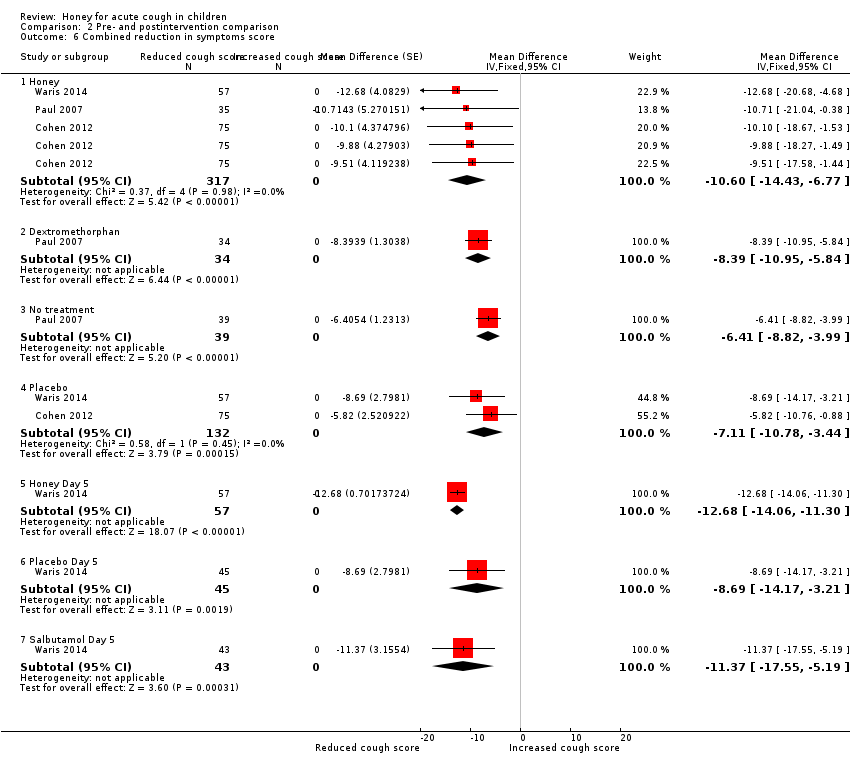
Comparison 2 Pre‐ and postintervention comparison, Outcome 6 Combined reduction in symptoms score.
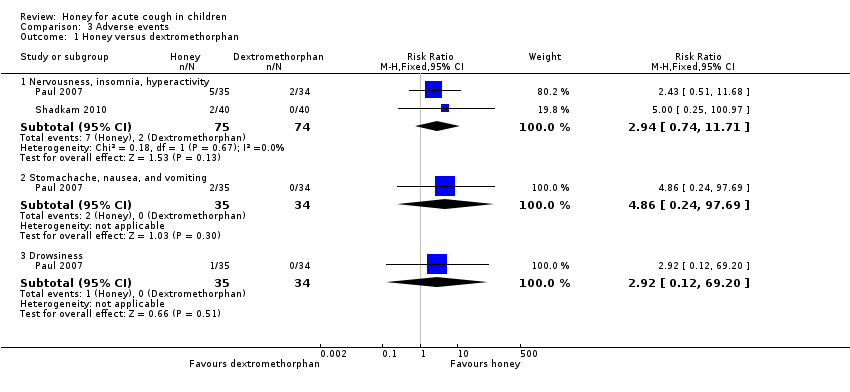
Comparison 3 Adverse events, Outcome 1 Honey versus dextromethorphan.
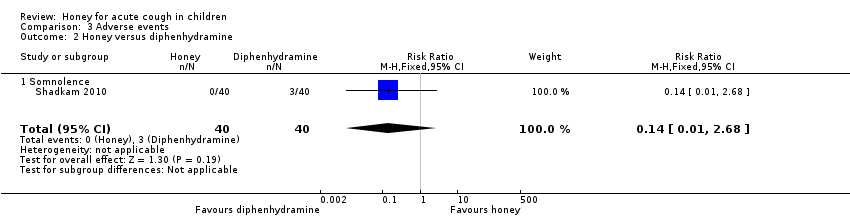
Comparison 3 Adverse events, Outcome 2 Honey versus diphenhydramine.

Comparison 3 Adverse events, Outcome 3 Honey versus placebo.

Comparison 3 Adverse events, Outcome 4 Honey versus salbutamol.

Comparison 3 Adverse events, Outcome 5 Honey versus no treatment.
| Honey compared to dextromethorphan for acute cough in children | ||||||
| Patient or population: acute cough in children | ||||||
| Outcomes | Anticipated absolute effects* (95% CI) | Relative effect | № of participants | Certainty of the evidence | Comments | |
| Risk with dextromethorphan | Risk with honey | |||||
| Duration of cough | ‐ | ‐ | ‐ | ‐ | ‐ | Not assessed |
| Frequency of cough1 | The mean frequency of cough (reduction in frequency of cough score) was ‐1.54. | MD 0.07 score lower | ‐ | 149 | ⊕⊕⊝⊝ | Follow‐up: mean 1 day |
| Severity of cough1 | The mean severity of cough (reduction in severity of cough score) was ‐1.52. | MD 0.13 score lower | ‐ | 149 | ⊕⊕⊝⊝ | Follow‐up: mean 1 day |
| Bothersome cough1 | The mean bothersome cough (reduction in bothersome nature of cough score) was ‐1.94. | MD 0.29 score higher | ‐ | 69 | ⊕⊕⊕⊝ | Follow‐up: mean 1 day |
| Cough impact on children's sleep1 | The mean cough impact on children's sleep (cough impact on children' sleep score) was ‐1.75. | MD 0.03 score higher | ‐ | 149 | ⊕⊕⊝⊝ | Follow‐up: mean 6 days |
| Cough impact on parents' sleep1 | The mean cough impact on parents' sleep (cough impact on parents' sleep score) was ‐1.97. | MD 0.16 score lower | ‐ | 149 | ⊕⊕⊝⊝ | Follow‐up: mean 1 day |
| Adverse events | Population | |||||
| Nervousness, insomnia, hyperactivity | 3 per 100 | 8 per 100 (2 to 32) | RR 2.94 | 149 | ⊕⊕⊝⊝ | Follow‐up: mean 1 day |
| Stomachache, nausea, and vomiting | 1 per 100 | 7 per 100 (0 to 100) | RR 4.86 | 69 | ⊕⊕⊝⊝ | |
| Drowsiness | 1 per 100 | 4 per 100 | RR 2.92 | 69 | ⊕⊕⊝⊝ | |
| *The risk in the intervention group (and its 95% confidence interval) is based on the assumed risk in the comparison group and the relative effect of the intervention (and its 95% CI). | ||||||
| GRADE Working Group grades of evidence | ||||||
| 1Assessed on a 7‐point Likert scale from 0 to 6; lower score is better. | ||||||
| Honey compared to diphenhydramine for acute cough in children | ||||||
| Patient or population: acute cough in children | ||||||
| Outcomes | Anticipated absolute effects* (95% CI) | Relative effect | № of participants | Certainty of the evidence | Comments | |
| Risk with diphenhydramine | Risk with honey | |||||
| Cough duration | ‐ | ‐ | ‐ | ‐ | ‐ | Not assessed |
| Frequency of cough1 | The mean frequency of cough (reduction in cough frequency score) was ‐1.73. | MD 0.57 lower | ‐ | 80 | ⊕⊕⊝⊝ | Follow‐up: mean 1 day |
| Severity of cough1 | The mean severity of cough (reduction in cough severity score) was ‐1.83. | MD 0.6 lower | ‐ | 80 | ⊕⊕⊝⊝ | Follow‐up: mean 1 day |
| Cough impact on children's sleep1 | The mean cough impact on children's sleep (cough impact on children' sleep score) was ‐1.64. | MD 0.55 score lower | ‐ | 80 | ⊕⊕⊝⊝ | Follow‐up: mean 6 days |
| Cough impact on parents' sleep1 | The mean cough impact on parents' sleep (cough impact on parents' sleep score) was ‐1.89. | MD 0.48 lower | ‐ | 80 | ⊕⊕⊝⊝ | Follow‐up: mean 1 day |
| Adverse event: Somnolence | Population | 1 per 100 | RR 0.14 | 80 | ⊕⊕⊝⊝ | Follow‐up: mean 1 day |
| 8 per 100 | ||||||
| *The risk in the intervention group (and its 95% confidence interval) is based on the assumed risk in the comparison group and the relative effect of the intervention (and its 95% CI). | ||||||
| GRADE Working Group grades of evidence | ||||||
| 1Assessed on a 7‐point Likert scale from 0 to 6; lower score is better. | ||||||
| Honey compared to no treatment for acute cough in children | ||||||
| Patient or population: acute cough in children | ||||||
| Outcomes | Anticipated absolute effects* (95% CI) | Relative effect | № of participants | Certainty of the evidence | Comments | |
| Risk with no treatment | Risk with honey | |||||
| Cough duration | ‐ | ‐ | ‐ | ‐ | ‐ | Not assessed |
| Frequency of cough1 | The mean frequency of cough (reduction in cough frequency score) was ‐0.98. | MD 1.05 lower | ‐ | 154 | ⊕⊕⊕⊝ | Follow‐up: mean 1 day |
| Severity of cough1 assessed with: 7‐point Likert scale | The mean severity of cough (reduction in severity of cough score) was ‐1.13. | MD 1.03 score lower | ‐ | 154 | ⊕⊕⊕⊝ | Follow‐up: mean 1 day |
| Bothersome cough1 | The mean bothersome cough (reduction in bothersome nature of cough score) was ‐1.30. | MD 0.93 score lower | ‐ | 74 | ⊕⊕⊝⊝ | Follow‐up: mean 1 day |
| Cough impact on children's sleep1 | The mean cough impact on children's sleep (cough impact on children' sleep score) was ‐1.28. | MD 1.04 score lower | ‐ | 154 | ⊕⊕⊕⊝ | Follow‐up: mean 6 days |
| Cough impact on parents' sleep1 assessed with: 7‐point Likert scale | The mean cough impact on parents' sleep (cough impact on parents' sleep score) was ‐1.46. | MD 0.88 score lower | ‐ | 154 | ⊕⊕⊕⊝ | Follow‐up: mean 1 day |
| Adverse events | Population | |||||
| Nervousness, insomnia, hyperactivity | 1 per 100 | 6 per 100 | RR 9.40 (1.16 to 76.20) | 154 | ⊕⊕⊝⊝ | Follow‐up: mean 1 day |
| Stomachache, nausea, and vomiting | 1 per 100 | 7 per 100 | RR 5.90 (0.27 to 127.14) | 74 | ⊕⊕⊝⊝ | |
| Drowsiness | 1 per 100 | 4 per 100 | RR 3.43 (0.14 to 87.09) | 74 | ⊕⊕⊝⊝ | |
| *The risk in the intervention group (and its 95% confidence interval) is based on the assumed risk in the comparison group and the relative effect of the intervention (and its 95% CI). | ||||||
| GRADE Working Group grades of evidence | ||||||
| 1Assessed on a 7‐point Likert scale from 0 to 6; lower score is better. | ||||||
| Honey compared to placebo for acute cough in children | ||||||
| Patient or population: acute cough in children | ||||||
| Outcomes | Anticipated absolute effects* (95% CI) | Relative effect | № of participants | Certainty of the evidence | Comments | |
| Risk with placebo | Risk with honey | |||||
| Day 1 | ||||||
| Frequency of cough1 | The mean frequency of cough (reduction in cough frequency score) was ‐0.99. | MD 1.62 score lower | ‐ | 402 | ⊕⊕⊕⊝ | Follow‐up: mean 1 day |
| Severity of cough1 | The mean severity of cough (reduction in severity of cough score) was ‐0.80. | MD 1.07 score lower | ‐ | 402 | ⊕⊕⊕⊝ | |
| Bothersome cough (mean improvement score)1 | The mean bothersome cough (reduction in bothersome nature of cough) was ‐1.08. | MD 1.4 score lower | ‐ | 402 | ⊕⊕⊕⊝ | |
| Cough impact on children's sleep1 | The mean cough impact on children's sleep (cough impact on children' sleep score) was ‐1.03. | MD 1.21 score lower | ‐ | 402 | ⊕⊕⊕⊝ | Follow‐up: mean 6 days |
| Cough impact on parents' sleep1 | The mean cough impact on parents' sleep (cough impact on parents' sleep score) was ‐1.44. | MD 1.29 score lower | ‐ | 402 | ⊕⊕⊕⊝ | Follow‐up: mean 1 day |
| Day 3 | ||||||
| Frequency of cough1 | The mean frequency of cough (reduction in frequency of cough score) was ‐0.9. | MD 1.13 score lower | ‐ | 102 | ⊕⊕⊕⊝ | Follow‐up: mean 6 days |
| Severity of cough1 | The mean severity of cough (reduction in severity of cough score) was ‐1.08. | MD 0.85 score lower | ‐ | 102 | ⊕⊕⊕⊝ | |
| Bothersome cough1 | The mean bothersome cough (reduction in bothersome nature of cough score) was ‐0.99. | MD 1.33 score lower | ‐ | 102 | ⊕⊕⊕⊝ | |
| Cough impact on children's sleep1 | The mean cough impact on children's sleep (cough impact on children's sleep score) was ‐0.46. | MD 0.93 score lower | ‐ | 102 | ⊕⊕⊕⊝ | |
| Cough impact on parents' sleep3 | The mean cough impact on parents' sleep (cough impact on parents' sleep score) was ‐1.04. | MD 0.88 score lower | ‐ | 102 | ⊕⊕⊕⊝ | |
| Day 5 | ||||||
| Cough duration | The mean cough duration was 5.18 days. | MD 0.72 days lower | ‐ | 102 | ⊕⊕⊕⊝ | Follow‐up: mean 6 days; assessed with: 7‐point Likert scale |
| Frequency of cough1 | The mean frequency of cough (reduction in frequency of cough score) was ‐1.95. | MD 0.48 score lower | ‐ | 102 | ⊕⊕⊕⊝ | |
| Severity of cough1 | The mean severity of cough (reduction in severity of cough score) was ‐1.96. | MD 0.43 score lower | ‐ | 102 | ⊕⊕⊕⊝ | |
| Bothersome cough1 | The mean bothersome cough (reduction in bothersome nature of cough score) was ‐1.85. | MD 0.51 score lower | ‐ | 102 | ⊕⊕⊕⊝ | |
| Cough impact on children's sleep1 | The mean cough impact on children's sleep (cough impact on children' sleep score) was ‐1.68. | MD 0.55 score lower | ‐ | 102 | ⊕⊕⊕⊝ | |
| Cough impact on parents' sleep | The mean cough impact on parents' sleep (cough impact on parents' sleep score) was ‐1.54. | MD 0.57 score lower | ‐ | 102 | ⊕⊕⊕⊝ | |
| Adverse events | Population | |||||
| Stomachache, nausea, and vomiting | 11 per 100 | 21 per 100 | RR 1.91 | 402 | ⊕⊕⊕⊝ | Follow‐up: mean 6 days |
| Diarrhoea | 13 per 100 | 12 per 100 | RR 0.92 | 102 | ⊕⊕⊝⊝ | |
| Tachycardia | 2 per 100 | 4 per 100 | RR 1.58 | 102 | ⊕⊕⊝⊝ | |
| *The risk in the intervention group (and its 95% confidence interval) is based on the assumed risk in the comparison group and the relative effect of the intervention (and its 95% CI). | ||||||
| GRADE Working Group grades of evidence | ||||||
| 1Assessed on a 7‐point Likert scale from 0 to 6; lower score is better. | ||||||
| Honey compared to salbutamol for acute cough in children | ||||||
| Patient or population: acute cough in children | ||||||
| Outcomes | Anticipated absolute effects* (95% CI) | Relative effect | № of participants | Certainty of the evidence | Comments | |
| Risk with salbutamol | Risk with honey | |||||
| Day 1 | ||||||
| Frequency of cough (mean improvement score)1 | The mean frequency of cough (reduction in frequency of cough score) was ‐0.52. | MD 0.26 lower | ‐ | 100 | ⊕⊕⊕⊝ | Follow‐up: mean 6 days |
| Severity of cough (mean improvement score)1 | The mean severity of cough (reduction in severity of cough score) was ‐0.74. | MD 0.1 lower | ‐ | 100 | ⊕⊕⊕⊝ | |
| Bothersome cough (mean improvement score)1 | The mean bothersome cough (reduction in bothersome nature of cough score) was ‐1.00. | MD 0.21 lower | ‐ | 100 | ⊕⊕⊕⊝ | |
| Cough impact on children's sleep1 | The mean cough impact on children's sleep (cough impact on children' sleep score) was ‐1.24. | MD 0.09 higher | ‐ | 100 | ⊕⊕⊕⊝ | |
| Cough impact on parents' sleep1 | The mean cough impact on parents' sleep (cough impact on parents' sleep score) was ‐1.22. | MD 0.05 higher | ‐ | 100 | ⊕⊕⊕⊝ | |
| Day 3 | ||||||
| Frequency of cough1 | The mean frequency of cough (reduction in frequency of cough score) was ‐1.34. | MD 0.69 lower | ‐ | 100 | ⊕⊕⊕⊝ | Follow‐up: mean 4 days |
| Severity of cough1 | The mean severity of cough (reduction in severity of cough score) was ‐1.59. | MD 0.34 lower | ‐ | 100 | ⊕⊕⊕⊝ | |
| Bothersome cough1 | The mean bothersome cough (reduction in bothersome nature of cough score) was ‐2.08. | MD 0.24 lower | ‐ | 100 | ⊕⊕⊕⊝ | |
| Cough impact on children's sleep1 | The mean cough impact on children's sleep (cough impact on children' sleep score) was ‐2.25. | MD 0.31 higher | ‐ | 100 | ⊕⊕⊕⊝ | Follow‐up: mean 6 days |
| Cough impact on parents' sleep1 | The mean cough impact on parents' sleep (cough impact on parents' sleep score) was ‐2.13. | MD 0.21 higher | ‐ | 100 | ⊕⊕⊕⊝ | Follow‐up: mean 4 days |
| Day 5 | ||||||
| Cough duration | The mean cough duration was 5 days. | MD 0.54 days lower | ‐ | 100 | ⊕⊕⊕⊝ | Follow‐up: mean 6 days |
| Frequency of cough (mean improvement score)1 | The mean frequency of cough (reduction in frequency of cough score) was ‐2.19. | MD 0.54 lower | ‐ | 100 | ⊕⊕⊕⊝ | |
| Severity of cough (mean improvement score)1 | The mean severity of cough (reduction in severity of cough score) was ‐2.08. | MD 0.41 lower | ‐ | 100 | ⊕⊕⊕⊝ | |
| Bothersome cough (mean improvement score)1 | The mean bothersome cough (reduction in bothersome nature of cough score) was ‐2.47. | MD 0.27 lower | ‐ | 100 | ⊕⊕⊕⊝ | |
| Cough impact on children's sleep1 | The mean cough impact on children's sleep (cough impact on children's sleep score) was ‐2.47. | MD 0.15 higher | ‐ | 100 | ⊕⊕⊕⊝ | |
| Cough impact on parents' sleep1 | The mean cough impact on parents' sleep (cough impact on parents' sleep score) was ‐2.33. | MD 0.04 higher | ‐ | 100 | ⊕⊕⊕⊝ | |
| Adverse events | Population | |||||
| Stomachache, nausea, and vomiting | 30 per 100 | 53 per 100 | RR 1.74 | 100 | ⊕⊕⊕⊝ | Follow‐up: mean 6 days |
| Rash | 9 per 100 | 2 per 100 | RR 0.19 | 100 | ⊕⊕⊕⊝ | |
| Tachycardia | 2 per 100 | 4 per 100 | RR 1.51 (0.14 to 16.10) | 100 | ⊕⊕⊝⊝ | |
| Diarrhoea | 21 per 100 | 12 per 100 | RR 0.59 | 100 | ⊕⊕⊕⊝ | |
| *The risk in the intervention group (and its 95% confidence interval) is based on the assumed risk in the comparison group and the relative effect of the intervention (and its 95% CI). | ||||||
| GRADE Working Group grades of evidence | ||||||
| 1Assessed on a 7‐point Likert scale from 0 to 6; lower score is better. | ||||||
| Study ID | Cough | Honey (N = 29) | Bromelin (N = 31) | P value | Certainty of the evidence |
| Frequency of cough1 | |||||
| Before, median (P25 to P75) After, median (P25 to P75) Mean ± SD | 3 (2 to 4) 1 (1 to 1) 1.76 ± 0.87 | 3 (2 to 3) 1 (1 to 1) 1.71 ± 0.78 | 0.832 0.943 | ⊕⊕⊕⊝ | |
| Severity of cough1 | |||||
| Mean ± SD assessed with: unvalidated 5‐point cough scale from 0 to 4 | ‐0.86 ± 0.45 | ‐0.97 ± 0.62 | 0.322 0.223 | ⊕⊕⊕⊝ | |
| Honey (N = 63) | Diphenhydramine (N = 63) | ||||
| Proportion of children with reduction in frequency and severity of daytime cough5 | 84.1% (N = 53) | 58.7% (N = 37) | "< 0.02" | ⊕⊕⊕⊝ | |
| Proportion of children with reduction in frequency and severity of nighttime cough5 | 79.4% (N = 50) | 58.7% (N = 37) | "< 0.02" | ⊕⊕⊕⊝ | |
| SD: standard deviation 1Assessed on an unvalidated 5‐point cough scale from 0 to 4; lower score is better. | |||||
| Outcome or subgroup title | No. of studies | No. of participants | Statistical method | Effect size |
| 1 Honey versus dextromethorphan Show forest plot | 2 | Mean Difference (Random, 95% CI) | Subtotals only | |
| 1.1 Frequency of cough (mean reduction in cough frequency) | 2 | 149 | Mean Difference (Random, 95% CI) | ‐0.07 [‐1.07, 0.94] |
| 1.2 Severity of cough (mean reduction in severity of cough) | 2 | 149 | Mean Difference (Random, 95% CI) | ‐0.13 [‐1.25, 0.99] |
| 1.3 Bothersome cough (mean reduction in bothersome cough) | 1 | 69 | Mean Difference (Random, 95% CI) | 0.29 [‐0.56, 1.14] |
| 1.4 Children's sleep (mean reduction in cough impact on sleep score) | 2 | 149 | Mean Difference (Random, 95% CI) | 0.03 [‐1.12, 1.19] |
| 1.5 Parents' sleep (mean reduction in cough impact on sleep score) | 2 | 149 | Mean Difference (Random, 95% CI) | ‐0.16 [‐0.84, 0.53] |
| 1.6 Combined cough score (reduction in combined cough score) | 1 | 69 | Mean Difference (Random, 95% CI) | 2.32 [‐1.24, 5.88] |
| 2 Honey versus diphenhydramine Show forest plot | 1 | Mean Difference (Random, 95% CI) | Subtotals only | |
| 2.1 Frequency of cough (mean reduction in cough frequency) | 1 | 80 | Mean Difference (Random, 95% CI) | ‐0.57 [‐0.90, ‐0.24] |
| 2.2 Severity of cough (mean reduction in severity of cough) | 1 | 80 | Mean Difference (Random, 95% CI) | ‐0.6 [‐0.94, ‐0.26] |
| 2.3 Children's sleep (mean reduction in cough impact on sleep score) | 1 | 80 | Mean Difference (Random, 95% CI) | ‐0.55 [‐0.87, ‐0.23] |
| 2.4 Parents' sleep (mean reduction in cough impact on sleep score) | 1 | 80 | Mean Difference (Random, 95% CI) | ‐0.48 [‐0.76, ‐0.20] |
| 3 Honey versus no treatment Show forest plot | 2 | Mean Difference (Random, 95% CI) | Subtotals only | |
| 3.1 Frequency of cough (mean reduction in frequency of cough) | 2 | 154 | Mean Difference (Random, 95% CI) | ‐1.05 [‐1.48, ‐0.62] |
| 3.2 Severity of cough (mean reduction in severity of cough) | 2 | 154 | Mean Difference (Random, 95% CI) | ‐1.03 [‐1.59, ‐0.47] |
| 3.3 Bothersome cough (mean reduction in bothersome cough) | 1 | 74 | Mean Difference (Random, 95% CI) | ‐0.93 [‐1.98, 0.12] |
| 3.4 Children's sleep (mean reduction in cough impact on sleep score) | 2 | 154 | Mean Difference (Random, 95% CI) | ‐1.04 [‐1.57, ‐0.51] |
| 3.5 Parents' sleep (mean reduction in cough impact on sleep score) | 2 | 154 | Mean Difference (Random, 95% CI) | ‐0.88 [‐1.23, ‐0.52] |
| 3.6 Combined reduction in symptoms score | 1 | 74 | Mean Difference (Random, 95% CI) | ‐4.31 [‐6.77, ‐1.85] |
| 4 Honey versus placebo (Day 1) Show forest plot | 2 | Mean Difference (Random, 95% CI) | Subtotals only | |
| 4.1 Frequency of cough (mean reduction in frequency of cough) | 2 | 402 | Mean Difference (Random, 95% CI) | ‐1.62 [‐3.02, ‐0.22] |
| 4.2 Severity of cough (mean reduction in severity of cough) | 2 | 402 | Mean Difference (Random, 95% CI) | ‐1.07 [‐2.43, 0.30] |
| 4.3 Bothersome cough (mean reduction in bothersome cough) | 2 | 402 | Mean Difference (Random, 95% CI) | ‐1.40 [‐2.82, 0.03] |
| 4.4 Children's sleep (mean reduction in cough impact on sleep score) | 2 | 402 | Mean Difference (Random, 95% CI) | ‐1.21 [‐2.61, 0.19] |
| 4.5 Parents' sleep (mean reduction in cough impact on sleep score) | 2 | 402 | Mean Difference (Random, 95% CI) | ‐1.29 [‐2.71, 0.13] |
| 5 Honey versus placebo (Day 2) Show forest plot | 1 | Mean Difference (Random, 95% CI) | Subtotals only | |
| 5.1 Frequency of cough (mean reduction in frequency of cough) | 1 | 102 | Mean Difference (Random, 95% CI) | ‐0.71 [‐1.22, ‐0.20] |
| 5.2 Severity of cough (mean reduction in severity of cough) | 1 | 102 | Mean Difference (Random, 95% CI) | ‐0.63 [‐1.36, 0.10] |
| 5.3 Bothersome cough (mean reduction in bothersome cough) | 1 | 102 | Mean Difference (Random, 95% CI) | ‐1.11 [‐1.79, ‐0.43] |
| 5.4 Children's sleep (mean reduction in cough impact on sleep score) | 1 | 102 | Mean Difference (Random, 95% CI) | ‐0.69 [‐1.43, 0.05] |
| 5.5 Parents' sleep (mean reduction in cough impact on sleep score) | 1 | 102 | Mean Difference (Random, 95% CI) | ‐0.87 [‐1.59, ‐0.15] |
| 6 Honey versus placebo (Day 3) Show forest plot | 1 | Mean Difference (Random, 95% CI) | Subtotals only | |
| 6.1 Frequency of cough (mean reduction in frequency of cough) | 1 | 102 | Mean Difference (Random, 95% CI) | ‐1.13 [‐1.71, ‐0.55] |
| 6.2 Severity of cough (mean reduction in severity of cough) | 1 | 102 | Mean Difference (Random, 95% CI) | ‐0.85 [‐1.41, ‐0.29] |
| 6.3 Bothersome cough (mean reduction in bothersome cough) | 1 | 102 | Mean Difference (Random, 95% CI) | ‐1.33 [‐1.87, ‐0.79] |
| 6.4 Children's sleep (mean reduction in cough impact on sleep score) | 1 | 102 | Mean Difference (Random, 95% CI) | ‐0.93 [‐1.42, ‐0.44] |
| 6.5 Parents' sleep (mean reduction in cough impact on sleep score) | 1 | 102 | Mean Difference (Random, 95% CI) | ‐0.88 [‐1.38, ‐0.38] |
| 7 Honey versus placebo (Day 4) Show forest plot | 1 | Mean Difference (Random, 95% CI) | Subtotals only | |
| 7.1 Frequency of cough (mean reduction in frequency of cough) | 1 | 102 | Mean Difference (Random, 95% CI) | ‐1.16 [‐1.83, ‐0.49] |
| 7.2 Severity of cough (mean reduction in severity of cough) | 1 | 102 | Mean Difference (Random, 95% CI) | ‐0.88 [‐1.59, ‐0.17] |
| 7.3 Bothersome cough (mean reduction in bothersome cough) | 1 | 102 | Mean Difference (Random, 95% CI) | ‐0.90 [‐1.76, ‐0.04] |
| 7.4 Children's sleep (mean reduction in cough impact on sleep score) | 1 | 102 | Mean Difference (Random, 95% CI) | ‐0.7 [‐1.25, ‐0.15] |
| 7.5 Parents' sleep (mean reduction in cough impact on sleep score) | 1 | 102 | Mean Difference (Random, 95% CI) | ‐0.90 [‐1.51, ‐0.29] |
| 8 Honey versus placebo (Day 5) Show forest plot | 1 | Mean Difference (Random, 95% CI) | Subtotals only | |
| 8.1 Cough duration (mean number of days) | 1 | 102 | Mean Difference (Random, 95% CI) | ‐0.72 [‐1.31, ‐0.13] |
| 8.2 Frequency of cough (mean reduction in frequency of cough) | 1 | 102 | Mean Difference (Random, 95% CI) | ‐0.48 [‐2.95, 1.99] |
| 8.3 Severity of cough (mean reduction in severity of cough) | 1 | 102 | Mean Difference (Random, 95% CI) | ‐0.43 [‐2.21, 1.35] |
| 8.4 Bothersome cough (mean reduction in bothersome cough) | 1 | 102 | Mean Difference (Random, 95% CI) | ‐0.51 [‐3.01, 1.99] |
| 8.5 Children's sleep (mean reduction in cough impact on sleep score) | 1 | 102 | Mean Difference (Random, 95% CI) | ‐0.55 [‐1.79, 0.69] |
| 8.6 Parents' sleep (mean reduction in cough impact on sleep score) | 1 | 102 | Mean Difference (Random, 95% CI) | ‐0.57 [‐1.59, 0.45] |
| 9 Honey versus salbutamol (Day 1) Show forest plot | 1 | Mean Difference (Random, 95% CI) | Subtotals only | |
| 9.1 Frequency of cough (mean reduction in frequency of cough) | 1 | 100 | Mean Difference (Random, 95% CI) | ‐0.26 [‐3.14, 2.62] |
| 9.2 Severity of cough (mean reduction in severity of cough) | 1 | 100 | Mean Difference (Random, 95% CI) | ‐0.1 [‐0.39, 0.19] |
| 9.3 Bothersome cough (mean reduction in bothersome cough) | 1 | 100 | Mean Difference (Random, 95% CI) | ‐0.21 [‐0.90, 0.48] |
| 9.4 Children's sleep (mean reduction in cough impact on sleep score) | 1 | 100 | Mean Difference (Random, 95% CI) | 0.09 [‐0.05, 0.23] |
| 9.5 Parents' sleep (mean reduction in cough impact on sleep score) | 1 | 100 | Mean Difference (Random, 95% CI) | 0.05 [‐0.03, 0.13] |
| 10 Honey versus salbutamol (Day 2) Show forest plot | 1 | Mean Difference (Random, 95% CI) | Subtotals only | |
| 10.1 Frequency of cough (mean reduction in frequency of cough) | 1 | 100 | Mean Difference (Random, 95% CI) | ‐0.67 [‐1.35, 0.01] |
| 10.2 Severity of cough (mean reduction in severity of cough) | 1 | 100 | Mean Difference (Random, 95% CI) | ‐0.42 [‐1.16, 0.32] |
| 10.3 Bothersome cough (mean reduction in bothersome cough) | 1 | 100 | Mean Difference (Random, 95% CI) | ‐0.27 [‐0.52, ‐0.02] |
| 10.4 Children's sleep (mean reduction in cough impact on sleep score) | 1 | 100 | Mean Difference (Random, 95% CI) | 0.17 [‐0.04, 0.38] |
| 10.5 Parents' sleep (mean reduction in cough impact on sleep score) | 1 | 100 | Mean Difference (Random, 95% CI) | 0.03 [‐0.00, 0.06] |
| 11 Honey versus salbutamol (Day 3) Show forest plot | 1 | Mean Difference (Random, 95% CI) | Subtotals only | |
| 11.1 Frequency of cough (mean reduction in frequency of cough) | 1 | 100 | Mean Difference (Random, 95% CI) | ‐0.69 [‐1.13, ‐0.25] |
| 11.2 Severity of cough (mean reduction in severity of cough) | 1 | 100 | Mean Difference (Random, 95% CI) | ‐0.34 [‐0.64, ‐0.04] |
| 11.3 Bothersome cough (mean reduction in bothersome cough) | 1 | 100 | Mean Difference (Random, 95% CI) | ‐0.24 [‐0.38, ‐0.10] |
| 11.4 Children's sleep (mean reduction in cough impact on sleep score) | 1 | 100 | Mean Difference (Random, 95% CI) | 0.31 [0.13, 0.49] |
| 11.5 Parents' sleep (mean reduction in cough impact on sleep score) | 1 | 100 | Mean Difference (Random, 95% CI) | 0.21 [0.06, 0.36] |
| 12 Honey versus salbutamol (Day 4) Show forest plot | 1 | Mean Difference (Random, 95% CI) | Subtotals only | |
| 12.1 Frequency of cough (mean reduction in frequency of cough) | 1 | 100 | Mean Difference (Random, 95% CI) | ‐0.61 [‐0.96, ‐0.26] |
| 12.2 Severity of cough (mean reduction in severity of cough) | 1 | 100 | Mean Difference (Random, 95% CI) | ‐0.43 [‐0.78, ‐0.08] |
| 12.3 Bothersome cough (mean reduction in bothersome cough) | 1 | 100 | Mean Difference (Random, 95% CI) | ‐0.3 [‐0.59, ‐0.01] |
| 12.4 Children's sleep (mean reduction in cough impact on sleep score) | 1 | 100 | Mean Difference (Random, 95% CI) | 0.22 [0.05, 0.39] |
| 12.5 Parents' sleep (mean reduction in cough impact on sleep score) | 1 | 100 | Mean Difference (Random, 95% CI) | 0.15 [0.04, 0.26] |
| 13 Honey versus salbutamol (Day 5) Show forest plot | 1 | Mean Difference (Random, 95% CI) | Subtotals only | |
| 13.1 Cough duration (mean number of days) | 1 | 100 | Mean Difference (Random, 95% CI) | ‐0.54 [‐0.98, ‐0.10] |
| 13.2 Frequency of cough (mean reduction in frequency of cough) | 1 | 100 | Mean Difference (Random, 95% CI) | ‐0.54 [‐1.03, ‐0.05] |
| 13.3 Severity of cough (mean reduction in severity of cough) | 1 | 100 | Mean Difference (Random, 95% CI) | ‐0.41 [‐0.78, ‐0.04] |
| 13.4 Bothersome cough (mean reduction in bothersome cough) | 1 | 100 | Mean Difference (Random, 95% CI) | ‐0.27 [‐0.48, ‐0.06] |
| 13.5 Children's sleep (mean reduction in cough impact on sleep score) | 1 | 100 | Mean Difference (Random, 95% CI) | 0.15 [0.04, 0.26] |
| 13.6 Parents' sleep (mean reduction in cough impact on sleep score) | 1 | 100 | Mean Difference (Random, 95% CI) | 0.04 [0.01, 0.07] |
| Outcome or subgroup title | No. of studies | No. of participants | Statistical method | Effect size |
| 1 Cough frequency (mean reduction in frequency) Show forest plot | 4 | Mean Difference (Fixed, 95% CI) | Subtotals only | |
| 1.1 Honey | 4 | 357 | Mean Difference (Fixed, 95% CI) | ‐1.71 [‐2.28, ‐1.13] |
| 1.2 Dextromethorphan | 2 | 74 | Mean Difference (Fixed, 95% CI) | ‐1.54 [‐2.30, ‐0.78] |
| 1.3 Diphenhydramine | 1 | 40 | Mean Difference (Fixed, 95% CI) | ‐1.73 [‐2.72, ‐0.74] |
| 1.4 Placebo | 2 | 120 | Mean Difference (Fixed, 95% CI) | ‐0.99 [‐1.79, ‐0.18] |
| 1.5 Salbutamol Day 1 | 1 | 43 | Mean Difference (Fixed, 95% CI) | ‐0.52 [‐6.28, 5.24] |
| 1.6 No treatment | 2 | 79 | Mean Difference (Fixed, 95% CI) | ‐0.98 [‐1.38, ‐0.59] |
| 1.7 Buckwheat honey | 1 | 35 | Mean Difference (Fixed, 95% CI) | ‐1.89 [‐2.96, ‐0.81] |
| 1.8 Natural honey from Kafi‐Abad (Iran) | 1 | 40 | Mean Difference (Fixed, 95% CI) | ‐2.16 [‐3.40, ‐0.92] |
| 1.9 Eucalyptus honey | 1 | 75 | Mean Difference (Fixed, 95% CI) | ‐1.77 [‐3.22, ‐0.32] |
| 1.10 Labiatae honey | 1 | 75 | Mean Difference (Fixed, 95% CI) | ‐1.82 [‐3.30, ‐0.34] |
| 1.11 Citrus honey | 1 | 75 | Mean Difference (Fixed, 95% CI) | ‐1.95 [‐3.55, ‐0.35] |
| 1.12 Salbutamol Day 5 | 1 | 43 | Mean Difference (Fixed, 95% CI) | ‐2.19 [‐3.55, ‐0.83] |
| 1.13 African honey Day 5 | 1 | 57 | Mean Difference (Fixed, 95% CI) | ‐2.65 [‐4.32, ‐0.98] |
| 1.14 Placebo Day 5 | 1 | 45 | Mean Difference (Fixed, 95% CI) | ‐1.95 [‐4.42, 0.52] |
| 2 Severity of cough (mean reduction in severity) Show forest plot | 4 | Mean Difference (Fixed, 95% CI) | Subtotals only | |
| 2.1 Honey | 4 | 357 | Mean Difference (Fixed, 95% CI) | ‐1.65 [‐2.39, ‐0.91] |
| 2.2 Dextromethorphan | 2 | 74 | Mean Difference (Fixed, 95% CI) | ‐1.52 [‐2.24, ‐0.80] |
| 2.3 Diphenhydramine | 1 | 40 | Mean Difference (Fixed, 95% CI) | ‐1.83 [‐2.88, ‐0.78] |
| 2.4 Salbutamol Day 1 | 1 | 43 | Mean Difference (Fixed, 95% CI) | ‐0.74 [‐2.87, 1.39] |
| 2.5 No treatment | 2 | 79 | Mean Difference (Fixed, 95% CI) | ‐1.13 [‐1.54, ‐0.72] |
| 2.6 Placebo | 2 | 120 | Mean Difference (Fixed, 95% CI) | ‐0.80 [‐1.47, ‐0.13] |
| 2.7 Buckwheat honey | 1 | 35 | Mean Difference (Fixed, 95% CI) | ‐1.80 [‐2.88, ‐0.72] |
| 2.8 Natural honey from Kafi‐Abad (Iran) | 1 | 40 | Mean Difference (Fixed, 95% CI) | ‐2.33 [‐3.67, ‐0.99] |
| 2.9 Eucalyptus honey | 1 | 75 | Mean Difference (Fixed, 95% CI) | ‐1.78 [‐2.82, ‐0.74] |
| 2.10 Labiatae honey | 1 | 75 | Mean Difference (Fixed, 95% CI) | ‐1.94 [‐3.07, ‐0.81] |
| 2.11 Citrus honey | 1 | 75 | Mean Difference (Fixed, 95% CI) | ‐1.77 [‐2.74, ‐0.80] |
| 2.12 Salbutamol Day 5 | 1 | 43 | Mean Difference (Fixed, 95% CI) | ‐2.08 [‐4.21, 0.05] |
| 2.13 African honey Day 5 | 1 | 57 | Mean Difference (Fixed, 95% CI) | ‐2.62 [‐5.04, ‐0.20] |
| 2.14 Placebo Day 5 | 1 | 45 | Mean Difference (Fixed, 95% CI) | ‐1.96 [‐3.74, ‐0.18] |
| 3 Bothersome cough (mean reduction in bothersome cough) Show forest plot | 3 | Mean Difference (Fixed, 95% CI) | Subtotals only | |
| 3.1 Honey | 3 | 317 | Mean Difference (Fixed, 95% CI) | ‐2.22 [‐3.24, ‐1.21] |
| 3.2 Dextromethorphan | 1 | 34 | Mean Difference (Fixed, 95% CI) | ‐1.94 [‐3.05, ‐0.83] |
| 3.3 Salbutamol Day 1 | 1 | 43 | Mean Difference (Fixed, 95% CI) | ‐1.0 [‐4.28, 2.28] |
| 3.4 No treatment | 1 | 39 | Mean Difference (Fixed, 95% CI) | ‐1.30 [‐2.07, ‐0.53] |
| 3.5 Placebo | 2 | 120 | Mean Difference (Fixed, 95% CI) | ‐1.08 [‐2.06, ‐0.10] |
| 3.6 Buckwheat honey | 1 | 35 | Mean Difference (Fixed, 95% CI) | ‐2.23 [‐3.50, ‐0.96] |
| 3.7 Eucalyptus honey | 1 | 75 | Mean Difference (Fixed, 95% CI) | ‐2.0 [‐3.82, ‐0.18] |
| 3.8 Labiatae honey | 1 | 75 | Mean Difference (Fixed, 95% CI) | ‐2.07 [‐4.03, ‐0.11] |
| 3.9 Citrus honey | 1 | 75 | Mean Difference (Fixed, 95% CI) | ‐2.16 [‐4.20, ‐0.12] |
| 3.10 Salbutamol Day 5 | 1 | 43 | Mean Difference (Fixed, 95% CI) | ‐2.47 [‐4.73, ‐0.21] |
| 3.11 African honey Day 5 | 1 | 57 | Mean Difference (Fixed, 95% CI) | ‐2.74 [‐5.27, ‐0.21] |
| 3.12 Placebo Day 5 | 1 | 45 | Mean Difference (Fixed, 95% CI) | ‐1.85 [‐3.56, ‐0.14] |
| 4 Children's sleep (mean reduction in cough impact on sleep score) Show forest plot | 4 | Mean Difference (Random, 95% CI) | Subtotals only | |
| 4.1 Honey | 4 | 357 | Mean Difference (Random, 95% CI) | ‐2.23 [‐2.87, ‐1.59] |
| 4.2 Dextromethorphan | 2 | 74 | Mean Difference (Random, 95% CI) | ‐1.75 [‐2.46, ‐1.04] |
| 4.3 Diphenhydramine | 1 | 40 | Mean Difference (Random, 95% CI) | ‐1.64 [‐2.58, ‐0.70] |
| 4.4 No treatment | 2 | 79 | Mean Difference (Random, 95% CI) | ‐1.28 [‐1.81, ‐0.76] |
| 4.5 Placebo | 2 | 120 | Mean Difference (Random, 95% CI) | ‐1.03 [‐2.05, 0.00] |
| 4.6 Salbutamol Day 5 | 1 | 43 | Mean Difference (Random, 95% CI) | ‐2.47 [‐3.84, ‐1.10] |
| 4.7 African honey Day 5 | 1 | 57 | Mean Difference (Random, 95% CI) | ‐2.32 [‐3.63, ‐1.01] |
| 4.8 Placebo Day 5 | 1 | 45 | Mean Difference (Random, 95% CI) | ‐1.68 [‐2.63, ‐0.73] |
| 5 Parents' sleep (mean reduction in cough impact on sleep score) Show forest plot | 4 | Mean Difference (Fixed, 95% CI) | Subtotals only | |
| 5.1 Honey | 4 | 357 | Mean Difference (Fixed, 95% CI) | ‐2.25 [‐2.89, ‐1.61] |
| 5.2 Dextromethorphan | 2 | 74 | Mean Difference (Fixed, 95% CI) | ‐1.97 [‐2.77, ‐1.17] |
| 5.3 Diphenhydramine | 1 | 40 | Mean Difference (Fixed, 95% CI) | ‐1.89 [‐2.97, ‐0.81] |
| 5.4 No treatment | 2 | 79 | Mean Difference (Fixed, 95% CI) | ‐1.46 [‐2.06, ‐0.87] |
| 5.5 Placebo | 2 | 120 | Mean Difference (Fixed, 95% CI) | ‐1.44 [‐2.28, ‐0.61] |
| 5.6 Salbutamol Day 5 | 1 | 43 | Mean Difference (Fixed, 95% CI) | ‐2.33 [‐3.91, ‐0.75] |
| 5.7 African honey Day 5 | 1 | 57 | Mean Difference (Fixed, 95% CI) | ‐2.29 [‐3.86, ‐0.72] |
| 5.8 Placebo Day 5 | 1 | 45 | Mean Difference (Fixed, 95% CI) | ‐1.54 [‐2.60, ‐0.48] |
| 6 Combined reduction in symptoms score Show forest plot | 3 | Mean Difference (Fixed, 95% CI) | Subtotals only | |
| 6.1 Honey | 3 | 317 | Mean Difference (Fixed, 95% CI) | ‐10.60 [‐14.43, ‐6.77] |
| 6.2 Dextromethorphan | 1 | 34 | Mean Difference (Fixed, 95% CI) | ‐8.39 [‐10.95, ‐5.84] |
| 6.3 No treatment | 1 | 39 | Mean Difference (Fixed, 95% CI) | ‐6.41 [‐8.82, ‐3.99] |
| 6.4 Placebo | 2 | 132 | Mean Difference (Fixed, 95% CI) | ‐7.11 [‐10.78, ‐3.44] |
| 6.5 Honey Day 5 | 1 | 57 | Mean Difference (Fixed, 95% CI) | ‐12.68 [‐14.06, ‐11.30] |
| 6.6 Placebo Day 5 | 1 | 45 | Mean Difference (Fixed, 95% CI) | ‐8.69 [‐14.17, ‐3.21] |
| 6.7 Salbutamol Day 5 | 1 | 43 | Mean Difference (Fixed, 95% CI) | ‐11.37 [‐17.55, ‐5.19] |
| Outcome or subgroup title | No. of studies | No. of participants | Statistical method | Effect size |
| 1 Honey versus dextromethorphan Show forest plot | 2 | Risk Ratio (M‐H, Fixed, 95% CI) | Subtotals only | |
| 1.1 Nervousness, insomnia, hyperactivity | 2 | 149 | Risk Ratio (M‐H, Fixed, 95% CI) | 2.94 [0.74, 11.71] |
| 1.2 Stomachache, nausea, and vomiting | 1 | 69 | Risk Ratio (M‐H, Fixed, 95% CI) | 4.86 [0.24, 97.69] |
| 1.3 Drowsiness | 1 | 69 | Risk Ratio (M‐H, Fixed, 95% CI) | 2.92 [0.12, 69.20] |
| 2 Honey versus diphenhydramine Show forest plot | 1 | 80 | Risk Ratio (M‐H, Fixed, 95% CI) | 0.14 [0.01, 2.68] |
| 2.1 Somnolence | 1 | 80 | Risk Ratio (M‐H, Fixed, 95% CI) | 0.14 [0.01, 2.68] |
| 3 Honey versus placebo Show forest plot | 2 | Risk Ratio (M‐H, Fixed, 95% CI) | Subtotals only | |
| 3.1 Stomachache, nausea, and vomiting | 2 | 402 | Risk Ratio (M‐H, Fixed, 95% CI) | 1.91 [1.12, 3.24] |
| 3.2 Diarrhoea | 1 | 102 | Risk Ratio (M‐H, Fixed, 95% CI) | 0.92 [0.33, 2.55] |
| 3.3 Tachycardia | 1 | 102 | Risk Ratio (M‐H, Fixed, 95% CI) | 1.58 [0.15, 16.86] |
| 4 Honey versus salbutamol Show forest plot | 1 | Risk Ratio (M‐H, Random, 95% CI) | Subtotals only | |
| 4.1 Stomachache, nausea, and vomiting | 1 | 100 | Risk Ratio (M‐H, Random, 95% CI) | 1.74 [1.04, 2.92] |
| 4.2 Rash | 1 | 100 | Risk Ratio (M‐H, Random, 95% CI) | 0.19 [0.02, 1.63] |
| 4.3 Tachycardia | 1 | 100 | Risk Ratio (M‐H, Random, 95% CI) | 1.51 [0.14, 16.10] |
| 4.4 Diarrhoea | 1 | 100 | Risk Ratio (M‐H, Random, 95% CI) | 0.59 [0.24, 1.45] |
| 5 Honey versus no treatment Show forest plot | 2 | 302 | Odds Ratio (M‐H, Fixed, 95% CI) | 6.99 [1.55, 31.58] |
| 5.1 Nervousness, insomnia, hyperactivity | 2 | 154 | Odds Ratio (M‐H, Fixed, 95% CI) | 9.40 [1.16, 76.20] |
| 5.2 Stomachache, nausea, and vomiting | 1 | 74 | Odds Ratio (M‐H, Fixed, 95% CI) | 5.90 [0.27, 127.14] |
| 5.3 Drowsiness | 1 | 74 | Odds Ratio (M‐H, Fixed, 95% CI) | 3.43 [0.14, 87.09] |