使用蜂蜜治療小兒急性咳嗽
Abstract
Background
Cough causes concern for parents and is a major cause of outpatient visits. Cough can impact quality of life, cause anxiety, and affect sleep in children and their parents. Honey has been used to alleviate cough symptoms. This is an update of reviews previously published in 2014, 2012, and 2010.
Objectives
To evaluate the effectiveness of honey for acute cough in children in ambulatory settings.
Search methods
We searched CENTRAL (2018, Issue 2), which includes the Cochrane Acute Respiratory Infections Group's Specialised Register, MEDLINE (2014 to 8 February 2018), Embase (2014 to 8 February 2018), CINAHL (2014 to 8 February 2018), EBSCO (2014 to 8 February 2018), Web of Science (2014 to 8 February 2018), and LILACS (2014 to 8 February 2018). We also searched ClinicalTrials.gov and the World Health Organization International Clinical Trial Registry Platform (WHO ICTRP) on 12 February 2018. The 2014 review included searches of AMED and CAB Abstracts, but these were not searched for this update due to lack of institutional access.
Selection criteria
Randomised controlled trials comparing honey alone, or in combination with antibiotics, versus no treatment, placebo, honey‐based cough syrup, or other over‐the‐counter cough medications for children aged 12 months to 18 years for acute cough in ambulatory settings.
Data collection and analysis
We used standard methodological procedures expected by Cochrane.
Main results
We included six randomised controlled trials involving 899 children; we added three studies (331 children) in this update.
We assessed two studies as at high risk of performance and detection bias; three studies as at unclear risk of attrition bias; and three studies as at unclear risk of other bias.
Studies compared honey with dextromethorphan, diphenhydramine, salbutamol, bromelin (an enzyme from the Bromeliaceae (pineapple) family), no treatment, and placebo. Five studies used 7‐point Likert scales to measure symptomatic relief of cough; one used an unclear 5‐point scale. In all studies, low score indicated better cough symptom relief.
Using a 7‐point Likert scale, honey probably reduces cough frequency better than no treatment or placebo (no treatment: mean difference (MD) ‐1.05, 95% confidence interval (CI) ‐1.48 to ‐0.62; I² = 0%; 2 studies; 154 children; moderate‐certainty evidence; placebo: MD ‐1.62, 95% CI ‐3.02 to ‐0.22; I² = 0%; 2 studies; 402 children; moderate‐certainty evidence). Honey may have a similar effect as dextromethorphan in reducing cough frequency (MD ‐0.07, 95% CI ‐1.07 to 0.94; I² = 87%; 2 studies; 149 children; low‐certainty evidence). Honey may be better than diphenhydramine in reducing cough frequency (MD ‐0.57, 95% CI ‐0.90 to ‐0.24; 1 study; 80 children; low‐certainty evidence).
Giving honey for up to three days is probably more effective in relieving cough symptoms compared with placebo or salbutamol. Beyond three days honey probably had no advantage over salbutamol or placebo in reducing cough severity, bothersome cough, and impact of cough on sleep for parents and children (moderate‐certainty evidence). With a 5‐point cough scale, there was probably little or no difference between the effects of honey and bromelin mixed with honey in reducing cough frequency and severity.
Adverse events included nervousness, insomnia, and hyperactivity, experienced by seven children (9.3%) treated with honey and two children (2.7%) treated with dextromethorphan (risk ratio (RR) 2.94, 95% Cl 0.74 to 11.71; I² = 0%; 2 studies; 149 children; low‐certainty evidence). Three children (7.5%) in the diphenhydramine group experienced somnolence (RR 0.14, 95% Cl 0.01 to 2.68; 1 study; 80 children; low‐certainty evidence). When honey was compared with placebo, 34 children (12%) in the honey group and 13 (11%) in the placebo group complained of gastrointestinal symptoms (RR 1.91, 95% CI 1.12 to 3.24; I² = 0%; 2 studies; 402 children; moderate‐certainty evidence). Four children who received salbutamol had rashes compared to one child in the honey group (RR 0.19, 95% CI 0.02 to 1.63; 1 study; 100 children; moderate‐certainty evidence). No adverse events were reported in the no‐treatment group.
Authors' conclusions
Honey probably relieves cough symptoms to a greater extent than no treatment, diphenhydramine, and placebo, but may make little or no difference compared to dextromethorphan. Honey probably reduces cough duration better than placebo and salbutamol. There was no strong evidence for or against using honey. Most of the children received treatment for one night, which is a limitation to the results of this review. There was no difference in occurrence of adverse events between the honey and control arms.
PICO
Plain language summary
使用蜂蜜治療小兒急性咳嗽
文獻回顧所探討的問題
蜂蜜能減少兒童因細菌與病毒所引起的咳嗽症狀嗎?
背景
咳嗽不僅會引起家長的擔憂,同時也是門診病人就診的主因。一般認為蜂蜜可防止病菌生長並減少發炎。
搜尋日期
我們搜尋了資料庫裡到2018年2月8日為止的資料,以及到2018年2月12日為止的相關試驗。
研究特點
我們的研究包含了6項小型試驗,涉及899名12個月至18歲大的兒童。試驗地點分別位於伊朗、以色列、美國、巴西及肯亞等地。本次更新包括3項於2007年至2016年期間進行的新試驗,試驗對象包含331名兒童。
研究資金來源
其中有2項研究得到製藥廠商資助、1項由大學研究中心資助、1項由以色列蜂蜜委員會及非政府機構資助,還有1項由美國國家蜂蜜委員會資助。有1項研究沒有報告資金來源。
主要結果
我們比較了各種治療方式間之異同,包括使用蜂蜜、非處方的咳嗽藥、bromelin(鳳梨酵素) 混合蜂蜜、假治療 (安慰劑)以及無治療。
治療進行三天後,蜂蜜有可能比安慰劑及salbutamol (擴張肺氣道的藥物)更能減少咳嗽症狀。比起無治療,蜂蜜也許能更有效地緩解咳嗽,並減少咳嗽對兒童夜間睡眠造成的影響。
對於治療咳嗽症狀,使用蜂蜜的效果與dextromethorphan(非處方藥裡的止咳成分)並無太大差別,再比較使用蜂蜜及bromelin混合蜂蜜,兩者的治療效果差異也不大。蜂蜜有可能比diphenhydramine (一種抗組織胺劑)更能緩解並減少兒童咳嗽。
試驗中,有7名使用蜂蜜及另外2名使用dextromethorphan治療的兒童,其父母回報他們的孩子產生了像是較難入睡、躁動不安或過度興奮等副作用,3名使用diphenhydramine治療的兒童,其父母回報孩子經常處於昏昏欲睡的狀態。另有9名使用salbutamol、7名使用蜂蜜、以及6名使用安慰劑的兒童,其父母回報孩子有腹瀉情形。4名使用salbutamol及1名使用蜂蜜的兒童,其父母回報孩子身體起皮疹。
我們沒有發現任何證據顯示使用蜂蜜可以或無法減輕兒童咳嗽症狀。因為12個月齡以下的嬰兒抵抗細菌的免疫能力可能較差,而可能導致癱瘓,因此不建議讓他們使用蜂蜜。大部分兒童只吃了一個晚上的蜂蜜,此為本研究之研究限制。
證據品質
總體而言,證據品質為低至中等。其中有些研究並沒有對受試者進行盲測。
Authors' conclusions
Summary of findings
| Honey compared to dextromethorphan for acute cough in children | ||||||
| Patient or population: acute cough in children | ||||||
| Outcomes | Anticipated absolute effects* (95% CI) | Relative effect | № of participants | Certainty of the evidence | Comments | |
| Risk with dextromethorphan | Risk with honey | |||||
| Duration of cough | ‐ | ‐ | ‐ | ‐ | ‐ | Not assessed |
| Frequency of cough1 | The mean frequency of cough (reduction in frequency of cough score) was ‐1.54. | MD 0.07 score lower | ‐ | 149 | ⊕⊕⊝⊝ | Follow‐up: mean 1 day |
| Severity of cough1 | The mean severity of cough (reduction in severity of cough score) was ‐1.52. | MD 0.13 score lower | ‐ | 149 | ⊕⊕⊝⊝ | Follow‐up: mean 1 day |
| Bothersome cough1 | The mean bothersome cough (reduction in bothersome nature of cough score) was ‐1.94. | MD 0.29 score higher | ‐ | 69 | ⊕⊕⊕⊝ | Follow‐up: mean 1 day |
| Cough impact on children's sleep1 | The mean cough impact on children's sleep (cough impact on children' sleep score) was ‐1.75. | MD 0.03 score higher | ‐ | 149 | ⊕⊕⊝⊝ | Follow‐up: mean 6 days |
| Cough impact on parents' sleep1 | The mean cough impact on parents' sleep (cough impact on parents' sleep score) was ‐1.97. | MD 0.16 score lower | ‐ | 149 | ⊕⊕⊝⊝ | Follow‐up: mean 1 day |
| Adverse events | Population | |||||
| Nervousness, insomnia, hyperactivity | 3 per 100 | 8 per 100 (2 to 32) | RR 2.94 | 149 | ⊕⊕⊝⊝ | Follow‐up: mean 1 day |
| Stomachache, nausea, and vomiting | 1 per 100 | 7 per 100 (0 to 100) | RR 4.86 | 69 | ⊕⊕⊝⊝ | |
| Drowsiness | 1 per 100 | 4 per 100 | RR 2.92 | 69 | ⊕⊕⊝⊝ | |
| *The risk in the intervention group (and its 95% confidence interval) is based on the assumed risk in the comparison group and the relative effect of the intervention (and its 95% CI). | ||||||
| GRADE Working Group grades of evidence | ||||||
| 1Assessed on a 7‐point Likert scale from 0 to 6; lower score is better. | ||||||
| Honey compared to diphenhydramine for acute cough in children | ||||||
| Patient or population: acute cough in children | ||||||
| Outcomes | Anticipated absolute effects* (95% CI) | Relative effect | № of participants | Certainty of the evidence | Comments | |
| Risk with diphenhydramine | Risk with honey | |||||
| Cough duration | ‐ | ‐ | ‐ | ‐ | ‐ | Not assessed |
| Frequency of cough1 | The mean frequency of cough (reduction in cough frequency score) was ‐1.73. | MD 0.57 lower | ‐ | 80 | ⊕⊕⊝⊝ | Follow‐up: mean 1 day |
| Severity of cough1 | The mean severity of cough (reduction in cough severity score) was ‐1.83. | MD 0.6 lower | ‐ | 80 | ⊕⊕⊝⊝ | Follow‐up: mean 1 day |
| Cough impact on children's sleep1 | The mean cough impact on children's sleep (cough impact on children' sleep score) was ‐1.64. | MD 0.55 score lower | ‐ | 80 | ⊕⊕⊝⊝ | Follow‐up: mean 6 days |
| Cough impact on parents' sleep1 | The mean cough impact on parents' sleep (cough impact on parents' sleep score) was ‐1.89. | MD 0.48 lower | ‐ | 80 | ⊕⊕⊝⊝ | Follow‐up: mean 1 day |
| Adverse event: Somnolence | Population | 1 per 100 | RR 0.14 | 80 | ⊕⊕⊝⊝ | Follow‐up: mean 1 day |
| 8 per 100 | ||||||
| *The risk in the intervention group (and its 95% confidence interval) is based on the assumed risk in the comparison group and the relative effect of the intervention (and its 95% CI). | ||||||
| GRADE Working Group grades of evidence | ||||||
| 1Assessed on a 7‐point Likert scale from 0 to 6; lower score is better. | ||||||
| Honey compared to no treatment for acute cough in children | ||||||
| Patient or population: acute cough in children | ||||||
| Outcomes | Anticipated absolute effects* (95% CI) | Relative effect | № of participants | Certainty of the evidence | Comments | |
| Risk with no treatment | Risk with honey | |||||
| Cough duration | ‐ | ‐ | ‐ | ‐ | ‐ | Not assessed |
| Frequency of cough1 | The mean frequency of cough (reduction in cough frequency score) was ‐0.98. | MD 1.05 lower | ‐ | 154 | ⊕⊕⊕⊝ | Follow‐up: mean 1 day |
| Severity of cough1 assessed with: 7‐point Likert scale | The mean severity of cough (reduction in severity of cough score) was ‐1.13. | MD 1.03 score lower | ‐ | 154 | ⊕⊕⊕⊝ | Follow‐up: mean 1 day |
| Bothersome cough1 | The mean bothersome cough (reduction in bothersome nature of cough score) was ‐1.30. | MD 0.93 score lower | ‐ | 74 | ⊕⊕⊝⊝ | Follow‐up: mean 1 day |
| Cough impact on children's sleep1 | The mean cough impact on children's sleep (cough impact on children' sleep score) was ‐1.28. | MD 1.04 score lower | ‐ | 154 | ⊕⊕⊕⊝ | Follow‐up: mean 6 days |
| Cough impact on parents' sleep1 assessed with: 7‐point Likert scale | The mean cough impact on parents' sleep (cough impact on parents' sleep score) was ‐1.46. | MD 0.88 score lower | ‐ | 154 | ⊕⊕⊕⊝ | Follow‐up: mean 1 day |
| Adverse events | Population | |||||
| Nervousness, insomnia, hyperactivity | 1 per 100 | 6 per 100 | RR 9.40 (1.16 to 76.20) | 154 | ⊕⊕⊝⊝ | Follow‐up: mean 1 day |
| Stomachache, nausea, and vomiting | 1 per 100 | 7 per 100 | RR 5.90 (0.27 to 127.14) | 74 | ⊕⊕⊝⊝ | |
| Drowsiness | 1 per 100 | 4 per 100 | RR 3.43 (0.14 to 87.09) | 74 | ⊕⊕⊝⊝ | |
| *The risk in the intervention group (and its 95% confidence interval) is based on the assumed risk in the comparison group and the relative effect of the intervention (and its 95% CI). | ||||||
| GRADE Working Group grades of evidence | ||||||
| 1Assessed on a 7‐point Likert scale from 0 to 6; lower score is better. | ||||||
| Honey compared to placebo for acute cough in children | ||||||
| Patient or population: acute cough in children | ||||||
| Outcomes | Anticipated absolute effects* (95% CI) | Relative effect | № of participants | Certainty of the evidence | Comments | |
| Risk with placebo | Risk with honey | |||||
| Day 1 | ||||||
| Frequency of cough1 | The mean frequency of cough (reduction in cough frequency score) was ‐0.99. | MD 1.62 score lower | ‐ | 402 | ⊕⊕⊕⊝ | Follow‐up: mean 1 day |
| Severity of cough1 | The mean severity of cough (reduction in severity of cough score) was ‐0.80. | MD 1.07 score lower | ‐ | 402 | ⊕⊕⊕⊝ | |
| Bothersome cough (mean improvement score)1 | The mean bothersome cough (reduction in bothersome nature of cough) was ‐1.08. | MD 1.4 score lower | ‐ | 402 | ⊕⊕⊕⊝ | |
| Cough impact on children's sleep1 | The mean cough impact on children's sleep (cough impact on children' sleep score) was ‐1.03. | MD 1.21 score lower | ‐ | 402 | ⊕⊕⊕⊝ | Follow‐up: mean 6 days |
| Cough impact on parents' sleep1 | The mean cough impact on parents' sleep (cough impact on parents' sleep score) was ‐1.44. | MD 1.29 score lower | ‐ | 402 | ⊕⊕⊕⊝ | Follow‐up: mean 1 day |
| Day 3 | ||||||
| Frequency of cough1 | The mean frequency of cough (reduction in frequency of cough score) was ‐0.9. | MD 1.13 score lower | ‐ | 102 | ⊕⊕⊕⊝ | Follow‐up: mean 6 days |
| Severity of cough1 | The mean severity of cough (reduction in severity of cough score) was ‐1.08. | MD 0.85 score lower | ‐ | 102 | ⊕⊕⊕⊝ | |
| Bothersome cough1 | The mean bothersome cough (reduction in bothersome nature of cough score) was ‐0.99. | MD 1.33 score lower | ‐ | 102 | ⊕⊕⊕⊝ | |
| Cough impact on children's sleep1 | The mean cough impact on children's sleep (cough impact on children's sleep score) was ‐0.46. | MD 0.93 score lower | ‐ | 102 | ⊕⊕⊕⊝ | |
| Cough impact on parents' sleep3 | The mean cough impact on parents' sleep (cough impact on parents' sleep score) was ‐1.04. | MD 0.88 score lower | ‐ | 102 | ⊕⊕⊕⊝ | |
| Day 5 | ||||||
| Cough duration | The mean cough duration was 5.18 days. | MD 0.72 days lower | ‐ | 102 | ⊕⊕⊕⊝ | Follow‐up: mean 6 days; assessed with: 7‐point Likert scale |
| Frequency of cough1 | The mean frequency of cough (reduction in frequency of cough score) was ‐1.95. | MD 0.48 score lower | ‐ | 102 | ⊕⊕⊕⊝ | |
| Severity of cough1 | The mean severity of cough (reduction in severity of cough score) was ‐1.96. | MD 0.43 score lower | ‐ | 102 | ⊕⊕⊕⊝ | |
| Bothersome cough1 | The mean bothersome cough (reduction in bothersome nature of cough score) was ‐1.85. | MD 0.51 score lower | ‐ | 102 | ⊕⊕⊕⊝ | |
| Cough impact on children's sleep1 | The mean cough impact on children's sleep (cough impact on children' sleep score) was ‐1.68. | MD 0.55 score lower | ‐ | 102 | ⊕⊕⊕⊝ | |
| Cough impact on parents' sleep | The mean cough impact on parents' sleep (cough impact on parents' sleep score) was ‐1.54. | MD 0.57 score lower | ‐ | 102 | ⊕⊕⊕⊝ | |
| Adverse events | Population | |||||
| Stomachache, nausea, and vomiting | 11 per 100 | 21 per 100 | RR 1.91 | 402 | ⊕⊕⊕⊝ | Follow‐up: mean 6 days |
| Diarrhoea | 13 per 100 | 12 per 100 | RR 0.92 | 102 | ⊕⊕⊝⊝ | |
| Tachycardia | 2 per 100 | 4 per 100 | RR 1.58 | 102 | ⊕⊕⊝⊝ | |
| *The risk in the intervention group (and its 95% confidence interval) is based on the assumed risk in the comparison group and the relative effect of the intervention (and its 95% CI). | ||||||
| GRADE Working Group grades of evidence | ||||||
| 1Assessed on a 7‐point Likert scale from 0 to 6; lower score is better. | ||||||
| Honey compared to salbutamol for acute cough in children | ||||||
| Patient or population: acute cough in children | ||||||
| Outcomes | Anticipated absolute effects* (95% CI) | Relative effect | № of participants | Certainty of the evidence | Comments | |
| Risk with salbutamol | Risk with honey | |||||
| Day 1 | ||||||
| Frequency of cough (mean improvement score)1 | The mean frequency of cough (reduction in frequency of cough score) was ‐0.52. | MD 0.26 lower | ‐ | 100 | ⊕⊕⊕⊝ | Follow‐up: mean 6 days |
| Severity of cough (mean improvement score)1 | The mean severity of cough (reduction in severity of cough score) was ‐0.74. | MD 0.1 lower | ‐ | 100 | ⊕⊕⊕⊝ | |
| Bothersome cough (mean improvement score)1 | The mean bothersome cough (reduction in bothersome nature of cough score) was ‐1.00. | MD 0.21 lower | ‐ | 100 | ⊕⊕⊕⊝ | |
| Cough impact on children's sleep1 | The mean cough impact on children's sleep (cough impact on children' sleep score) was ‐1.24. | MD 0.09 higher | ‐ | 100 | ⊕⊕⊕⊝ | |
| Cough impact on parents' sleep1 | The mean cough impact on parents' sleep (cough impact on parents' sleep score) was ‐1.22. | MD 0.05 higher | ‐ | 100 | ⊕⊕⊕⊝ | |
| Day 3 | ||||||
| Frequency of cough1 | The mean frequency of cough (reduction in frequency of cough score) was ‐1.34. | MD 0.69 lower | ‐ | 100 | ⊕⊕⊕⊝ | Follow‐up: mean 4 days |
| Severity of cough1 | The mean severity of cough (reduction in severity of cough score) was ‐1.59. | MD 0.34 lower | ‐ | 100 | ⊕⊕⊕⊝ | |
| Bothersome cough1 | The mean bothersome cough (reduction in bothersome nature of cough score) was ‐2.08. | MD 0.24 lower | ‐ | 100 | ⊕⊕⊕⊝ | |
| Cough impact on children's sleep1 | The mean cough impact on children's sleep (cough impact on children' sleep score) was ‐2.25. | MD 0.31 higher | ‐ | 100 | ⊕⊕⊕⊝ | Follow‐up: mean 6 days |
| Cough impact on parents' sleep1 | The mean cough impact on parents' sleep (cough impact on parents' sleep score) was ‐2.13. | MD 0.21 higher | ‐ | 100 | ⊕⊕⊕⊝ | Follow‐up: mean 4 days |
| Day 5 | ||||||
| Cough duration | The mean cough duration was 5 days. | MD 0.54 days lower | ‐ | 100 | ⊕⊕⊕⊝ | Follow‐up: mean 6 days |
| Frequency of cough (mean improvement score)1 | The mean frequency of cough (reduction in frequency of cough score) was ‐2.19. | MD 0.54 lower | ‐ | 100 | ⊕⊕⊕⊝ | |
| Severity of cough (mean improvement score)1 | The mean severity of cough (reduction in severity of cough score) was ‐2.08. | MD 0.41 lower | ‐ | 100 | ⊕⊕⊕⊝ | |
| Bothersome cough (mean improvement score)1 | The mean bothersome cough (reduction in bothersome nature of cough score) was ‐2.47. | MD 0.27 lower | ‐ | 100 | ⊕⊕⊕⊝ | |
| Cough impact on children's sleep1 | The mean cough impact on children's sleep (cough impact on children's sleep score) was ‐2.47. | MD 0.15 higher | ‐ | 100 | ⊕⊕⊕⊝ | |
| Cough impact on parents' sleep1 | The mean cough impact on parents' sleep (cough impact on parents' sleep score) was ‐2.33. | MD 0.04 higher | ‐ | 100 | ⊕⊕⊕⊝ | |
| Adverse events | Population | |||||
| Stomachache, nausea, and vomiting | 30 per 100 | 53 per 100 | RR 1.74 | 100 | ⊕⊕⊕⊝ | Follow‐up: mean 6 days |
| Rash | 9 per 100 | 2 per 100 | RR 0.19 | 100 | ⊕⊕⊕⊝ | |
| Tachycardia | 2 per 100 | 4 per 100 | RR 1.51 (0.14 to 16.10) | 100 | ⊕⊕⊝⊝ | |
| Diarrhoea | 21 per 100 | 12 per 100 | RR 0.59 | 100 | ⊕⊕⊕⊝ | |
| *The risk in the intervention group (and its 95% confidence interval) is based on the assumed risk in the comparison group and the relative effect of the intervention (and its 95% CI). | ||||||
| GRADE Working Group grades of evidence | ||||||
| 1Assessed on a 7‐point Likert scale from 0 to 6; lower score is better. | ||||||
Background
Description of the condition
Cough is a normal protective mechanism (Landau 2006), and a means by which the respiratory system rids itself of excessive secretions and foreign bodies (Cuestas 2017). Cough can be caused by bacterial or viral infections, the presence of an irritant or allergen in the respiratory tract, or both (Ma 2017). Respiratory infections can be situated along the upper or lower respiratory tract, and the resulting cough can be either productive or unproductive of sputum. Unproductive cough is usually referred to as 'dry' cough. Children with dry cough tend to have minimal airway secretions (Chang 2005).
Cough can be classified as acute or chronic. Chronic cough lasts for more than three weeks (Smith 2016). Acute cough from upper respiratory tract infection (URTI) is a very common symptom seen in primary care settings or by general practitioners (Butler 2005; Derebery 2013). Most coughs from URTIs are caused by viral infections (Braman 2006; Butler 2005). Cough is cause for parental concern (Hay 2003), and a major reason for outpatient visits for both children and adults (Kigen 2015; Kusel 2007). Cough can impact on quality of life (French 2002), cause anxiety, and affect the sleep of children and their parents. For these reasons, immediate remedy for cough is often sought by parents and carers of children with cough.
Description of the intervention
Many people use over‐the‐counter (OTC) cough medications, and general practitioners in primary care settings often recommend these as first‐line treatments (Kigen 2015). Although many OTC cough preparations are available, there is no good evidence regarding their efficacy (Chang 2014; Smith 2014). In children, OTC cough medications may be associated with serious adverse events such as death, altered consciousness, and arrhythmias (CDC 2007; Gunn 2001; Kelly 2004). Study findings vary in reported relief of cough symptoms, with several studies finding no effect compared with placebo (Banderali 1995; Freestone 1997; Kurth 1978; Smith 2014).
Cough mixtures contain a variety of drugs with differing modes of action, which makes them difficult to compare (Morice 1998). Over‐the‐counter cough medications may contain dextromethorphan hydrobromide, phenylephrine hydrochloride, chlorpheniramine maleate, and methylparaben (El‐Gindy 2005).
Honey is a sweet, viscous liquid with a complex chemical composition of approximately 25 carbohydrates (Sanz 2004), free amino acids (Hermosin 2003; Suárez‐Luque 2002), vitamins and trace elements (Golob 2005; Hernández 2005; Nanda 2003; Tuzen 2007; Yao 2003). Honey also contains compounds that function as antioxidants such as flavonoids and carotenoids, polyphenol, phenolic acids, vitamin C, and glucose oxydase enzymes (Khalil 2010; Nagai 2006).
How the intervention might work
Honey confers antibacterial (Lusby 2005; Mullai 2007), antiviral (Shahzad 2012; Watanabe 2014; Zeina 1996), antifungal (Ahmed 2013b; Irish 2006; Kuncic 2012), and anti‐inflammatory properties (Tonks 2003). Studies of the antimicrobial effect of honey show that it has broad‐spectrum antimicrobial effects on various gram‐negative and gram‐positive bacteria (Agbaje 2006; Katrina 2014). Honey is reported to be active against certain bacteria that have been isolated from the upper respiratory tract such as Staphylococcus aureus, Enterococcus faecalis,Candida albicans,Klebsiella pneumoniae,Pseudomonas aeruginosa,Escherichia coli, Salmonella spp., and Shigella dysenteriae (Adeleye 2003; Kousalya 2010; Mullai 2007). Honey has antiviral effects against Varicella zoster virus (Shahzad 2012), influenza virus (Watanabe 2014), and rubella virus (Zeina 1996). It is believed that the antibacterial activities of honey are intrinsic and not dependent on any external factors such as geographical location or its source (Katrina 2014).
Honey has been used in traditional medicine to treat cough (Adeleye 2003), and in modern medicine to treat infected wounds (Lusby 2005; Molan 2006); it is also an ingredient in some cough syrups (Zeina 1996). However, the use of honey in infants aged under 12 months is restricted because of babies' poor immunity against Clostridium botulinum, a possible contaminant in honey (Küplülü 2006; Nevas 2002).
Why it is important to do this review
Identification of ineffective preparations for cough could reduce costs for consumers and healthcare providers (Smith 2014). Cochrane Reviews have assessed the effectiveness of OTC cough medications (Chang 2014; Smith 2014), but none have studied honey for cough relief.
If effective, honey may save significant annual expenditure on OTC cough medications (Dicpinigaitis 2011). Previous versions of this review were inconclusive about the effectiveness of using honey to treat acute cough in children (Oduwole 2010; Oduwole 2012; Oduwole 2014a). The aim of this review was to examine the comparative effectiveness of honey to relieve acute cough in children.
Objectives
To evaluate the effectiveness of honey for acute cough in children in ambulatory settings.
Methods
Criteria for considering studies for this review
Types of studies
Randomised controlled trials (RCTs).
Types of participants
We included children aged 12 months to 18 years with cough caused by acute viral or bacterial URTI. We excluded studies that included participants with chronic cough (lasting for more than three weeks). We also excluded studies with sample sizes of fewer than 10 per intervention.
Types of interventions
Studies that compared:
-
honey only versus:
-
honey‐based cough syrup;
-
non‐honey cough syrup;
-
placebo; and
-
no treatment;
-
-
honey plus antibiotics versus antibiotics alone; and
-
honey plus antibiotics versus non‐honey cough syrups plus antibiotics
were eligible for inclusion.
Types of outcome measures
Primary outcomes
-
Duration of cough.
-
Symptomatic relief of cough (frequency of cough, reduction in severity, and less bothersome cough).
Secondary outcomes
-
Improvement in quality of sleep at night for children (cough impact on sleep score).
-
Improvement in quality of sleep at night for caregiver (cough impact on sleep score).
-
Improvement in quality of life (e.g. school attendance and playing).
-
Adverse effects.
-
Improvement in appetite.
-
Cost of honey alone compared with other cough syrups.
Search methods for identification of studies
Electronic searches
For this update we searched the Cochrane Central Register of Controlled Trials (CENTRAL; 2018, Issue 2), part of the Cochrane Library (searched 8 February 2018), which includes the Cochrane Acute Respiratory Infections Group's Specialised Register, MEDLINE (Ovid) (October 2014 to 8 February 2018), Embase (Elsevier) (October 2014 to 8 February 2018), CINAHL (Cumulative Index to Nursing and Allied Health Literature) (EBSCO) (October 2014 to 8 February 2018), Web of Science (Clarivate Analytics) (October 2014 to 8 February 2018), and LILACS (Latin American and Caribbean Health Sciences Literature) (BIREME) (October 2014 to 8 February 2018). The 2014 version of this review included searches of AMED (Appendix 1) and CAB Abstracts (Appendix 2), but these were not searched for this update due to lack of institutional access to those databases. Details of previous searches are in Appendix 3.
We used the search strategy in Appendix 4 to search MEDLINE and CENTRAL, and modified terms to search Embase (Appendix 5), CINAHL (Appendix 6), Web of Science (Appendix 7), and LILACS (Appendix 8). We did not combine the MEDLINE search string with the Cochrane Highly Sensitive Search Strategies for identifying randomised trials in MEDLINE (Lefebvre 2011), because we found very few results. We imposed no language or publication restrictions.
Searching other resources
We searched the World Health Organization International Clinical Trials Registry Platform (WHO ICTRP) (apps.who.int/trialsearch/) and ClinicalTrials.gov (www.clinicaltrials.gov) on 12 February 2018. We checked the reference lists of all relevant articles obtained from our search and those from previously published systematic reviews to identify additional articles. We also contacted the authors of studies added for this update for information and unpublished data (Ahmadi 2013; Paul 2007; Waris 2014).
Data collection and analysis
Selection of studies
Two review authors (OO, EU) independently screened search results using Covidence for eligible studies based on a priori inclusion criteria (Covidence). Any disagreements were resolved by consensus.
Data extraction and management
One review author (OO) independently extracted and entered data into Review Manager 5 (Review Manager 2014). Ahmadi 2013 was translated from Farsi to English for assessment. Another review author (EU) checked data extraction for accuracy and completeness. Any disagreements were resolved by consensus.
Assessment of risk of bias in included studies
Two review authors (OO, EU) assessed risk of bias of the included trials using Cochrane's 'Risk of bias' tool. We assessed random sequence generation, allocation concealment, blinding, selective reporting, and other sources of bias, and recorded the assessment in the 'Risk of bias' tables. We ranked the studies as low, unclear, or high risk of bias, as recommended in the Cochrane Handbook for Systematic Reviews of Interventions (Higgins 2011).
Measures of treatment effect
We used one‐way analysis of variance (ANOVA) to compare treatment effects for cough duration, cough symptoms, and quality of sleep. We presented estimates of effects as mean differences (MD) derived from parents' subjective assessment of cough symptoms and cough impact on sleep quality using validated questions on a 7‐point Likert scale (Likert 1932).
We used the mean and standard deviation (SD) to analyse pair‐wise comparisons of treatment effect between honey and placebo and honey and salbutamol on cough duration. We also analysed pair‐wise comparisons of other outcomes using generic inverse variance in Review Manager 5 (Review Manager 2014). We estimated MD between children's Likert scores at baseline and postintervention for frequency of cough, bothersome cough, and cough impact on quality of sleep for child and parent. We used the MD and standard error (SE) for the pair‐wise comparison of treatment effect between honey and dextromethorphan, honey and diphenhydramine, honey and no treatment, honey and placebo, honey and salbutamol, and honey and bromelin. We used the Mantel‐Haenszel method to analyse the risk ratio (RR) for adverse events in Review Manager 5 (Review Manager 2014). We presented results for other measures of effects not presented as MD in Table 1.
| Study ID | Cough | Honey (N = 29) | Bromelin (N = 31) | P value | Certainty of the evidence |
| Frequency of cough1 | |||||
| Before, median (P25 to P75) After, median (P25 to P75) Mean ± SD | 3 (2 to 4) 1 (1 to 1) 1.76 ± 0.87 | 3 (2 to 3) 1 (1 to 1) 1.71 ± 0.78 | 0.832 0.943 | ⊕⊕⊕⊝ | |
| Severity of cough1 | |||||
| Mean ± SD assessed with: unvalidated 5‐point cough scale from 0 to 4 | ‐0.86 ± 0.45 | ‐0.97 ± 0.62 | 0.322 0.223 | ⊕⊕⊕⊝ | |
| Honey (N = 63) | Diphenhydramine (N = 63) | ||||
| Proportion of children with reduction in frequency and severity of daytime cough5 | 84.1% (N = 53) | 58.7% (N = 37) | "< 0.02" | ⊕⊕⊕⊝ | |
| Proportion of children with reduction in frequency and severity of nighttime cough5 | 79.4% (N = 50) | 58.7% (N = 37) | "< 0.02" | ⊕⊕⊕⊝ | |
SD: standard deviation
P: percentile
1Assessed on an unvalidated 5‐point cough scale from 0 to 4; lower score is better.
2Student's t test.
3Chi².
4Downgraded by one level for risk of bias and imprecision.
5Assessed on a 7‐point Likert scale from 0 to 6; lower score is better.
Unit of analysis issues
There were no unit of analysis issues.
Dealing with missing data
We contacted the lead author of Paul 2007 and obtained the SE of the mean. We used PEPI version 3, Abramson 1999, to calculate the SE of the mean for Shadkam 2010 and Microsoft 2007 for both Cohen 2012 and Waris 2014. We also contacted the authors of Waris 2014 and Peixoto 2016 to request unpublished data. Ahmadi 2013 was translated from Farsi to English.
We performed an intention‐to‐treat analysis by including all randomised children in the analysis according to methods provided in the Cochrane Handbook for Systematic Reviews of Interventions (Higgins 2011). We assumed that all missing participants did not improve.
Assessment of heterogeneity
We considered heterogeneity statistically significant when the I² statistic was ≥ 50%. We used the random‐effects model for meta‐analysis when the I² statistic was > 50%.
Assessment of reporting biases
We could not test for asymmetry using a funnel plot because we included fewer than 10 studies.
Data synthesis
We used the fixed‐effect model to combine data from four included studies (Cohen 2012; Paul 2007; Shadkam 2010; Waris 2014). We used the mean and SE to analyse pair‐wise comparisons of treatment effect between honey and placebo and honey and salbutamol on cough duration.
We used Review Manager 5 to perform an inverse‐variance meta‐analysis using a fixed‐effect model for differences in mean between pre‐ and postintervention (Review Manager 2014). We conducted pair‐wise comparisons of postintervention scores between honey and dextromethorphan, honey and diphenhydramine, honey and no treatment, honey and placebo, and honey and salbutamol. We used a random‐effects model in the presence of heterogeneity.
We extracted the estimates of effects (MD) and SE of the mean for each outcome and calculated 95% confidence intervals (CIs) of the MDs using generic inverse variance. We used the Mantel‐Haenszel method to analyse the RR for adverse events.
We combined the mean score of the three honey groups (eucalyptus, citrus, or Labiatae) and compared these to the placebo group in Cohen 2012.
Peixoto 2016 treated honey as a placebo and compared it to bromelin (a pineapple enzyme) mixed with honey. We presented the placebo arm as a honey intervention for Peixoto 2016. Because data for honey and bromelin were presented as medians, data were tabulated for presentation (Table 1).
We could not include Ahmadi 2013 in the meta‐analyses because the results were reported as a proportion of children with reduced cough score. We presented the results in Table 1.
GRADE and 'Summary of findings' table
We created 'Summary of findings' tables for the following outcomes:
-
duration of cough;
-
symptomatic relief of cough (frequency of cough, reduction in severity, and less bothersome cough);
-
improvement in quality of sleep at night for children (cough impact on sleep score);
-
improvement in quality of sleep at night for caregivers (cough impact on sleep score); and
-
adverse effects.
We used the five GRADE considerations (study limitations, consistency of effect, imprecision, indirectness, and publication bias) to assess the quality of a body of evidence as it relates to the studies that contribute data to the meta‐analyses for the prespecified outcomes (Atkins 2004). We used methods and recommendations described in Section 8.5 and Chapter 12 of the Cochrane Handbook for Systematic Reviews of Interventions (Higgins 2011), employing GRADEpro GDT software (GRADEpro GDT 2015). We justified all decisions to downgrade the quality of studies in footnotes, and made comments to aid readers' understanding of the review where necessary.
Subgroup analysis and investigation of heterogeneity
Data were available from six small studies, and investigation of sources of heterogeneity was not feasible. We used a random‐effects model to investigate possible sources of heterogeneity. We performed subgroup analyses for different types of honey.
Sensitivity analysis
We did not perform a sensitivity analysis because we included only five trials in the meta‐analyses.
Results
Description of studies
Results of the search
Our updated 2018 search yielded 321 records. After removal of duplicates, we screened 299 records by title and abstract, and excluded 290 records. We assessed nine full‐text records and excluded three studies that did not meet our inclusion criteria. This update included three additional studies (Ahmadi 2013; Peixoto 2016; Waris 2014), bringing the total number of included studies to six. We included two studies in the qualitative analysis (Ahmadi 2013; Peixoto 2016), and four in the meta‐analyses (Cohen 2012; Paul 2007; Shadkam 2010; Waris 2014). See Figure 1.
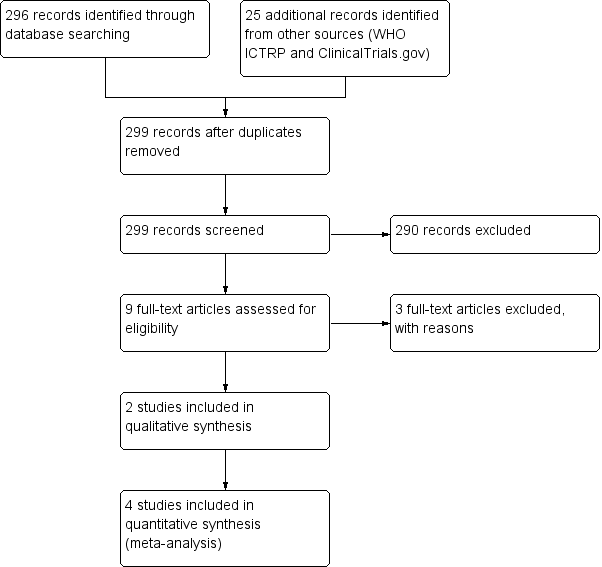
Study flow diagram (2018 update).
Included studies
We included six RCTs involving 899 children (Ahmadi 2013; Cohen 2012; Paul 2007; Peixoto 2016; Shadkam 2010; Waris 2014). Of these, three were added for this update (N = 331) (Ahmadi 2013; Peixoto 2016; Waris 2014). Ahmadi 2013 was published in Farsi and was translated for analysis. In our protocol we proposed to include children aged from 2 to 18 years. We decided to include studies with children aged 12 months to 18 years because very few clinical trials were available on honey for acute cough in children. We also think that it is best for physicians to decide whether or not to prescribe honey to children aged up to 12 months based on the available evidence.
Study populations
The age of participants ranged from 12 months to 16 years. We obtained proportions of boys and girls from available data only.
Ahmadi 2013 randomised 126 children aged from 2 to 5 years (48% boys, 52% girls) with viral URTI with cough for up to 2 days. Study duration was two years (2010 to 2012).
Cohen 2012 randomised 300 children aged 12 to 71 months (54% boys, 46% girls) with URTI who "were ill with a mean ± SD of 2.8 ± 2.0 before enrolment". Study duration was a year (January 2009 to December 2009).
Paul 2007 randomised 108 children aged 2 to 16 years (105 completed the study; 47% boys, 53% girls) with URTI "characterized by the presence of rhinorrhoea and cough for 7 or fewer days’ duration. Other symptoms may have included but were not limited to congestion, fever, sore throat, myalgias, and headache". Study duration was six months (September 2005 to March 2006).
Peixoto 2016 randomised 60 children aged 2 to 15 years (43% boys, 57% girls) "with irritative cough for at least 24 hours, which led to the need for medical consultation" and no history of chronic disease. The study start date was June 2011 and the estimated completion date was March 2012, however the actual study completion date is unclear.
Shadkam 2010 randomised 160 children aged 24 to 60 months (139 completed the study; 49% boys, 51% girls) with URTI‐induced cough. The study started in December 2008 and ended in May 2009.
Waris 2014 randomised 145 children aged 12 months to 12 years (51% boys, 49% girls) with uncomplicated acute upper respiratory infection. Waris 2014 enrolled participants from December 2010 to February 2012.
No studies enrolled children with comorbidities.
Study settings
Studies by Ahmadi 2013 and Shadkam 2010 were conducted in Iran; Cohen 2012 in Israel; Paul 2007 in the USA; Peixoto 2016 in Brazil; and Waris 2014 in Kenya.
Five were single‐centre studies (Ahmadi 2013; Paul 2007; Peixoto 2016; Shadkam 2010; Waris 2014). Cohen 2012 enrolled participants from six study centres.
All studies recruited participants from paediatric outpatient clinics.
Interventions
-
Honey mixed with distilled lukewarm water (Ahmadi 2013).
-
Three different types of honey: eucalyptus (family Myrtaceae), Labiatae (family Labiatae), or citrus (family Rutaceae) honeys (Cohen 2012).
-
Buckwheat honey (Paul 2007).
-
Honey was placebo and compared to bromelin (Ananas comosus, pineapple extract) mixed with honey (Peixoto 2016).
-
Natural honey from Kafi‐Abad (a village in Yazd, Iran) (Shadkam 2010).
-
"the darkest locally available honey" (Kenya) (Waris 2014).
Comparators
-
Ahmadi 2013 compared honey and diphenhydramine. Children received interventions three times a day, the last dose one hour before bed at night.
-
Cohen 2012 compared three types of honey to placebo ("Silan date extract was selected as the placebo because its structure, brown color, and taste are similar to that of honey" p. 466) ("Parents were instructed to administer 10 g of their child’s treatment product within 30 minutes of the child going to sleep" p. 466). Treatment could also be given with a non‐caffeinated beverage.
-
Paul 2007 compared honey to dextromethorphan and no treatment. Parents were told that their child’s treatment could be given with a non‐caffeinated beverage administered within 30 minutes of the child going to sleep.
-
Peixoto 2016 compared honey alone (labelled as placebo) to bromelin (Ananas comosus (pineapple)) mixed with honey. Two treatment regimens were administered: children up to 20 kg received 5 mL; those weighing > 20 kg received 1 mL for every 5 kg of additional weight.
-
Shadkam 2010 compared honey to dextromethorphan, diphenhydramine, and no treatment. Treatment regimens were administered before sleep.
-
Waris 2014 compared honey to salbutamol and placebo. The interventions were administered three times daily for five days.
Study funding sources
All included studies declared no conflicts of interest.
-
Source of funding for Ahmadi 2013 was not declared.
-
Cohen 2012 reported "This study was supported in part by a research grant from the Israel Ambulatory Pediatric Association, Materna Infant Nutrition Research Institute, and the Honey Board of Israel. The funders had no role in the study design, data collection or analysis, decision to publish, or preparation of the manuscript" (p. 465).
-
Peixoto 2016 was funded by Hebron Indústrias Químicas (a pharmaceutical manufacturer) (p. 416).
-
Paul 2007 reported "This work was supported by an unrestricted research grant from the National Honey Board, an industry‐funded agency of the US Department of Agriculture" (p. 1145).
-
Shadkam 2010 was "fully funded by the Department of Research Administration, Shahid Sadoughi University of Medical Sciences (SSUMS) in Yazd, Iran" (p. 791).
-
Waris 2014 indicated that "Universal Corporation Ltd prepared all study drugs and at no cost" (p. 55).
Excluded studies
We excluded three studies after assessment for this update: Cohen 2017 compared honey‐based cough syrup to non‐honey‐based cough syrup; Ayazi 2017 was a quasi‐RCT; Baker 2016 was a commentary on our review. We had previously excluded two studies, Gilbert 2008 and Warren 2007, from our 2010 review (Oduwole 2010); and two studies, Ahmed 2013a and Miceli Sopo 2014, from the 2014 update (Oduwole 2014a).
Studies awaiting classification
We had previously identified two studies that were awaiting classification (Ahmadi 2013; Peixoto 2016), which we included in this update.
Ongoing studies
We identified two ongoing studies (NCT03218696; UMIN000020651). A study identified as ongoing in 2014 was published, but was excluded because it was a quasi‐RCT (Ayazi 2017).
Risk of bias in included studies
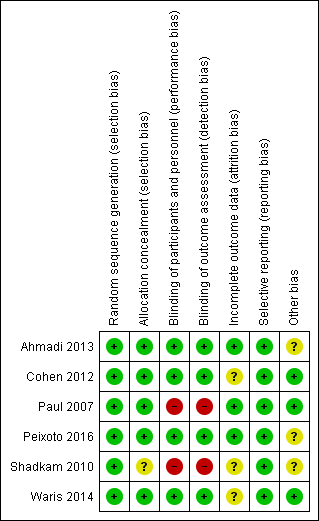
Two review authors independently assessed the methodological quality of all included studies according to the methods described in the Cochrane Handbook for Systematic Reviews of Interventions (Figure 2; Figure 3) (Higgins 2011).
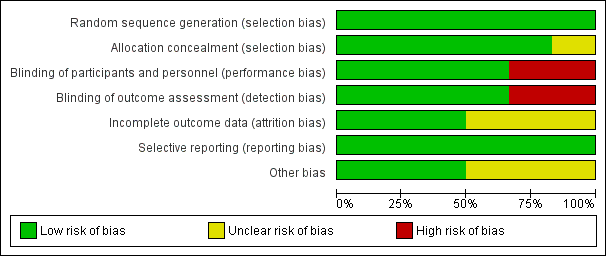
Risk of bias graph: review authors' judgements about each risk of bias item presented as percentages across all included studies.

'Risk of bias' summary: review authors' judgements about each risk of bias item for each included study.
Allocation
We rated all six included studies as at low risk of bias for sequence generation. We assessed five studies as at low risk for allocation concealment bias (Ahmadi 2013; Cohen 2012; Paul 2007; Peixoto 2016; Waris 2014). We rated Shadkam 2010 as at unclear risk of bias for this domain.
Blinding
We rated four studies as at low risk for performance and detection bias (Ahmadi 2013; Cohen 2012; Peixoto 2016; Waris 2014). We assessed two studies as at high risk of bias for this domain (Paul 2007; Shadkam 2010). There was partial blinding in Paul 2007; only the no‐treatment group was aware of receiving no intervention. We rated Paul 2007 as at high risk of bias for this domain because all outcomes were subjective: participants knowing they received no treatment could have influenced performance and assessment of the outcomes.
Incomplete outcome data
We assessed three studies as at low risk of bias of attrition bias (Ahmadi 2013; Paul 2007; Peixoto 2016). We assessed three studies as at unclear risk of attrition bias (Cohen 2012; Shadkam 2010; Waris 2014). In Cohen 2012, attrition was significantly higher in the eucalyptus honey (19%) and citrus honey (18%) groups than Labiatae honey (3%) and placebo (5%) groups. It was unclear if reasons for attrition were related to the study. Shadkam 2010 reported that children were either lost to follow‐up or were withdrawn for violating the protocol (but did not state to which group children lost to follow‐up or withdrawn belonged).
Selective reporting
We rated all studies as at low risk of bias for selective reporting; all outcomes proposed in the methods sections were reported in results. We obtained protocols of two included studies (Ahmadi 2013; Peixoto 2016); both reported all outcomes proposed.
Other potential sources of bias
We assessed two studies as at low risk of bias (Cohen 2012; Paul 2007; Waris 2014), and three studies as at unclear risk of bias for this domain (Ahmadi 2013; Peixoto 2016; Shadkam 2010). In Shadkam 2010, "Some of the questions put to mothers were answered by the paediatrician because the questions were ambiguous", which could have influenced outcome assessment. Ahmadi 2013 reported results as the proportion of children with reduced cough symptoms instead of actual mean reduction in cough scores of children as reported by other studies. In addition, the study protocol was registered retrospectively after completion of the study (Ahmadi 2013). It is unclear if the authors had planned to report results as proportion of children with reduced cough score. It is also not clear if the two outcomes (cough frequency and severity) listed in the methods section of the published paper and protocol was their original intention (Ahmadi 2013). Peixoto 2016 used an unvalidated cough scale.
Effects of interventions
See: Summary of findings for the main comparison Honey compared to dextromethorphan for acute cough in children; Summary of findings 2 Honey compared to diphenhydramine for acute cough in children; Summary of findings 3 Honey compared to no treatment for acute cough in children; Summary of findings 4 Honey compared to placebo for acute cough in children; Summary of findings 5 Honey compared to salbutamol for acute cough in children
Primary outcomes
1. Duration of cough
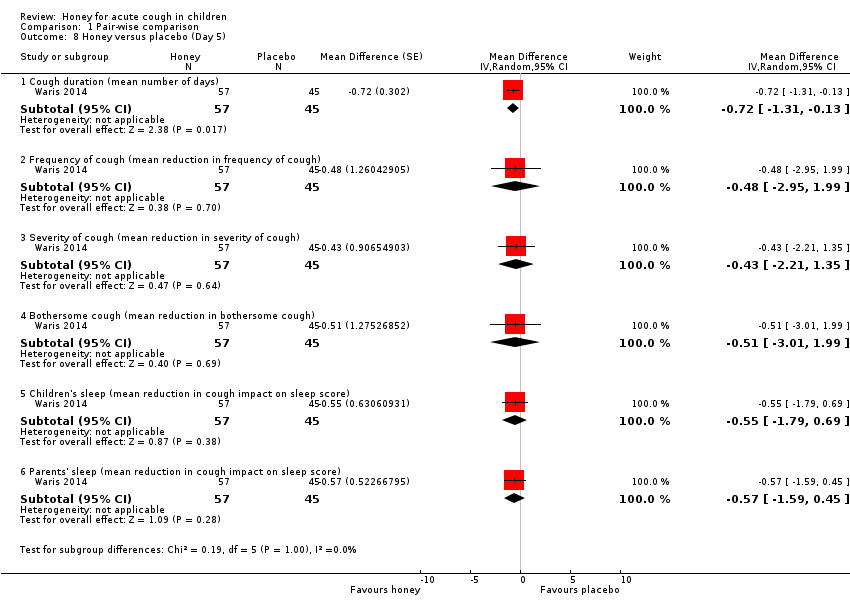
Only one study assessed duration of cough in comparison to salbutamol and placebo (Waris 2014). The effect of honey on cough duration was compared to salbutamol after five days of treatment; moderate‐certainty evidence indicated that cough was relieved sooner in children who received honey (mean difference (MD) ‐0.54, 95% confidence interval (CI) ‐0.98 to ‐0.10; 1 study, N = 100; Analysis 1.13). Compared with placebo, honey also provided faster cough relief (MD ‐0.72, 95% CI ‐1.31 to ‐0.13; 1 study, N = 102; Analysis 1.8; moderate‐certainty evidence).
2. Symptomatic relief of cough (frequency of cough, reduction in severity, and less bothersome)
2.1 Frequency of cough (pre‐ and postintervention comparison)
Four studies used a 7‐point Likert scale to report cough frequency (Ahmadi 2013; Cohen 2012; Paul 2007; Shadkam 2010; Waris 2014). Caregivers' responses to the questionnaire on cough symptoms ranged from 'extremely' (6 points) to 'not at all' (0 points) (lower score indicated better cough symptom relief). Pre‐ and postintervention comparison for each treatment arm showed that honey was more effective in reducing the frequency of cough in six studies. Four studies were meta‐analysed (moderate‐certainty evidence) (Cohen 2012; Paul 2007; Shadkam 2010; Waris 2014). Data from two studies are presented in Table 1 (moderate‐certainty evidence, one study with unclear cough scales) (Ahmadi 2013; Peixoto 2016).
When the effect of honey on cough symptoms was compared after a five‐day treatment to the night before the first dose of intervention (pre‐ and postintervention cough score) using the 7‐point Likert scale, honey reduced cough frequency to a greater extent (MD ‐2.65, 95% CI ‐4.32 to ‐0.98; 1 study, N = 57; moderate‐certainty evidence) than salbutamol (MD ‐2.19, 95% CI ‐3.55 to ‐0.83; 1 study, N = 43; moderate‐certainty evidence) and placebo (MD ‐1.95, 95% CI ‐4.42 to 0.52; 1 study, N = 45; moderate‐certainty evidence; Analysis 2.1).
When the frequency of cough on Day 1 of treatment was assessed, parents of children in the honey group rated their children's coughs to be slightly less frequent (MD ‐1.71, 95% CI ‐2.28 to ‐1.13; I² = 0%; 4 studies, N = 357; moderate‐certainty evidence) compared to children who received dextromethorphan (MD ‐1.54, 95% CI ‐2.30 to ‐0.78; 2 studies, N = 74; moderate‐certainty evidence), placebo (MD ‐0.99, 95% CI ‐1.79 to ‐0.18; I² = 0%; 2 studies, N = 120; moderate‐certainty evidence), no treatment (MD ‐0.98, 95% CI ‐1.38 to ‐0.59; I² = 17%; 2 studies, N = 79; low‐certainty evidence), and salbutamol (MD ‐0.52, 95% CI ‐6.28 to 5.24; 1 study, N = 43; moderate‐certainty evidence), but not better than diphenhydramine (MD ‐1.73, 95% CI ‐2.72 to ‐0.74; 1 study, N = 40; low‐certainty evidence; Analysis 2.1).
2.2 Reduction in severity
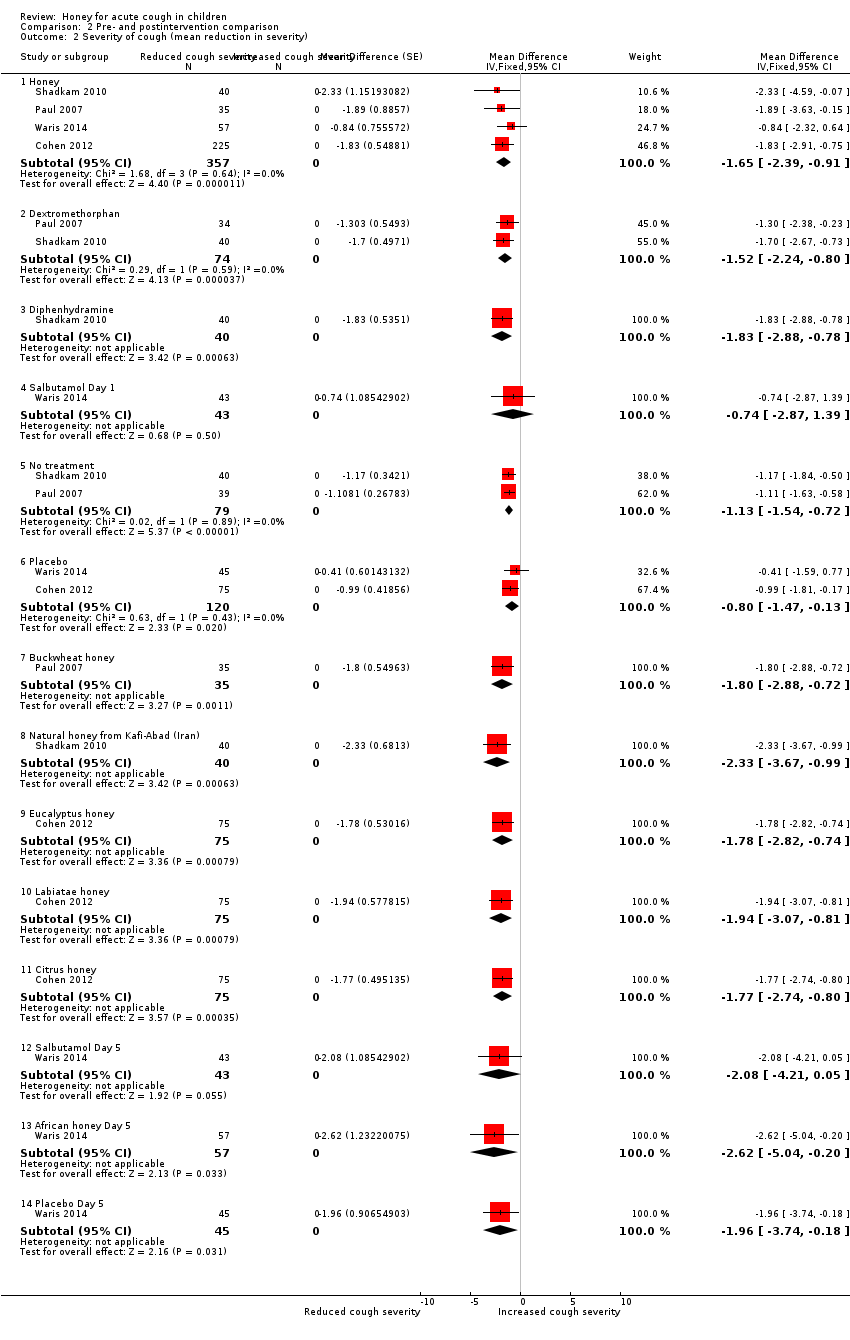
Similarly, honey reduced the severity of cough in children postintervention on a 7‐point Likert scale (MD ‐1.65, 95% CI ‐2.39 to ‐0.91; I² = 0%; 4 studies, N = 357; moderate‐certainty evidence) to a greater extent than dextromethorphan (MD ‐1.52, 95% CI ‐2.24 to ‐0.80; I² = 29%; 2 studies, N = 74; moderate‐certainty evidence), no treatment (MD ‐1.13, 95% CI ‐1.54 to ‐0.72; I² = 2%; 2 studies, N = 79; low‐certainty evidence), placebo (MD ‐0.80, 95% CI ‐1.47 to ‐0.13; I² = 0%; 2 studies, N = 120; moderate‐certainty evidence), or salbutamol (MD ‐0.74, 95% CI ‐2.87 to 1.39; 1 study, N = 43; moderate‐certainty evidence), but not diphenhydramine (MD ‐1.83, 95% CI ‐2.88 to ‐0.78; 1 study, N = 40; low‐certainty evidence; Analysis 2.2).
Honey also reduced cough severity on Day 5 (MD ‐2.62, 95% CI ‐5.04 to ‐0.20; 1 study, N = 57; moderate‐certainty evidence) better than salbutamol (MD ‐2.08, 95% CI ‐4.21 to 0.05; 1 study, N = 43; moderate‐certainty evidence) or placebo (MD ‐1.96, 95% CI ‐3.74 to ‐0.18; 1 study, N = 45; moderate‐certainty evidence; Analysis 2.2).
Peixoto 2016 expressed results as medians and showed no difference between honey and bromelin (honey + pineapple) (moderate‐certainty evidence; Table 1).
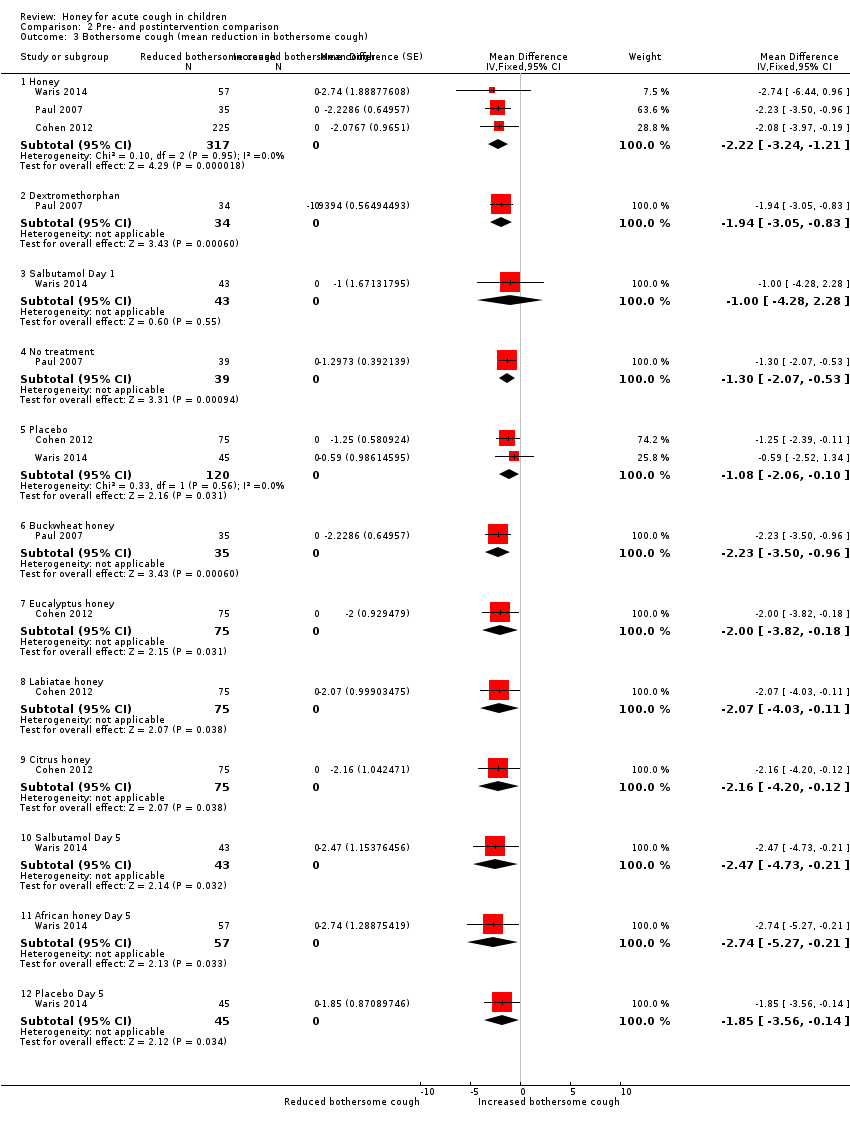
2.3 Less bothersome cough
Children's cough was less bothersome in the honey group after one day of treatment (MD ‐2.22, 95% CI ‐3.24 to ‐1.21; I² = 0%; 3 studies, N = 317; moderate‐certainty evidence) compared with the dextromethorphan (MD ‐1.94, 95% CI ‐3.05 to ‐0.83; 1 study, N = 34; moderate‐certainty evidence), no treatment (MD ‐1.30, 95% CI ‐2.07 to ‐0.53; 1 study, N = 39; low‐certainty evidence), placebo (MD ‐1.08, 95% CI ‐2.06 to ‐0.10; I² = 0%; 2 studies, N = 120; moderate‐certainty evidence), and salbutamol groups (MD ‐1.00, 95% CI ‐4.28 to 2.28; 1 study, N = 43; moderate‐certainty evidence; Analysis 2.3).
On Day 5, honey reduced bothersome cough to a greater extent (MD ‐2.74, 95% CI ‐5.27 to ‐0.21; 1 study, N = 57) than salbutamol (MD ‐2.47, 95% CI ‐4.73 to ‐0.21; 1 study, N = 43; moderate‐certainty evidence) or placebo (MD ‐1.85, 95% CI ‐3.56 to ‐0.14; 1 study, N = 45; moderate‐certainty evidence; Analysis 2.3).
Subgroup analysis comparing types of honey
Effect of different types of honey on cough symptoms
When we compared different types of honey in a subgroup analysis, dark honey from Kenya reduced cough frequency to a greater extent (MD ‐2.65, 95% CI ‐4.32 to ‐0.98; Waris 2014, N = 57; moderate‐certainty evidence) than natural honey from Iran (MD ‐2.16, 95% CI ‐3.40 to ‐0.92; Shadkam 2010, N = 40; low‐certainty evidence), citrus honey (MD ‐1.95, 95% CI ‐3.55 to ‐0.35; Cohen 2012, N = 75; moderate‐certainty evidence), buckwheat honey (MD ‐1.89, 95% CI ‐2.96 to ‐0.81; Paul 2007, N = 35; moderate‐certainty evidence), Labiatae honey (MD ‐1.82, 95% CI ‐3.30 to ‐0.34; Cohen 2012, N = 75; moderate‐certainty evidence), and eucalyptus honey (MD ‐1.77, 95% CI ‐3.22 to ‐0.32; Cohen 2012, N = 75; moderate‐certainty evidence; Analysis 2.1).
On treatment Day 1, dark honey from Kenya reduced children's cough severity to a greater extent (MD ‐2.62, 95% CI ‐5.04 to ‐0.20; 1 study, N = 57; moderate‐certainty evidence) than natural honey from Iran (MD ‐2.33, 95% CI ‐3.67 to ‐0.99; 1 study, N = 40; low‐certainty evidence), buckwheat honey (MD ‐1.80, 95% CI ‐2.88 to ‐0.72; 1 study, N = 35; moderate‐certainty evidence), Labiatae honey (MD ‐1.94, 95% CI ‐3.07 to ‐0.81; 1 study, N = 75; moderate‐certainty evidence), eucalyptus honey (MD ‐1.78, 95% CI ‐2.82 to ‐0.74; 1 study, N = 75; moderate‐certainty evidence), and citrus honey (MD ‐1.77, 95% CI ‐2.74 to ‐0.80; 1 study, N = 75; moderate‐certainty evidence; Analysis 2.2).
Dark honey from Kenya reduced bothersome cough to some extent (MD ‐2.74, 95% CI ‐5.27 to ‐0.21; 1 study, N = 57; moderate‐certainty evidence) more than buckwheat honey (MD ‐2.23, 95% CI ‐3.50 to ‐0.96; 1 study, N = 35; moderate‐certainty evidence), citrus honey (MD ‐2.16, 95% CI ‐4.20 to ‐0.12; 1 study, N = 75; moderate‐certainty evidence), Labiatae honey (MD ‐2.07, 95% CI ‐4.03 to ‐0.11; 1 study, N = 75; moderate‐certainty evidence), or eucalyptus honey (MD ‐2.00, 95% CI ‐3.82 to ‐0.18; 1 study, N = 75; moderate‐certainty evidence; Analysis 2.3).
Secondary outcomes
1. Improvement in quality of sleep at night for children (cough impact on sleep score)
Caregivers' Likert scores for cough impact on children's sleep were reduced to a greater extent in the honey group (MD ‐2.23, 95% CI ‐2.87 to ‐1.59; I² = 0%; 4 studies, N = 357; moderate‐certainty evidence) than in the dextromethorphan (MD ‐1.75, 95% CI ‐2.46 to ‐1.04; I² = 1%; 2 studies, N = 74; moderate‐certainty evidence), diphenhydramine (MD ‐1.64, 95% CI ‐2.58 to ‐0.70; 1 study, N = 40; low‐certainty evidence), no treatment (MD ‐1.28, 95% CI ‐1.81 to ‐0.76; I² = 60%; 2 studies, N = 79; moderate‐certainty evidence), or placebo groups (MD ‐1.03, 95% CI ‐2.05 to 0.00; I² = 0%; 2 studies, N = 120; moderate‐certainty evidence). After children received dark Kenyan honey, salbutamol, or placebo for five days, caregivers' Likert scores for cough impact on their children's sleep were reduced to a greater extent in the honey group (MD ‐2.32, 95% CI ‐3.63 to ‐1.01; 1 study, N = 57; moderate‐certainty evidence) than in the salbutamol (MD ‐2.47, 95% CI ‐3.84 to ‐1.10; 1 study, N = 43; moderate‐certainty evidence) and placebo groups (MD ‐1.68, 95% CI ‐2.63 to ‐0.73; 1 study, N = 45; moderate‐certainty evidence; Analysis 2.4).
2. Improvement in quality of sleep at night for caregiver (cough impact on sleep score)
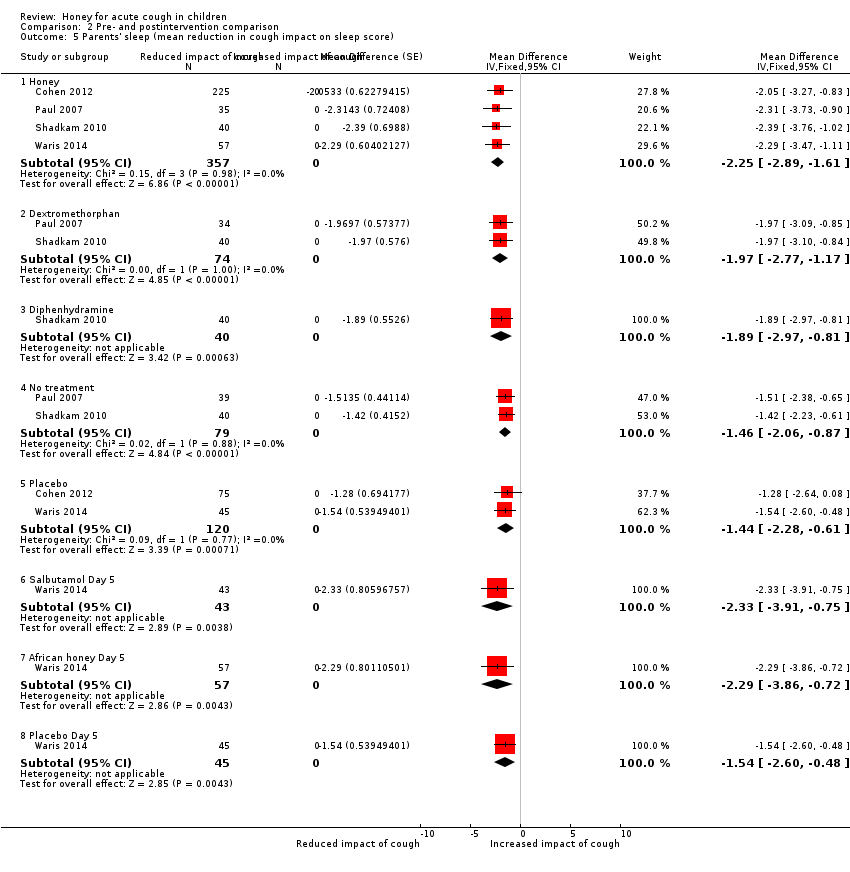
At postintervention, cough impact on parents' sleep was also improved to a greater extent by honey (measured on a 7‐point Likert scale) (MD ‐2.25, 95% CI ‐2.89 to ‐1.61; I² = 0%; 4 studies, N = 357; moderate‐certainty evidence) than by dextromethorphan (MD ‐1.97, 95% CI ‐2.77 to ‐1.17; I² = 0%; 2 studies, N = 74; moderate‐certainty evidence), diphenhydramine (MD ‐1.89, 95% CI ‐2.97 to ‐0.81; 1 study, N = 40; low‐certainty evidence), no treatment (MD ‐1.46, 95% CI ‐2.06 to ‐0.87; I² = 2%; 2 studies, N = 79; low‐certainty evidence), or placebo (MD ‐1.44, 95% CI ‐2.28 to ‐0.61; I² = 0%; 2 studies, N = 120; moderate‐certainty evidence).
On Day 5 of treatment, honey improved the quality of sleep of caregivers to a greater extent (MD ‐2.29, 95% CI ‐3.86 to ‐0.72; 1 study, N = 57; moderate‐certainty evidence) than placebo (MD ‐1.54, 95% CI ‐2.60 to ‐0.48; 1 study, N = 45; moderate‐certainty evidence) but not salbutamol (MD ‐2.33, 95% CI ‐3.91 to ‐0.75; 1 study, N = 43; moderate‐certainty evidence; Analysis 2.5).
Combined improvement score
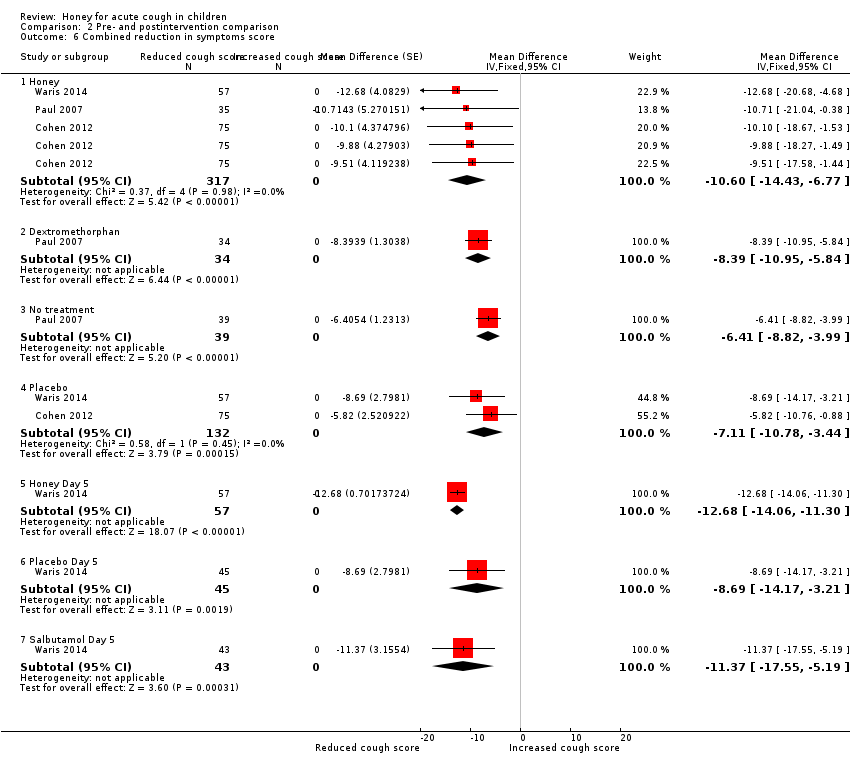
When the scores of each intervention were combined across all categories, children in the honey group had reduced cough symptoms to a greater extent (MD ‐10.60, 95% CI ‐14.43 to ‐6.77; I² = 0%; 3 studies, N = 317; moderate‐certainty evidence) than those in the dextromethorphan (MD ‐8.39, 95% CI ‐10.95 to ‐5.84; 1 study, N = 34; low‐certainty evidence), no treatment (MD ‐6.41, 95% CI ‐8.82 to ‐3.99; 1 study, N = 39; low‐certainty evidence), or placebo groups (MD ‐7.11, 95% CI ‐10.78 to ‐3.44; I² = 0%; 2 studies, N = 132; moderate‐certainty evidence). Likewise, after five days treatment with honey, salbutamol, or placebo, honey reduced cough to a greater extent (MD ‐12.68, 95% CI ‐14.06 to ‐11.30; 1 study, N = 57; moderate‐certainty evidence) than salbutamol (MD ‐11.37, 95% CI ‐17.55 to ‐5.19; 1 study, N = 43; moderate‐certainty evidence) or placebo (MD ‐8.69, 95% CI ‐14.17 to ‐3.21; 1 study, N = 45; moderate‐certainty evidence; Analysis 2.6).
3. Improvement in quality of life (e.g. school attendance and playing)
None of the included studies assessed the effect of honey on children's quality of life.
4. Adverse effects
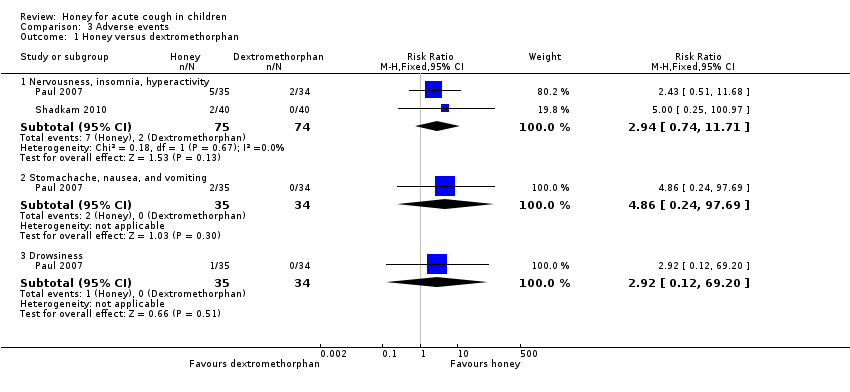
Reported adverse events included mild reactions (nervousness, insomnia, and hyperactivity), gastrointestinal symptoms (stomachache, nausea, diarrhoea, and vomiting), rash, tachycardia, drowsiness, and somnolence. The difference observed in adverse events in comparisons of honey versus dextromethorphan, honey versus diphenhydramine, honey versus salbutamol, and honey versus placebo were not statistically significant. Seven children (9.3%) from the honey group compared to two (2.7%) from the dextromethorphan group experienced reactions such as nervousness, insomnia, and hyperactivity (risk ratio (RR) 2.94, 95% CI 0.74 to 11.71; I² = 0%; 2 studies, N = 149; low‐certainty evidence; Analysis 3.1). Two children (2.7%) from the honey group had gastrointestinal symptoms compared to none from the dextromethorphan group (RR 4.86, 95% CI 0.24 to 97.69; 1 study, N = 69; low‐certainty evidence; Analysis 3.1). One (1.3%) child in the honey group experienced drowsiness (RR 2.92, 95% CI 0.12 to 69.20; I² = 0%; 1 study, N = 69; low‐certainty evidence; Analysis 3.1). Three children (7.5%) experienced somnolence in the diphenhydramine group, but this result was not significantly different from the honey group (RR 0.14, 95% CI 0.01 to 2.68; 1 study, N = 80; low‐certainty evidence; Analysis 3.2). No adverse effects were reported for the no‐treatment group.
A total of 34 children (12%) in the honey group compared to 13 children (11%) from the placebo group experienced gastrointestinal symptoms (RR 1.91, 95% CI 1.12 to 3.24; I² = 0%; 2 studies, N = 402; moderate‐certainty evidence; Analysis 3.3). Similarly, more gastrointestinal symptoms probably occurred with honey than with salbutamol (RR 1.74, 95% CI 1.04 to 2.92; 1 study, N = 100; moderate‐certainty evidence).
Diarrhoea was reported in the salbutamol (N = 9, 21%), honey (N = 7, 12%), and placebo (N = 6, 13%) groups. The risk of diarrhoea was similar in the honey group compared to the placebo group (RR 0.92, 95% CI 0.33 to 2.55; 1 study, N = 102; low‐certainty evidence; Analysis 3.3). The risk of diarrhoea probably increased to a greater extent in the salbutamol group than in the honey group (RR 0.59, 95% CI 0.24 to 1.45; 1 study, N = 100; moderate‐certainty evidence; Analysis 3.4).
The risk of rash in the salbutamol group was probably higher than in the honey group (RR 0.19, 95% CI 0.02 to 1.63; 1 study, N = 100; moderate‐certainty evidence; Analysis 3.4). Two children in the honey group had tachycardia compared to one in the placebo group (RR 1.58, 95% CI 0.15 to 16.86; 1 study, N = 102; low‐certainty evidence; Analysis 3.3) and one in the salbutamol group (RR 1.51, 95% CI 0.14 to 16.10; 1 study, N = 100; low‐certainty evidence; Analysis 3.4).
5. Improvement in appetite
None of the included studies assessed improvement in appetite as an outcome.
6. Cost of honey alone compared with other cough syrups
None of the included studies assessed cost of treatment as an outcome.
Pair‐wise comparison of honey and dextromethorphan
There was no difference between honey and dextromethorphan in reducing cough frequency (MD ‐0.07, 95% CI ‐1.07 to 0.94; I² = 87%; 2 studies, N = 149; low‐certainty evidence), cough severity (MD ‐0.13, 95% CI ‐1.25 to 0.99; I² = 85%; 2 studies, N = 149; low‐certainty evidence), bothersome cough (MD 0.29, 95% CI ‐0.56 to 1.14; 1 study, N = 69; moderate‐certainty evidence), impact of cough on children's sleep (MD 0.03, 95% CI ‐1.12 to 1.19; I² = 84%; 2 studies, N = 149; low‐certainty evidence), and parents' sleep (MD ‐0.16, 95% CI ‐0.84 to 0.53; I² = 59%; 2 studies, N = 149; low‐certainty evidence; Analysis 1.1).
Pair‐wise comparison of honey versus diphenhydramine
Honey may be better than diphenhydramine in reducing cough frequency (MD ‐0.57, 95% CI ‐0.90 to ‐0.24; 1 study, N = 80; low‐certainty evidence), cough severity (MD ‐0.60, 95% CI ‐0.94 to ‐0.26; 1 study, N = 80; low‐certainty evidence), cough impact on children's sleep (MD ‐0.55, 95% CI ‐0.87 to ‐0.23; 1 study, N = 80; low‐certainty evidence), and cough impact on parents' sleep (MD ‐0.48, 95% CI ‐0.76 to ‐0.20; 1 study, N = 80; low‐certainty evidence; Analysis 1.2).
Ahmadi 2013 reported that the frequency and severity of night‐ and daytime coughing was significantly reduced by 79.4% and 84.1% in the group receiving honey, and 58.7% and 58.7% in the group receiving diphenhydramine, quote: "P < 0.02" (Table 1).
Pair‐wise comparison of honey versus no treatment
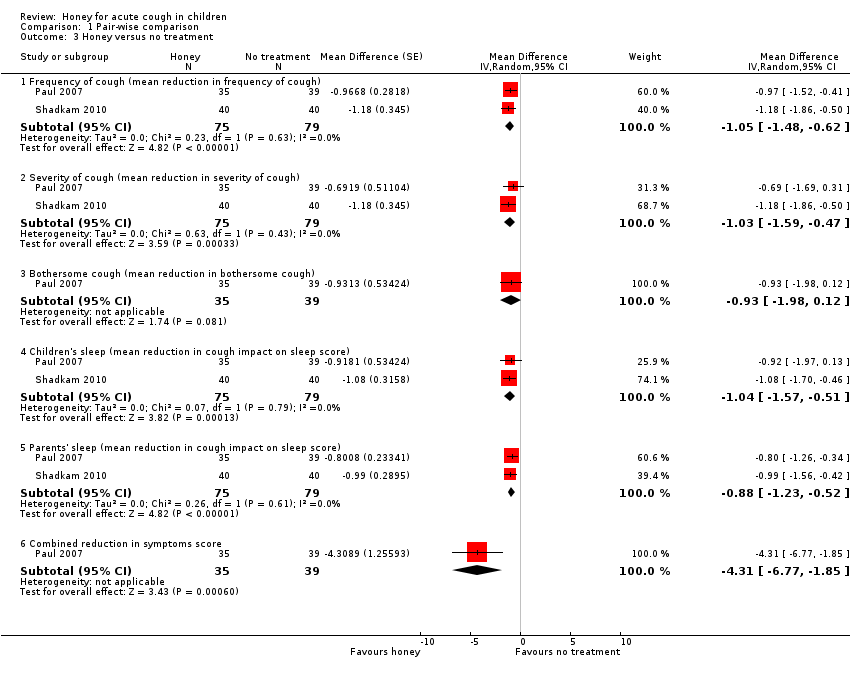
Moderate‐certainty evidence showed that the effect of honey was probably better than no treatment in reducing cough frequency (MD ‐1.05, 95% CI ‐1.48 to ‐0.62; I² = 0%; 2 studies, N = 154), cough severity (MD ‐1.03, 95% CI ‐1.59 to ‐0.47; I² = 63%; 2 studies, N = 154), cough impact on children's sleep (MD ‐1.04, 95% CI ‐1.57 to ‐0.51; I² = 7%; 2 studies, N = 154), and cough impact on parents' sleep (MD ‐0.88, 95% CI ‐1.23 to ‐0.52; I² = 26%; 2 studies, N = 154). However, honey was no different than no treatment in resolving bothersome cough (MD ‐0.93, 95% CI ‐1.98 to 0.12; 1 study, N = 74; low‐certainty evidence; Analysis 1.3).
Pair‐wise comparison of honey versus placebo
Moderate‐certainty evidence showed that honey probably reduces the duration of cough more than placebo (MD ‐0.72, 95% CI ‐1.31 to ‐0.13; 1 study, N = 102).
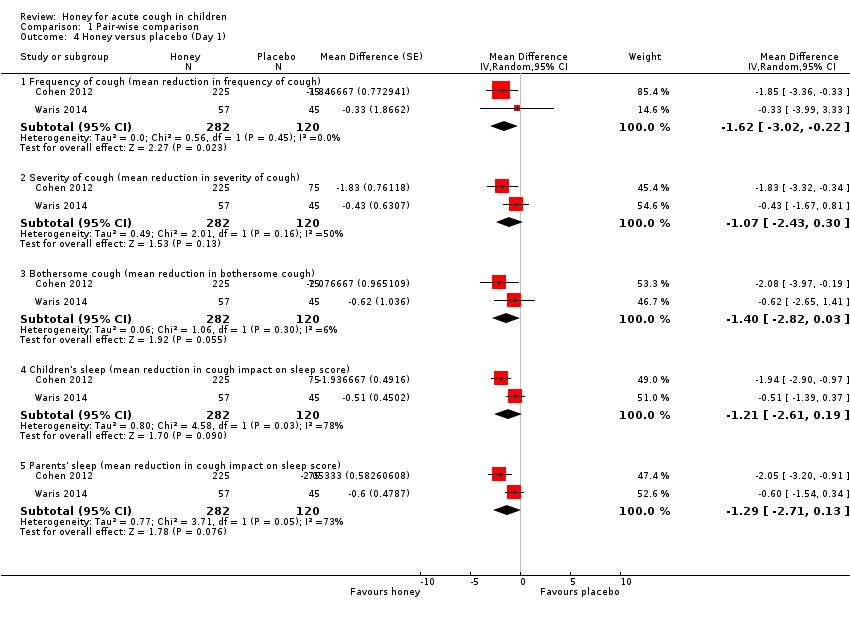
After a one‐night honey intervention, the available evidence showed that honey reduced cough frequency to a greater extent than placebo (MD ‐1.62, 95% CI ‐3.02 to ‐0.22; I² = 0%; 2 studies, N = 402; moderate‐certainty evidence). Honey also had a greater effect in reducing cough severity (MD ‐1.07, 95% CI ‐2.43 to 0.30; I² = 50%; 2 studies, N = 402; moderate‐certainty evidence) and bothersome cough (MD ‐1.40, 95% CI ‐2.82 to 0.03; I² = 6%; 2 studies, N = 402; moderate‐certainty evidence) than placebo, but the difference was not statistically significant. Caregivers reported that honey improved quality of sleep better than placebo for parents (MD ‐1.29, 95% CI ‐2.71 to 0.13; I² = 73%; 2 studies, N = 402; moderate‐certainty evidence) and their children (MD ‐1.21, 95% CI ‐2.61 to 0.19; I² = 78%; 2 studies, N = 402; moderate‐certainty evidence). The difference between intervention groups was not statistically significant (Analysis 1.4).
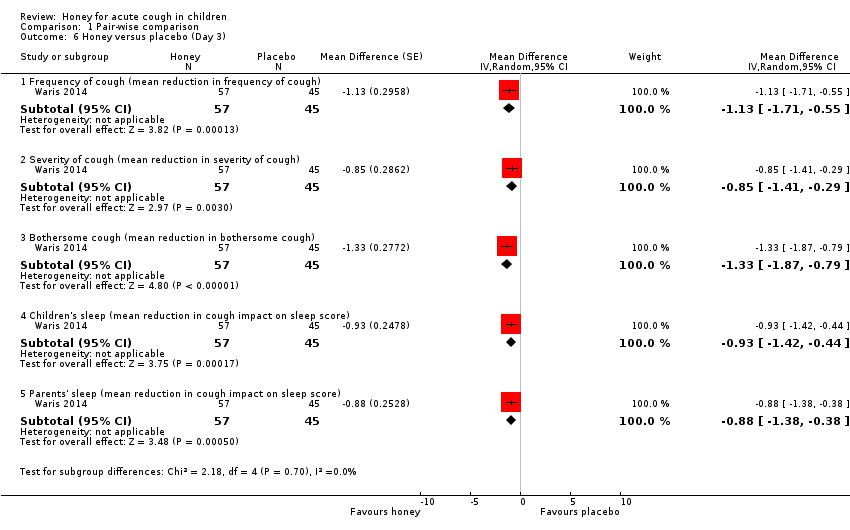
On Day 3 of honey versus placebo treatment, moderate‐certainty evidence showed that honey reduced cough frequency (MD ‐1.13, 95% CI ‐1.71 to ‐0.55; 1 study, N = 102), cough severity (MD ‐0.85, 95% CI ‐1.41 to ‐0.29; 1 study, N = 102), bothersome cough (MD ‐1.33, 95% CI ‐1.87 to ‐0.79; 1 study, N = 102), impact of cough on children's sleep (MD ‐0.93, 95% CI ‐1.42 to ‐0.44; 1 study, N = 102), and impact of cough on parents' sleep to a greater extent than placebo (MD ‐0.88, 95% CI ‐1.38 to ‐0.38; 1 study, N = 102; Analysis 1.6).
Honey reduced cough duration to a greater extent than placebo (MD ‐0.72, 95% CI ‐1.31 to ‐0.13; 1 study, N = 102; moderate‐certainty evidence).
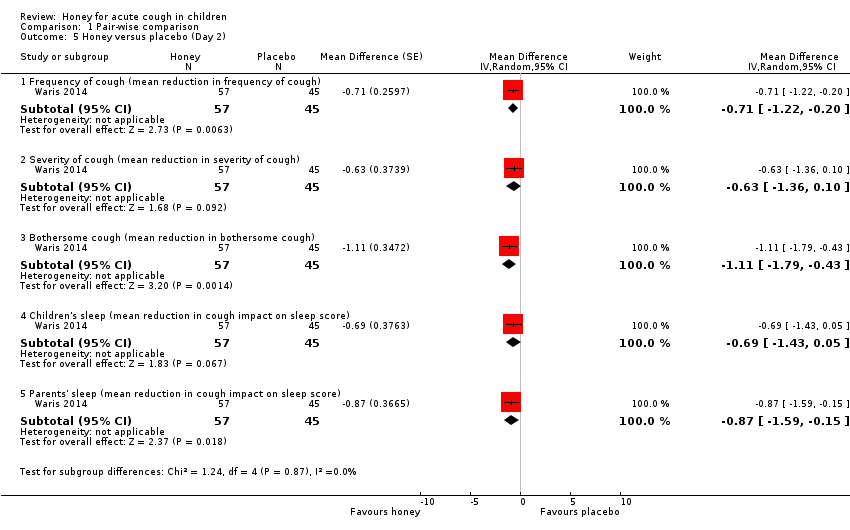
On the fifth day of treatment, moderate‐certainty evidence showed there was no significant difference between honey and placebo in reducing cough frequency (MD ‐0.48, 95% CI ‐2.95 to 1.99; 1 study, N = 102), cough severity (MD ‐0.43, 95% CI ‐2.21 to 1.35; 1 study, N = 102), bothersome cough (MD ‐0.51, 95% CI ‐3.01 to 1.99; 1 study, N = 102), cough impact on children's sleep (MD ‐0.55, 95% CI ‐1.79 to 0.69; 1 study, N = 102), and cough impact on parents' sleep (MD ‐0.57, 95% CI ‐1.59 to 0.45; 1 study, N = 102; Analysis 1.8).
Pair‐wise comparison of honey versus salbutamol
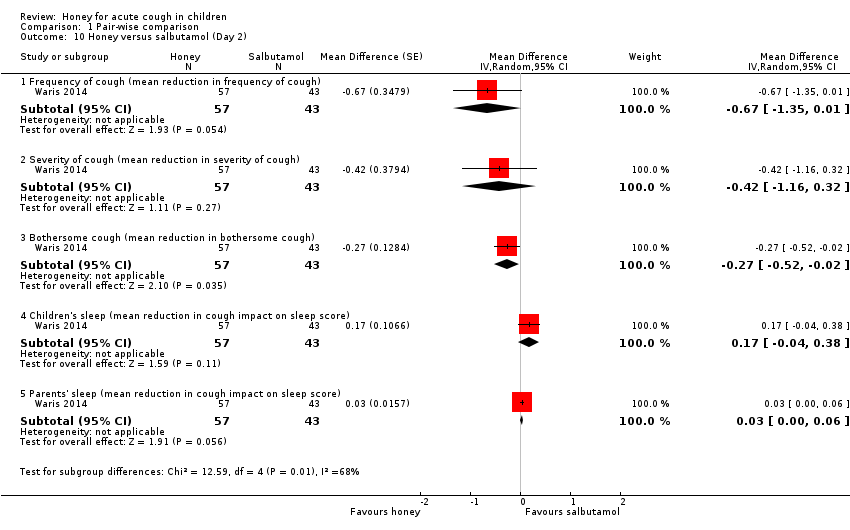
After the first night of treatment, honey reduced cough frequency (MD ‐0.26, 95% CI ‐3.14 to 2.62; 1 study, N = 100; moderate‐certainty evidence), cough severity (MD ‐0.10, 95% CI ‐0.39 to 0.19; 1 study, N = 100; moderate‐certainty evidence), and bothersome cough (MD ‐0.21, 95% CI ‐0.90 to 0.48; 1 study, N = 100; moderate‐certainty evidence) more than salbutamol, but the difference was not statistically significant. However, salbutamol reduced cough impact on children's sleep (MD 0.09, 95% CI ‐0.05 to 0.23; 1 study, N = 100; moderate‐certainty evidence) and cough impact on parents' sleep (MD 0.05, 95% CI ‐0.03 to 0.13; 1 study, N = 100; moderate‐certainty evidence) more than honey. The difference was not statistically significant (Analysis 1.9).
On Day 3 of the intervention, honey reduced cough frequency (MD ‐0.69, 95% CI ‐1.13 to ‐0.25; 1 study, N = 100; moderate‐certainty evidence), cough severity (MD ‐0.34, 95% CI ‐0.64 to ‐0.04; 1 study, N = 100; moderate‐certainty evidence), and bothersome cough to a greater extent than salbutamol (MD ‐0.24, 95% CI ‐0.38 to ‐0.10; 1 study, N = 100; moderate‐certainty evidence). Salbutamol probably reduced the impact of cough on children's sleep (MD 0.31, 95% CI 0.13 to 0.49; 1 study, N = 100; moderate‐certainty evidence) and impact of cough on parents' sleep (MD 0.21, 95% CI 0.06 to 0.36; 1 study, N = 100; moderate‐certainty evidence; Analysis 1.11).
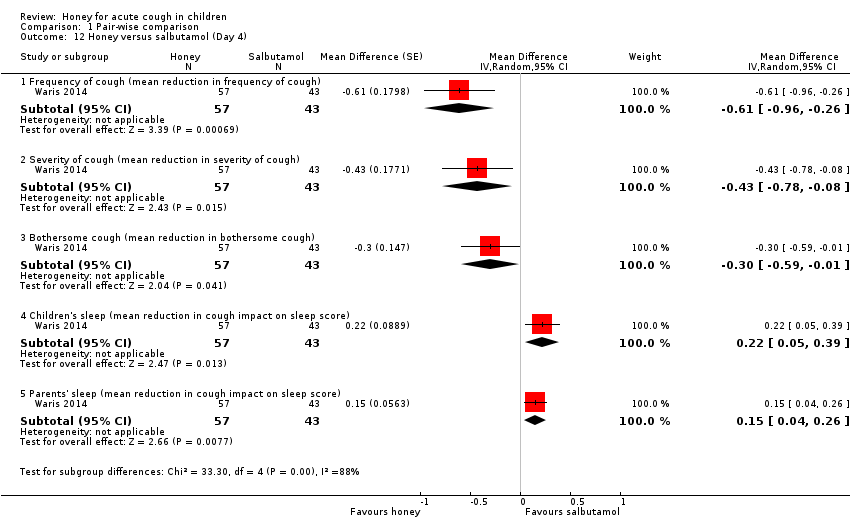
Moderate‐certainty evidence showed that honey reduced cough duration (MD ‐0.54, 95% CI ‐0.98 to ‐0.10; 1 study, N = 100), cough frequency (MD ‐0.54, 95% CI ‐1.03 to ‐0.05; 1 study, N = 100), cough severity (MD ‐0.41, 95% CI ‐0.78 to ‐0.04; 1 study, N = 100), and bothersome cough more than salbutamol on Day 5 (MD ‐0.27, 95% CI ‐0.48 to ‐0.06; 1 study, N = 100). Salbutamol reduced cough impact on children's sleep (MD 0.15, 95% CI 0.04 to 0.26; 1 study, N = 100) and parents' sleep to a greater extent than honey (MD 0.04, 95% CI 0.01 to 0.07; 1 study, N = 100; Analysis 1.13).
Pair‐wise comparison of honey versus bromelin + honey
There was no difference between the effect of honey alone and bromelin with honey on cough frequency (moderate‐certainty evidence; Table 1).
Discussion
Summary of main results
We included six small trials (899 children). Honey was given for one night only in four studies (Cohen 2012; Paul 2007; Peixoto 2016; Shadkam 2010). One study administered honey three times on one day (Ahmadi 2013), and one study administered honey three times daily for five days (Waris 2014). Giving honey for a day was better in relieving cough severity and bothersome cough when compared to no treatment, but the effect was not statistically significantly different from the use of other interventions. However, this evidence was derived from five small studies, two of which had a high risk of performance and detection bias.
Moderate‐certainty evidence showed that honey probably reduces cough duration to a greater extent than salbutamol or placebo. Honey group participants were first to get total relief of cough compared to salbutamol or placebo.
Honey probably relieves cough symptoms and improves sleep quality for both children and parents better than no treatment. Honey may resolve bothersome cough to a greater extent than no treatment, but the difference was not statistically significant. Honey probably reduces cough frequency better than placebo when given to children for a day. Honey probably reduces cough severity, bothersome cough, and impact of cough on both children's and parents' sleep to a greater extent than placebo, but the difference was not statistically significant.
The effect estimate showed that after one night of administration honey may reduce cough symptoms and improve sleep quality of children and their parents better than diphenhydramine. Honey probably had little effect or no difference compared to dextromethorphan or salbutamol for symptomatic relief of cough, resolving bothersome cough, and improving sleep quality for both children and parents.
When we compared types of honey, dark honey from Kenya probably reduced cough frequency and cough severity to a greater extent than the other types of honey. However, dark Kenyan honey was administered three times daily compared to other types of honey that were administered once at night; this may have contributed to the effect size of the African honey.
Three days of honey administration was probably more effective than one day of treatment in relieving symptomatic cough and resolving the bothersome nature of cough when compared with salbutamol or placebo. However, salbutamol probably improved sleep quality for children and parents more than honey.
There is probably little or no difference between honey alone and bromelin (pineapple enzyme extract) mixed with honey for relieving cough symptoms.
On Day 5 of administration, there was probably little or no difference between honey versus placebo or honey versus salbutamol for symptomatic relief of cough and reduction of cough impact on the sleep quality of children and their parents.
No serious adverse events were reported in any of the treatment groups. Non‐severe adverse events such as stomachache, nausea, and vomiting were probably more common in the honey groups than no‐treatment and placebo groups, but comparable with dextromethorphan, diphenhydramine, and salbutamol groups. There was probably little or no difference in numbers of events in the honey, no‐treatment, placebo, dextromethorphan, diphenhydramine, and salbutamol groups for other non‐severe adverse events such as rash and tachycardia.
Overall completeness and applicability of evidence
The available evidence shows that honey may be better than placebo and salbutamol in reducing cough duration for children with acute cough. However, as the data for this evidence were from a small study, the applicability of this evidence is uncertain.
We also found that giving honey for three days is probably more effective in relieving symptoms of cough when compared to placebo or salbutamol. However, salbutamol was more effective in reducing the impact of cough on sleep quality of children and their parents. The administration of honey beyond three days had no advantage over salbutamol or placebo in the reduction of cough severity and bothersome cough. This evidence was generated from a small study, and as such caution is required in its application.
Overall, the direction of effect was in favour of honey compared to no treatment, placebo, dextromethorphan, diphenhydramine, and salbutamol for relieving symptomatic cough and resolving bothersome cough, but it was not better than dextromethorphan, diphenhydramine, and salbutamol at improving the quality of sleep in children and their parents. Other outcomes such as improvements in appetite, school attendance, and playing were not reported. We cannot generalise on the applicability of our findings because most children in this review received treatment for one night, even though an acute cough may last for more than one week.
Waris 2014 reported that they used the darkest honey they could find; it is believed that the darker the honey, the more the antioxidant property (Cohen 2012). However, there is insufficient evidence to support this estimate of effect.
Quality of the evidence
We included six small RCTs that we assessed as at overall low risk of bias (Figure 2). We assessed two studies as at high risk of bias relating to blinding (overall, we assessed the certainty of the evidence as low to moderate certainty for outcomes measured; summary of findings Table for the main comparison; summary of findings Table 2; summary of findings Table 3; summary of findings Table 4; summary of findings Table 5). This was largely due to imprecision of the effect estimate, heterogeneity, and high risk of bias of some of the studies. We rated the certainty of the evidence as moderate to low for all outcomes for the comparisons of honey to dextromethorphan, no treatment, bromelin, and placebo. However, we rated the certainty of evidence as low for honey versus diphenhydramine on symptomatic relief of cough. We assessed two included studies as at high risk of bias of performance and detection bias (Paul 2007; Shadkam 2010). We rated Paul 2007 as at high risk for performance bias because they did not blind the no‐treatment arm of their study. Shadkam 2010 did not blind participants and investigators for all treatment arms. We assessed Cohen 2012 and Waris 2014 as at low risk of bias for all domains except for attrition bias, which we judged as unclear. We rated Ahmadi 2013 as unclear risk of bias for selective reporting and other bias because results were presented as the proportion of children with reduced cough instead of the actual mean symptom scores reported by the other included studies. In addition, the scale used for measurement was not clear (a 7‐point Likert‐like scale was used for cough assessment), and the protocol was registered retrospectively after completion of study. African honey was administered thrice daily for five days compared to one night for other honey types; this may have been responsible for its higher effect on cough symptoms. Also, most studies measured all outcomes using a 7‐point Likert scale, except Peixoto 2016, which used an unvalidated 5‐point cough scale; for this reason we rated Peixoto 2016 as at unclear risk of other bias. These scales are qualitative ordinal scales; as a result, symptom scores may be subjective.
Potential biases in the review process
Due to limitations in the design and reporting of the included studies, conclusive evidence for or against the use of honey in the treatment of cough symptoms and their impact on sleep remains elusive. Data from two studies could not be meta‐analysed because of the way results were presented (Ahmadi 2013; Peixoto 2016). Peixoto 2016 also used an unvalidated cough scale, and the cough scale used by Ahmadi 2013 was unclear. We were unable to conduct sensitivity analyses to determine publication bias because there were too few studies. We screened, extracted, and reported data according to the methods in the Cochrane Handbook for Systematic Reviews of Interventions (Higgins 2011). Most included studies were underpowered. The risk of bias for attrition was unclear in three studies because the studies only stated the proportion of children lost to follow‐up in each treatment group, but no clear information on the reason for the loss (Cohen 2012; Shadkam 2010; Waris 2014).
We did not limit electronic searches by language or publication.
Agreements and disagreements with other studies or reviews
An overview of reviews of honey for treating cough included three reviews (Nitsche 2016). Of the three reviews included in the overview, Oduwole 2014a and Oduwole 2014b are earlier versions of this review, and Smith 2014 is a Cochrane Review that assessed over‐the‐counter remedies for acute cough in community settings. The conclusions reported by Nitsche 2016 were similar to the findings of this review. We also identified a related study (Mulholland 2011), but we did not think it was relevant to our review, and moreover, the review had no included studies.

Study flow diagram (2018 update).

Risk of bias graph: review authors' judgements about each risk of bias item presented as percentages across all included studies.
'Risk of bias' summary: review authors' judgements about each risk of bias item for each included study.
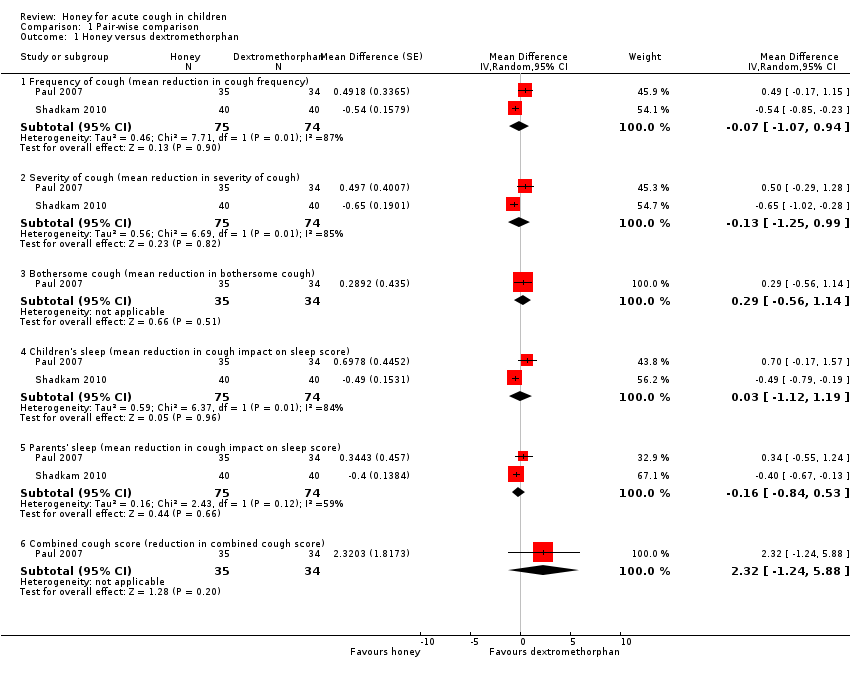
Comparison 1 Pair‐wise comparison, Outcome 1 Honey versus dextromethorphan.

Comparison 1 Pair‐wise comparison, Outcome 2 Honey versus diphenhydramine.
Comparison 1 Pair‐wise comparison, Outcome 3 Honey versus no treatment.
Comparison 1 Pair‐wise comparison, Outcome 4 Honey versus placebo (Day 1).
Comparison 1 Pair‐wise comparison, Outcome 5 Honey versus placebo (Day 2).
Comparison 1 Pair‐wise comparison, Outcome 6 Honey versus placebo (Day 3).

Comparison 1 Pair‐wise comparison, Outcome 7 Honey versus placebo (Day 4).
Comparison 1 Pair‐wise comparison, Outcome 8 Honey versus placebo (Day 5).

Comparison 1 Pair‐wise comparison, Outcome 9 Honey versus salbutamol (Day 1).
Comparison 1 Pair‐wise comparison, Outcome 10 Honey versus salbutamol (Day 2).

Comparison 1 Pair‐wise comparison, Outcome 11 Honey versus salbutamol (Day 3).
Comparison 1 Pair‐wise comparison, Outcome 12 Honey versus salbutamol (Day 4).

Comparison 1 Pair‐wise comparison, Outcome 13 Honey versus salbutamol (Day 5).

Comparison 2 Pre‐ and postintervention comparison, Outcome 1 Cough frequency (mean reduction in frequency).
Comparison 2 Pre‐ and postintervention comparison, Outcome 2 Severity of cough (mean reduction in severity).
Comparison 2 Pre‐ and postintervention comparison, Outcome 3 Bothersome cough (mean reduction in bothersome cough).

Comparison 2 Pre‐ and postintervention comparison, Outcome 4 Children's sleep (mean reduction in cough impact on sleep score).
Comparison 2 Pre‐ and postintervention comparison, Outcome 5 Parents' sleep (mean reduction in cough impact on sleep score).
Comparison 2 Pre‐ and postintervention comparison, Outcome 6 Combined reduction in symptoms score.
Comparison 3 Adverse events, Outcome 1 Honey versus dextromethorphan.
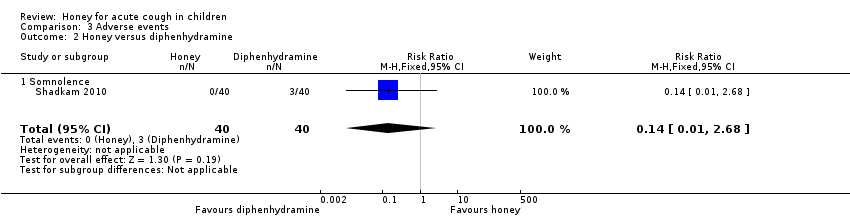
Comparison 3 Adverse events, Outcome 2 Honey versus diphenhydramine.

Comparison 3 Adverse events, Outcome 3 Honey versus placebo.

Comparison 3 Adverse events, Outcome 4 Honey versus salbutamol.

Comparison 3 Adverse events, Outcome 5 Honey versus no treatment.
| Honey compared to dextromethorphan for acute cough in children | ||||||
| Patient or population: acute cough in children | ||||||
| Outcomes | Anticipated absolute effects* (95% CI) | Relative effect | № of participants | Certainty of the evidence | Comments | |
| Risk with dextromethorphan | Risk with honey | |||||
| Duration of cough | ‐ | ‐ | ‐ | ‐ | ‐ | Not assessed |
| Frequency of cough1 | The mean frequency of cough (reduction in frequency of cough score) was ‐1.54. | MD 0.07 score lower | ‐ | 149 | ⊕⊕⊝⊝ | Follow‐up: mean 1 day |
| Severity of cough1 | The mean severity of cough (reduction in severity of cough score) was ‐1.52. | MD 0.13 score lower | ‐ | 149 | ⊕⊕⊝⊝ | Follow‐up: mean 1 day |
| Bothersome cough1 | The mean bothersome cough (reduction in bothersome nature of cough score) was ‐1.94. | MD 0.29 score higher | ‐ | 69 | ⊕⊕⊕⊝ | Follow‐up: mean 1 day |
| Cough impact on children's sleep1 | The mean cough impact on children's sleep (cough impact on children' sleep score) was ‐1.75. | MD 0.03 score higher | ‐ | 149 | ⊕⊕⊝⊝ | Follow‐up: mean 6 days |
| Cough impact on parents' sleep1 | The mean cough impact on parents' sleep (cough impact on parents' sleep score) was ‐1.97. | MD 0.16 score lower | ‐ | 149 | ⊕⊕⊝⊝ | Follow‐up: mean 1 day |
| Adverse events | Population | |||||
| Nervousness, insomnia, hyperactivity | 3 per 100 | 8 per 100 (2 to 32) | RR 2.94 | 149 | ⊕⊕⊝⊝ | Follow‐up: mean 1 day |
| Stomachache, nausea, and vomiting | 1 per 100 | 7 per 100 (0 to 100) | RR 4.86 | 69 | ⊕⊕⊝⊝ | |
| Drowsiness | 1 per 100 | 4 per 100 | RR 2.92 | 69 | ⊕⊕⊝⊝ | |
| *The risk in the intervention group (and its 95% confidence interval) is based on the assumed risk in the comparison group and the relative effect of the intervention (and its 95% CI). | ||||||
| GRADE Working Group grades of evidence | ||||||
| 1Assessed on a 7‐point Likert scale from 0 to 6; lower score is better. | ||||||
| Honey compared to diphenhydramine for acute cough in children | ||||||
| Patient or population: acute cough in children | ||||||
| Outcomes | Anticipated absolute effects* (95% CI) | Relative effect | № of participants | Certainty of the evidence | Comments | |
| Risk with diphenhydramine | Risk with honey | |||||
| Cough duration | ‐ | ‐ | ‐ | ‐ | ‐ | Not assessed |
| Frequency of cough1 | The mean frequency of cough (reduction in cough frequency score) was ‐1.73. | MD 0.57 lower | ‐ | 80 | ⊕⊕⊝⊝ | Follow‐up: mean 1 day |
| Severity of cough1 | The mean severity of cough (reduction in cough severity score) was ‐1.83. | MD 0.6 lower | ‐ | 80 | ⊕⊕⊝⊝ | Follow‐up: mean 1 day |
| Cough impact on children's sleep1 | The mean cough impact on children's sleep (cough impact on children' sleep score) was ‐1.64. | MD 0.55 score lower | ‐ | 80 | ⊕⊕⊝⊝ | Follow‐up: mean 6 days |
| Cough impact on parents' sleep1 | The mean cough impact on parents' sleep (cough impact on parents' sleep score) was ‐1.89. | MD 0.48 lower | ‐ | 80 | ⊕⊕⊝⊝ | Follow‐up: mean 1 day |
| Adverse event: Somnolence | Population | 1 per 100 | RR 0.14 | 80 | ⊕⊕⊝⊝ | Follow‐up: mean 1 day |
| 8 per 100 | ||||||
| *The risk in the intervention group (and its 95% confidence interval) is based on the assumed risk in the comparison group and the relative effect of the intervention (and its 95% CI). | ||||||
| GRADE Working Group grades of evidence | ||||||
| 1Assessed on a 7‐point Likert scale from 0 to 6; lower score is better. | ||||||
| Honey compared to no treatment for acute cough in children | ||||||
| Patient or population: acute cough in children | ||||||
| Outcomes | Anticipated absolute effects* (95% CI) | Relative effect | № of participants | Certainty of the evidence | Comments | |
| Risk with no treatment | Risk with honey | |||||
| Cough duration | ‐ | ‐ | ‐ | ‐ | ‐ | Not assessed |
| Frequency of cough1 | The mean frequency of cough (reduction in cough frequency score) was ‐0.98. | MD 1.05 lower | ‐ | 154 | ⊕⊕⊕⊝ | Follow‐up: mean 1 day |
| Severity of cough1 assessed with: 7‐point Likert scale | The mean severity of cough (reduction in severity of cough score) was ‐1.13. | MD 1.03 score lower | ‐ | 154 | ⊕⊕⊕⊝ | Follow‐up: mean 1 day |
| Bothersome cough1 | The mean bothersome cough (reduction in bothersome nature of cough score) was ‐1.30. | MD 0.93 score lower | ‐ | 74 | ⊕⊕⊝⊝ | Follow‐up: mean 1 day |
| Cough impact on children's sleep1 | The mean cough impact on children's sleep (cough impact on children' sleep score) was ‐1.28. | MD 1.04 score lower | ‐ | 154 | ⊕⊕⊕⊝ | Follow‐up: mean 6 days |
| Cough impact on parents' sleep1 assessed with: 7‐point Likert scale | The mean cough impact on parents' sleep (cough impact on parents' sleep score) was ‐1.46. | MD 0.88 score lower | ‐ | 154 | ⊕⊕⊕⊝ | Follow‐up: mean 1 day |
| Adverse events | Population | |||||
| Nervousness, insomnia, hyperactivity | 1 per 100 | 6 per 100 | RR 9.40 (1.16 to 76.20) | 154 | ⊕⊕⊝⊝ | Follow‐up: mean 1 day |
| Stomachache, nausea, and vomiting | 1 per 100 | 7 per 100 | RR 5.90 (0.27 to 127.14) | 74 | ⊕⊕⊝⊝ | |
| Drowsiness | 1 per 100 | 4 per 100 | RR 3.43 (0.14 to 87.09) | 74 | ⊕⊕⊝⊝ | |
| *The risk in the intervention group (and its 95% confidence interval) is based on the assumed risk in the comparison group and the relative effect of the intervention (and its 95% CI). | ||||||
| GRADE Working Group grades of evidence | ||||||
| 1Assessed on a 7‐point Likert scale from 0 to 6; lower score is better. | ||||||
| Honey compared to placebo for acute cough in children | ||||||
| Patient or population: acute cough in children | ||||||
| Outcomes | Anticipated absolute effects* (95% CI) | Relative effect | № of participants | Certainty of the evidence | Comments | |
| Risk with placebo | Risk with honey | |||||
| Day 1 | ||||||
| Frequency of cough1 | The mean frequency of cough (reduction in cough frequency score) was ‐0.99. | MD 1.62 score lower | ‐ | 402 | ⊕⊕⊕⊝ | Follow‐up: mean 1 day |
| Severity of cough1 | The mean severity of cough (reduction in severity of cough score) was ‐0.80. | MD 1.07 score lower | ‐ | 402 | ⊕⊕⊕⊝ | |
| Bothersome cough (mean improvement score)1 | The mean bothersome cough (reduction in bothersome nature of cough) was ‐1.08. | MD 1.4 score lower | ‐ | 402 | ⊕⊕⊕⊝ | |
| Cough impact on children's sleep1 | The mean cough impact on children's sleep (cough impact on children' sleep score) was ‐1.03. | MD 1.21 score lower | ‐ | 402 | ⊕⊕⊕⊝ | Follow‐up: mean 6 days |
| Cough impact on parents' sleep1 | The mean cough impact on parents' sleep (cough impact on parents' sleep score) was ‐1.44. | MD 1.29 score lower | ‐ | 402 | ⊕⊕⊕⊝ | Follow‐up: mean 1 day |
| Day 3 | ||||||
| Frequency of cough1 | The mean frequency of cough (reduction in frequency of cough score) was ‐0.9. | MD 1.13 score lower | ‐ | 102 | ⊕⊕⊕⊝ | Follow‐up: mean 6 days |
| Severity of cough1 | The mean severity of cough (reduction in severity of cough score) was ‐1.08. | MD 0.85 score lower | ‐ | 102 | ⊕⊕⊕⊝ | |
| Bothersome cough1 | The mean bothersome cough (reduction in bothersome nature of cough score) was ‐0.99. | MD 1.33 score lower | ‐ | 102 | ⊕⊕⊕⊝ | |
| Cough impact on children's sleep1 | The mean cough impact on children's sleep (cough impact on children's sleep score) was ‐0.46. | MD 0.93 score lower | ‐ | 102 | ⊕⊕⊕⊝ | |
| Cough impact on parents' sleep3 | The mean cough impact on parents' sleep (cough impact on parents' sleep score) was ‐1.04. | MD 0.88 score lower | ‐ | 102 | ⊕⊕⊕⊝ | |
| Day 5 | ||||||
| Cough duration | The mean cough duration was 5.18 days. | MD 0.72 days lower | ‐ | 102 | ⊕⊕⊕⊝ | Follow‐up: mean 6 days; assessed with: 7‐point Likert scale |
| Frequency of cough1 | The mean frequency of cough (reduction in frequency of cough score) was ‐1.95. | MD 0.48 score lower | ‐ | 102 | ⊕⊕⊕⊝ | |
| Severity of cough1 | The mean severity of cough (reduction in severity of cough score) was ‐1.96. | MD 0.43 score lower | ‐ | 102 | ⊕⊕⊕⊝ | |
| Bothersome cough1 | The mean bothersome cough (reduction in bothersome nature of cough score) was ‐1.85. | MD 0.51 score lower | ‐ | 102 | ⊕⊕⊕⊝ | |
| Cough impact on children's sleep1 | The mean cough impact on children's sleep (cough impact on children' sleep score) was ‐1.68. | MD 0.55 score lower | ‐ | 102 | ⊕⊕⊕⊝ | |
| Cough impact on parents' sleep | The mean cough impact on parents' sleep (cough impact on parents' sleep score) was ‐1.54. | MD 0.57 score lower | ‐ | 102 | ⊕⊕⊕⊝ | |
| Adverse events | Population | |||||
| Stomachache, nausea, and vomiting | 11 per 100 | 21 per 100 | RR 1.91 | 402 | ⊕⊕⊕⊝ | Follow‐up: mean 6 days |
| Diarrhoea | 13 per 100 | 12 per 100 | RR 0.92 | 102 | ⊕⊕⊝⊝ | |
| Tachycardia | 2 per 100 | 4 per 100 | RR 1.58 | 102 | ⊕⊕⊝⊝ | |
| *The risk in the intervention group (and its 95% confidence interval) is based on the assumed risk in the comparison group and the relative effect of the intervention (and its 95% CI). | ||||||
| GRADE Working Group grades of evidence | ||||||
| 1Assessed on a 7‐point Likert scale from 0 to 6; lower score is better. | ||||||
| Honey compared to salbutamol for acute cough in children | ||||||
| Patient or population: acute cough in children | ||||||
| Outcomes | Anticipated absolute effects* (95% CI) | Relative effect | № of participants | Certainty of the evidence | Comments | |
| Risk with salbutamol | Risk with honey | |||||
| Day 1 | ||||||
| Frequency of cough (mean improvement score)1 | The mean frequency of cough (reduction in frequency of cough score) was ‐0.52. | MD 0.26 lower | ‐ | 100 | ⊕⊕⊕⊝ | Follow‐up: mean 6 days |
| Severity of cough (mean improvement score)1 | The mean severity of cough (reduction in severity of cough score) was ‐0.74. | MD 0.1 lower | ‐ | 100 | ⊕⊕⊕⊝ | |
| Bothersome cough (mean improvement score)1 | The mean bothersome cough (reduction in bothersome nature of cough score) was ‐1.00. | MD 0.21 lower | ‐ | 100 | ⊕⊕⊕⊝ | |
| Cough impact on children's sleep1 | The mean cough impact on children's sleep (cough impact on children' sleep score) was ‐1.24. | MD 0.09 higher | ‐ | 100 | ⊕⊕⊕⊝ | |
| Cough impact on parents' sleep1 | The mean cough impact on parents' sleep (cough impact on parents' sleep score) was ‐1.22. | MD 0.05 higher | ‐ | 100 | ⊕⊕⊕⊝ | |
| Day 3 | ||||||
| Frequency of cough1 | The mean frequency of cough (reduction in frequency of cough score) was ‐1.34. | MD 0.69 lower | ‐ | 100 | ⊕⊕⊕⊝ | Follow‐up: mean 4 days |
| Severity of cough1 | The mean severity of cough (reduction in severity of cough score) was ‐1.59. | MD 0.34 lower | ‐ | 100 | ⊕⊕⊕⊝ | |
| Bothersome cough1 | The mean bothersome cough (reduction in bothersome nature of cough score) was ‐2.08. | MD 0.24 lower | ‐ | 100 | ⊕⊕⊕⊝ | |
| Cough impact on children's sleep1 | The mean cough impact on children's sleep (cough impact on children' sleep score) was ‐2.25. | MD 0.31 higher | ‐ | 100 | ⊕⊕⊕⊝ | Follow‐up: mean 6 days |
| Cough impact on parents' sleep1 | The mean cough impact on parents' sleep (cough impact on parents' sleep score) was ‐2.13. | MD 0.21 higher | ‐ | 100 | ⊕⊕⊕⊝ | Follow‐up: mean 4 days |
| Day 5 | ||||||
| Cough duration | The mean cough duration was 5 days. | MD 0.54 days lower | ‐ | 100 | ⊕⊕⊕⊝ | Follow‐up: mean 6 days |
| Frequency of cough (mean improvement score)1 | The mean frequency of cough (reduction in frequency of cough score) was ‐2.19. | MD 0.54 lower | ‐ | 100 | ⊕⊕⊕⊝ | |
| Severity of cough (mean improvement score)1 | The mean severity of cough (reduction in severity of cough score) was ‐2.08. | MD 0.41 lower | ‐ | 100 | ⊕⊕⊕⊝ | |
| Bothersome cough (mean improvement score)1 | The mean bothersome cough (reduction in bothersome nature of cough score) was ‐2.47. | MD 0.27 lower | ‐ | 100 | ⊕⊕⊕⊝ | |
| Cough impact on children's sleep1 | The mean cough impact on children's sleep (cough impact on children's sleep score) was ‐2.47. | MD 0.15 higher | ‐ | 100 | ⊕⊕⊕⊝ | |
| Cough impact on parents' sleep1 | The mean cough impact on parents' sleep (cough impact on parents' sleep score) was ‐2.33. | MD 0.04 higher | ‐ | 100 | ⊕⊕⊕⊝ | |
| Adverse events | Population | |||||
| Stomachache, nausea, and vomiting | 30 per 100 | 53 per 100 | RR 1.74 | 100 | ⊕⊕⊕⊝ | Follow‐up: mean 6 days |
| Rash | 9 per 100 | 2 per 100 | RR 0.19 | 100 | ⊕⊕⊕⊝ | |
| Tachycardia | 2 per 100 | 4 per 100 | RR 1.51 (0.14 to 16.10) | 100 | ⊕⊕⊝⊝ | |
| Diarrhoea | 21 per 100 | 12 per 100 | RR 0.59 | 100 | ⊕⊕⊕⊝ | |
| *The risk in the intervention group (and its 95% confidence interval) is based on the assumed risk in the comparison group and the relative effect of the intervention (and its 95% CI). | ||||||
| GRADE Working Group grades of evidence | ||||||
| 1Assessed on a 7‐point Likert scale from 0 to 6; lower score is better. | ||||||
| Study ID | Cough | Honey (N = 29) | Bromelin (N = 31) | P value | Certainty of the evidence |
| Frequency of cough1 | |||||
| Before, median (P25 to P75) After, median (P25 to P75) Mean ± SD | 3 (2 to 4) 1 (1 to 1) 1.76 ± 0.87 | 3 (2 to 3) 1 (1 to 1) 1.71 ± 0.78 | 0.832 0.943 | ⊕⊕⊕⊝ | |
| Severity of cough1 | |||||
| Mean ± SD assessed with: unvalidated 5‐point cough scale from 0 to 4 | ‐0.86 ± 0.45 | ‐0.97 ± 0.62 | 0.322 0.223 | ⊕⊕⊕⊝ | |
| Honey (N = 63) | Diphenhydramine (N = 63) | ||||
| Proportion of children with reduction in frequency and severity of daytime cough5 | 84.1% (N = 53) | 58.7% (N = 37) | "< 0.02" | ⊕⊕⊕⊝ | |
| Proportion of children with reduction in frequency and severity of nighttime cough5 | 79.4% (N = 50) | 58.7% (N = 37) | "< 0.02" | ⊕⊕⊕⊝ | |
| SD: standard deviation 1Assessed on an unvalidated 5‐point cough scale from 0 to 4; lower score is better. | |||||
| Outcome or subgroup title | No. of studies | No. of participants | Statistical method | Effect size |
| 1 Honey versus dextromethorphan Show forest plot | 2 | Mean Difference (Random, 95% CI) | Subtotals only | |
| 1.1 Frequency of cough (mean reduction in cough frequency) | 2 | 149 | Mean Difference (Random, 95% CI) | ‐0.07 [‐1.07, 0.94] |
| 1.2 Severity of cough (mean reduction in severity of cough) | 2 | 149 | Mean Difference (Random, 95% CI) | ‐0.13 [‐1.25, 0.99] |
| 1.3 Bothersome cough (mean reduction in bothersome cough) | 1 | 69 | Mean Difference (Random, 95% CI) | 0.29 [‐0.56, 1.14] |
| 1.4 Children's sleep (mean reduction in cough impact on sleep score) | 2 | 149 | Mean Difference (Random, 95% CI) | 0.03 [‐1.12, 1.19] |
| 1.5 Parents' sleep (mean reduction in cough impact on sleep score) | 2 | 149 | Mean Difference (Random, 95% CI) | ‐0.16 [‐0.84, 0.53] |
| 1.6 Combined cough score (reduction in combined cough score) | 1 | 69 | Mean Difference (Random, 95% CI) | 2.32 [‐1.24, 5.88] |
| 2 Honey versus diphenhydramine Show forest plot | 1 | Mean Difference (Random, 95% CI) | Subtotals only | |
| 2.1 Frequency of cough (mean reduction in cough frequency) | 1 | 80 | Mean Difference (Random, 95% CI) | ‐0.57 [‐0.90, ‐0.24] |
| 2.2 Severity of cough (mean reduction in severity of cough) | 1 | 80 | Mean Difference (Random, 95% CI) | ‐0.6 [‐0.94, ‐0.26] |
| 2.3 Children's sleep (mean reduction in cough impact on sleep score) | 1 | 80 | Mean Difference (Random, 95% CI) | ‐0.55 [‐0.87, ‐0.23] |
| 2.4 Parents' sleep (mean reduction in cough impact on sleep score) | 1 | 80 | Mean Difference (Random, 95% CI) | ‐0.48 [‐0.76, ‐0.20] |
| 3 Honey versus no treatment Show forest plot | 2 | Mean Difference (Random, 95% CI) | Subtotals only | |
| 3.1 Frequency of cough (mean reduction in frequency of cough) | 2 | 154 | Mean Difference (Random, 95% CI) | ‐1.05 [‐1.48, ‐0.62] |
| 3.2 Severity of cough (mean reduction in severity of cough) | 2 | 154 | Mean Difference (Random, 95% CI) | ‐1.03 [‐1.59, ‐0.47] |
| 3.3 Bothersome cough (mean reduction in bothersome cough) | 1 | 74 | Mean Difference (Random, 95% CI) | ‐0.93 [‐1.98, 0.12] |
| 3.4 Children's sleep (mean reduction in cough impact on sleep score) | 2 | 154 | Mean Difference (Random, 95% CI) | ‐1.04 [‐1.57, ‐0.51] |
| 3.5 Parents' sleep (mean reduction in cough impact on sleep score) | 2 | 154 | Mean Difference (Random, 95% CI) | ‐0.88 [‐1.23, ‐0.52] |
| 3.6 Combined reduction in symptoms score | 1 | 74 | Mean Difference (Random, 95% CI) | ‐4.31 [‐6.77, ‐1.85] |
| 4 Honey versus placebo (Day 1) Show forest plot | 2 | Mean Difference (Random, 95% CI) | Subtotals only | |
| 4.1 Frequency of cough (mean reduction in frequency of cough) | 2 | 402 | Mean Difference (Random, 95% CI) | ‐1.62 [‐3.02, ‐0.22] |
| 4.2 Severity of cough (mean reduction in severity of cough) | 2 | 402 | Mean Difference (Random, 95% CI) | ‐1.07 [‐2.43, 0.30] |
| 4.3 Bothersome cough (mean reduction in bothersome cough) | 2 | 402 | Mean Difference (Random, 95% CI) | ‐1.40 [‐2.82, 0.03] |
| 4.4 Children's sleep (mean reduction in cough impact on sleep score) | 2 | 402 | Mean Difference (Random, 95% CI) | ‐1.21 [‐2.61, 0.19] |
| 4.5 Parents' sleep (mean reduction in cough impact on sleep score) | 2 | 402 | Mean Difference (Random, 95% CI) | ‐1.29 [‐2.71, 0.13] |
| 5 Honey versus placebo (Day 2) Show forest plot | 1 | Mean Difference (Random, 95% CI) | Subtotals only | |
| 5.1 Frequency of cough (mean reduction in frequency of cough) | 1 | 102 | Mean Difference (Random, 95% CI) | ‐0.71 [‐1.22, ‐0.20] |
| 5.2 Severity of cough (mean reduction in severity of cough) | 1 | 102 | Mean Difference (Random, 95% CI) | ‐0.63 [‐1.36, 0.10] |
| 5.3 Bothersome cough (mean reduction in bothersome cough) | 1 | 102 | Mean Difference (Random, 95% CI) | ‐1.11 [‐1.79, ‐0.43] |
| 5.4 Children's sleep (mean reduction in cough impact on sleep score) | 1 | 102 | Mean Difference (Random, 95% CI) | ‐0.69 [‐1.43, 0.05] |
| 5.5 Parents' sleep (mean reduction in cough impact on sleep score) | 1 | 102 | Mean Difference (Random, 95% CI) | ‐0.87 [‐1.59, ‐0.15] |
| 6 Honey versus placebo (Day 3) Show forest plot | 1 | Mean Difference (Random, 95% CI) | Subtotals only | |
| 6.1 Frequency of cough (mean reduction in frequency of cough) | 1 | 102 | Mean Difference (Random, 95% CI) | ‐1.13 [‐1.71, ‐0.55] |
| 6.2 Severity of cough (mean reduction in severity of cough) | 1 | 102 | Mean Difference (Random, 95% CI) | ‐0.85 [‐1.41, ‐0.29] |
| 6.3 Bothersome cough (mean reduction in bothersome cough) | 1 | 102 | Mean Difference (Random, 95% CI) | ‐1.33 [‐1.87, ‐0.79] |
| 6.4 Children's sleep (mean reduction in cough impact on sleep score) | 1 | 102 | Mean Difference (Random, 95% CI) | ‐0.93 [‐1.42, ‐0.44] |
| 6.5 Parents' sleep (mean reduction in cough impact on sleep score) | 1 | 102 | Mean Difference (Random, 95% CI) | ‐0.88 [‐1.38, ‐0.38] |
| 7 Honey versus placebo (Day 4) Show forest plot | 1 | Mean Difference (Random, 95% CI) | Subtotals only | |
| 7.1 Frequency of cough (mean reduction in frequency of cough) | 1 | 102 | Mean Difference (Random, 95% CI) | ‐1.16 [‐1.83, ‐0.49] |
| 7.2 Severity of cough (mean reduction in severity of cough) | 1 | 102 | Mean Difference (Random, 95% CI) | ‐0.88 [‐1.59, ‐0.17] |
| 7.3 Bothersome cough (mean reduction in bothersome cough) | 1 | 102 | Mean Difference (Random, 95% CI) | ‐0.90 [‐1.76, ‐0.04] |
| 7.4 Children's sleep (mean reduction in cough impact on sleep score) | 1 | 102 | Mean Difference (Random, 95% CI) | ‐0.7 [‐1.25, ‐0.15] |
| 7.5 Parents' sleep (mean reduction in cough impact on sleep score) | 1 | 102 | Mean Difference (Random, 95% CI) | ‐0.90 [‐1.51, ‐0.29] |
| 8 Honey versus placebo (Day 5) Show forest plot | 1 | Mean Difference (Random, 95% CI) | Subtotals only | |
| 8.1 Cough duration (mean number of days) | 1 | 102 | Mean Difference (Random, 95% CI) | ‐0.72 [‐1.31, ‐0.13] |
| 8.2 Frequency of cough (mean reduction in frequency of cough) | 1 | 102 | Mean Difference (Random, 95% CI) | ‐0.48 [‐2.95, 1.99] |
| 8.3 Severity of cough (mean reduction in severity of cough) | 1 | 102 | Mean Difference (Random, 95% CI) | ‐0.43 [‐2.21, 1.35] |
| 8.4 Bothersome cough (mean reduction in bothersome cough) | 1 | 102 | Mean Difference (Random, 95% CI) | ‐0.51 [‐3.01, 1.99] |
| 8.5 Children's sleep (mean reduction in cough impact on sleep score) | 1 | 102 | Mean Difference (Random, 95% CI) | ‐0.55 [‐1.79, 0.69] |
| 8.6 Parents' sleep (mean reduction in cough impact on sleep score) | 1 | 102 | Mean Difference (Random, 95% CI) | ‐0.57 [‐1.59, 0.45] |
| 9 Honey versus salbutamol (Day 1) Show forest plot | 1 | Mean Difference (Random, 95% CI) | Subtotals only | |
| 9.1 Frequency of cough (mean reduction in frequency of cough) | 1 | 100 | Mean Difference (Random, 95% CI) | ‐0.26 [‐3.14, 2.62] |
| 9.2 Severity of cough (mean reduction in severity of cough) | 1 | 100 | Mean Difference (Random, 95% CI) | ‐0.1 [‐0.39, 0.19] |
| 9.3 Bothersome cough (mean reduction in bothersome cough) | 1 | 100 | Mean Difference (Random, 95% CI) | ‐0.21 [‐0.90, 0.48] |
| 9.4 Children's sleep (mean reduction in cough impact on sleep score) | 1 | 100 | Mean Difference (Random, 95% CI) | 0.09 [‐0.05, 0.23] |
| 9.5 Parents' sleep (mean reduction in cough impact on sleep score) | 1 | 100 | Mean Difference (Random, 95% CI) | 0.05 [‐0.03, 0.13] |
| 10 Honey versus salbutamol (Day 2) Show forest plot | 1 | Mean Difference (Random, 95% CI) | Subtotals only | |
| 10.1 Frequency of cough (mean reduction in frequency of cough) | 1 | 100 | Mean Difference (Random, 95% CI) | ‐0.67 [‐1.35, 0.01] |
| 10.2 Severity of cough (mean reduction in severity of cough) | 1 | 100 | Mean Difference (Random, 95% CI) | ‐0.42 [‐1.16, 0.32] |
| 10.3 Bothersome cough (mean reduction in bothersome cough) | 1 | 100 | Mean Difference (Random, 95% CI) | ‐0.27 [‐0.52, ‐0.02] |
| 10.4 Children's sleep (mean reduction in cough impact on sleep score) | 1 | 100 | Mean Difference (Random, 95% CI) | 0.17 [‐0.04, 0.38] |
| 10.5 Parents' sleep (mean reduction in cough impact on sleep score) | 1 | 100 | Mean Difference (Random, 95% CI) | 0.03 [‐0.00, 0.06] |
| 11 Honey versus salbutamol (Day 3) Show forest plot | 1 | Mean Difference (Random, 95% CI) | Subtotals only | |
| 11.1 Frequency of cough (mean reduction in frequency of cough) | 1 | 100 | Mean Difference (Random, 95% CI) | ‐0.69 [‐1.13, ‐0.25] |
| 11.2 Severity of cough (mean reduction in severity of cough) | 1 | 100 | Mean Difference (Random, 95% CI) | ‐0.34 [‐0.64, ‐0.04] |
| 11.3 Bothersome cough (mean reduction in bothersome cough) | 1 | 100 | Mean Difference (Random, 95% CI) | ‐0.24 [‐0.38, ‐0.10] |
| 11.4 Children's sleep (mean reduction in cough impact on sleep score) | 1 | 100 | Mean Difference (Random, 95% CI) | 0.31 [0.13, 0.49] |
| 11.5 Parents' sleep (mean reduction in cough impact on sleep score) | 1 | 100 | Mean Difference (Random, 95% CI) | 0.21 [0.06, 0.36] |
| 12 Honey versus salbutamol (Day 4) Show forest plot | 1 | Mean Difference (Random, 95% CI) | Subtotals only | |
| 12.1 Frequency of cough (mean reduction in frequency of cough) | 1 | 100 | Mean Difference (Random, 95% CI) | ‐0.61 [‐0.96, ‐0.26] |
| 12.2 Severity of cough (mean reduction in severity of cough) | 1 | 100 | Mean Difference (Random, 95% CI) | ‐0.43 [‐0.78, ‐0.08] |
| 12.3 Bothersome cough (mean reduction in bothersome cough) | 1 | 100 | Mean Difference (Random, 95% CI) | ‐0.3 [‐0.59, ‐0.01] |
| 12.4 Children's sleep (mean reduction in cough impact on sleep score) | 1 | 100 | Mean Difference (Random, 95% CI) | 0.22 [0.05, 0.39] |
| 12.5 Parents' sleep (mean reduction in cough impact on sleep score) | 1 | 100 | Mean Difference (Random, 95% CI) | 0.15 [0.04, 0.26] |
| 13 Honey versus salbutamol (Day 5) Show forest plot | 1 | Mean Difference (Random, 95% CI) | Subtotals only | |
| 13.1 Cough duration (mean number of days) | 1 | 100 | Mean Difference (Random, 95% CI) | ‐0.54 [‐0.98, ‐0.10] |
| 13.2 Frequency of cough (mean reduction in frequency of cough) | 1 | 100 | Mean Difference (Random, 95% CI) | ‐0.54 [‐1.03, ‐0.05] |
| 13.3 Severity of cough (mean reduction in severity of cough) | 1 | 100 | Mean Difference (Random, 95% CI) | ‐0.41 [‐0.78, ‐0.04] |
| 13.4 Bothersome cough (mean reduction in bothersome cough) | 1 | 100 | Mean Difference (Random, 95% CI) | ‐0.27 [‐0.48, ‐0.06] |
| 13.5 Children's sleep (mean reduction in cough impact on sleep score) | 1 | 100 | Mean Difference (Random, 95% CI) | 0.15 [0.04, 0.26] |
| 13.6 Parents' sleep (mean reduction in cough impact on sleep score) | 1 | 100 | Mean Difference (Random, 95% CI) | 0.04 [0.01, 0.07] |
| Outcome or subgroup title | No. of studies | No. of participants | Statistical method | Effect size |
| 1 Cough frequency (mean reduction in frequency) Show forest plot | 4 | Mean Difference (Fixed, 95% CI) | Subtotals only | |
| 1.1 Honey | 4 | 357 | Mean Difference (Fixed, 95% CI) | ‐1.71 [‐2.28, ‐1.13] |
| 1.2 Dextromethorphan | 2 | 74 | Mean Difference (Fixed, 95% CI) | ‐1.54 [‐2.30, ‐0.78] |
| 1.3 Diphenhydramine | 1 | 40 | Mean Difference (Fixed, 95% CI) | ‐1.73 [‐2.72, ‐0.74] |
| 1.4 Placebo | 2 | 120 | Mean Difference (Fixed, 95% CI) | ‐0.99 [‐1.79, ‐0.18] |
| 1.5 Salbutamol Day 1 | 1 | 43 | Mean Difference (Fixed, 95% CI) | ‐0.52 [‐6.28, 5.24] |
| 1.6 No treatment | 2 | 79 | Mean Difference (Fixed, 95% CI) | ‐0.98 [‐1.38, ‐0.59] |
| 1.7 Buckwheat honey | 1 | 35 | Mean Difference (Fixed, 95% CI) | ‐1.89 [‐2.96, ‐0.81] |
| 1.8 Natural honey from Kafi‐Abad (Iran) | 1 | 40 | Mean Difference (Fixed, 95% CI) | ‐2.16 [‐3.40, ‐0.92] |
| 1.9 Eucalyptus honey | 1 | 75 | Mean Difference (Fixed, 95% CI) | ‐1.77 [‐3.22, ‐0.32] |
| 1.10 Labiatae honey | 1 | 75 | Mean Difference (Fixed, 95% CI) | ‐1.82 [‐3.30, ‐0.34] |
| 1.11 Citrus honey | 1 | 75 | Mean Difference (Fixed, 95% CI) | ‐1.95 [‐3.55, ‐0.35] |
| 1.12 Salbutamol Day 5 | 1 | 43 | Mean Difference (Fixed, 95% CI) | ‐2.19 [‐3.55, ‐0.83] |
| 1.13 African honey Day 5 | 1 | 57 | Mean Difference (Fixed, 95% CI) | ‐2.65 [‐4.32, ‐0.98] |
| 1.14 Placebo Day 5 | 1 | 45 | Mean Difference (Fixed, 95% CI) | ‐1.95 [‐4.42, 0.52] |
| 2 Severity of cough (mean reduction in severity) Show forest plot | 4 | Mean Difference (Fixed, 95% CI) | Subtotals only | |
| 2.1 Honey | 4 | 357 | Mean Difference (Fixed, 95% CI) | ‐1.65 [‐2.39, ‐0.91] |
| 2.2 Dextromethorphan | 2 | 74 | Mean Difference (Fixed, 95% CI) | ‐1.52 [‐2.24, ‐0.80] |
| 2.3 Diphenhydramine | 1 | 40 | Mean Difference (Fixed, 95% CI) | ‐1.83 [‐2.88, ‐0.78] |
| 2.4 Salbutamol Day 1 | 1 | 43 | Mean Difference (Fixed, 95% CI) | ‐0.74 [‐2.87, 1.39] |
| 2.5 No treatment | 2 | 79 | Mean Difference (Fixed, 95% CI) | ‐1.13 [‐1.54, ‐0.72] |
| 2.6 Placebo | 2 | 120 | Mean Difference (Fixed, 95% CI) | ‐0.80 [‐1.47, ‐0.13] |
| 2.7 Buckwheat honey | 1 | 35 | Mean Difference (Fixed, 95% CI) | ‐1.80 [‐2.88, ‐0.72] |
| 2.8 Natural honey from Kafi‐Abad (Iran) | 1 | 40 | Mean Difference (Fixed, 95% CI) | ‐2.33 [‐3.67, ‐0.99] |
| 2.9 Eucalyptus honey | 1 | 75 | Mean Difference (Fixed, 95% CI) | ‐1.78 [‐2.82, ‐0.74] |
| 2.10 Labiatae honey | 1 | 75 | Mean Difference (Fixed, 95% CI) | ‐1.94 [‐3.07, ‐0.81] |
| 2.11 Citrus honey | 1 | 75 | Mean Difference (Fixed, 95% CI) | ‐1.77 [‐2.74, ‐0.80] |
| 2.12 Salbutamol Day 5 | 1 | 43 | Mean Difference (Fixed, 95% CI) | ‐2.08 [‐4.21, 0.05] |
| 2.13 African honey Day 5 | 1 | 57 | Mean Difference (Fixed, 95% CI) | ‐2.62 [‐5.04, ‐0.20] |
| 2.14 Placebo Day 5 | 1 | 45 | Mean Difference (Fixed, 95% CI) | ‐1.96 [‐3.74, ‐0.18] |
| 3 Bothersome cough (mean reduction in bothersome cough) Show forest plot | 3 | Mean Difference (Fixed, 95% CI) | Subtotals only | |
| 3.1 Honey | 3 | 317 | Mean Difference (Fixed, 95% CI) | ‐2.22 [‐3.24, ‐1.21] |
| 3.2 Dextromethorphan | 1 | 34 | Mean Difference (Fixed, 95% CI) | ‐1.94 [‐3.05, ‐0.83] |
| 3.3 Salbutamol Day 1 | 1 | 43 | Mean Difference (Fixed, 95% CI) | ‐1.0 [‐4.28, 2.28] |
| 3.4 No treatment | 1 | 39 | Mean Difference (Fixed, 95% CI) | ‐1.30 [‐2.07, ‐0.53] |
| 3.5 Placebo | 2 | 120 | Mean Difference (Fixed, 95% CI) | ‐1.08 [‐2.06, ‐0.10] |
| 3.6 Buckwheat honey | 1 | 35 | Mean Difference (Fixed, 95% CI) | ‐2.23 [‐3.50, ‐0.96] |
| 3.7 Eucalyptus honey | 1 | 75 | Mean Difference (Fixed, 95% CI) | ‐2.0 [‐3.82, ‐0.18] |
| 3.8 Labiatae honey | 1 | 75 | Mean Difference (Fixed, 95% CI) | ‐2.07 [‐4.03, ‐0.11] |
| 3.9 Citrus honey | 1 | 75 | Mean Difference (Fixed, 95% CI) | ‐2.16 [‐4.20, ‐0.12] |
| 3.10 Salbutamol Day 5 | 1 | 43 | Mean Difference (Fixed, 95% CI) | ‐2.47 [‐4.73, ‐0.21] |
| 3.11 African honey Day 5 | 1 | 57 | Mean Difference (Fixed, 95% CI) | ‐2.74 [‐5.27, ‐0.21] |
| 3.12 Placebo Day 5 | 1 | 45 | Mean Difference (Fixed, 95% CI) | ‐1.85 [‐3.56, ‐0.14] |
| 4 Children's sleep (mean reduction in cough impact on sleep score) Show forest plot | 4 | Mean Difference (Random, 95% CI) | Subtotals only | |
| 4.1 Honey | 4 | 357 | Mean Difference (Random, 95% CI) | ‐2.23 [‐2.87, ‐1.59] |
| 4.2 Dextromethorphan | 2 | 74 | Mean Difference (Random, 95% CI) | ‐1.75 [‐2.46, ‐1.04] |
| 4.3 Diphenhydramine | 1 | 40 | Mean Difference (Random, 95% CI) | ‐1.64 [‐2.58, ‐0.70] |
| 4.4 No treatment | 2 | 79 | Mean Difference (Random, 95% CI) | ‐1.28 [‐1.81, ‐0.76] |
| 4.5 Placebo | 2 | 120 | Mean Difference (Random, 95% CI) | ‐1.03 [‐2.05, 0.00] |
| 4.6 Salbutamol Day 5 | 1 | 43 | Mean Difference (Random, 95% CI) | ‐2.47 [‐3.84, ‐1.10] |
| 4.7 African honey Day 5 | 1 | 57 | Mean Difference (Random, 95% CI) | ‐2.32 [‐3.63, ‐1.01] |
| 4.8 Placebo Day 5 | 1 | 45 | Mean Difference (Random, 95% CI) | ‐1.68 [‐2.63, ‐0.73] |
| 5 Parents' sleep (mean reduction in cough impact on sleep score) Show forest plot | 4 | Mean Difference (Fixed, 95% CI) | Subtotals only | |
| 5.1 Honey | 4 | 357 | Mean Difference (Fixed, 95% CI) | ‐2.25 [‐2.89, ‐1.61] |
| 5.2 Dextromethorphan | 2 | 74 | Mean Difference (Fixed, 95% CI) | ‐1.97 [‐2.77, ‐1.17] |
| 5.3 Diphenhydramine | 1 | 40 | Mean Difference (Fixed, 95% CI) | ‐1.89 [‐2.97, ‐0.81] |
| 5.4 No treatment | 2 | 79 | Mean Difference (Fixed, 95% CI) | ‐1.46 [‐2.06, ‐0.87] |
| 5.5 Placebo | 2 | 120 | Mean Difference (Fixed, 95% CI) | ‐1.44 [‐2.28, ‐0.61] |
| 5.6 Salbutamol Day 5 | 1 | 43 | Mean Difference (Fixed, 95% CI) | ‐2.33 [‐3.91, ‐0.75] |
| 5.7 African honey Day 5 | 1 | 57 | Mean Difference (Fixed, 95% CI) | ‐2.29 [‐3.86, ‐0.72] |
| 5.8 Placebo Day 5 | 1 | 45 | Mean Difference (Fixed, 95% CI) | ‐1.54 [‐2.60, ‐0.48] |
| 6 Combined reduction in symptoms score Show forest plot | 3 | Mean Difference (Fixed, 95% CI) | Subtotals only | |
| 6.1 Honey | 3 | 317 | Mean Difference (Fixed, 95% CI) | ‐10.60 [‐14.43, ‐6.77] |
| 6.2 Dextromethorphan | 1 | 34 | Mean Difference (Fixed, 95% CI) | ‐8.39 [‐10.95, ‐5.84] |
| 6.3 No treatment | 1 | 39 | Mean Difference (Fixed, 95% CI) | ‐6.41 [‐8.82, ‐3.99] |
| 6.4 Placebo | 2 | 132 | Mean Difference (Fixed, 95% CI) | ‐7.11 [‐10.78, ‐3.44] |
| 6.5 Honey Day 5 | 1 | 57 | Mean Difference (Fixed, 95% CI) | ‐12.68 [‐14.06, ‐11.30] |
| 6.6 Placebo Day 5 | 1 | 45 | Mean Difference (Fixed, 95% CI) | ‐8.69 [‐14.17, ‐3.21] |
| 6.7 Salbutamol Day 5 | 1 | 43 | Mean Difference (Fixed, 95% CI) | ‐11.37 [‐17.55, ‐5.19] |
| Outcome or subgroup title | No. of studies | No. of participants | Statistical method | Effect size |
| 1 Honey versus dextromethorphan Show forest plot | 2 | Risk Ratio (M‐H, Fixed, 95% CI) | Subtotals only | |
| 1.1 Nervousness, insomnia, hyperactivity | 2 | 149 | Risk Ratio (M‐H, Fixed, 95% CI) | 2.94 [0.74, 11.71] |
| 1.2 Stomachache, nausea, and vomiting | 1 | 69 | Risk Ratio (M‐H, Fixed, 95% CI) | 4.86 [0.24, 97.69] |
| 1.3 Drowsiness | 1 | 69 | Risk Ratio (M‐H, Fixed, 95% CI) | 2.92 [0.12, 69.20] |
| 2 Honey versus diphenhydramine Show forest plot | 1 | 80 | Risk Ratio (M‐H, Fixed, 95% CI) | 0.14 [0.01, 2.68] |
| 2.1 Somnolence | 1 | 80 | Risk Ratio (M‐H, Fixed, 95% CI) | 0.14 [0.01, 2.68] |
| 3 Honey versus placebo Show forest plot | 2 | Risk Ratio (M‐H, Fixed, 95% CI) | Subtotals only | |
| 3.1 Stomachache, nausea, and vomiting | 2 | 402 | Risk Ratio (M‐H, Fixed, 95% CI) | 1.91 [1.12, 3.24] |
| 3.2 Diarrhoea | 1 | 102 | Risk Ratio (M‐H, Fixed, 95% CI) | 0.92 [0.33, 2.55] |
| 3.3 Tachycardia | 1 | 102 | Risk Ratio (M‐H, Fixed, 95% CI) | 1.58 [0.15, 16.86] |
| 4 Honey versus salbutamol Show forest plot | 1 | Risk Ratio (M‐H, Random, 95% CI) | Subtotals only | |
| 4.1 Stomachache, nausea, and vomiting | 1 | 100 | Risk Ratio (M‐H, Random, 95% CI) | 1.74 [1.04, 2.92] |
| 4.2 Rash | 1 | 100 | Risk Ratio (M‐H, Random, 95% CI) | 0.19 [0.02, 1.63] |
| 4.3 Tachycardia | 1 | 100 | Risk Ratio (M‐H, Random, 95% CI) | 1.51 [0.14, 16.10] |
| 4.4 Diarrhoea | 1 | 100 | Risk Ratio (M‐H, Random, 95% CI) | 0.59 [0.24, 1.45] |
| 5 Honey versus no treatment Show forest plot | 2 | 302 | Odds Ratio (M‐H, Fixed, 95% CI) | 6.99 [1.55, 31.58] |
| 5.1 Nervousness, insomnia, hyperactivity | 2 | 154 | Odds Ratio (M‐H, Fixed, 95% CI) | 9.40 [1.16, 76.20] |
| 5.2 Stomachache, nausea, and vomiting | 1 | 74 | Odds Ratio (M‐H, Fixed, 95% CI) | 5.90 [0.27, 127.14] |
| 5.3 Drowsiness | 1 | 74 | Odds Ratio (M‐H, Fixed, 95% CI) | 3.43 [0.14, 87.09] |