Omega‐3 fatty acids for the primary and secondary prevention of cardiovascular disease
Referencias
References to studies included in this review
References to studies excluded from this review
References to ongoing studies
Additional references
References to other published versions of this review
Characteristics of studies
Characteristics of included studies [ordered by study ID]
| Methods | Alzheimer's Disease Cooperative Study (ADCS) RCT, parallel, (n‐3 DHA vs n‐6 LA), 18 months Summary risk of bias: low | |
| Participants | Individuals with mild to moderate Alzheimer's disease N: 238 intervention, 164 control Level of risk for CVD: low Men: 52.9% intervention, 40.2% control Mean age in years (SD): 76 (9.3) intervention, 76 (7.8) control Age range: unclear Smokers: 24.4% intervention, 21.9% control Hypertension: not reported Medications taken by at least 50% of those in the control group: cholinesterase inhibitor, memantine Medications taken by 20%‐49% of those in the control group: none Medications taken by some, but less than 20% of the control group: none Location: USA Ethnicity: not reported | |
| Interventions | Type: supplement (capsule) Comparison: DHA vs omega 6 Intervention: 2 × 1 g algal‐derived DHA capsules (Neuromins) per day for a total daily dose of 2 g, each capsule contain 45% to 55% of DHA and does not contain EPA (950 mg soft‐gel capsules which contain approximately 510 mg DHA). Dose: +DHA 1.02 g/d. Control: 2 × 1 g placebo capsules per day (made up of corn or soy oil) Compliance: measured by pill counts at every visit Length of intervention: 18 months | |
| Outcomes | Main study outcome: change in the cognitive subscale of the Alzheimer's Disease Assessment Scale (ADAS‐cog) and change in the Clinical Dementia Rating (CDR) Dropouts: 67 intervention, 40 control (discontinued treatment but included in main analyses) Available outcomes: mortality, measures of cognition, baseline & change in plasma DHA, adverse events Response to contact: no data provided | |
| Notes | Study funding; quote: "grant UO1‐AG10483 from the National Institute on Aging. The National Institute on Aging was not otherwise involved in the design and conduct of the study, or in the analysis of data or preparation of the manuscript". "The placebo and DHA study drugs were provided by Martek Biosciences. Martek also provided plasma and cerebrospinal fluid measurements of fatty acids, as well as partial financial support for the magnetic resonance imaging sub study. (Martek Biosciences produces nutritional supplements from cultivated fungi and microalgae). Martek employees participated in design of the study and in revision of the manuscript, but were not involved in data management or data analysis." (Quinn 2010, p. 1910). | |
| Risk of bias | ||
| Bias | Authors' judgement | Support for judgement |
| Random sequence generation (selection bias) | Low risk | Randomisation was achieved with a centralised interactive voice response system, using a block design with a block size of 5 (3 in the DHA group and 2 in the placebo group. |
| Allocation concealment (selection bias) | Low risk | Randomisation was achieved with a centralised interactive voice response system, using a block design with a block size of 5 (3 in the DHA group and 2 in the placebo group. |
| Blinding of participants and personnel (performance bias) | Low risk | Placebo capsules (made up of corn or soy oil) were identical in appearance. The adequacy of blinding was assessed by questionnaires completed by caregivers, study coordinators, and site physicians. |
| Blinding of outcome assessment (detection bias) | Low risk | The adequacy of blinding was assessed by questionnaires completed by caregivers, study coordinators, and site physicians with results showing no difference between groups and the majority did not know. |
| Incomplete outcome data (attrition bias) | Low risk | Intention‐to‐treat analysis. At 12 months data were available for > 80% (ITT analysis) |
| Selective reporting (reporting bias) | Low risk | Prospectively registered February 2007, study started February 2007, completed May 2009. Primary outcomes were rate of change in ADAS‐Cog11 and CDR‐SOB, which are both reported in main report. NPI and ADL were secondary outcomes also reported. |
| Attention | Low risk | Both study arms had the same follow‐up and care. |
| Compliance | Unclear risk | Measured by pill count at every visit. 28% intervention and 24% control discontinued supplement with a minority discontinuing due to adverse events. A further 8% were excluded for < 80% compliance in both intervention and control arms. |
| Other bias | Low risk | None noted |
| Methods | Multi‐center study to evaluate the effect of n‐3 fatty acids on arrhythmia recurrence in atrial fibrillation (AFFORD) RCT, parallel, (n‐3 EPA + DHA vs n‐6), 12 months Summary risk of bias: moderate or high | |
| Participants | People with symptomatic paroxysmal or persistent AF N: 165 intervention, 172 control. (analysed, intervention: 153 control: 163) Level of risk for CVD: high Men: 69% intervention, 65% control Mean age in years (SD): 60 (12) intervention, 62 (13) control Age range: not reported Smokers: not reported Hypertension: 45% intervention, 42% control Medications taken by at least 50% of those in the control group: oral anticoagulant Medications taken by 20%‐49%: beta‐blockers, angiotensin‐converting enzyme inhibitors, angiotensin receptor blockers Medications taken by some, but < 20%: none Location: Canada Ethnicity: not reported | |
| Interventions | Type: supplement (fish oil) Comparison: EPA + DHA vs omega 6 safflower oil Intervention: 4 × 1 g enteric‐coated fish oil capsules/d (1.6 g/d EPA + 0.8 g/d DHA, Genuine Health, Toronto, Ontario, Canada). Dose: +2.4 g/d EPA + DHA, Compliance: omega‐3 index increased in intervention group, but not control, over the study Duration of intervention: 6 to 16 months | |
| Outcomes | Main study outcome: AF recurrence Dropouts: 21 intervention, 19 control Available outcomes: all‐cause mortality, stroke, AF recurrence,TIA, CV events, CRP (not usable) Response to contact: no | |
| Notes | Authors contacted about QoL, resource use and dietary habits Study funding: Canadian Institutes for Health Research and the Heart and Stroke Foundation of Quebec | |
| Risk of bias | ||
| Bias | Authors' judgement | Support for judgement |
| Random sequence generation (selection bias) | Unclear risk | "[R]andomised" |
| Allocation concealment (selection bias) | Unclear risk | Not described |
| Blinding of participants and personnel (performance bias) | Unclear risk | Described as double‐blind, but blinding not described or tested |
| Blinding of outcome assessment (detection bias) | Unclear risk | An independent events committee adjudicated AF recurrences, bleeding, strokes, transient ischemic attacks, and deaths, but unclear if blinded to allocation. |
| Incomplete outcome data (attrition bias) | Low risk | Participant flow well described. ITT analysis |
| Selective reporting (reporting bias) | High risk | NCT01235130 registered July 2010, recruitment March 2009‐March 2012, follow‐up finished December 2012. Results published 2014, but no data on quality of life, resource utilisation, or dietary habits (stated in registry) found |
| Attention | Low risk | No problem with attention bias |
| Compliance | Low risk | Omega‐3 index measured |
| Other bias | Low risk | None noted |
| Methods | RCT, parallel, (EPA + DHA + statins vs statins), 12 months Summary risk of bias: moderate to high | |
| Participants | Statin treated CAD patients undergoing PCI N: 38 intervention, 36 control Level of risk for CVD: high Men: 63.2% intervention, 72.2% control Mean age in years (SD): 59.6 (9.1) intervention, 60.7 (0.8) [sic] control Age range: unclear Smokers: 36.8% intervention, 58.3% control Hypertension: 50% in both groups Medications taken by at least 50% of those in the control group: aspirin, clopidogrel, ACE inhibitors/ARB, beta‐blockers, atorvastatin Medications taken by 20%‐49% of those in the control group: cilostazol Medications taken by some, but less than 20% of the control group: rosuvastatin, nitrates, calcium antagonists Location: South Korea Ethnicity: not reported | |
| Interventions | Type: supplement (capsule) Comparison: EPA + DHA vs unclear (nil) Intervention: 3 g of ω‐3 PUFA containing 1395 mg of EPA and 1125 mg of DHA per day. No further details. Dose: +2.52 g/d EPA + DHA Control: unclear whether control group were given placebo or only statins Compliance: unclear how it was measured but reported good compliance with no numbers Length of intervention: 12 months | |
| Outcomes | Main study outcome: change in atherosclerotic burden Dropouts: none Available outcomes: lipids (TG reported as median, IQR so not used), atheroma volume, neointimal volume index Response to contact: no | |
| Notes | Study funding: the study was supported by clinical research grant from Pusan National University Hospital | |
| Risk of bias | ||
| Bias | Authors' judgement | Support for judgement |
| Random sequence generation (selection bias) | Low risk | Simple randomisation was carried out using random number tables to assign each participant to the intervention or control group |
| Allocation concealment (selection bias) | Low risk | Participants were assigned randomisation numbers sequentially on recruitment to the study, and the randomisation codes were retained by the clinical research coordinator. |
| Blinding of participants and personnel (performance bias) | Unclear risk | No details |
| Blinding of outcome assessment (detection bias) | Low risk | The personnel responsible for randomisation as well as those performing laboratory measurements were blinded to the randomisation assignments. |
| Incomplete outcome data (attrition bias) | Low risk | No dropouts reported |
| Selective reporting (reporting bias) | Unclear risk | No protocol or trial register entry found |
| Attention | Unclear risk | No details |
| Compliance | Unclear risk | No details on how it was measured and no fatty acid levels reported |
| Other bias | High risk | It's unclear whether the study was placebo controlled or the control group had no intervention. Also, some of the SDs appear to be incorrectly reported. |
| Methods | RCT, (n‐3 ALA vs MUFA), 40 months Summary risk of bias: low | |
| Participants | 60‐80 year‐olds with previous MI N: 1197 ALA intervention, 1236 control (1212 ALA + EPA/DHA intervention group) Level of risk for CVD: high Men: 77.9% intervention, 78.7% control Mean age in years (SD): 69.0 (5.6) intervention, 68.9 (5.6) control Age range: 60‐80 years Smokers: 17.4% intervention, 18% control Hypertension: unclear Medications taken by at least 50% of those in the control group: lipid lowering medication, antihypertensives, antithrombotics Medications taken by 20%‐49% of those in the control group: not reported Medications taken by some, but less than 20% of the control group: antiarrythmic drugs, antidiabetic drugs Location: the Netherlands Ethnicty: not reported | |
| Interventions | Type: supplementary margarine Comparsion: ALA vs MUFA Compliance: unused margarine tubs were returned‐ daily intakes of margarine and n‐3 fatty acids were calculated on the basis of the amount unused. Adherence was measured by levels of fatty acids in plasma cholesteryl esters, margarine and questionnaires. 90.5% of patients adhered to the protocol and consumed 20.6 (SD 2.8) g of margarine/d. Length of intervention: 40 months | |
| Outcomes | Main study outcome: cardiovascular disease events Dropouts: 91 died, 98 discontinued intervention, 93 died, 93 discontinued control Available outcomes: deaths, MI, cardiovascular events, ventricular arrhythmia, Incident cardiovascular disease Response to contact: yes (data provided) | |
| Notes | The study has 3 intervention arms (ALA margarine, EPA/DHA margarine, mixture of the two interventions). This table represents the ALA only intervention. Outcome data is used for the ALA group where reported separately or for the combined (ALA arm, ALA + EPA/DHA arm) Study funding: Netherlands Heart Foundation, National Institutes of Health and Unilever R&D (latter provided unrestricted grant for distribution of trial margarines) | |
| Risk of bias | ||
| Bias | Authors' judgement | Support for judgement |
| Random sequence generation (selection bias) | Low risk | On the computer by a random number generator before the start of the trial |
| Allocation concealment (selection bias) | Low risk | Author confirmed allocation was concealed from clinicians/ researchers |
| Blinding of participants and personnel (performance bias) | Low risk | The 4 types of margarine were "similar in taste, texture and colour". A trained test panel did not perceive a fishy taste or odour. Randomisation tables were stored safely under supervision. |
| Blinding of outcome assessment (detection bias) | Low risk | Randomisation tables were stored safely under supervision. There was an independent statistician for data analysis. Quote: "Events were coded by three members of the end‐point adjudication committee who were unaware of the identity of the patient, the identity of the treating physician and the patients assigned study group". |
| Incomplete outcome data (attrition bias) | Low risk | All patients were followed up for events computerised linkage with municipal registries. 2531 patients were only followed up for baseline anthropometric and medical measurements. |
| Selective reporting (reporting bias) | High risk | Sudden cardiac death endpoint omitted. Registered in August 2005, recruitment was from 2002 to 2006. Outcomes papers published in 2010 |
| Attention | Low risk | All participants appear to have had similar frequency and quantity of attention and follow‐up |
| Compliance | Low risk | Unused margarine tubs were returned; daily intakes of margarine and n‐3 fatty acids were calculated on the basis of the amount unused. Adherence was measured by levels of fatty acids in plasma cholesteryl esters, margarine and questionnaires. 90.5% of patients adhered to the protocol and consumed 20.6 (SD 2.8) g of margarine/d |
| Other bias | Low risk | None noted |
| Methods | RCT, (EPA + DHA vs MUFA), 40 months Summary risk of bias: low | |
| Participants | 60‐80 year‐olds with previous MI N: 1192 EPA/DHA intervention, 1236 control (1212 ALA + EPA/DHA intervention group) Level of risk for CVD: high Men: 78.1% intervention, 78.7% control Mean age in years (SD): 69.1 (5.6) intervention, 68.9 (5.6) control Age range: 60‐80 years Smokers: 16.8%, intervention, 18% control Hypertension: unclear Medications taken by at least 50% of those in the control group: lipid‐lowering medication, antihypertensives, antithrombotics Medications taken by 20%‐49% of those in the control group: not reported Medications taken by some, but less than 20% of the control group: antiarrythmic drugs, antidiabetic drugs Location: the Netherlands Ethnicty: not reported | |
| Interventions | Type: supplementary margarine Comparison 1: EPA + DHA vs MUFA Intervention: 20 g of enriched margarine per day incorporating 400 mg EPA‐DHA (240 mg EPA and 160 mg DHA). Dose: average achieved 376 mg/d EPA + DHA Compliance: unused margarine tubs were returned; daily intakes of margarine and n‐3 fatty acids were calculated on the basis of the amount unused. Adherence was measured by levels of fatty acids in plasma cholesteryl esters, margarine and questionnaires. 90.5% of patients adhered to the protocol. Length of intervention: 40 months | |
| Outcomes | Main study outcome: cardiovascular disease events | |
| Notes | The study has three intervention arms (ALA margarine, EPA/DHA margarine, mixture of the two interventions). This table represents theEPA/DHA only intervention. Outcome data is used for the EPA/DHA group where available or for the combined (EPA/DHA arm, EPA/DHA + ALA arm) Study funding: Netherlands Heart Foundation, National Institutes of Health and Unilever R&D (latter provided unrestricted grant for distribution of trial margarines) | |
| Risk of bias | ||
| Bias | Authors' judgement | Support for judgement |
| Random sequence generation (selection bias) | Low risk | On the computer by a random number generator before the start of the trial |
| Allocation concealment (selection bias) | Low risk | Author confirmed allocation was concealed from clinicians/ researchers |
| Blinding of participants and personnel (performance bias) | Low risk | The 4 types of margarine were "similar in taste, texture and colour". A trained test panel did not perceive a fishy taste or odour. Randomisation tables were stored safely under supervision. |
| Blinding of outcome assessment (detection bias) | Low risk | Randomisation tables were stored safely under supervision. There was an independent statistician for data analysis. Quote: "Events were coded by three members of the end‐point adjudication committee who were unaware of the identity of the patient, the identity of the treating physician and the patients assigned study group". |
| Incomplete outcome data (attrition bias) | Low risk | All patients were followed up for events computerised linkage with municipal registries. 2531 patients were only followed up for baseline anthropometric and medical measurements. |
| Selective reporting (reporting bias) | High risk | Sudden cardiac death endpoint omitted. Registered from August 2005, recruitment was from 2002 to 2006. Outcomes papers published in 2010 |
| Attention | Low risk | All participants appear to have had similar frequency and quantity of attention and follow‐up |
| Compliance | Low risk | Unused margarine tubs were returned; daily intakes of margarine and n‐3 fatty acids were calculated on the basis of the amount unused. Adherence was measured by levels of fatty acids in plasma cholesteryl esters, margarine and questionnaires. 90.5% of patients adhered to the protocol and consumed 20.6 (SD 2.8) g of margarine/d |
| Other bias | Low risk | None noted |
| Methods | Age‐Related Eye Disease Study 2 (AREDS2) RCT, parallel, 2 × 2 factorial (n‐3 EPA + DHA vs nil) also randomised to lutein and zeaxanthin vs nil), 5 years | |
| Participants | People aged 50‐85 years at high risk of progression to advanced age‐related macular degeneration (AMD) N: 2147 intervention (1068 DHA/EPA, 1079 DHA/EPA + lutein/zeaxanthin), 2056 control (1012 placebo, 1044 lutein/zeaxanthin) Level of risk for CVD: low (however ˜20% had previous CV event) Men: intervention 42.1%, control 44.4% Age in years: intervention median 74.6 (IQR 11.1), control median 74 (IQR 11.1) Age range: 68‐79 years Smokers: intervention 6.3%, control 7.2% Hypertension: unclear Medications taken by at least 50% of those in the control group: multivitamins Medications taken by 20%‐49% of those in the control group: cholesterol lowering drugs, aspirin Medications taken by some, but less than 20% of the control group: NSAID, paracetamol Location: USA Ethnicty: white 96.5% intervention, 96.6% control; Hispanic: 2.6 intervention, 1.3 control | |
| Interventions | Type: supplement (capsule) Comparison: EPA + DHA vs nil Intervention 350 mg/d DHA plus 650 mg/d EPA added to the standard AREDS supplement of Vitamin C (500 mg/d), Vitamin E (440 IU/d), beta‐carotene (15 mg/d), zinc oxide (80 mg/d) and cupric oxide (2 mg/d). Dose: +1 g/d EPA + DHA Control: standard AREDS supplement of Vitamin C (500 mg/d), Vitamin E (400IU/d), beta‐carotene (15 mg/d), zinc oxide (80 mg/d) and cupric oxide (2 mg/d). Length of intervention: 60 months | |
| Outcomes | Main study outcome: development of advanced AMD Available outcomes: deaths, cardiovascular death, MI, stroke, angina, heart failure, revascularisation, cognition, eye health, (authors provided data on diabetes diagnosis, depression diagnosis, breast cancer) Response to contact: yes (data provided) | |
| Notes | Study funding: National Eye Institute/National Institutes of Health, Department of Health and Human Services | |
| Risk of bias | ||
| Bias | Authors' judgement | Support for judgement |
| Random sequence generation (selection bias) | Low risk | Quote: "random block design was implemented using the AREDS2 Advantage Electronic Data Capture system by the AREDS2 Coordinating Center" |
| Allocation concealment (selection bias) | Low risk | Each treatment was assigned 5 bottle numbers. Bottle numbers were issued via an electronic randomisation system for each participant once study eligibility was verified. The assigned bottle number was used to distribute the study treatment(s). AREDS2 Coordinating centre personnel involved in creating the randomisation system had access to the bottle number/treatment assignments. |
| Blinding of participants and personnel (performance bias) | Low risk | "Participants, investigators, study coordinators, and all other study personnel are masked to treatment assignment". However, no information was given regarding the taste, smell, or appearance of the active or placebo capsules. |
| Blinding of outcome assessment (detection bias) | Low risk | The coordinating centre randomly assigned the event to a study adjudicator, who made the final determination of these study endpoints through review of the medical records and applying the endpoint criterion defined a priori. All adjudicators were masked to study assignment. |
| Incomplete outcome data (attrition bias) | Low risk | < 20% attrition over 5 years, balanced reasons for dropouts |
| Selective reporting (reporting bias) | Low risk | Outcomes in trials registry entry appear to all be reported (NCT00345176). Entry received June 2006, recruitment September 2006 – October 2012 |
| Attention | Low risk | Participants, investigators, study coordinators, and all other study personnel are masked to treatment assignment, so attention bias not feasible |
| Compliance | Unclear risk | Assessed by pill count – 84% of participants in each group took at least 75% of study medications |
| Other bias | Low risk | None noted |
| Methods | RCT, (n‐3 EPA + DHA vs MUFA), 24 months Summary risk of bias: moderate or high | |
| Participants | 45‐70 year olds with combined hyperlipoproteinaemia N: 32 intervention, 32 control Level of risk for CVD: moderate Men: 29% intervention, 29% control Mean age in years (SD): 53.7 (7.2) intervention, 53.7 (6.9) control Age range: 45‐70 years (inclusion) Smokers: 28.1% intervention, 28.1% control Hypertension: none (exclusion criteria) Medications taken by at least 50% of those in the control group: not reported Medications taken by 20%‐49% of those in the control group: not reported Medications taken by some, but less than 20% of the control group: not reported (patients on HRT, anti‐hypertensive drugs, lipid lowering drugs, or who smoked > 10 cigarettes were excluded) Location: Italy Ethnicty: not reported | |
| Interventions | Type: capsules Comparsion: LCn3 vs MUFA Control: 1 g × 6 opaque identical soft gelatin capsules/d of olive oil divided in 3 doses. Compliance: assessed by counting returned capsules at each visit and by measuring EPA and DHA levels at month 24 Length of intervention: 24 months | |
| Outcomes | Main study outcome: carotid atherosclerosis measures Dropouts: 2 intervention, 5 control Available outcomes: deaths (nil), MI (lipids, weight, BP and heart rate reported but not in a usable format; lipid data were presented at various times without clear numerical data, suggesting falls in TGs in the intervention but not control arms, and rises in LDL and HDL cholesterol in intervention but not control arms. For the other outcomes the text states "a rise in body weight (+ 3%, P < 0.01) was observed at the end of the study in both groups. Blood pressure and heart rate were unchanged". Effects on IMT and platelets also reported but not used) Response to contact: not yet attempted | |
| Notes | Study funding: supported by Institut De Recherche Pierre Fabre, Departement Recherche Clinique | |
| Risk of bias | ||
| Bias | Authors' judgement | Support for judgement |
| Random sequence generation (selection bias) | Low risk | An appropriate software was used to obtain 2 groups balanced for sex, age and smoking |
| Allocation concealment (selection bias) | Unclear risk | No further details |
| Blinding of participants and personnel (performance bias) | Unclear risk | Double‐blind and placebo capsules were opaque and identical looking to intervention. However no information provided on capsules taste or smell |
| Blinding of outcome assessment (detection bias) | Unclear risk | No details |
| Incomplete outcome data (attrition bias) | Low risk | All dropouts are accounted for. "One patient left the study after 3 months because he moved to another city and was therefore excluded from statistical analyses. Two patients were excluded because of major deviation from the protocol during the follow‐up (anti‐hypertensive assumption) and four because of non‐compliance on the basis of returning capsules (compliance < 70%). The final analysed group included 57 patients (30 on active treatment)." |
| Selective reporting (reporting bias) | Unclear risk | No protocol or trial register record |
| Attention | Low risk | Both groups had the same contact and number of visits. |
| Compliance | Low risk | Pill count, we know they excluded 4/64 who returned > 70% of capsules. So 60/64 had > 70% compliance with significant increase in serum EPA and DHA in the intervention group. |
| Other bias | Low risk | None noted |
| Methods | RCT, parallel, (n‐3 EPA + DHA vs MUFA), 24 months Summary risk of bias: moderate or high | |
| Participants | People with multiple sclerosis N: 155 intervention, 157 control. (analysed, intervention: 145 control: 147) Level of risk for CVD: low Men: 34.2% intervention, 30.6% control Mean age in years (SD): 34.0 (6.6) intervention, 33.7 (6.3) control Age range: not reported but 16‐45 years inclusion criteria Smokers: not reported Hypertension: not reported Medications taken by at least 50% of those in the control group: not reported Medications taken by 20%‐49%: not reported Medications taken by some, but < 20%: not reported Location: UK Ethnicity: not reported | |
| Interventions | Type: supplement (fish oil capsule) Comparison: EPA + DHA vs MUFA Intervention: 20 × 0.5 g/d capsules MaxEPA fish body oil (10 g/d fish oil providing 1.71 g/d EPA +1.14 g/d DHA +10 IU/d vitamin E), plus all advised to reduce animal fat and ensure plentiful omega‐6 fats. Dose: +2.85 g/d EPA + DHA Control: 20 × 0.5 g/d capsules olive oil (10 g/d olive oil), plus all advised to reduce animal fat and ensure plentiful omega‐6 fats. All capsules contained 0.5 IU vit E and 100 ppm dodecyl gallate to minimise peroxide formation Compliance: serum EPA and DHA rose in intervention group but fell in controls Duration of intervention: 24 months (5 years mentioned but outcomes not reported) | |
| Outcomes | Main study outcome: multiple sclerosis progress Dropouts: 10 intervention, 10 control Available outcomes: all‐cause mortality, progress of MS, rate of MS relapse Response to contact: yes (no data provided) | |
| Notes | Study funding: Multiple Sclerosis Society of Great Britain and Northern Ireland, but Marfleet Refining provided fish oil and placebo capsules | |
| Risk of bias | ||
| Bias | Authors' judgement | Support for judgement |
| Random sequence generation (selection bias) | Unclear risk | Quote: "randomised" |
| Allocation concealment (selection bias) | Unclear risk | No further details |
| Blinding of participants and personnel (performance bias) | Low risk | Paper states research was "double blind" and control capsules "had the same appearance and flavour as the fish oil capsules and were packed and dispensed in identical fashion" |
| Blinding of outcome assessment (detection bias) | Unclear risk | Not stated |
| Incomplete outcome data (attrition bias) | Low risk | Low risk at reported time points |
| Selective reporting (reporting bias) | High risk | No protocol or trials registration entries found. Study was intended to run for 5 years, but outcomes only appear to be reported for the first 2 years. |
| Attention | Low risk | Unlikely as each had capsules |
| Compliance | Low risk | Serum EPA and DHA rose in intervention group but fell in controls |
| Other bias | Low risk | Not noted |
| Methods | RCT, parallel, (n‐3 DHA vs n‐6 LA), 48 months Summary risk of bias: low | |
| Participants | People with retinitis pigmentosa aged 18‐55 years N: 221 randomised overall, analysed 105 intervention, 103 control Level of risk for CVD: low Men: 48% intervention, 54% control Mean age in years (SD): 37.8 (6.5) intervention, 36.0 (7.2) control Age range: unclear (18‐55 inclusion criterion) Smokers: not reported Hypertension: not reported Medications taken by at least 50% of those in the control group: vitamin A Medications taken by 20%‐49% of those in the control group: multivitamins Medications taken by some, but less than 20% of the control group: not reported Location: USA Ethnicity: unclear (6% of the study population were minorities) | |
| Interventions | Type: supplement (DHA capsules) Comparison: DHA vs omega 6 Intervention: 6 × 500 mg capsules/d of DHA (1.2 g/d DHA plus 1.8 g vegetable oil) plus < 0.0006 mg/d tocopherols plus 15,000 IU retinyl palmitate (vitamin A). Dose: +1.2 g/d DHA Control: 6 × 500 mg capsules/d of soy and corn oils (half each) with 120 mg/d ALA, plus < 0.0006 mg/d tocopherols plus 15000 IU retinyl palmitate (vitamin A) Compliance: 92% of capsules taken by both intervention and control groups (assessed by monthly calendars), Plasma DHA much higher in intervention than control Length of intervention: 48 months | |
| Outcomes | Main study outcome: retinal degeneration Dropouts: 5 or 6 intervention, 7 or 8 control Available outcomes: mortality, cancer diagnoses, lipids, eyesight Response to contact: yes (no data provided) | |
| Notes | Study funding: National Eye Institute and Foundation Fighting Blindness | |
| Risk of bias | ||
| Bias | Authors' judgement | Support for judgement |
| Random sequence generation (selection bias) | Low risk | Computer‐generated random numbers |
| Allocation concealment (selection bias) | Low risk | Random numbers available only to programmer who provided assignments to data manager, all staff in contact with patients were masked to group assignment |
| Blinding of participants and personnel (performance bias) | Low risk | States that all staff in contact with participants were masked to group assignment, as were participants. However no information was provided regarding the taste, smell and appearance of the active and placebo capsules |
| Blinding of outcome assessment (detection bias) | Low risk | All assessments were performed blind to study allocation. Each ocular examination was performed without review of previous records. All serum samples were analysed without knowledge of treatment group assignment. |
| Incomplete outcome data (attrition bias) | Unclear risk | Numbers of dropouts and reasons for dropouts not stated. 221 participants randomised, data presented on 208 participants |
| Selective reporting (reporting bias) | Unclear risk | No trials registry entry or protocol found. |
| Attention | Low risk | Staff in contact with patients were masked, so unable to bias time, etc. |
| Compliance | Low risk | 92% of capsules taken by both intervention and control groups (assessed by monthly calendars), Plasma DHA much higher in intervention than control |
| Other bias | Low risk | None noted |
| Methods | RCT, parallel, 3 arms (n‐3 EPA + DHA from cod liver vs n‐3 EPA + DHA from seal oil vs nil), 14 months | |
| Participants | Subjects with moderate hypercholesterolaemia N: 40 seal oil (SO), 40 cod liver oil (CLO), 40 control (numbers analysed vary by outcome) Level of risk for CVD: moderate (dyslipidaemia) Men: 53% seal oil, 50% cod liver oil, 48% control Mean age in years: 53.2 seal oil, 55.0 cod liver oil, 55.8 control Age range: 43‐66 years Smokers: unclear Hypertension: unclear Medications taken by at least 50% of those in the control group: none allowed Medications taken by 20%‐49% of those in the control group: not reported Medications taken by some, but less than 20% of the control group: not reported Location: Norway Ethnicity: not reported | |
| Interventions | Type: supplement (oil) Comparison: EPA + DHA vs nil Intervention: Intervention: seal oil – 15 mL/d (2.6 g, 1.1 g/d EPA + 1.5/d DHA) (total n‐3 3.9 g/d, total PUFA 4.2 g/d): SO dose: EPA + DHA 2.6 g/d Cod liver oil – 15 mL/d (3.3 g, 1.5 g /d EPA + 1.8 g/d DHA) (total n‐3 4.1 g/d, total PUFA 4.35 g/d): CLO dose: EPA + DHA 3.3 g/d Control: nil, no supplement Compliance: serum omega‐3 fatty acids, rose from around 1 mmoL/L to 2.4 (seal oil), 2.1 (cod liver oil) and 1.2 mmoL/L (control) Length of intervention: 14 months | |
| Outcomes | Main study outcome: serum lipids Dropouts: 8 seal oil, 2 cod liver oil, 1 control Available outcomes: total and cardiovascular deaths, MI, combined CV events, lipids, adverse events Response to contact: yes (author provided methodological details) | |
| Notes | Data of two intervention groups combined for dichotomous outcomes and CLO vs control data used for continuous outcomes Study funding: the study was supported by the programme Medical Research in Finnmark County, University of Tromsø | |
| Risk of bias | ||
| Bias | Authors' judgement | Support for judgement |
| Random sequence generation (selection bias) | Low risk | J Brox stated (personal communication, January 2017): "The randomization of the 120 participants was done by first generating 3 groups (seal oil, cod liver oil, control), then giving each participant a number (1‐120), "'putting all the numbers into the same hat' and blindly drawing one number at the time from the hat. The first 40 numbers (1‐40) were allocated to the seal oil group, the next 40 numbers (41‐80) to the cod liver oil group and the rest (81‐120) were allocated to the control group." |
| Allocation concealment (selection bias) | Low risk | J Brox stated (personal communication, January 2017): "The researcher/clinician who invited the participants had no knowledge of to which group the participants would be allocated." |
| Blinding of participants and personnel (performance bias) | High risk | Quote: "controls were aware – not given a supplement" |
| Blinding of outcome assessment (detection bias) | Low risk | J Brox stated (personal communication, 2003): "All the persons involved in the drawing & analysing of blood were unaware of treatment. The technicians analysing the blood did not have any personal contact with the participants except K. Olaussen who did the FA analysis … she only had access to the sample numbers not names and code. The participants did not know their number (says elsewhere that K Olaussen did not know allocations). The only outcome assessor was J Brox who did not have personal contact with participants, randomising, collecting results or analysing process." "The only assessor was J Brox who did not have any personal contact with the participants, had nothing to do with the randomising or analysing process, or the collecting of results." |
| Incomplete outcome data (attrition bias) | High risk | Control group 3 dropouts, seal oil group 10 dropouts, cod liver oil 3 dropouts. So substantial differences in rates of dropouts between the groups |
| Selective reporting (reporting bias) | Unclear risk | No study protocol or trials register entry was found |
| Attention | Low risk | No suggestion of differential attention |
| Compliance | Low risk | Serum omega‐3 fatty acids, rose from around 1 mmoL/L to 2.4 (seal oil), 2.1 (cod liver oil) and 1.2 mmoL/L (control) |
| Other bias | Low risk | No further bias noted |
| Methods | RCT, parallel, (n‐3 EPA + DHA vs n‐6 LA), 12 months Summary risk of bias: low | |
| Participants | Participants with non‐cirrhotic NASH (non‐alcoholic steatohepatitis) N: 20 intervention, 21 control (analysed 17 intervention, 17 control) Level of risk for CVD: moderate Men: 35.3% intervention, 41.2% control Mean age in years (SD): 46.4 (12.1) intervention, 47.2 (12) control Age range: 25‐72 years Smokers: not reported Hypertension: not reported Medications taken by at least 50% of those in the control group: not reported Medications taken by 20%‐49% of those in the control group: not reported Medications taken by some, but less than 20% of the control group: not reported Location: USA Ethnicity: intervention, 100% white, control 94.% white, 5.9% other | |
| Interventions | Type: supplement (capsule) Comparison: EPA + DHA vs omega 6 Intervention: 3 × 1 g fish oil capsules/d (Nordic Natural) for a total 2.1 g/d n‐3, each capsule contained 70% of n‐3 (1050 mg EPA, 750 mg DHA + 300 mg other n‐3). Dose: 1.8 g/d EPA + DHA Control: 3 × 1 g identical placebo (soybean) capsules per day containing 8% fish oils Both groups had dietary counselling on caloric intake and physical activity Compliance: unclear (measured n‐6‐n‐3 ratio due to its link to hepatic lipid composition) Length of intervention: 12 months | |
| Outcomes | Main study outcome: NASH activity score Dropouts: 3 intervention, 3 control Available outcomes: lipids (TG too unbalanced at baseline to use), measures of adiposity (weight, BMI, visceral fat – all unbalanced at baseline so not used), fasting glucose, insulin, HOMA‐IR, QUICKI (also NASH progression, hepatic fat, ALT, VO2 max, activity level, markers of cell injury, adiponectin not used) Response to contact: yes, change data supplied for BMI and body weight, confirmed no deaths, cardiovascular events, diabetes, depression, breast cancer or IBD diagnoses | |
| Notes | Data on; BMI, weight, visceral fat, TG and glucose were not used as they were different between groups at baseline. Study funding: study was supported by NIH NCCAM Grant 5R21AT2901–2 and 5 M01 RR00847. Study medication and identical appearing placebo was provided at no charge by Nordic Natural. RBC phospholipid profile was performed by Metametrix (www.metametrix.com). M30, M65, adiponectin, and IGFBP‐1 electro chemiluminescence assays were performed by Wellstat Diagnostics (www.wellstatdiagnostics.com). | |
| Risk of bias | ||
| Bias | Authors' judgement | Support for judgement |
| Random sequence generation (selection bias) | Low risk | Participants were randomised to n‐3 or placebo using a stratified block 1:1 randomisation scheme. An independent biostatistician generated the randomisation list which was confidentially forwarded to the Investigational pharmacy |
| Allocation concealment (selection bias) | Low risk | As above |
| Blinding of participants and personnel (performance bias) | Low risk | All staff and subjects were blinded to therapy assignment throughout the study period. Both capsules were identical. However no information provided on capsules taste or smell |
| Blinding of outcome assessment (detection bias) | Low risk | Blinded for main outcome |
| Incomplete outcome data (attrition bias) | Low risk | 15% dropouts explained and equal in both groups |
| Selective reporting (reporting bias) | Low risk | The trial was prospectively registered |
| Attention | Low risk | Both groups had the same attention |
| Compliance | Unclear risk | No details on compliance measurement |
| Other bias | Low risk | None noted |
| Methods | Diet And Reinfarction Trial (DART) – oily fish advice (or capsule) arm RCT – parallel, 2 × 2 × 2 factorial (n‐3 EPA + DHA vs nil or fat advice vs not, oily fish advice (or capsule) vs not, dietary fibre advice vs not)), 2 years | |
| Participants | Men recovering from myocardial infarction N: 1015 intervention, 1018 Level of risk for CVD: high (post‐MI) Men: 100% Mean age, SD: 56.7 intervention, 56.4 control (SDs not stated) Age range: unclear Smokers: 61.7% intervention, 62.2% control Hypertension: 22.7% intervention, 24.6% control Medications taken by at least 50% of those in the control group: none reported Medications taken by 20%‐49%: beta‐blockers, other antihypertensives, antianginals Medications taken by some, but < 20%: anticoagulant, aspirin/antiplatelet, digoxin/antiarrhythmic Location: UK Ethnicity: not stated | |
| Interventions | Type: dietary advice (to eat more oily fish) Comparison: EPA + DHA vs SFA + MUFA (by dietary achievement below) Intervention: advised to eat at least 2 weekly portions of 200‐400 g fatty fish (mackerel, herring, kipper, pilchard, sardine, salmon, trout). If this was not possible, given MaxEPA capsules, 3/d (0.5 g EPA/d). 191/883 participants were taking MaxEPA at 2 years. Advice was reinforced 3‐monthly. Dose: aimed for 0.5 g/d EPA Control: No such dietary advice or capsules Compliance: 7 day weighed food diary of a random sub‐sample indicated intake of 2.5 g/week EPA intervention, 0.8 g/week EPA control Dietary achievements Total fat intake, %E (through study): control 35 (SD 6), intervention 31 (SD 7) (MD −4.00, 95% CI −4.57 to −3.43); significant reduction Saturated fat intake, %E (through study): control 15 (SD 3), intervention 11 (SD 3), (MD −4.00, 95% CI −4.26 to −3.74); significant reduction PUFA intake (through study), %E⁑: control 7 (SD unclear), intervention 9 (SD unclear), (MD 2.00, 95% CI 1.57 to 2.43 assuming SDs of 5) significant increase PUFA n‐3 intake: EPA, control 0.6 (SD 0.7) g/week, intervention 2.4 (SD 1.4) g/week PUFA n‐6 intake: not reported MUFA intake (through study), %E⁑: control 13 (SD unclear), intervention 11 (SD unclear) (MD −2.00, 95% CI −2.43 to −1.57 assuming SDs of 5); significant reduction CHO intake (through study), %E: control 44 (SD 6),intervention 46 (SD 7) (MD 2.00, 95% CI 1.43 to 2.57); significant increase Protein intake (through study), %E: control 17(SD 4), intervention 18 (SD 4) (MD 1.00, 95% CI 0.65 to 1.35); significant increase Trans fat intake: not reported Length of intervention: 24 months | |
| Outcomes | Main study outcome: total mortality, reinfarction, CHD death Dropouts: none for mortality Available outcomes: total and CV deaths, MI, CHD events, lipids, blood pressure, cancer deaths | |
| Notes | Some of each group were also advised on low fat and high PUFA and/or high fibre diets, all participants who smoked were advised to stop and all with a BMI > 30 kg/m2 were given weight reduction advice, regardless of randomisation arm. The low fat high PUFA comparison was included in the omega‐6 review. Study funding: by the Welsh Scheme for the Development of Health and Social Research, the Welsh Heart Foundation and the Health Promotion, Research Trust. Seven Seas Health Care and Duncan Flockhart provided Maxepa capsules | |
| Risk of bias | ||
| Bias | Authors' judgement | Support for judgement |
| Random sequence generation (selection bias) | Low risk | Quote: "randomised" confirmed by author |
| Allocation concealment (selection bias) | Unclear risk | Pre‐prepared sequentially numbered enveloped opened by dietitian (unclear if envelopes were opaque) |
| Blinding of participants and personnel (performance bias) | High risk | Blinding of dietary advice (or lack of it) is not possible |
| Blinding of outcome assessment (detection bias) | Low risk | Outcome assessors were not aware of study allocation (Prof Burr stated he did not know assignments) |
| Incomplete outcome data (attrition bias) | Low risk | Hospital notes and death registers were flagged to catch all outcome data |
| Selective reporting (reporting bias) | Unclear risk | No study protocol or trials register entry was found |
| Attention | High risk | More attention was paid to those given dietary advice |
| Compliance | Unclear risk | 7 day weighed food diary of a random sub‐sample indicated intake of 2.5 g/week EPA intervention, 0.8 g/week EPA control |
| Other bias | Low risk | None noted |
| Methods | Diet and Angina Randomised Trial (DART2) RCT, 2 × 2, (oily fish or capsulesn‐3 EPA + DHA vs nil, also no specific advice, also fruit, vegetables and oats vs no specific advice), 3‐9 years Summary risk of bias: moderate or high | |
| Participants | Men treated for angina N: 1571 intervention, 1543 control (all analysed for events) Mean age in years (SD): 61.1 (NR) intervention, 61.1 (NR) control Age range: unclear Smokers: 25% intervention, 23% control Hypertension: 49% intervention, 47% control Medications taken by at least 50% of those in the control group: not reported Medications taken by 20%‐49%: lipid lowering, beta‐blockers Medications taken by some, but less than 20% of the control group: not reported Location: UK Ethnicity: not reported | |
| Interventions | Type: dietary advice (to eat more oily fish or take fish oil capsules) Comparison: EPA + DHA vs unclear (not total fat, SFA or alcohol, presumably CHO and/or protein but not clear) Intervention: most (1109) advised to eat at least 2 weekly portions of fatty fish OR take MaxEPA capsules, 3/d (0.5 g EPA/d). But 462 participants were sub‐randomised to receive only fish oil capsules, not dietary fish advice. Dose: aimed for 0.5 g/d EPA. Control: none specific sensible eating advice that did not include either of the interventions. Compliance: postal dietary questionnaire suggested dietary EPA intake increased by 2.4 g /week intervention, 0.2 g /week control Dietary achievements Total fat intake, (change from baseline to 6 months): control −8.6 g/d (SD 20.9), intervention −5.2 (g/d SD 21.4) (MD 3.4 g/d) Saturated fat intake, (change from baseline to 6 months): control −3.5 g/d (SD 9.3), intervention −2.8 g/d (SD 9.4), (MD 0.7 g/d) PUFA intake (change from baseline to 6 months): control −1.6 g/d (SD 5.4), intervention −0.1 g/d (SD 5.8) (MD 1.5 g/d) PUFA n‐3 intake (change from baseline to 6 months): EPA, control 0.12 g/week (SD 0.73), intervention 2.65 g/week (SD 1.35) (MD 2.53 g/week) PUFA n‐6 intake: not reported MUFA intake: not reported CHO intake: not reported Protein intake: not reported Trans fat intake: not reported Duration of intervention: 36 to 108 months | |
| Outcomes | Main study outcome: total mortality | |
| Notes | Some of each group were also advised on high fruit, vegetables and oat diets, and those who received neither fish nor fruit advice received 'non‐specific' dietary advice. All those whose BMI > 30 kg/m2 in both groups received weight reduction advice. Study funding: probably British Heart Foundation, Seven Seas Ltd, Novex Pharma Ltd and the Fish Foundation (these were acknowledged) | |
| Risk of bias | ||
| Bias | Authors' judgement | Support for judgement |
| Random sequence generation (selection bias) | Unclear risk | Quote: "randomly allocated" |
| Allocation concealment (selection bias) | Unclear risk | Pre‐prepared sequentially numbered enveloped opened by dietitian (unclear if envelopes were opaque) |
| Blinding of participants and personnel (performance bias) | High risk | Dietary advice, so not possible for participants to be blinded to intervention |
| Blinding of outcome assessment (detection bias) | Low risk | Outcome assessors were not aware of study allocation (Prof Burr stated he did not know assignments) |
| Incomplete outcome data (attrition bias) | Low risk | Hospital notes and death registers were flagged to catch all outcome data |
| Selective reporting (reporting bias) | Unclear risk | No study protocol was found, or trials registry entry |
| Attention | High risk | More attention was paid to those given dietary advice |
| Compliance | Unclear risk | Postal dietary questionnaire suggested dietary EPA intake increased by 2.4 g/week intervention, 0.2 g/week control |
| Other bias | Low risk | None noted |
| Methods | RCT, parallel, (n‐3 PUFA capsules vs placebo), 18 months Summary risk of bias: low | |
| Participants | White overweight/obese patients with impaired fasting glucose (IFG) or impaired glucose tolerance (IGT) N: 138 intervention, 143 control (analysed 128 intervention, 130 control) Level of risk for CVD: low Men: 50.72% intervention, 48.95% control Mean age in years (SD): 53.4 (11.2) intervention, 54.8 (12.1) control Age range: unclear Smokers: not reported Hypertension: not reported Medications taken by at least 50% of those in the control group: not reported Medications taken by 20%‐49% of those in the control group: not reported Medications taken by some, but less than 20% of the control group: not reported Location: Italy Ethnicity: white | |
| Interventions | Type: capsule (n‐3 PUFA) Comparison: EPA + DHA vs CHO + SFA Intervention: 3 ×1 g capsule/ day n‐3 PUFAs (ethylic esters, each 1‐g capsule of n‐3 PUFAs contains highly concentrated ethyl esters of omega‐3 fatty acids, primarily EPA, and DHA in the proportion of 0.9–1.5). Dose: unclear (approx 2‐3 g/d) Control: placebo (a capsule containing sucrose, mannitol and mineral salts, magnesium stearate (a saturated fat) and silicon dioxide, used as anti‐caking agents) Both groups were given diet advice to follow a controlled‐energy diet based on AHA recommendations (50% of calories from carbohydrates, 30% from fat (6% saturated), and 20% from proteins, with a maximum cholesterol content of 300 mg/day and 35 g/day of fibre). Individuals were also encouraged to increase their physical activity by walking briskly for 20 to 30 min, 3 to 5 times per week, or by cycling Compliance: measured by counting the number of pills returned at the time of specified clinic visits Length of intervention: 18 months | |
| Outcomes | Main study outcome: insulin resistance Dropouts: 23 across arms (no details on groups but stated that there were no difference between groups) Available outcomes: mortality, CV mortality, CHD event, stroke, combined CVD events, MI, AF, weight, BMI, lipids, diabetes mellitus Response to contact: yes (data provided) | |
| Notes | Study funding: "The authors have no relevant affiliations or financial involvement with any organization or entity with a financial interest in or financial conflict with the subject matter or materials discussed in the manuscript. This includes employment, consultancies, honoraria, stock ownership or options, expert testimony, grants or patents received or pending, or royalties" | |
| Risk of bias | ||
| Bias | Authors' judgement | Support for judgement |
| Random sequence generation (selection bias) | Low risk | Randomisation was done using a drawing of envelopes containing randomisation codes prepared by a statistician. |
| Allocation concealment (selection bias) | Low risk | Author stated that allocation was concealed from clinicians and researchers, but no methodology provided |
| Blinding of participants and personnel (performance bias) | Low risk | Both n‐3 PUFAs and placebo were supplied as identical, opaque, white capsules in coded bottles to ensure the blind status of the study. However no information provided on capsules taste or smell |
| Blinding of outcome assessment (detection bias) | Low risk | A copy of the code was provided only to the person performing the statistical analysis |
| Incomplete outcome data (attrition bias) | Low risk | An intention‐to‐treat analysis was conducted for patients who received 1 dose of study medication |
| Selective reporting (reporting bias) | Unclear risk | No trial registry or protocol found |
| Attention | Low risk | No difference reported |
| Compliance | Unclear risk | Measured by counting the number of pills returned at the time of specified clinic visits |
| Other bias | Low risk | None noted |
| Methods | RCT 4 arms, ( n‐3 EPA + DHA (3 different doses) vs MUFA), 12 months Summary risk of bias: moderate or high | |
| Participants | Healthy monks N: 14 high, 15 medium, 15 low dose intervention, 14 control Level of risk for CVD: low Men: 100% Mean age in years (SD): 56.2 (16.5) (not reported by arm) Age range: 21‐87 Smokers: none Hypertension: not reported Medications taken by at least 50% of those in the control group: not reported Medications taken by 20%‐49% of those in the control group: not reported Medications taken by some, but less than 20% of the control group: not reported (no medications influencing lipid metabolism or non‐steroidal anti‐inflammatory drugs were allowed) Location: the Netherlands Ethnicity: not reported | |
| Interventions | Type: capsules Comparsion: LCn3 vs MUFA Intervention 9 capsules (9 g vol.) per day, of which 3, 6 or 9 were fish oil (Labaz, Brussels, Belgium) and any remainder were placebo (providing respectively 1.12; 2.24 or 3.37 g n‐3 FA/day). Dose: 1.12 g/d; 2.24 g/d or 3.37 g/d EPA + DHA) Control: 9 placebo capsules made up of olive oil (Puget Marseille, France) and Palmoil (Loders‐Kroklaan Wormerveen, the Netherlands) with the same SFA, cholesterol and vitamin E as the fish oil capsules. Compliance: assessed by counting remaining capsules every 2 months and by measuring EPA concentration. Excellent compliance reported and shown by the EPA concentration results Length of intervention: 12 months | |
| Outcomes | Main study outcome: effect on coronary risk factors Dropouts: none Available outcomes: deaths (nil), CVD events (nil), lipids, BP, HbA1c, weight (measured but only text suggests "no significant changes in the anthropometric parameters (weight, length, waist, hip and thigh circumferences) during the study"), IL‐6, TNF‐alpha and several IL‐1s (IL‐6 reported as below detection range, for the others there was "no significant difference between the two treatment groups at any point in time") | |
| Notes | Study funding: capsules supplied by Labaz (Brussels Belgium). The placebo capsules contained olive oil (Puget) and palm oil (Loders‐Kroklaan, Wormerveer). Financial support by Sanofi‐Labaz. Data entered for high fish oil versus placebo groups | |
| Risk of bias | ||
| Bias | Authors' judgement | Support for judgement |
| Random sequence generation (selection bias) | Low risk | Quote (author correspondence): "The manufacturer provided envelopes containing numbers corresponding with boxes of capsules. For each enrolled subject, random envelope was opened." |
| Allocation concealment (selection bias) | Low risk | Allocation concealed from all this way |
| Blinding of participants and personnel (performance bias) | High risk | Although double blind, the fishy taste of the active treatment was not matched (author states that the fishy taste was clear in the intervention capsules) |
| Blinding of outcome assessment (detection bias) | Low risk | Authors confirmed outcome assessors were unaware until afterwards. |
| Incomplete outcome data (attrition bias) | Low risk | No dropouts |
| Selective reporting (reporting bias) | Unclear risk | No protocol or trial registry record |
| Attention | Low risk | No difference between groups |
| Compliance | Low risk | Significant difference in EPA concentration |
| Other bias | Low risk | None noted |
| Methods | Dietary Intervention for Patients Polypectomized for tumours of the colorectum (DIPP) RCT, parallel, 2 arms (n‐3 EPA + DHA + n‐3 ALA vs nil), 24 months Summary risk of bias: moderate or high | |
| Participants | Patients previously polypectomised for colorectal tumours N: 104 intervention, 101 control Level of risk for CVD: low Men: 73.1% intervention, 74.3% control Mean age in years (SD): 58.3 (9.5) intervention, 59.7 (8.9) control Age range: 35‐75 Smokers: 65.4% intervention, 61.4% control Hypertension: not reported Medications taken by at least 50% of those in the control group: supplements Medications taken by 20%‐49% of those in the control group: none Medications taken by some, but less than 20% of the control group: oral contraceptive pills Location: Japan Ethnicity: not reported | |
| Interventions | Type: advice + supplement (fish oil capsules) Comparison: EPA + DHA + ALA vs omega‐6 Intervention: advice to reduce total fat intake, decrease consumption of n‐6 PUFAs, increase intake of n‐3 PUFAs from fish/marine foods, increase intake of n‐3 PUFAs from perilla oil rich in ALA, take 8 capsules of fish oil/day (equivalent to 96 mg/day of EPA and 360 mg/day of DHA). Dose: 456mg/d EPA + DHA and unknown dose of ALA Control: advice to decrease intake of fats/oils as a whole Compliance: measured via semi‐quantitative food frequency questionnaire, plasma fatty acid concentrations, fatty acid compositions in the membranes of red blood cells and the sigmoid colon. Reported satisfactorily high compliance with protocol in both groups but no figures provided. Length of intervention: 24 months | |
| Outcomes | Main study outcome: number and size of colorectal tumours Dropouts: 3 intervention, 5 control Available outcomes: all cause mortality, dietary intake, plasma fatty acids, lipids, side effects, glucose Response to contact: yes (methodological details provided) | |
| Notes | Study funding: all were either government or charity grants | |
| Risk of bias | ||
| Bias | Authors' judgement | Support for judgement |
| Random sequence generation (selection bias) | Low risk | Randomly allocated using random digit number for allocation of participants |
| Allocation concealment (selection bias) | Low risk | Author confirmed "Allocation information was blinded to clinicians and researchers" |
| Blinding of participants and personnel (performance bias) | Unclear risk | From the 2015 paper, "The attending physicians as well as the participants were blinded to the assignment information". However in the discussion section they say "complete participant blinding could not have been achieved because free living participants might have exchanged information on their dietary intervention, say in the hospital waiting room". Author confirmed blinding |
| Blinding of outcome assessment (detection bias) | Low risk | Quote: "physicians, including colonoscopists, a scientist who conducted blood and specimen analyses, and pathologists were blinded" |
| Incomplete outcome data (attrition bias) | Low risk | All those randomised were accounted for |
| Selective reporting (reporting bias) | High risk | The researchers chose not to report data on the number, size and pathological type of the colorectal tumours as they said they would in the trials register. They reported more outcomes in the paper than initially stated. UMIN000000461 Registered 3 August 2006, recruitment completed 1 March 2007 |
| Attention | Low risk | Participants were given equal follow‐up |
| Compliance | Unclear risk | Reported satisfactorily high compliance with protocol was noted in both groups but no figures |
| Other bias | Low risk | None noted |
| Methods | Dietary Intervention Study for AF (DISAF) RCT, parallel, 2 arms (n‐3 EPA + DHA vs nil), 12 months | |
| Participants | People presenting for first treatment of acute/persistent atrial fibrillation or flutter, confirmed by ECG N: intervention 201, control 206 Level of risk for CVD: high (patients with atrial fibrillation) Men: intervention 64.7%, control 63.6% Mean age in years (SD): intervention 67.7 (9.4), control 68.7 (9.5) Age range: unclear Smokers: intervention 10.9%, control 12.1% Hypertension: intervention 48.2%, control 40.8% Medications taken by at least 50% of those in the control group: not reported Medications taken by 20%‐49% of those in the control group: antiarrythmics, antithrombotics Medications taken by some, but less than 20% of the control group: not reported Location: UK Ethnicity: white British | |
| Interventions | Type: dietary advice Comparison: EPA + DHA vs unclear Intervention: dietary assistants gave advice and support to eat 2 to 3 portions of oily fish per week (providing up to 10 g LCn3/ week), plus 2 to 3 portions of fruit and vegetables per day. Dose: 1.4 g/d EPA + DHA. Control: dietary assistants gave advice and support to eat 2 to 3 portions of fruit and vegetables per day. No other health/lifestyle given as part of the trial Compliance: assessed red blood cell fatty acids and found some increases in EPA and DHA in intervention compared to control (no further intake data) Length of intervention: 12 months | |
| Outcomes | Main study outcome: sinus rhythm after 12 months Dropouts: unclear Available outcomes: deaths, AF recurrence Response to contact: yes (data provided) | |
| Notes | Study funding: not reported | |
| Risk of bias | ||
| Bias | Authors' judgement | Support for judgement |
| Random sequence generation (selection bias) | Low risk | Randomisation was by phone to an independent randomisation office, which used pre‐printed random number tables |
| Allocation concealment (selection bias) | Low risk | Randomisation was by phone to an independent randomisation office, which used pre‐printed random number tables |
| Blinding of participants and personnel (performance bias) | High risk | Dietary advice was clear, so allocation known by participants |
| Blinding of outcome assessment (detection bias) | Unclear risk | Unclear |
| Incomplete outcome data (attrition bias) | High risk | Some discrepancies between papers, reasons unclear |
| Selective reporting (reporting bias) | High risk | ISRCTN16448451 registered 23 January 2004, recruitment from 1 July 1998 to 1 July 2002; some secondary outcomes were not reported |
| Attention | Low risk | Intervention (advice to eat more oil‐rich fish, fruit and vegetables) and control (advice to eat more fruit and vegetables) groups appeared to be given equivalent time and attention. |
| Compliance | Low risk | Assessed red blood cell fatty acids and found some increases in EPA and DHA in intervention compared to control |
| Other bias | High risk | The trial was stopped early |
| Methods | Diet and Omega 3 Intervention Trial on Atherosclerosis (DO IT) Randomisation: RCT, parallel, 2 × 2 factorial, (n‐3 DHA + EPA vs n‐6 LA also dietary advice intervention), 36 months | |
| Participants | Elderly men with longstanding dyslipidaemia or hypertension (a subset of Oslo Diet heart study) N: intervention 282 (140 n‐3 capsules + 142 n‐3 capsules and dietary advice), control 281 (142 placebo capsules + 139 placebo capsules and dietary advice) Level of risk for CVD: moderate Men: intervention 100%, control 100% Mean age in years (SD): intervention 70.4 (2.9), control 69.7 (3.0) years Age range: 64‐76 years Smokers: intervention 35%, control 33% Hypertension: intervention 29%, control 27% Medications taken by at least 50% of those in the control group: none Medications taken by 20%‐49% of those in the control group: statins and acetylsalicylic acid Medications taken by some, but less than 20% of the control group: β‐blockers, ACE inhibitors and nitrates Location: Norway Ethnicity: not reported | |
| Interventions | Type: supplement/ capsule (also dietary advice as the factorial intervention) Comparison: EPA + DHA vs omega‐6 Compliance: pharmacy records suggested that > 90% of supplements were taken, and plasma EPA and DHA were raised in intervention compared to control participants. Duration of intervention: 36 months | |
| Outcomes | Main study outcome: atherosclerosis progression. Dropouts: intervention 14 died, 20 others discontinued, control 24 died, 18 others discontinued Available outcomes: mortality, cardiovascular deaths, CHD events, CV events, MI, stroke, diabetes, glucose, lipids, cancer diagnosis, cancer deaths, sudden death, BMI (waist circumference reported as median, IQR) Response to contact: yes (data provided) | |
| Notes | The other 2 × 2 intervention was dietary counselling to increase both omega‐3 and omega‐6 fats as well as fruit and vegetables. Study funding: Norwegian Cardiovascular Council, Norwegian retail company RIMI, vegetable oil and margarine supplied by the Norwegian food company Mills DA and placebo capsules by LUBE | |
| Risk of bias | ||
| Bias | Authors' judgement | Support for judgement |
| Random sequence generation (selection bias) | Low risk | Permuted block randomisation, no clear mechanism provided |
| Allocation concealment (selection bias) | Unclear risk | No details provided |
| Blinding of participants and personnel (performance bias) | Unclear risk | Capsules of fish oil or placebo taken, but unclear whether blinded and if so, how well or successfully |
| Blinding of outcome assessment (detection bias) | Low risk | "Mortality data were supplied from the Norwegian Cause of Death Registry, and all clinical events were confirmed by hospital records and verified by an independent cardiologist" |
| Incomplete outcome data (attrition bias) | Low risk | No attrition as deaths and events collected from centralised register |
| Selective reporting (reporting bias) | Unclear risk | Trials registry entry submitted after the outcomes papers were published. |
| Attention | Low risk | No suggestion of attention bias between verum and placebo supplement arms |
| Compliance | Low risk | Pharmacy records suggested that > 90% of supplements were taken, and plasma EPA and DHA were raised in intervention compared to control participants |
| Other bias | Low risk | None noted |
| Methods | RCT, parallel, (n‐3 ALA vs n‐6 LA), 12 months Summary risk of bias: moderate or high | |
| Participants | Healthy menopausal women N: 101 intervention, 98 control. (analysed, intervention: 85 control: 94) Level of risk for CVD: low Men: 0% intervention, 0% control Mean age in years (SD): 54.0 (4.0) intervention, 55.4 (4.5) control Age range: 49‐65 Smokers: 8% intervention, 6% control Hypertension: not reported Medications taken by at least 50% of those in the control group: not reported Medications taken by 20%‐49% of those in the control group: not reported Medications taken by some, but less than 20% of the control group: not reported Location: Canada Ethnicity: French Canadian | |
| Interventions | Type: food supplement (flaxseed) Comparison: ALA vs unclear (probably includes lipids, CHO and protein, but not clear) Intervention: 40 g/d flaxseed incorporated into diets (providing 21,071 g total lignans, 180 calories, 16 g lipids (57% ALA), and 11 g total dietary fibre). Dose: 9.1 g/d ALA Control: 40 g/d wheat germ incorporated into diets (providing 196 g total lignans, 144 calories, 4 g lipids (6.9% ALA), and 6 g total dietary fibre Compliance: first morning urine collection was performed at randomisation and at month 12 to measure urinary lignin levels. In addition, study participants recorded their daily intake of seeds on diary cards and were asked to return unused bread and packages of seeds at each visit. Good compliance reported Duration of intervention: 12 months | |
| Outcomes | Main study outcome: bone mineral density Dropouts: 26 intervention, 17 control (but 13/17 had an endpoint evaluation) Available outcomes: weight, BMI, QoL, blood pressure, lipids, glucose, adverse events, dietary intake, plasma fatty acids Response to contact: yes | |
| Notes | Auhors replied to tell us that there were no deaths or CV events during the study Study funding: not reported | |
| Risk of bias | ||
| Bias | Authors' judgement | Support for judgement |
| Random sequence generation (selection bias) | Low risk | The randomisation schedule was prepared by the clinical unit of the research centre using computer generated randomisation in blocks of 4‐8 |
| Allocation concealment (selection bias) | Unclear risk | No details |
| Blinding of participants and personnel (performance bias) | Low risk | Participants, investigators, staff, and statisticians were blinded to dietary assignments for the duration of the study. Quote: "a local baker prepared loaves of bread. Each week, the loaves of bread were delivered in sealed, opaque unmarked wrappers to the Department of Food and Nutrition Sciences at Laval University. The seeds were ground up and vacuum‐packed in the same laboratory. The Department of Food and Nutrition Sciences was responsible for labelling the bags of bread and packages of seeds with the subject's randomization number. Bread and packages of seeds were provided on a 3‐month basis. The foods that both groups received was similar in appearance and packaging and was kept frozen until consumption to avoid essential fatty acid |
| Blinding of outcome assessment (detection bias) | Low risk | Participants, investigators, staff, and statisticians were blinded to dietary assignments for the duration of the study |
| Incomplete outcome data (attrition bias) | Low risk | Intention‐to‐treat analysis. Loss to follow‐up 10%, reasons given |
| Selective reporting (reporting bias) | Unclear risk | No protocol or clinical trial registry entry found |
| Attention | Low risk | All participants had same number of visits |
| Compliance | Low risk | First morning urine collection was performed at randomisation and at month 12 to measure urinary lignin levels. In addition, study participants recorded their daily intake of seeds on diary cards and were asked to return unused bread and packages of seeds at each visit. Good compliance reported |
| Other bias | Low risk | None noted |
| Methods | RCT, parallel, (n‐3 EPA vs nil), 12 months Summary risk of bias: moderate or high | |
| Participants | Patients having PCI after acute MI N: 119 intervention, 119 control analysed Level of risk for CVD: high Men: 77% intervention, 76% control Mean age in years (SD): 70 (11) intervention, 71 (12) control Age range: unclear Smokers: 28% intervention, 32% control Hypertension: 71% intervention, 69% control Medications taken by at least 50% of those in the control group: aspirin, ticlopidine, beta‐blockers, statins (as part of treatment) Medications taken by 20%‐49% of those in the control group: ARB/ACE inhibitors Medications taken by some, but less than 20% of the control group: none Location: Japan Ethnicity: not reported | |
| Interventions | Type: supplement (EPA) Comparison: EPA vs nil Intervention: purified EPA ethyl esters (> 98%) 1800 mg EPA/day within 24 hours after PCI plus statins. Dose: 1.8 g/d EPA Control: statins with no EPA Compliance: not reported Length of intervention: 12 months | |
| Outcomes | Main study outcome: cardiovascular events Dropouts: 1 intervention, 2 control Available outcomes: mortality, stroke, MI, sudden death, CV death, revascularisation Response to contact: no | |
| Notes | Study funding: trial registry state "self‐funded". The authors received honoraria from Mochida Pharmaceutical Co. | |
| Risk of bias | ||
| Bias | Authors' judgement | Support for judgement |
| Random sequence generation (selection bias) | Low risk | A computer‐generated, randomisation plan, which included stratification by age and sex |
| Allocation concealment (selection bias) | Unclear risk | Carried out by research technician but unclear |
| Blinding of participants and personnel (performance bias) | High risk | Open label but blind endpoint |
| Blinding of outcome assessment (detection bias) | Unclear risk | Data on outcomes were collected from clinical charts. Unclear if blinded. Diagnoses were confirmed by investigator blind to treatment allocation |
| Incomplete outcome data (attrition bias) | Low risk | Only 3 dropouts, similar rates between the groups and reasons given |
| Selective reporting (reporting bias) | High risk | Data collection completed before trial registry entry. Only 1% dropouts |
| Attention | Low risk | Timing of follow‐up similar |
| Compliance | Unclear risk | Not reported |
| Other bias | Low risk | None observed |
| Methods | EPE‐A RCT, parallel, 3 arms (n‐3 EPA, low dose vs high dose vs unclear placebo), 12 months Summary risk of bias: moderate or high | |
| Participants | People with non‐alcoholic steatohepatitis (NASH) and non‐alcoholic fatty liver disease (NAFLD) N: 86 intervention‐high, 82 int low, 75 control (analysed 64, 55, 55 respectively, ITT analysis for primary outcomes) Level of risk for CVD: low (although 35% had type II diabetes) Men: 33.7% intervention‐high, 41.5% intervention‐low, 42.7% control Mean age in years (SD): 47.8 (11.1) intervention‐high, 47.8 (12.5) intervention‐low, 50.5 (12.5) control Age range: not reported Smokers: not reported Hypertension: not reported Medications taken by at least 50% of those in the control group: not reported Medications taken by 20%‐49% of those in the control group: not reported Medications taken by some, but less than 20% of the control group: not reported Location: USA Ethnicity: white intervention‐low: 94%, intervention‐high: 87%, control: 90.7% African American intervention‐low: 3.7%, intervention‐high: 2.3%, control: 4.0% Others intervention‐low: 2.4%, intervention‐high: 10.5%, control: 5.3% | |
| Interventions | Type: supplement (omega 3 capsule) Comparison 1: high EPA vs low EPA (unclear what replaced EPA) Comparison 2: EPA vs unclear (placebo contents not reported) Intervention‐high: EPA‐E 2.7 g/d, 3 × EPA‐E 300 mg capsules. Dose: 2.7 g/d EPA + DHA Intervention‐low: EPA‐E 1.8 g/d, 2 × EPA‐E 300 mg capsules + 1 placebo capsule Dose: 1.8 g/d EPA + DHA Control: 3 × placebo capsules. The pills were identical with respect to size, colour and smell Compliance: estimated by pill count and measuring the ratio of serum EPA to arachidonic acid. compliance rates for the 3 groups (placebo vs EPA‐E 1800 mg/d vs EPA‐E 2700 mg/d) were 89.5% (6.8%), 90.3% (5.7%) and 89.5% (5.3%), respectively Length of intervention: 12 months | |
| Outcomes | Main study outcome: histological response in standardised scoring of liver biopsies and change in ALT level Dropouts: 22 intervention‐high, 27 intervention‐low, 20 control Available outcomes: cardiac events, deaths (none), angina, adverse events (weight, BMI, lipids, glucose, HbA1c, HOMA, hsCRP all reported as medians so not useable in meta‐analyses) Response to contact: yes (provided methodological details) | |
| Notes | Data combined for the 2 intervention groups for binary outcomes and higher dose data vs control used for continuous outcomes Study funding: supported entirely by Mochida Pharmaceuticals | |
| Risk of bias | ||
| Bias | Authors' judgement | Support for judgement |
| Random sequence generation (selection bias) | Low risk | Block randomisation using an interactive voice‐response system to assign subjects in a 1:1:1 ratio between the 2 arms for each site separately. Participants were stratified by the presence of type 2 diabetes. The total fraction of such individuals was capped at 40% of the study cohort |
| Allocation concealment (selection bias) | Low risk | As above (remote computer‐generated randomisation) |
| Blinding of participants and personnel (performance bias) | Low risk | Double‐blind stated, but no further details. Author confirmed researchers and outcome assessors were blinded to treatment allocation and pills were identical with respect to size, colour and smell |
| Blinding of outcome assessment (detection bias) | Unclear risk | No details |
| Incomplete outcome data (attrition bias) | High risk | Number and characteristics of participants lost to follow‐up similar across arms, however < 80% provided outcome data relevant to this systematic review |
| Selective reporting (reporting bias) | Low risk | Registered June 2010, study started June 2010, completed October 2012. All outcomes in trials registry entry were also reported in the trials registry. Secondary outcomes reported were not planned (compared with first version of clinicaltrials.gov entry) |
| Attention | Low risk | All participants had same follow‐up visits. |
| Compliance | Low risk | Compliance was estimated by pill count and measuring the ratio of serum EPA to arachidonic acid. Compliance rates for the 3 groups (placebo vs EPA‐E 1800 mg/d vs EPA‐E 2700 mg/d) were 89.5% (6.8%), 90.3% (5.7%) and 89.5% (5.3%) respectively |
| Other bias | Low risk | None noted |
| Methods | EPANOVA in Crohn's disease, study 1 (EPIC‐1) RCT, parallel, 2‐arm (omega 3 vs MCT), 52 weeks | |
| Participants | Adults with quiescent Crohn's disease (CDAI) score < 150 N: 188 intervention, 186 control Men: 48.1% intervention, 41.1% control Mean age in years (SD): 40.5 (15.2) intervention, 38.2 (13.1) control Age range: 18‐70 years Smokers: 30.6% intervention, 34.4% control Hypertension: unclear Medications taken by at least 50% of those in the control group: oral 5‐ASA therapy, Systemic corticosteroids – prednisolone, budesonide Medications taken by 20%‐49% of those in the control group: not reported Medications taken by some, but less than 20% of the control group: antibiotic therapy, topical rectal therapy, immune‐modifying agents, immune modifiers/biologics Location: Canada, Europe, Israel, USA Ethnicity: not reported | |
| Interventions | Type: supplement (capsule) Comparison: EPA + DHA vs SFA (medium chain triglycerides of short SFAs) Control: 4 x1 g capsules medium chain triglycerides | |
| Outcomes | Main study outcome: Crohns relapse‐free time Available outcomes: total deaths, non‐fatal arrhythmias, cancer diagnoses, cancer deaths, adverse events Response to contact: yes (data provided) | |
| Notes | Study funding: Tillotts Pharma, authors had extensive financial disclosures | |
| Risk of bias | ||
| Bias | Authors' judgement | Support for judgement |
| Random sequence generation (selection bias) | Low risk | Randomisation by number generator. Used a centralised randomisation procedure via interactive voice recognition system. |
| Allocation concealment (selection bias) | Low risk | Centralised randomisation (see above) |
| Blinding of participants and personnel (performance bias) | Low risk | Double blinding stated, identical capsule (slow‐release capsules). Neither investigator nor participant knew the allocation. |
| Blinding of outcome assessment (detection bias) | Unclear risk | Study states double‐blind but does not state that outcome assessors were blinded or provide a mechanism for this |
| Incomplete outcome data (attrition bias) | Low risk | Number of dropouts and reasons provided. 171 of 187 in intervention group and 174 of 184 in control group provided data for primary outcome, (7% dropout), though 80 in the intervention group and 91 in the control group terminated early. |
| Selective reporting (reporting bias) | High risk | Trials registration (NCT00613197) first received in 2008, but study started in 2003 and was published in 2008 |
| Attention | Low risk | As investigators were blinded attention bias was not possible. |
| Compliance | Unclear risk | Pill counts, 79.2% adhered intervention, 75.6% adhered control |
| Other bias | Low risk | No further bias noted |
| Methods | EPANOVA in Crohn's Disease, Study 2 (EPIC‐2) RCT, parallel, 2 arms (omega 3 vs MCT), 58 weeks | |
| Participants | Adults with a confirmed diagnosis of Crohn's Disease and a Crohn's Disease Activity Index (CDAI) score < 150 who are responding to steroid induction therapy N: intervention, 189, control 190 (187 intervention, 188 control analysed) Level of risk for CVD: low (people with quiescent Crohn's disease) Men: 48.1% intervention, 41.1% control Mean age in years (SD): 38.5 (13.8) intervention, 40.0 (13.6) years control Age range: > 16 years Smokers: 25.1% intervention, 37.2% control Hypertension: unclear Medications taken by at least 50% of those in the control group: systemic corticosteroids – prednisolone, budesonide (but tapered and discontinued during the study) Medications taken by 20%‐49% of those in the control group: only reported for prior 12 months Medications taken by some, but less than 20% of the control group: only reported for prior 12 months Location: Canada, Europe, Israel, USA Ethnicity: not reported | |
| Interventions | Type: supplement (capsule) Comparison: EPA + DHA vs SFA (medium chain triglycerides of short SFAs) Control: 2 × 2 1 g capsules medium chain triglyceride oil | |
| Outcomes | Main study outcome: maintain Crohns symptomatic remission | |
| Notes | Study funding: Tillotts Pharma, authors had extensive financial disclosures | |
| Risk of bias | ||
| Bias | Authors' judgement | Support for judgement |
| Random sequence generation (selection bias) | Low risk | Randomisation by number generator. Used a centralised randomisation procedure via interactive voice recognition system |
| Allocation concealment (selection bias) | Low risk | Centralised randomisation (see above) |
| Blinding of participants and personnel (performance bias) | Unclear risk | Double blinding stated, identical capsule (slow‐release capsules). Neither investigator nor participant knew the allocation. However no information provided on capsules taste or smell |
| Blinding of outcome assessment (detection bias) | Unclear risk | Study states double‐blind but does not state that outcome assessors were blinded or provide a mechanism for this |
| Incomplete outcome data (attrition bias) | High risk | Number of dropouts and reasons provided, however 114 of 189 in intervention group and 112 of 190 in control group terminated early. |
| Selective reporting (reporting bias) | High risk | NCT00074542. First received 2003, study start 2002. Published 2008. Some outcomes, such as quality of life, stated in trials registry but not in published papers |
| Attention | Low risk | As investigators were blinded, attention bias was not possible. |
| Compliance | Unclear risk | Measured by patient interviews and pill counts, 75.4% adhered intervention, 81.4% adhered control |
| Other bias | Low risk | No further bias noted |
| Methods | Older People, Omega‐3 and Cognitive Health (EPOCH) RCT, parallel (n‐3 EPA + DHA vs MUFA), 18 months Summary risk of bias: low | |
| Participants | Healthy older adults with no cognitive impairment N: 195 intervention, 196 control (reported by author) Level of risk for CVD: low Men: not reported Mean age in years (SD): not reported Age range: not reported, but 65‐90 recruited Smokers: not reported Hypertension: not reported Medications taken by at least 50% of those in the control group: not reported Medications taken by 20%‐49% of those in the control group: not reported Medications taken by some, but less than 20% of the control group: not reported Location: Australia Ethnicity: not reported | |
| Interventions | Type: supplement (fish oil capsules) Comparison: EPA + DHA vs MUFA Intervention: 4 capsules/d (1.72 g/d DHA and 0.60 g/d EPA). Dose: 2.32 g/d EPA + DHA Control: 4 capsules/d (3.960 g/d olive oil and 40 mg/d fish oil) Compliance: count of all unused supplements returned at three‐monthly intervals, plus self‐report calendars, mailed back on a monthly basis. If compliance fell below 85% (re calendars), they were contacted by a researcher who noted the reasons. Compliance also assessed by erythrocyte membrane n‐3 LC PUFA status Length of intervention: 18 months | |
| Outcomes | Main study outcome: change in cognitive performance Dropouts: not reported Available outcomes: mortality (nil), MI, stroke, revascularisation, arrhythmias, CV events Response to contact: yes (data provided) | |
| Notes | Authors reported some events, but don't appear to be published. Study funding: EPAX donated the Omega‐3 concentrate and Blackmores Pty Ltd donated the placebo and packaging of the Omega‐3 concentrate. The trial was supported by the Brailsford Robertson Award 2007‐2008 (University of Adelaide and CSIRO Food and Nutritional Sciences), and is funded by a National Health and Medical Research Project Grant (#578800). | |
| Risk of bias | ||
| Bias | Authors' judgement | Support for judgement |
| Random sequence generation (selection bias) | Low risk | Age‐stratified, permuted‐block randomisation, with mixed block‐sizes (2‐8, size unknown to study investigators), 1:1 allocation. Computer‐generated randomisation schedule |
| Allocation concealment (selection bias) | Low risk | An independent researcher prepared allocation to treatment |
| Blinding of participants and personnel (performance bias) | Low risk | The researchers, project staff, and participants remained blinded to treatment allocation until the trial was completed and the database locked. However, no information provided on capsules appearance, taste or smell |
| Blinding of outcome assessment (detection bias) | Low risk | As above |
| Incomplete outcome data (attrition bias) | Unclear risk | No data for each group presented, and no attrition data presented |
| Selective reporting (reporting bias) | High risk | Only cognitive functions reported for whole population (not by arm). No secondary outcomes reported (MMSE; perceived health status, depressive symptoms, positive and negative affect, life satisfaction, self‐reported cognitive functioning, and functional capacity; blood pressure; biomarkers of glucose, glycated haemoglobin, triglycerides, total cholesterol, HDL, LDL, homocysteine, CRP, MDA, and telomere length) |
| Attention | Low risk | All had the same contact and attention |
| Compliance | Unclear risk | Count of all unused supplements returned at 3‐monthly intervals, plus self‐report calendars, mailed back on a monthly basis. If compliance fell below 85% (re calendars), they were contacted by a researcher who noted the reasons. Compliance also assessed by erythrocyte membrane n‐3 LC PUFA status but results not reported |
| Other bias | Low risk | None noted |
| Methods | RCT, parallel (n‐3 EPA + DHA vs unclear), 12 months Summary risk of bias: moderate to high | |
| Participants | People with successful external cardioversion N: unclear intervention, unclear control (54 analysed intervention, 54 control) Level of risk for CVD: high Men: 70% intervention, 74% control Mean age in years (SD): 65.0 (mean for whole group, SD not reported) Age range: not reported Smokers: not reported Hypertension: not reported Medications taken by at least 50% of those in the control group: not reported Medications taken by 20%‐49% of those in the control group: not reported Medications taken by some, but less than 20% of the control group: not reported Location: Germany Ethnicity: not reported | |
| Interventions | Type: supplement (probably, not described) Comparison: high EPA + DHA vs unclear placebo Intervention: described only as "PUFA" but included in systematic review (Mariani 2013) by Erdogan et al on effects of n‐3 PUFA. Dose: unclear Control: described only as "placebo" Compliance: not reported Length of intervention: 12 months | |
| Outcomes | Main study outcome: atrial fibrillation relapse Dropouts: not reported Available outcomes: recurrent AF (reported in Mariani 2013), mortality (none) Response to contact: no reply to date | |
| Notes | Funding source: not reported | |
| Risk of bias | ||
| Bias | Authors' judgement | Support for judgement |
| Random sequence generation (selection bias) | Unclear risk | Quote: "randomly assigned" |
| Allocation concealment (selection bias) | Unclear risk | Not described |
| Blinding of participants and personnel (performance bias) | Unclear risk | Described as triple blind, but no further details provided (only an abstract with some details in a related trial publication and some in a systematic review by the same author) |
| Blinding of outcome assessment (detection bias) | Unclear risk | Not described, but analysis appears to have been carried out blind to intervention/control status |
| Incomplete outcome data (attrition bias) | Unclear risk | Number randomised not described |
| Selective reporting (reporting bias) | Unclear risk | Unclear, no trial registry entry or protocol found |
| Attention | Unclear risk | Not described |
| Compliance | Unclear risk | Not described |
| Other bias | Low risk | None noted |
| Methods | Fatty Acid Antiarrhythmia Trial – FAAT Randomisation: RCT, parallel, 2 arms, (n‐3 EPA + DHA vs MUFA), 12 months Summary risk of bias: moderate or high | |
| Participants | People with implanted cardioverter defibrillators (ICDs) N: intervention 200, control 202 Level of risk for CVD: high (patients with ICDs). Men: intervention 84.5%, control 81.7% Mean age in years (SD): intervention 65.7 (11.6), control 65.3 (11.7) Age range: unclear Smokers: intervention 15%, control 11.4% Hypertension: unclear Medications taken by at least 50% of those in the control group: ACE inhibitors, beta‐blockers Medications taken by 20% ‐ 49%: diuretics Medications taken by some, but < 20%: calcium channel blockers, amiodarone, sotalol, type 1 antiarrhythmics Location: USA Ethnicity: intervention 95.5% white, control 96.5% white | |
| Interventions | Type: supplement/capsule Comparison: EPA + DHA vs MUFA Control: 4 ×1 g/d olive oil capsules, 4 g/d (in identical gelatin capsules, < 0.06 g/d EPA and < 0.06 g/d DHA) All were advised to use olive oil rather than the common plant seed oils for cooking, dressings, and sauces Compliance: pill counts and platelet phospholipid data suggested greater omega 3 intake in intervention participants. 35% were non‐compliers (36.5% intervention, 34.2% control) Duration of intervention: 12 months | |
| Outcomes | Main study outcome: fatal ventricular arrhythmias Dropouts: intervention 13 deaths, unclear no. of dropouts, control 12 deaths, dropouts unclear Available outcomes: deaths, cardiovascular deaths, CVD events, deaths from heart failure, fatal arrhythmias, MI, angina Response to contact: yes (data provided) | |
| Notes | Study funding: the study was supported in part by a grant from the NHLBI, NIH (HL62154) | |
| Risk of bias | ||
| Bias | Authors' judgement | Support for judgement |
| Random sequence generation (selection bias) | Low risk | Computer‐generated randomisation tables for each collaborating site, stratified by site |
| Allocation concealment (selection bias) | Low risk | Author confirmed allocation was concealed from investigators |
| Blinding of participants and personnel (performance bias) | Unclear risk | Study referred to as "double blind" and gelatin capsules (verum and placebo) were stated as being of identical appearance but no discussion of taste or smell. Author confirmed that investigators and patients were blinded. |
| Blinding of outcome assessment (detection bias) | Low risk | VT and VF events were assessed blinded to allocation |
| Incomplete outcome data (attrition bias) | High risk | Large numbers dropped out so some deaths, etc. may have been missed, 35% discontinued early due to non‐compliance but were assessed at study end, data censored for some participants |
| Selective reporting (reporting bias) | High risk | Trials registry data received September 2005, paper published November 2005 |
| Attention | Low risk | Time and attention appeared similar between the 2 arms |
| Compliance | High risk | Pill counts and platelet phospholipid data suggested greater omega 3 intake in intervention participants. 35% were non‐compliers (36.5% intervention, 34.2% control) |
| Other bias | Low risk | None noted |
| Methods | Effects of Dietary Flaxseed on Symptoms of Cardiovascular Disease in Patients With Peripheral Arterial Disease (FLAX PAD) RCT, parallel, (n‐3 ALA vs mixed fat), 12 months Summary risk of bias: low | |
| Participants | Patients with peripheral artery disease, over 40 years old N: 58 intervention, 52 control Level of risk for CVD: high (all had peripheral artery disease, 80% had hyperlipidaemia) Men: 74.1% intervention, 73.1% control Mean age in years (SD): 67.4 (8.06) intervention, 65.3 (9.4) control Age range: unclear Smokers: 19.2% intervention, 34.6% control Hypertension: 81% intervention, 69.2% control Medications taken by at least 50% of those in the control group: lipid lowering medication, antihypertensives, antithrombotics Medications taken by 20%‐49% of those in the control group: not reported Medications taken by some, but less than 20% of the control group: insulin or blood sugar‐lowering drugs Location: Canada Ethnicity: unclear | |
| Interventions | Type: food supplement (milled flaxseed) Comparison: ALA vs unclear (mix of wheat, wheat germ and mixed dietary oils) Intervention: food products (i.e. bagels, muffins, bars, pasta, buns, and milled seeds) containing 30 g of milled flaxseed daily. Dose: ˜6.8 g/d ALA (calculated based on 30 g milled flaxseed/d) Control: placebo food products (i.e. bagels, muffins, bars, pasta, buns, and milled seeds) containing a mixture of wheat, wheat bran, and mixed dietary oils to replace the flaxseed daily Compliance: plasma levels of enterolignans and the n‐3 fatty acid ALA were used as markers of dietary compliancy Length of intervention: 12 months | |
| Outcomes | Main study outcome: all‐cause mortality, cardiovascular mortality, stroke, and myocardial infarctions Dropouts: 15 intervention, 11 control Available outcomes: blood pressure, lipids, adverse events, plasma ALA Response to contact: yes (but no data provided) | |
| Notes | Different intervention dropout figures reported in two publications (13 or 15) Study funding: funded by government organisations but foods created and provided by a company | |
| Risk of bias | ||
| Bias | Authors' judgement | Support for judgement |
| Random sequence generation (selection bias) | Low risk | Randomly selected by a computer programme |
| Allocation concealment (selection bias) | Low risk | Allocation was concealed. The person who determined if a participant was eligible for inclusion in the trial was unaware, when this decision was made, of which group the subject would be allocated |
| Blinding of participants and personnel (performance bias) | Low risk | Product colour and texture were similar to disguise the composition of the product. Participants, personnel administering the intervention and those assessing the outcomes were blinded to group assignment |
| Blinding of outcome assessment (detection bias) | Low risk | All personnel that collected or analysed data were blinded to the intervention |
| Incomplete outcome data (attrition bias) | Low risk | All randomised accounted for in main outcomes |
| Selective reporting (reporting bias) | High risk | Prospectively registered October 2008, study start October 2008, primary outcome data completed March 2011, end date December 2017. Cardiovascular mortality and measures of adiposity not reported in a useable way |
| Attention | Low risk | Both groups had the same care |
| Compliance | Unclear risk | 12 in intervention group and 8 in placebo group unwilling to comply with diet |
| Other bias | Low risk | None noted |
| Methods | Randomized trial to assess efficacy of PUFA for the maintenance of sinus rhythm in persistent atrial fibrillation (FORWARD) RCT, parallel, (n‐3 EPA + DHA vs MUFA), 12 months Summary risk of bias: low | |
| Participants | Patients with paroxysmal atrial fibrillation N: 289 intervention, 297 control Level of risk for CVD: high Men: 57.8% intervention, 51.9% control Mean age in years (SD): 66.3 (12) intervention, 65.9 (10.5) control Age range: > 21 Smokers: 9% intervention, 6.2% control Hypertension: 92.2% intervention, 90.8% control Medications taken by at least 50% of those in the control group: aspirin, amiodarone, 'any antithrombotic treatment', beta‐blockers Medications taken by 20%‐49% of those in the control group: anticoagulants Medications taken by some, but less than 20% of the control group: none reported Location: Argentina Ethnicity: not reported | |
| Interventions | Type: supplement (capsule) Comparison: EPA + DHA vs MUFA Intervention: one capsule/ day containing 1 g of n‐3 PUFA (Societá Prodotti Antibiotici and SigmaTau, Italy) (provided 850 mg to 882 mg EPA/DHA). Dose: 0.85 g/d EPA + DHA Control: identical placebo capsule containing olive oil Compliance: not reported. Length of intervention: 12 months | |
| Outcomes | Main study outcome: survival free of atrial fibrillation Dropouts: 20 intervention, 25 control Available outcomes: mortality, MI, AF, heart failure, stroke, hospitalisation, side effects. Authors supplied further info on CVD events and methodology Response to contact: yes | |
| Notes | Study funding: through unrestricted grants provided by companies that supplied study drugs, however "these companies did not have representatives on the Steering Committee" who terminated the trial after 1 year | |
| Risk of bias | ||
| Bias | Authors' judgement | Support for judgement |
| Random sequence generation (selection bias) | Low risk | Quote: "Participants were centrally assigned to receive either 1 g of n‐3 PUFA or placebo in a ratio of 1:1" – computer generated in blocks of 4 and 6 stratified by study location |
| Allocation concealment (selection bias) | Low risk | As above, centrally allocated. Communication from authors was ambiguous, stated that the person recruiting was aware of which arm the individual would be allocated to, but that the "study was double‐blind, placebo‐controlled." |
| Blinding of participants and personnel (performance bias) | Low risk | Quote: "Each study site will be supplied with study drug and placebo in identically appearing packaging". "Both placebo and active treatment have the same odour and produce a comparable degree of fishy aftertaste" |
| Blinding of outcome assessment (detection bias) | Low risk | Quote: "Patients, investigator staff, persons performing the assessments, and data analysts will remain blind to the identity of the treatment from the time of randomisation until database lock" "The adjudication committee members are unaware of participant allocation and assess all available data and documentation with reference to pre‐established criteria". |
| Incomplete outcome data (attrition bias) | High risk | Quote: "the study was cut short by the trial steering committee due to 'a slower‐than‐expected recruitment rate and lower event rates'. This 'resulted in an underpowered clinical trial unable to verify its hypothesis'. Therefore the outcome data were not as complete as they were initially meant to be". |
| Selective reporting (reporting bias) | Low risk | Prospectively registered January 2008, study start January 2008, completion August 2011. All outcomes in trials registry appear to have been reported. |
| Attention | Low risk | Both intervention and control given the same exposure to research personnel. 2013 paper: "Clinical outcomes, adherence, and adverse events were assessed 2, 4, 8, and 12 months after randomization" |
| Compliance | Unclear risk | Not reported |
| Other bias | Low risk | None noted |
| Methods | Fish Oil in knee OSTeoARthritis (FOSTAR) RCT, parallel, (n‐3 EPA + DHA vs low n‐3), 24 months Summary risk of bias: low | |
| Participants | Adults aged 40+ years with knee osteoarthritis N: 101 intervention, 101 control Level of risk for CVD: low Men: 41% intervention, 60% control Mean age in years (SD): 60.8 (10) intervention, 61.1 (10) control Age range: > 40 Smokers: not reported Hypertension: not reported Medications taken by at least 50% of those in the control group: none reported Medications taken by 20%‐49% of those in the control group: not reported at baseline, but 'during' includes Vit. D ˜ 32% Medications taken by some, but less than 20% of the control group: not reported at baseline, but 'during' includes Glucocorticoid, HRT/anti‐resorptive, both ˜ 10% Location: Australia Ethnicity: not reported | |
| Interventions | Type: supplementary food (enriched orange juice) Comparison: high EPA + DHA vs low EPA + DHA plus ALA (replacement unclear, but low omega 3) Intervention: 1‐3 × a day drink of fruit juice mixed with day total = 15 mL of fish oil supplement (18% EPA, 12% DHA, 4.5 g/day total omega 3). Dose: 4.5 g/d EPA + DHA Control: liquid oral oil 15 mL sunola oil/day (which contains fish oil 2 mL plus 13 mL canola oil) (total omega‐3 fat: ≥ 0.45 g EPA + DHA from 15 mL) Compliance: assessed by measuring the oil volume in returned bottles, compliance was > 80% in both groups. Both groups had increases from baseline in plasma EPA and DHA with the high‐dose group having substantially larger increases, consistent with compliance with study oil Length of intervention: 24 months | |
| Outcomes | Main study outcome: change in pain scale of WOMAC index Dropouts: 18 intervention, 16 control Available outcomes: mortality, CVD events, adverse events, analgesic use, bone marrow density, weight gain and serum fatty acids Response to contact: yes | |
| Notes | Data on quality of life and pain score are presented in a figure and not in a usable format Study funding: government funding | |
| Risk of bias | ||
| Bias | Authors' judgement | Support for judgement |
| Random sequence generation (selection bias) | Low risk | Computer‐generated random allocation sequence |
| Allocation concealment (selection bias) | Low risk | A security‐protected central automated allocation procedure was used to allocate participants to one of the 2 treatment arms. This was performed centrally at one pharmacy and then used to allocate and administer the oil at each site |
| Blinding of participants and personnel (performance bias) | Low risk | Citrus flavouring was added to both oils to achieve comparable taste and optimise masking. Both were provided in identical dark 500‐mL bottles with similar labelling. At the end of the study, 52% of participants were unsure which group to which they had been allocated (50% high dose, 50% low dose). Of the remaining who thought they knew which group they were allocated, only 57% answered correctly, suggesting that blinding had been well maintained |
| Blinding of outcome assessment (detection bias) | Low risk | Participants and staff involved in patient care and assessment of BMD remained blinded throughout the study. |
| Incomplete outcome data (attrition bias) | Unclear risk | Oil intolerance in 1st year differed, others appear similar, but numbers confused |
| Selective reporting (reporting bias) | High risk | Prospectively registered August 2007, recruitment started July 2007, outcomes published 2016. Variety of outcomes such as quality of life stated in trials registry but not published. |
| Attention | Low risk | Same contact and instruction schedule for all participants. |
| Compliance | Low risk | Assessed by measuring the oil volume in returned bottles, compliance was > 80% in both groups. Both groups had increases from baseline in plasma EPA and DHA with the high‐dose group having substantially larger increases, consistent with compliance with study oil |
| Other bias | Low risk | None noted |
| Methods | RCT, parallel (n‐3 EPA + DHA vs MUFA), 12 months Summary risk of bias: moderate to high | |
| Participants | Adults with documented coronary heart disease N: 15 intervention, 15 control Level of risk for CVD: high Men: unclear Mean age in years (SD): 52 (9) intervention, 54 (7) control Age range: not reported Smokers: 87% intervention, 100% control Hypertension: not reported Medications taken by at least 50% of those in the control group: aspirin, beta‐blockers Medications taken by 20%‐49% of those in the control group: not reported Medications taken by some, but less than 20% of the control group: not reported Lipid lowering medications were not allowed Location: Germany Ethnicity: not reported | |
| Interventions | Type: fish oil capsules Comparison: EPA + DHA vs MUFA Intervention: 9 × 1 g capsules/day of fish oils (20% EPA, 15% DHA, 3.15 g/day total omega 3). Dose: 3.15 g/d EPA + DHA Control: 9 × 1 g capsules/day olive oil (which contains 6.3 g/day MUFA, 1.35 g/day SFA, 1.35 g/d total omega 6 fat) Compliance: assessed by pill counts and FA in body tissue analysis Length of intervention: 12 months | |
| Outcomes | Main study outcome: blood lipids and FA in body tissues Dropouts: 0 intervention, 0 control Available outcomes: mortality (nil death), CVD events (nil), lipids (only TC used as the others were different at baseline), adverse events, serum fatty acids Response to contact: yes | |
| Notes | Study funding: unclear | |
| Risk of bias | ||
| Bias | Authors' judgement | Support for judgement |
| Random sequence generation (selection bias) | Low risk | Computer‐generated list |
| Allocation concealment (selection bias) | Unclear risk | No details. They received their initial allocation in a sealed box in person; subsequent doses arrived in the post |
| Blinding of participants and personnel (performance bias) | Unclear risk | No further details beyond stating "double blind" |
| Blinding of outcome assessment (detection bias) | Unclear risk | No details |
| Incomplete outcome data (attrition bias) | Low risk | No attrition |
| Selective reporting (reporting bias) | Unclear risk | No trial register or protocol found |
| Attention | Low risk | No difference between groups |
| Compliance | Unclear risk | Measured but no results |
| Other bias | Low risk | None noted |
| Methods | RCT, parallel, (EPA + DHA vs unclear), 24 months Summary risk of bias: moderate or high | |
| Participants | Adults with Metabolic syndrome N: unclear, total randomised 101 Level of risk for CVD: low Men: 47% total, no details by group Mean age in years (SD): 55 (10) total Age range: 18‐75 years Smokers: 0% intervention, 0% control Hypertension: not reported Medications taken by at least 50% of those in the control group: not reported Medications taken by 20%‐49% of those in the control group: not reported Medications taken by some, but less than 20% of the control group: not reported Location: USA Ethnicity: unclear | |
| Interventions | Type: supplement (fish oil capsules) Comparison: EPA + DHA vs placebo (unclear what) Intervention: fO3FA capsules 1.8 g of EPA + DHA daily. Dose: 1.8 g/d EPA + DHA Control: matching placebo supplement Compliance: not reported Length of intervention: 12 months | |
| Outcomes | Main study outcome: change in carotid IMT Dropouts: unclear Available outcomes: lipids, insulin and glucose are stated as secondary outcomes but no usable data published Response to contact: no | |
| Notes | Results cannot be used as numbers are not reported by study arm. Study funding: unclear, but mentions that Pfizer, NIH and "Northwest Lipids Clinic" are partners | |
| Risk of bias | ||
| Bias | Authors' judgement | Support for judgement |
| Random sequence generation (selection bias) | Unclear risk | No details |
| Allocation concealment (selection bias) | Unclear risk | No details |
| Blinding of participants and personnel (performance bias) | Unclear risk | No data |
| Blinding of outcome assessment (detection bias) | Unclear risk | No data |
| Incomplete outcome data (attrition bias) | Unclear risk | No data |
| Selective reporting (reporting bias) | High risk | Inadequate detail in reporting as no full text publication found; Gill 2014 does give detail on carotid IMT, but not on other primary or secondary outcomes. The trial was prospectively registered (registered July 2006, unclear when recruitment started, final data collection 2011, first data published 2012). |
| Attention | Unclear risk | No data |
| Compliance | Unclear risk | No data |
| Other bias | Unclear risk | No data |
| Methods | Gruppo Italiano per la Sperimentazione della Streptochinasi nell'Infarto Miocardico – Heart Failure (GISSI‐HF) RCT, parallel, 2 arms (n‐3 EPA + DHA vs MUFA), 3.9 years | |
| Participants | Patients with chronic heart failure N: 3494 intervention, 3481 control Level of risk for CVD: high Men: 77.8% intervention, 78.8% control Mean age: 67 (11) intervention,67 (11) control Age range: 18+ years Smokers: 14.4% intervention, 13.9% control Hypertension: 54.0% intervention, 55.2% control Medications taken by at least 50% of those in the control group: ACE inhibitors, beta‐blockers, diuretics Medications taken by 20%‐49% of those in the control group: spironolactone, digitalis, oral anticoagulants, aspirin, nitrates, statin Medications taken by some, but less than 20% of the control group: ARBs, other antiplatelets, calcium channel blockers, amiodarone Location: Italy Ethnicity: unclear | |
| Interventions | Type: supplement (capsule) Comparison: EPA + DHA vs MUFA Intervention:1 capsule per day of 1 g n‐3 mainly EPA and DHA as ethyl esters in the average ratio of 1:1.2. Dose: ˜0.866 g/d EPA + DHA Control: 1 g/d matching olive oil placebo capsule Compliance: unclear Length of intervention: median 3.9 years | |
| Outcomes | Main study outcome: time to death or admission to hospital for cardiovascular reasons Dropouts: 34 intervention, 46 control (1004 intervention and 1029 control stopped study treatment) Available outcomes: mortality, CV mortality, MI, stroke, new heart failure, incident AF, resumed arrhythmia gatalitis Response to contact: yes (no data provided) | |
| Notes | Study funding: funders included Pfizer, AstraZeneca and others | |
| Risk of bias | ||
| Bias | Authors' judgement | Support for judgement |
| Random sequence generation (selection bias) | Low risk | Randomly assigned (with stratification by site) to treatment groups |
| Allocation concealment (selection bias) | Low risk | Randomly assigned (with stratification by site) to treatment groups by a concealed computerised telephone randomisation system |
| Blinding of participants and personnel (performance bias) | Unclear risk | Double blinding stated, but taste not reported as masked and blinding of participants not checked |
| Blinding of outcome assessment (detection bias) | Low risk | All events "adjudicated blindly by an ad‐hoc committee on the basis of pre‐agreed definitions and procedures" |
| Incomplete outcome data (attrition bias) | Low risk | Reasons for attrition and exclusion were stated and addressed. Numbers in each intervention compared to numbers were similar. |
| Selective reporting (reporting bias) | Unclear risk | Published rationale and design (Tavazzi 2004) suggested primary outcomes were deaths and death or CV hospitalisation (published). Secondary outcomes not stated and no trials registry entry found |
| Attention | Low risk | Scheduled clinic visits at 1, 3, 6 months then 6 monthly until the end of the trial (for both arms) |
| Compliance | Unclear risk | No details |
| Other bias | Low risk | No further bias noted |
| Methods | Gruppo Italiano per la Sperimentazione della Streptochinasi nell'Infarto Miocardico – Prevention (GISSI‐P) RCT, 2 × 2 (n‐3 EPA + DHA vs nil), 42 months Summary risk of bias: moderate or high | |
| Participants | People with recent (≤ 3 months) myocardial infarction N: 5666 intervention, 5658 control (99.9% follow‐up at study end) Level of risk for CVD: high Men: 85.7% intervention, 84.9% control Mean age in years (SD): 59.3 (10.6) intervention, 59.5 (10.5) years control Age range: < 50 to > 80 Smokers: 42.6% intervention, 42.3% control Hypertension: 36.2% intervention, 34.9% control Medications taken by at least 50% of those in the control group: anti‐platelet Medications taken by 20%‐49% of those in the control group: ACE inhibitors, beta‐blockers Medications taken by some, but less than 20% of the control group: lipid lowering Location: Italy Ethnicity: not reported | |
| Interventions | Type: supplement (capsule) Comparison: EPA + DHA vs nil Intervention: gelatin capsules of omega‐3‐acid ethyl esters 90 (Omacor), 1/d (850‐882 mg/d EPA + DHA daily, ratio 1:2) Dose: ˜0.866 g/d EPA + DHA Control: nil (no placebo) Compliance: capsule counts, 11.6% had stopped taking Omacor by 12 months, 28.5% by the end of the study Duration of intervention: median follow‐up 40 months | |
| Outcomes | Main study outcome: all cause mortality, CV mortality, stroke, MI Dropouts: unclear (however, all randomised were included in analyses) Available outcomes: total, sudden and CV deaths, MI, stroke, angioplasty or CABG, angina, CHD, cancer diagnosis, cancer death, combined CV events, side effects Response to contact: no | |
| Notes | Numbers are slightly different in different publications (Lancet 1999 paper used as main source). Half of both groups were on vitamin E supplements (300 mg/d synthetic α‐tocopherol) as this was the other 2 × 2 intervention. Study funding: Bristol Meyers Squibb, Pharmacia Upjohn, Societa Produtti Antibiotici, Pfizer | |
| Risk of bias | ||
| Bias | Authors' judgement | Support for judgement |
| Random sequence generation (selection bias) | Low risk | Telephone/computer network, stratified by hospital, based on a biased coin algorithm |
| Allocation concealment (selection bias) | Low risk | Randomisation by telephone with the coordinating centre |
| Blinding of participants and personnel (performance bias) | High risk | No placebo intervention (capsule vs nil) so participants not blinded |
| Blinding of outcome assessment (detection bias) | Low risk | "validation of clinical events ... was assured by an ad‐hoc committee of expert cardiologists and neurologists blinded to patients treatment assignment" |
| Incomplete outcome data (attrition bias) | Low risk | Clearly described, good follow‐up (< 28% dropped out over 3.5 years) |
| Selective reporting (reporting bias) | Unclear risk | No study protocol or trials registry entry was found |
| Attention | Low risk | Slight as no placebo, otherwise similar |
| Compliance | Unclear risk | Capsule counts, 11.6% had stopped taking Omacor by 12 months, 28.5% by the end of the study |
| Other bias | Low risk | No further bias noted |
| Methods | Harvard Atherosclerosis Reversibility Project (HARP) RCT, (n‐3 EPA + DHA vs MUFA), 24 months Summary risk of bias: moderate or high | |
| Participants | Patients with coronary heart disease N: 41 intervention, 39 control (99.9% follow‐up at study end) Men: 93.5% intervention, 92.9 % control Mean age in years (SD): 62 (7) intervention, 62 (7) years control Age range: 30‐75 Smokers: 0% (exclusion criteria) Hypertension: 48% intervention, 36% control Medications taken by at least 50% of those in the control group: beta blockers, antiplatelet agents Medications taken by 20%‐49% of those in the control group: calcium channel blockers, nitrates Medications taken by some, but less than 20% of the control group: ACE inhibitors, oral hypoglycaemic drugs Location: USA Ethnicity: not reported | |
| Interventions | Type: supplement (capsule) Comparison: LCn3 vs MUFA Intervention: 12 fish oil capsules/day (Promega, Parke‐Davis) in divided doses, preferably after meals. Each fish oil capsule contained 500 mg of n‐3 polyunsaturated fatty acids composed of EPA (240 mg), DHA (160 mg) and other (100 mg) (mainly DPA) providing total daily dose of 6 g of n‐3 fatty acids. Dose: 6 g/d LCn3 | |
| Outcomes | Main study outcome: regression of coronary artery lesions | |
| Notes | Study funding: National Heart, Lung, and Blood Institute (NHLBI), National Institutes of Health, Bethesda, Maryland, Warner Lambert‐Parke Davis, East Hanover, New Jersey; and by an Established Investigator Award to Dr Sacks from the American Heart Association, Dallas, Texas | |
| Risk of bias | ||
| Bias | Authors' judgement | Support for judgement |
| Random sequence generation (selection bias) | Low risk | Quote: "randomization" stratified by clinical management regime and total/HDL cholesterol ratio |
| Allocation concealment (selection bias) | Unclear risk | No further details |
| Blinding of participants and personnel (performance bias) | Unclear risk | Quote: "patients and personnel responsible for lab measurements, cardiac catheterization, and analysis of angiography films were blinded to the treatment assignment". Although capsules were identical in appearance, no information on their taste and smell |
| Blinding of outcome assessment (detection bias) | Low risk | Quote: "patients and personnel responsible for lab measurements, cardiac catheterization, and analysis of angiography films were blinded to the treatment assignment" |
| Incomplete outcome data (attrition bias) | Low risk | Low attrition rate over 28 months and all reasons are well documented |
| Selective reporting (reporting bias) | High risk | Trial registered retrospectively after publication |
| Attention | Low risk | Nothing in description implies the arms were treated differently |
| Compliance | Low risk | Very clear (P < 0.001) differences between arms for the 3 main n‐3 components in the fish oil |
| Other bias | Low risk | None noted |
| Methods | Healthy Eating to Reduce Overweight in people with type 2 diabetes (HERO) RCT, parallel, (n‐3 ALA vs low n‐3), 12 months Summary risk of bias: moderate or high | |
| Participants | Overweight adults with non‐insulin treated diabetes N: 26 intervention, 24 control (analysed, intervention: 18 control: 17) Level of risk for CVD: moderate Male %: not reported Mean age in years (SD): 54 (8.7), not reported by arm Age range: 33‐70 years Smokers: not reported Hypertension: not reported Medications taken by at least 50% of those in the control group: lipid lowering drugs, oral hypoglycemics Medications taken by 20%‐49% of those in the control group: not reported Medications taken by some, but less than 20% of the control group: not reported Location: Australia Ethnicity: not reported | |
| Interventions | Type: food supplement (walnuts) Comparison: ALA vs nil Intervention: 30 g/d snack portions of walnuts (provided 10% MUFA, 10% E PUFA, and a P/S ratio of 1.0) and advised not to take fish oil supplements. ALA dose not reported. Dose: ˜3 g/d ALA based on 30 g/d intake of walnuts Control: no supplements Both groups were given low‐fat isocaloric dietary advice (30% E fat (10% E SFA, 15% E MUFA; 5% E PUFA, P/S ratio of 0.5), 20% E protein and 50% E CHO) plus advice to brisk walk 30 min × 3 times/week Compliance: measured by erythrocyte membrane fatty acid levels which were similar in both groups Duration of intervention: 12 months | |
| Outcomes | Main study outcome: change in body weight and % body fat Dropouts: 8 intervention, 5 control Available outcomes: all cause mortality (nil deaths), weight, visceral adipose tissue, lipids, glucose, insulin, HbA1c (body fat % and subcutaneous adipose tissue measured but too different at baseline to use) Response to contact: not yet attempted | |
| Notes | Body fat % was too different between groups at baseline hence data not used Study funding: California Walnuts Commission | |
| Risk of bias | ||
| Bias | Authors' judgement | Support for judgement |
| Random sequence generation (selection bias) | Low risk | Randomisation was conducted using a computerised random number generator by a researcher independent of the subject interface. |
| Allocation concealment (selection bias) | Unclear risk | No further details |
| Blinding of participants and personnel (performance bias) | High risk | Quote: "Subjects, but not dietitians, were blinded to the type of overall diet (a prepackaged 30 g snack portion of walnuts was given to the walnut group unbeknown to the controls)". However, there was no placebo supplement, so blinding easily broken |
| Blinding of outcome assessment (detection bias) | Unclear risk | Paper states "code was concealed from the researchers collecting data, as well as from subjects." However as participants could not be blinded outcome assessors may not have been (problem for measures of adiposity, not for biochemical measures) |
| Incomplete outcome data (attrition bias) | High risk | High dropout rate 35 of 50 analysed (30% attrition rate) |
| Selective reporting (reporting bias) | Unclear risk | Trial was registered postanalysis |
| Attention | Low risk | Both groups appear to have had same level of attention |
| Compliance | High risk | ALA levels almost exactly the same in intervention and control |
| Other bias | Low risk | None noted |
| Methods | Japan Eicosapentaenoic acid Lipid Intervention Study (JELIS) RCT, parallel, 2‐arm (EPA capsule vs nil), 5 years Summary risk of bias: moderate or high | |
| Participants | People with hypercholesterolaemia N: intervention, 9326, control 9319 (analysed intervention 9326, control 9319) Level of risk for CVD: moderate (Patients with hypercholesterolaemia) Men: 32% intervention, 31% control Mean age in years (SD): 61 (8) intervention 61 (9) control Age range: 40‐75 years Smokers: 20% intervention, 18% control Hypertension: 36% intervention, 35% control Medications taken by at least 50% of those in the control group: statins Medications taken by 20%‐49% of those in the control group: calcium channel blockers, other antihypertensives Medications taken by some, but less than 20% of the control group: beta‐blockers, antiplatelet, hypoglycemics, nitrates Location: Japan Ethnicity: Japanese | |
| Interventions | Type: supplement (EPA capsule) Comparison 1: EPA vs nil Intervention: 3 × 2 × 300 mg capsules/d EPA ethyl ester (total dose of 1.8 g/d EPA), after meals. Dose: 1.8 g/d EPA Control: nothing (though all in both groups received "appropriate" dietary advice). All patients in both groups were on statins. Compliance: monitored by local physicians and measuring plasma fatty acids concentrations. Study drug regimens, 71% adhered EPA intervention, 73% adhered EPA control, 74% adhered statin Duration of intervention: maximum 5 years, mean 4.7 (1.1) years | |
| Outcomes | Main study outcome: major coronary events Dropouts: 1766 intervention, 1582 control (but all had endpoint evaluation) Available outcomes: major coronary events: sudden cardiac death, fatal or non‐fatal MI, unstable angina, angioplasty or CABG. Also all‐cause mortality, stroke, peripheral artery disease, cancer, lipids, rise in blood sugar, fasting glucose, HbA1c Response to contact: no | |
| Notes | Study funding: Mochida Pharmaceutical Company | |
| Risk of bias | ||
| Bias | Authors' judgement | Support for judgement |
| Random sequence generation (selection bias) | Low risk | Statistical co‐ordination centre: "permitted block randomisation with a block size of 4" |
| Allocation concealment (selection bias) | Low risk | Centralised. Statistical coordinating centre (see above) |
| Blinding of participants and personnel (performance bias) | High risk | Not blinded as there was no placebo. Quote: "[o]pen label blinded end point" |
| Blinding of outcome assessment (detection bias) | Low risk | "Clinical endpoints ... reported by local physicians were checked by members of a regional organizing committee in a blinded fashion. Then an endpoints adjudication committee ... confirmed them once a year without knowledge of the treatment allocation" |
| Incomplete outcome data (attrition bias) | Low risk | Well documented, dropout numbers low |
| Selective reporting (reporting bias) | Unclear risk | NCT00231738 registered October 2005, recruitment November 1996 to November 1999, main results published 2007. Rationale and design paper published in 2003 (reported baseline characteristics, so before completed follow‐up, but after data collection began). All reported outcomes appear to have been published. |
| Attention | Low risk | Slight, as no placebo provided to control group, but only capsules to intervention group. Otherwise 2 groups appeared to be treated equally |
| Compliance | Unclear risk | Monitored by local physicians and measuring plasma fatty acids concentrations. Study drug regimens,71% adhered EPA intervention, 73% adhered EPA control, 74% adhered statin |
| Other bias | Low risk | No further bias noted |
| Methods | RCT, parallel, (fish oil vs nil), 12 months Summary risk of bias: moderate or high | |
| Participants | Patients with persistent atrial fibrillation (AF) on warfarin N: 92 intervention, 90 control (91 and 87 analysed ITT) Level of risk for CVD: high Male %: 82.4 intervention, 72.4 control Mean age in years (SD): 63 (10) intervention, 61(13) control Age range: 18‐85 years (inclusion criteria) Smokers: 22.2% intervention, 11.5% control Hypertension: 45.6% intervention, 58.6% control Medications taken by at least 50% of those in the control group: anti‐arrhythmic drugs, renin‐angiotensin system inhibitors Medications taken by 20%‐49% of those in the control group: statins Medications taken by some, but less than 20% of the control group: not reported Location: Australia Ethnicity: not reported | |
| Interventions | Type: fish oil capsule Comparison: EPA + DHA vs nil Intervention: 6 capsules/day of a fish oil preparation containing a total dose of 1.02 g of EPA and 0.72 g DHA. Participants in the omega‐3 group were asked to continue fish oils till a maximum of 1 year or till return of persistent AF. Dose: 1.7 g/d EPA + DHA Control: no supplements. Patients were advised not to take any fish oil supplements. All patients underwent cardioversion following randomisation. Compliance: was monitored on a weekly basis via telephone and during follow‐up by using a pill count plus serum EPA and DHA levels which were significantly increased Duration of intervention: 1 year (or AF recurrence) | |
| Outcomes | Main study outcome: atrial fibrillation recurrence Dropouts: 4 intervention, 0 control Available outcomes: all‐cause mortality (nil death), AF recurrence, time to AF recurrence, adverse events Response to contact: contact not yet established | |
| Notes | Study funding: the study was funded in part by the National Heart Foundation of Australia and the Pfizer Cardiovascular Lipid Research Grant. | |
| Risk of bias | ||
| Bias | Authors' judgement | Support for judgement |
| Random sequence generation (selection bias) | Unclear risk | Patients were randomised to a control or an omega‐3 group in a 1:1 fashion (no details of method) |
| Allocation concealment (selection bias) | Unclear risk | No further details |
| Blinding of participants and personnel (performance bias) | High risk | Open label with no placebo control |
| Blinding of outcome assessment (detection bias) | High risk | Open label |
| Incomplete outcome data (attrition bias) | Low risk | ITT analysis was conducted |
| Selective reporting (reporting bias) | Unclear risk | Trial registered 2005 but data collection started 2003 |
| Attention | Unclear risk | Intervention group had capsules, while control group did not. Potential for greater contact and checking with intervention group on this basis, although otherwise both groups seem to have had the same care. |
| Compliance | Low risk | EPA and DHA levels were significantly higher in intervention group |
| Other bias | Low risk | None noted |
| Methods | RCT, parallel, (fish oil vs nil), 12 months Summary risk of bias: moderate or high | |
| Participants | Patients > 60 years with sinoatrial node disease and dual chamber pacemakers N: 39 intervention, 39 control randomised (18 intervention vs 39 control at 12 months) Level of risk for CVD: moderate/high Male %: 46% intervention, 56% control Mean age in years (SD): 78 (7) intervention, 77(8) control Age range: not reported Smokers: not reported Hypertension: 72% Medications taken by at least 50% of those in the control group: statin, renin‐angiotensin system inhibitors Medications taken by 20%‐49% of those in the control group: anti‐arrhythmic drugs Medications taken by some, but less than 20% of the control group: not reported Location: Australia Ethnicity: not reported | |
| Interventions | Type: omega 3 capsule Comparison: EPA + DHA vs nil Intervention: a triglyceride preparation containing a total of 6 g/day of omega‐3 polyunsaturated fatty acids of which 1.8 g/day were n‐3 (1.02 g EPA and 0.72 g DHA). Dose: 1.8 g/d EPA + DHA Control: no supplements Compliance: measured by weekly dietary history and pill count. Fatty acid status measured at randomisation and between 1‐3 months post randomisation (blood samples). Duration of intervention: median 378 days | |
| Outcomes | Main study outcome: atrial fibrillation burden Dropouts: 1 intervention, 0 control Available outcomes: all cause mortality, CV mortality, AF (frequency and duration but not recurrence so not used), adverse events Response to contact: written but no contact yet | |
| Notes | Study funding: unclear | |
| Risk of bias | ||
| Bias | Authors' judgement | Support for judgement |
| Random sequence generation (selection bias) | Low risk | Randomisation was performed using sequentially numbered, opaque, sealed envelopes. |
| Allocation concealment (selection bias) | Low risk | As above |
| Blinding of participants and personnel (performance bias) | High risk | Open label design |
| Blinding of outcome assessment (detection bias) | High risk | Quote: "At each visit, stored AT/AF diagnostic data were retrieved in an un‐blinded fashion" |
| Incomplete outcome data (attrition bias) | High risk | Only 1 lost, and reason explained. 21 of the 39 randomised to the intervention were crossed over to control at 6 months so 12‐month outcomes are reported for 17/18 intervention while baseline characteristics are reported for the 39 patients. |
| Selective reporting (reporting bias) | Low risk | Trial prospectively registered and outcomes stated were reported |
| Attention | Unclear risk | As only the intervention group had supplements there was potential for attention differences. Other contact appears the same. |
| Compliance | Low risk | EPA was 3‐fold higher and DHA 1.8 fold higher compared with controls. EPA and DHA did not change significantly in controls upon repeat testing |
| Other bias | High risk | Odd design – 21 of the 39 randomised to the intervention were crossed over to control at 6 months |
| Methods | RCT‐ parallel, 2 arms (omega 3 vs corn oil), 12 months Summary risk of bias: low | |
| Participants | People with Crohn's disease in remission (but with a recent relapse) N: 70 intervention, 63 control Level of risk for CVD: low Men: 35.7% intervention, 27.0% control Mean age in years (SD): 29.5 (9.6) intervention, 31.8 (10.9) control Age range: 17‐62 years intervention, 17‐65 years control Smokers: not reported Hypertension: not reported Medications taken by at least 50% of those in the control group: methylprednisolone (all for 1st 8 weeks) Medications taken by 20%‐49%: not reported Medications taken by some, but < 20%: not reported Location: Germany Ethnicity: not reported | |
| Interventions | Type: supplement (fish oil) Comparison: EPA + DHA vs omega 6 Intervention: 2 × 3 1 g gelatin capsules/d of ethylester fish oil concentrate (3.3 g/d EPA + 1.8 g/d DHA). Dose: 5.1 g/d EPA + DHA Control: 2 × 3 1 g gelatin capsules/d of corn oil Compliance: pill count, 5 non‐compliant patients, among compliant patients, 18 were censored (for not using the medication for 3 continuous weeks) Duration of intervention: 12 months | |
| Outcomes | Main study outcome: Crohn's disease duration of remission Dropouts: unclear Available outcomes: mortality (nil), Crohn's disease activity and relapses, serum triglycerides Response to contact: yes (methodological details provided) | |
| Notes | There was a third arm of dietary advice (for low CHO diet) Study funding: not reported | |
| Risk of bias | ||
| Bias | Authors' judgement | Support for judgement |
| Random sequence generation (selection bias) | Low risk | Randomised within the centres in blocks of six (block size blinded to the centres) |
| Allocation concealment (selection bias) | Low risk | Author reported allocation was concealed |
| Blinding of participants and personnel (performance bias) | Low risk | Quote: "Double blind conditions were intended for the verum‐placebo comparisons". Author stated that capsules were identical in appearance (taste not mentioned). |
| Blinding of outcome assessment (detection bias) | Low risk | Primary outcome was relapses "classified in a blind fashion by a primary end‐point committee" |
| Incomplete outcome data (attrition bias) | High risk | Participants were accounted for based on the main outcome of the study (relapses), however 20% omitted from analyses and numbers confusing |
| Selective reporting (reporting bias) | Unclear risk | No trials registry entry or protocol found |
| Attention | Low risk | All patients were seen by their physician in the respective centre after regular time intervals (1, 2, 3, 6, 9 and 12 months). |
| Compliance | Unclear risk | Pill count, 5 non‐compliant patients, among compliant patients, 18 were censored (for not using the medication for three continuous weeks). 23 of 133 non‐compliant |
| Other bias | Low risk | None noted |
| Methods | Multidomain Alzheimer Preventive Trial (MAPT) 4 arms RCT, parallel, (n‐3 ± multidomain intervention vs placebo ± multidomain intervention), 36 months Summary risk of bias: low | |
| Participants | Population: people aged at least 70 years without dementia but with memory complaint, IADL limitation or slow gait speed N: 840 intervention (arms 1 and 3), 840 control (arms 2 and 4) randomised. Numbers analysed differ by outcome. Level of risk for CVD: low Men: 37.2% intervention, 34.5% control. (combined groups) Mean age in years (SD): 75.6 (4.7) and 74.4 (4.4) intervention, 75.1 (4.3) and 75 (4.1) control Age range: not reported Smokers: not reported Hypertension: not reported Medications taken by at least 50% of those in the control group: not reported Medications taken by 20%‐49% of those in the control group: not reported Medications taken by some, but less than 20% of the control group: not reported Location: France and Monaco Ethnicity: not reported | |
| Interventions | Type: supplement (capsule) Comparison: EPA + DHA vs paraffin oil (non‐fat) Intervention Arm 1: omega‐3 (V0137 CA 800 mg/d DHA; 225 mg/d EPA in soft caps). Dose for arms 1 and 3: 1.025 g/d EPA + DHA Arm 3: omega 3 (V0137 CA 800 mg/d DHA; 225 mg/d EPA in soft caps) plus multi‐domain intervention (nutrition, physical exercise, cognitive stimulation, social activities) Control: Arm 2: placebo capsules containing flavoured paraffin oil. All capsules were supplied by Pierre Fabre Médicament (Castres, France) Arm 4: placebo capsules plus multi‐domain intervention (nutrition, physical exercise, cognitive stimulation, social activities) Compliance: adherence to study interventions was assessed every 6 months. For supplementation, adherence was assessed by counting the number of capsules returned by participants (or based on treatment dates if the number of capsules was missing). Furthermore, biological samples were obtained at baseline and after 12 months to assess concentrations of DHA and EPA in red blood cell membranes. Duration of intervention: 36 months | |
| Outcomes | Main study outcome: change in cognitive function ) Dropouts: 200 intervention, 194 control Available outcomes: mortality, CVD events, haemorrhagic stroke, adverse events, functional capacity, other cognitive functions, safety and tolerability Response to contact: no | |
| Notes | Study funding: Gérontopôle of Toulouse, the French Ministry of Health (PHRC 2008, 2009), the Pierre Fabre Research Institute (manufacturer of the polyunsaturated fatty acid supplement), Exhonit Therapeutics, and Avid Radiopharmaceuticals | |
| Risk of bias | ||
| Bias | Authors' judgement | Support for judgement |
| Random sequence generation (selection bias) | Low risk | Participants were randomly assigned (1:1:1:1) to the combined intervention (i.e. the multidomain intervention plus polyunsaturated fatty acids), the multidomain intervention plus placebo, polyunsaturated fatty acids only, or placebo only. A computer‐generated randomisation procedure (done by ClinInfo, a subcontractor) was used with block sizes of 8 and stratification by centre. |
| Allocation concealment (selection bias) | Low risk | A clinical research assistant, who was not involved in the assessment of participants, used a centralised interactive voice response system to identify which group to allocate the participant to, and which lot number to administer. |
| Blinding of participants and personnel (performance bias) | Low risk | All participants and study staff were blinded to polyunsaturated fatty acid or placebo assignment – both sets of capsules looked and tasted identical. In view of the nature of the multidomain intervention, the study was unblinded for this component, but the independent neuropsychologists who were trained to assess cognitive outcomes were blinded to group assignment. |
| Blinding of outcome assessment (detection bias) | Low risk | All participants and study staff were blinded to polyunsaturated fatty acid or placebo assignment—both sets of capsules looked and tasted identical. In view of the nature of the multidomain intervention, the study was unblinded for this component, but the independent neuropsychologists who were trained to assess cognitive outcomes were blinded to group assignment. Data analysts were not blinded to group assignment, but two data managers, one statistician (CC) and two physicians (SA and BV) did a blinded data review. |
| Incomplete outcome data (attrition bias) | Low risk | 1680 participants were enrolled and randomly allocated, the modified intention‐to‐treat population (N = 1525), i.e. 155 excluded (9% over 3 years) |
| Selective reporting (reporting bias) | Low risk | Protocol registered ClinicalTrials.gov (NCT00672685) – outcomes match report. Because of advances in the field since our trial was designed in 2007, we decided to modify the primary outcome from one cognitive test to a composite cognitive score, which is now thought to be a better endpoint. This protocol amendment was submitted to the local ethical committee on 2 February 2015 and was subsequently approved |
| Attention | Low risk | Both groups assessed at baseline, 6, 12, 24, 36 months. Groups 1 and 2 only differed by content of capsules. |
| Compliance | Unclear risk | Adherence to study interventions was assessed every 6 months, by counting the number of capsules returned (or based on treatment dates if the number of capsules was missing). Biological samples were obtained at baseline and after 12 months to assess concentrations of DHA and EPA in red blood cell membranes, but outcomes not reported. |
| Other bias | Low risk | None noted |
| Methods | Mediterranean alpha‐linolenic enriched Groningen dietary intervention study (MARGARIN) RCT, factorial 2 × 2 (ALA rich margarine vs LA rich margarine, also nutrition education vs no education but this is not included), 2 years | |
| Participants | Hypercholestrolemic adults with 2 or more CVD risk factors N: total 282 randomised; 114 intervention (51 with nutrition education, 58 without NE) 157 control (52 with NE, 105 without NE) Level of risk for CVD: moderate (multiple cardiovascular risk factors, 10‐year IHD risk ˜20%) Mean age in years (SD): 54.4 (9.5) intervention, 53.9 (9.8) control Age range: 30‐70 Smokers: 49.1% intervention, 49.3% control Hypertension: 52.9% intervention, 45.3% control (on anti‐hypertensives) Medications taken by at least 50% of those in the control group: antihypertensives Medications taken by 20%‐49%: not reported Medications taken by some, but < 20%: not reported Location: the Netherlands Ethnicity: not reported | |
| Interventions | Type: supplementary food (ALA enriched margarine) Intervention: provided with ALA rich margarine (80% fat of which 15% was ALA and 46% LA) to be eaten ad libitum. Dose: average intake 6.3 g/d ALA (was also 1 g/d ALA in the control group). Control: provided with linoleic rich margarine (80% fat of which 0.3% was ALA and 58% LA), identical in taste and packaging. Both margarines contained 0.66 mg vit E/g, 9 micro‐g vit A/g and 0.023 micro‐g vit D/g Comparison: ALA vs omega 6 | |
| Outcomes | Main study outcome: cardiovascular risk factors and IHD risk | |
| Notes | Study funding: Prevent fund and Unilever Research Other intervention (2 × 2) was educational, teaching a multifactorial dietary intervention. It was excluded as multifactorial. | |
| Risk of bias | ||
| Bias | Authors' judgement | Support for judgement |
| Random sequence generation (selection bias) | Low risk | Computer‐generated random allocation, allocated by an independent trial coordination centre that organised masked distribution of margarines |
| Allocation concealment (selection bias) | Low risk | Allocated by an independent trial coordination centre which organised masked distribution of margarines |
| Blinding of participants and personnel (performance bias) | Low risk | Double‐blind; the 2 margarines are described as identical as to taste and packaging (though not reported as checked) |
| Blinding of outcome assessment (detection bias) | Low risk | 2 independent physicians, a cardiologist and a general practitioner validated and classified results in a blinded fashion |
| Incomplete outcome data (attrition bias) | Low risk | The number randomised to each arm was unclear, but one publication clarifies (55 randomised to each arm, 51 intervention and 52 control analysed). |
| Selective reporting (reporting bias) | Unclear risk | No study protocol or trials registry entry was found. |
| Attention | High risk | There was no difference in attention between margarine types, but the dietary advice group spent more time with study staff than the control group, and some (not quite randomly allocated) were sent individual motivational letters (Siero 2000). |
| Compliance | Low risk | Serum fatty acids used to assess, ALA rose by 0.47 mol% (SD 0.04) and 0.36 mol % (SD 0.04) intervention arms (with and without NE) and fell by 0.06 mol % (SD 0.04) and 0.11 mol % (SD 0.03) control arms (with and without NE), Significantly different |
| Other bias | Low risk | No further bias noted |
| Methods | Modulation of Atherosclerosis Risk by Increasing dose of n‐3 fatty Acids (MARINA) RCT, parallel, 4 arms (n‐3 PUFA 3 different doses or olive oil placebo), 12 months Summary risk of bias: low | |
| Participants | Non‐smoking men and women aged 45‐70 years N: intervention. 279 in 3 groups (G1 0.45 g/d n = 94, G2 0.9 g/d n = 93, G3 1.8 g/d n = 92); control: 88 (analysed G1 0.45 g/d n = 81, G2 0.9 g/d n = 80, G3 1.8 g/d n = 80, control 71) Level of risk for CVD: low Men: 38.7% intervention, 38.6% control Mean age in years (CI): G1: 55 (53, 56), G2: 55 (54, 56), G3: 55 (54, 57) intervention 55 (54,57) control Age range: 45‐70 Smokers: 0% intervention, 0% control Hypertension: 5.4% intervention, 5% control Medications taken by at least 50% of those in the control group: none Medications taken by 20%‐49% of those in the control group: none Medications taken by some, but less than 20% of the control group: statins, antihypertensives, HRT, thyroxine Location: UK Ethnicity: G1: white 80.9%, black 4.3%, Asian 6.4%, East Asian 4.3%, other 4.3% G2: white 78.5%, black 6.5%, Asian 10.8%, East Asian 0%, other 4.3% G3: white 85.9%, black 1.1%, Asian 2.2%, East Asian 4.3%, other 6.5% Control: white 77.3%, black 10.2%, Asian 6.8%, East Asian 2.3%, other 3.4% | |
| Interventions | Type: supplement (fish oil capsules) Comparison 1: EPA + DHA vs MUFA Comparison 2: high EPA + DHA vs low EPA + DHA Intervention: 3 × 1 g oil gelatin capsule/day consisting of blend of EPA concentrate, DHA concentrate, refined olive oil and 0.1% peppermint oil. Providing a daily dose of: 0.45 g, 0.9 g, or 1.8 g per day (all with EPA/DHA ratio of 1.51). Dose: 1.8 g/d EPA + DHA (G3 used for outcomes) Control: 3 gelatin capsules/ day containing refined olive oil + 0.1% peppermint oil Compliance: measured by capsule counting and erythrocyte lipids for proportion of EPA/DHA @ baseline, 6 months, 12 months. 88.5% of participants consumed > 90% of capsules provided. EPA and DHA in erythrocyte lipids increased in dose‐dependent manner compared with placebo, indicating long‐term compliance with intervention. Length of intervention: 12 months | |
| Outcomes | Main study outcome: endothelial function, arterial stiffness Dropouts: 38 intervention (13,13,12), 17 control Available outcomes: lipids, dietary intake, CRP, BP (supine and ambulatory – numeric data not provided, but study states that there were no significant differences between arms). Weight data not used as baseline is different between groups (FMD, arterials stiffness, carotid intima media thickness, heart rate variability, heart rate, endothelial progenitor cells reported but not used) Contact with authors: yes (many outcomes above provided in end of study report from authors) | |
| Notes | Outcome data used G3 (highest dose) vs placebo for continuous outcomes and combined the 3 intervention groups vs placebo for dichotomous outcomes Study funding: Food Standards Agency | |
| Risk of bias | ||
| Bias | Authors' judgement | Support for judgement |
| Random sequence generation (selection bias) | Low risk | Quote: "the random allocation sequence was generated with a computer program by using the process of minimisation to balance age, sex and ethnicity between treatment groups." |
| Allocation concealment (selection bias) | Low risk | Quote: "We enrolled eligible participants and the study database program allocated a serious of capsules to the participant. The treatments associated with the capsule codes were concealed from all investigators and associated clinical staff until the data analysis was complete. The code breaker was an employee of MedSciNet who constructed the trial database." |
| Blinding of participants and personnel (performance bias) | Low risk | Quote: "We enrolled eligible participants and the study database program allocated a serious of capsules to the participant. The treatments associated with the capsule codes were concealed from all investigators and associated clinical staff until the data analysis was complete. The code breaker was an employee of MedSciNet who constructed the trial database." "blends of the test fat with 0.1% peppermint oil to disguise the fish taste of the EPA and DHA" (peppermint oil in both intervention and control capsules) |
| Blinding of outcome assessment (detection bias) | Low risk | Quote: "We enrolled eligible participants and the study database program allocated a serious of capsules to the participant. The treatments associated with the capsule codes were concealed from all investigators and associated clinical staff until the data analysis was complete. The code breaker was an employee of MedSciNet who constructed the trial database." |
| Incomplete outcome data (attrition bias) | Low risk | 15% withdrawal, reasons for attrition reported |
| Selective reporting (reporting bias) | Low risk | Outcomes published match trials register. Registered September 2008, trial started June 2008, ended December 2010, main publication 2011 |
| Attention | Low risk | No difference between groups |
| Compliance | Low risk | Statistically significant difference in erythrocyte omega 3 fats at 12 months between different arms |
| Other bias | Low risk | None noted |
| Methods | Metabolism, Exercise and Nutrition at UCSD (MENU) RCT, parallel, (walnut rich moderate fat diet vs moderate fat diet), 12 months Summary risk of bias: moderate or high | |
| Participants | Overweight and obese women, of whom half were insulin resistant N: 82 intervention, 81 control (analysed, intervention: 65 control: 61) Level of risk for CVD: low Men: 0% intervention, 0% control Mean age (SD) years: 51 (NR) intervention, 50 (NR) control Age range: 22‐67 years intervention, 25‐72 years control Smokers: not reported Hypertension: not reported Medications taken by at least 50% of those in the control group: not reported Medications taken by 20%‐49% of those in the control group: not reported Medications taken by some, but less than 20% of the control group: 10% were on cholesterol medications Location: USA Ethnicity: Hispanic 18% intervention, 14% control; black 9% intervention, 3% control; Asian American 1% intervention, 4% control; white non‐Hispanic 71% intervention, 78% control. | |
| Interventions | Type: food and advice Comparison: walnut rich moderate fat diet (ALA) vs moderate fat diet (MUFA) Intervention: advice to follow walnut‐rich higher fat diet (35%E fat with limited SFA, MUFA encouraged, including 42 g/d walnuts (provided by study), 45%E CHO, 20%E protein). Participants given print materials on diet and exercise, attended group sessions weekly for 1st 4 months, biweekly for next 2 months, then monthly to 1 year), provided web‐based tracking for dietary constituents, scale, pedometer, measuring cups and exercise videos. Regular dietetic and group leader support. Clinic visits were at 0, 6 and 12 months. Dose: ˜4.2 g/d ALA (calculated based on 42 g/d intake of walnuts) Control: exactly as intervention for goals, materials and support except higher fat diet did not include walnuts (35% E fat with limited SFA, MUFA encouraged, 45%E CHO, 20%E protein) Compliance: walnut consumption reported on form and nuts provided. Red blood cell ALA significantly higher in intervention at 12 months than control Duration of intervention: 12 months | |
| Outcomes | Main study outcome: body weight Dropouts: 13 of 82 intervention, 12 of 81 control Available outcomes: weight, waist circumference, HDL and LDL cholesterol, triglycerides, insulin, glucose, HOMA‐IR, HOMA‐beta, CRP and IL‐6 (estradiol, SHBG, nutrient gene interactions, physical activity and heart rate also presented) Response to contact: no reply received to date | |
| Notes | Study funding: National Cancer Institute and California Walnut Commission | |
| Risk of bias | ||
| Bias | Authors' judgement | Support for judgement |
| Random sequence generation (selection bias) | Low risk | Randomisation stratified by age and insulin resistance |
| Allocation concealment (selection bias) | Unclear risk | No details |
| Blinding of participants and personnel (performance bias) | High risk | Open study, participants were advised on their diets extensively |
| Blinding of outcome assessment (detection bias) | Unclear risk | Blinding not mentioned, so unclear for their primary outcome, weight |
| Incomplete outcome data (attrition bias) | Low risk | Paper states ITT analysis but 25 dropouts (15%) not included in 1 year data, but dropout reasons clear |
| Selective reporting (reporting bias) | Low risk | Pre‐registered, all mentioned outcomes reported at 12 months |
| Attention | Low risk | Appear very equal |
| Compliance | Low risk | Statistically significant difference between intervention and control arms for ALA in blood cell membranes at 12 months |
| Other bias | Low risk | None noted |
| Methods | RCT, parallel, (EPA capsules vs nil), 2 years Summary risk of bias: moderate to high | |
| Participants | Japanese type 2 diabetics N: intervention. 40, control: 41 (analysed 30, 30) Level of risk for CVD: moderate Men: 53% intervention, 67% control Mean age in years (SD): 59 (11.2) intervention 61.2 (8.4) control Age range: not reported Smokers: 40% intervention, 43% control Hypertension: not reported Medications taken by at least 50% of those in the control group: oral hypoglycemics Medications taken by 20%‐49% of those in the control group: insulin, lipid lowering drugs, antihypertensives Medications taken by some, but less than 20% of the control group: antithrombotics Location: Japan Ethnicity: 100% Japanese | |
| Interventions | Type: supplement (EPA oil capsules) Comparison: EPA vs nil Intervention: 1800 mg/d EPA EPADEL capsules (Mochida Pharmaceutical Co Ltd Japan)‐ 98% pure ethyl‐ester EPA (unclear how many caps). Dose: ˜1.8 g/d EPA Control: no intervention Compliance: checked during 3 month reviews throughout trial and 5 participants were excluded for poor compliance but no details on method or results Length of intervention: mean 2.1 (0.2) years | |
| Outcomes | Main study outcome: progression of diabetic macroangiopathy measured by carotid intima‐media thickness and brachial‐ankle pulse wave velocity Dropouts: 10 intervention, 11 control Available outcomes: BMI, lipids, BP, HbA1c, cancer diagnosis Response to contact: not yet attempted | |
| Notes | Blood pressure data not used as groups are different at baseline Study funding: not stated | |
| Risk of bias | ||
| Bias | Authors' judgement | Support for judgement |
| Random sequence generation (selection bias) | Low risk | Patients randomly divided into 2 groups matched for age and gender |
| Allocation concealment (selection bias) | Unclear risk | No details |
| Blinding of participants and personnel (performance bias) | High risk | Open label |
| Blinding of outcome assessment (detection bias) | Low risk | Assessors of main study outcomes were blinded to the treatment |
| Incomplete outcome data (attrition bias) | Low risk | Dropout rate (26%) over 2 years. All dropouts explained, however, 5 were excluded for poor compliance but no clear predefined protocol for exclusion |
| Selective reporting (reporting bias) | Unclear risk | No protocol |
| Attention | Low risk | All participants had the same contact |
| Compliance | Unclear risk | Compliance measured but no clear methods or reported results |
| Other bias | Low risk | None noted |
| Methods | Nutritional AMD Treatment‐2 (NAT2) RCT, parallel, (EPA + DHA vs MUFA), 36 months Summary risk of bias: low | |
| Participants | Patients with early age related macular degeneration N: 150 intervention, 150 control Level of risk for CVD: high (92.5% intervention and 79.8 controls had past CVD) Men: 31.3% intervention, 39.5% control Mean age in years (SD): 73.9 (6.6) intervention, 73.2 (6.8) control Age range: 55‐85 Smokers: 6.7% intervention, 8.5% control Hypertension: 58% total (not reported by study arm) Medications taken by at least 50% of those in the control group: lipid‐lowering medication Medications taken by 20%‐49% of those in the control group: agents acting on renin‐angiotensin system, anti‐inflammatory and anti‐rheumatic products Medications taken by some, but less than 20% of the control group: insulin or blood sugar lowering drugs Location: France Ethnicity: unclear | |
| Interventions | Type: supplement (fish oil capsule) Comparison: EPA + DHA vs MUFA Intervention: 3 daily fish oil capsules containing 1110 total n‐3 FAs (EPA: 270 mg/day DHA: 840 mg/day) and vit E: 6 mg/day. Dose: 1.1 g/d EPA + DHA Control: 3 × 602 mg olive oil capsules a day containing 0.2 g total PUFA and vit E: 0.09 g/d Compliance: assessed during visits from unused capsules and serum PUFA levels. Overall compliance over the 3 years; 69.4% intervention, 70.5% control Length of intervention: 36 months | |
| Outcomes | Main study outcome: time to occurrence of choroidal new vessels (CNV) in the study eye from prospective assessment of fluorescein angiography Dropouts: 29 intervention, 34 control Available outcomes: all cause mortality, plasma lipids, adverse events, serum FAs Response to contact: yes (no added data) | |
| Notes | TG data not used as presented as median (5th‐95th percentile) Study funding: Laboratoire Chauvin, Bausch & Lomb Inc | |
| Risk of bias | ||
| Bias | Authors' judgement | Support for judgement |
| Random sequence generation (selection bias) | Low risk | QL Ranclin software was used to generate the randomisation list before enrolment. The patients and the study personnel both were blinded to the treatment assignment |
| Allocation concealment (selection bias) | Low risk | As above |
| Blinding of participants and personnel (performance bias) | Low risk | The capsules had the same appearance, the same size, and the same weight (602 mg) in both DHA and placebo groups. No masking flavour was added to the capsules, which were otherwise odourless |
| Blinding of outcome assessment (detection bias) | Low risk | Author confirmed blinding of outcome assessors |
| Incomplete outcome data (attrition bias) | Low risk | Any temporary discontinuation of the treatment was considered to be a deviation from the study protocol. Discontinuation for more than 5 months was considered to be a major deviation from the study protocol. Participants who dropped out were taken in account in the survival analysis and occurrence of CNV and were counted at last angiography performed. |
| Selective reporting (reporting bias) | Unclear risk | ISRCTN98246501. Retrospectively registered May 2007, recruitment started December 2003, completed November 2008, key publication 2013 |
| Attention | Low risk | Same amount of time spend with both study arms |
| Compliance | Low risk | Assessed during visits from unused capsules and serum PUFA levels. Overall compliance over the 3 years; 69.4% intervention, 70.5% control |
| Other bias | Low risk | None noted |
| Methods | RCT, parallel, (DHA + EPA vs MUFA), 12 months Summary risk of bias: moderate or high | |
| Participants | Patients with persistent atrial fibrillation with at least 1 relapse after cardioversion N: 102 intervention, 103 control. (analysed, intervention: 94 control: 94) Level of risk for CVD: high Men: 70% intervention, 63% control Mean age in years (SD): 70 (6) intervention, 69 (9) control Age range: not reported (18‐80 inclusion criteria) Smokers: 10% intervention, 9.1% control Hypertension: 47% intervention, 40% control Medications taken by at least 50% of those in the control group: beta‐blockers, ACE inhibitors, anticoagulant therapy, amiodarone Medications taken by 20%‐49% of those in the control group: diuretics, antiplatelet, statins Medications taken by some, but less than 20% of the control group: calcium channel blockers Location: Italy Ethnicity: not reported | |
| Interventions | Type: supplement (omega‐3‐acid ethyl esters 90: Omacor) Comparison: EPA + DHA vs MUFA Intervention: 2 × 1 g/d Omacor (total 1.7 g/d EPA + DHA at a ratio of 0.9 to 1.5). Dose: 1.7 g/d EPA + DHA Control: 2 × 1 g/d olive oil (gelatin capsules identical in appearance to Omacor) Compliance: no details Duration of intervention: 12 months | |
| Outcomes | Main study outcome: probability of maintenance of sinus rhythm Dropouts: 6 intervention, 5 control Available outcomes: adverse events, AF recurrence (nil death) Response to contact: no | |
| Notes | Study funding: 'Centro per lo Studio ed il Trattamento dello Scompenso Cardiaco' of the University of Brescia, Brescia, Italy. The work of Dr Campia was supported by National Institutes of Health grant K12 HL083790‐01a1 | |
| Risk of bias | ||
| Bias | Authors' judgement | Support for judgement |
| Random sequence generation (selection bias) | Low risk | Random assignment followed a computer‐generated randomisation list obtained using blocks of size 4 |
| Allocation concealment (selection bias) | Low risk | The randomisation schedule was kept in the research pharmacy area and was available only to unblinded pharmacy personnel until after the database was locked. At that time, the unblinded patient treatment information was made available to the investigators. |
| Blinding of participants and personnel (performance bias) | Unclear risk | Placebo gelatin capsules identical in appearance to Omacor. However no information provided as to their smell and taste. |
| Blinding of outcome assessment (detection bias) | Unclear risk | No details |
| Incomplete outcome data (attrition bias) | Low risk | All randomised were accounted for. ITT analysis for main outcomes |
| Selective reporting (reporting bias) | Unclear risk | NCT01198275. Registered retrospectively in September 2010, study started January 2006, completed May 2008, main publication 2011 |
| Attention | Low risk | No difference between groups |
| Compliance | Unclear risk | No details |
| Other bias | Low risk | None noted |
| Methods | RCT, parallel, (DHA + EPA vs MUFA), 12 months Summary risk of bias: moderate or high | |
| Participants | People with heart failure (non‐ischaemic dilated cardiomyopathy) N: 67 intervention, 66 control. (analysed, intervention: 67 control: 66) Level of risk for CVD: high Men: 95.5% intervention, 84.9% control Mean age in years (SD): 61 (11) intervention, 64 (9) control Age range: not reported (18‐75 inclusion criteria) Smokers: not reported Hypertension: not reported Medications taken by at least 50% of those in the control group: beta‐blockers, ACE inhibitors, furosemide, amiodarone, aldosterone blockers Medications taken by 20%‐49% of those in the control group: not reported Medications taken by some, but less than 20% of the control group: statins, ARB Location: Italy Ethnicity: not reported | |
| Interventions | Type: supplement (Omacor) Comparison: EPA + DHA vs MUFA Intervention: 2 × 1 g/d Omacor (1.7 g/d EPA + DHA at a ratio of 0.9 to 1.5) Control: 2 × 1 g/d olive oil (gelatin capsules identical in appearance to Omacor) Compliance: pill counts – participants were withdrawn if < 80% capsules taken (none were withdrawn). Fatty acid EPA + DHA 0.83% in intervention group, 0.41% in control group. Duration of intervention: 12 months | |
| Outcomes | Main study outcome: left ventricular function and functional capacity Dropouts: 0 intervention, 0 control Available outcomes: mortality (nil death), combined CVD events, AF, BMI, hospitalisation for cardiovascular reasons, hospitalisation for worsening heart failure, lipids, blood glucose (but too different at baseline to use), serum cytokine Response to contact: yes | |
| Notes | Study funding: Centro per lo Studio ed il Trattamento dello Scompenso Cardiaco, one author was a consultant for 8 pharmaceutical companies | |
| Risk of bias | ||
| Bias | Authors' judgement | Support for judgement |
| Random sequence generation (selection bias) | Unclear risk | Quote: "randomised" |
| Allocation concealment (selection bias) | Unclear risk | Not described |
| Blinding of participants and personnel (performance bias) | High risk | Paper states that placebo and verum were identical and that the study was double blind, but blinding of participants not checked. Author confirmed investigators not blinded |
| Blinding of outcome assessment (detection bias) | High risk | Author confirmed assessors not blinded |
| Incomplete outcome data (attrition bias) | Unclear risk | Unclear whether all participants were assessed for all outcomes (e.g. hospitalisation), but some outcomes report no attrition |
| Selective reporting (reporting bias) | Unclear risk | NCT01223703 – study registration October 2010, recruitment November 2007 to June 2009. Retrospective |
| Attention | Low risk | No suggestion of this, and investigators appeared blinded (so could not differ in attention provided by allocation) |
| Compliance | Low risk | See characteristics table |
| Other bias | Low risk | None noted |
| Methods | RCT, parallel, (MorDHA capsules vs unclear placebo), 14 months Summary risk of bias: moderate or high | |
| Participants | Patients with chronic traumatic spinal cord injury N: 55 intervention, 55 control. (analysed, intervention: 54 control: 50) Level of risk for CVD: low Men: 81.5% intervention, 82% control Mean age in years (SD): 51.15 (13.43) intervention, 54.12 (11.76) control Age range: 15‐74 years intervention, 30‐74 years control Smokers: 0% (exclusion criteria) Hypertension: not reported Medications taken by at least 50% of those in the control group: not reported Medications taken by 20%‐49% of those in the control group: not reported Medications taken by some, but less than 20% of the control group: not reported Location: Iran Ethnicity: not reported | |
| Interventions | Type: supplement (n‐3 capsules) Comparison: EPA + DHA vs placebo (unclear what) Intervention: 2 MorDHA capsules (providing 870 mg DHA and 130 mg EPA) per day. Dose: 1 g/d DHA + EPA Control: 2 placebo capsules per day. Both capsules were similar in colour, shape, and taste. Both groups received one calcium capsules per day consisting of 1000 mg calcium and 400 IU vitamin D. Compliance: pill counts – compliance averaged 80% in both groups Duration of intervention: 14 months | |
| Outcomes | Main study outcome: professionals evaluation of neurological function Dropouts: 1 intervention, 5 control Available outcomes: functional measures (total and sub‐scales), BMI, leptin and adiponectin concentration. Response to contact: no | |
| Notes | Study funding: PhD university funding. Omega 3 capsules were provided by Minami Nutrition Co (Aartselaar, Belgium) and placebo capsules were supplied by Zahravi Pharmaceutical Co. (Tabriz, Iran). Calcium capsules were provided by Darou Pakhsh Pharm Co. (Tehran, Iran) | |
| Risk of bias | ||
| Bias | Authors' judgement | Support for judgement |
| Random sequence generation (selection bias) | Low risk | Randomised using permuted balanced block randomisation method |
| Allocation concealment (selection bias) | Unclear risk | No further detail on allocation |
| Blinding of participants and personnel (performance bias) | Unclear risk | Stated as double blind but content of placebo not stated and no report of attempt to mask n‐3 FA taste. |
| Blinding of outcome assessment (detection bias) | Low risk | Unclear, few details |
| Incomplete outcome data (attrition bias) | Low risk | Attrition was 1 in intervention group, 5 in control group, so minor. "the two most common reasons for dropouts were experiencing GI side effects or difficulty to maintain scheduled clinic visits" |
| Selective reporting (reporting bias) | High risk | Some of the outcomes stated in the trial register are not reported. Registered March 2011, study start November 2010, completion April 2012 |
| Attention | Low risk | No difference between groups |
| Compliance | Unclear risk | Pill counts – compliance averaged 80% in both groups |
| Other bias | Low risk | None noted |
| Methods | Norwegian Vegetable Oil Experiment of 1965‐6 RCT, parallel, 2 arms (ALA linseed oil vs omega 6 sunflower oil), 1 year Risk of bias: moderate or high | |
| Participants | Men working in Norwegian companies aged 50‐59 years N: 6716 intervention, 6690 control Men: 100% Mean age in years (SD): unclear Age range: 50‐59 years Smokers: unclear (˜48% non‐smokers) Hypertension: unclear Medications taken by at least 50% of those in the control group: not reported Medications taken by 20%‐49% of those in the control group: not reported Medications taken by some, but less than 20% of the control group: not reported Location: Norway Ethnicity: unclear | |
| Interventions | Type: supplementary food (oil) Comparison: ALA vs omega 6 Intervention: linseed oil, 10 mL/d (55% ALA), 5.5 g/d ALA, 1.5 g/d linoleic. Dose: 5.5 g/d ALA Control: sunflower oil, 10 mL/d (1.4% ALA), 0.1 g/d ALA, 6.3 g/d linoleic. Vitamin E was added to both oils. Compliance: 73% were still taking the linseed oil at 1 year, 72% were still taking their sunflower oil at 1 year (unclear how this was ascertained) Duration of intervention: 12 months | |
| Outcomes | Main study outcome: morbidity and mortality Dropouts: survival status was traced for all but 4 included men, health status was missing for about 80 men in total or 0.6%. Available outcomes: total and CV deaths, MI, angina, stroke, peripheral vascular disease, combined CV events, total cholesterol (subgroup) Response to contact: no | |
| Notes | Study funding: not stated | |
| Risk of bias | ||
| Bias | Authors' judgement | Support for judgement |
| Random sequence generation (selection bias) | Unclear risk | Paper states "simple randomisation" without clarification |
| Allocation concealment (selection bias) | Unclear risk | Few details provided |
| Blinding of participants and personnel (performance bias) | Low risk | Paper states that the workplace doctors who administered the trial locally were sent bottles for each participant marked only with their trial number, and that "appearance and taste of the products were so similar that most participants were unable to identify the type" |
| Blinding of outcome assessment (detection bias) | Low risk | Company physicians recorded health status, and were also blinded to intervention (as above) |
| Incomplete outcome data (attrition bias) | Low risk | Detailed description, and those who left employment during the study were followed up for survival and morbidity via the main health system |
| Selective reporting (reporting bias) | Unclear risk | No protocol or trials registration found |
| Attention | Low risk | As company physicians administered oils and assessed outcomes but were blind to treatment arm there could not be attention bias |
| Compliance | Unclear risk | 73% were still taking the linseed oil at 1 year, 72% were still taking their sunflower oil at 1 year (unclear how this was ascertained) |
| Other bias | Low risk | No further bias noted |
| Methods | Nutristroke RCT, parallel, (diet rich in vitamins and omega 3 plus omega 3 supplement vs diet rich in vitamins and omega 3), 12 months Summary risk of bias: moderate or high | |
| Participants | People in a rehabilitation unit who had survived a stroke N: 38 intervention, 34 control. (analysed, intervention: 32 control: 20) Level of risk for CVD: high Men: 74% intervention, 56% control Mean age in years (SD): 61.3 (13.6) n‐3, 66.3 (11.4) n‐3 + antioxidant intervention, 68.4 (12.6) placebo, 65.1 (12.8) antioxidant – control Age range: not reported Smokers: not reported Hypertension: not reported Medications taken by at least 50% of those in the control group: not reported Medications taken by 20%‐49% of those in the control group: not reported Medications taken by some, but less than 20% of the control group: not reported Location: Italy Ethnicity: not reported | |
| Interventions | Type: supplement (capsule) Comparison: fish oil vs unclear placebo Intervention: fish oil gelatin capsules including 250 mg DHA + 250 mg EPA. Dose: 0.5 g/d EPA + DHA Control: "identical to supplement but contained no antioxidants or polyunsaturated fatty acids" Compliance: appears to have been assessed at meetings or on the phone monthly, but results unclear Duration of intervention: 12 months | |
| Outcomes | Main study outcome: functional status in stroke survivors Dropouts: 6 intervention, 14 control Available outcomes: mortality and cardiovascular mortality, lipids (6 months), albumin and lymphocyte counts (6 months), Barthel Index (functional status), neurological impairment (not reported by intervention group), mobility, adiposity (no numerical data presented; quote: "there were no statistically significant differences in body weight, BMI, arm circumference and triceps skin fold at the different time points") Response to contact: not yet attempted | |
| Notes | 2 × 2 study that also had an antioxidant supplementary focus (supplementary vitamins C and E, beta carotene and polyphenols) Study funding: Italian Ministry of Health, Sigma‐Tau Health Science provided omega 3 capsules | |
| Risk of bias | ||
| Bias | Authors' judgement | Support for judgement |
| Random sequence generation (selection bias) | Unclear risk | Quote: "randomized by means of a specific list" |
| Allocation concealment (selection bias) | Unclear risk | Randomisation methodology not mentioned |
| Blinding of participants and personnel (performance bias) | Unclear risk | Quote: "the placebo was identical to the supplement but contained no antioxidants or polyunsaturated fatty acids; no patient, research assistant, investigator or any other medical or nursing staff could distinguish the placebo from the supplements during the study". However, only one placebo discussed and unclear whether it was a placebo capsule (for omega 3) or pill (for antioxidants) |
| Blinding of outcome assessment (detection bias) | Low risk | Quote: "assays were quality control checked by internal standard and calibration curve in a random and double blind way" |
| Incomplete outcome data (attrition bias) | High risk | High rates of dropouts |
| Selective reporting (reporting bias) | Unclear risk | No protocol or trials registry entry found |
| Attention | Low risk | All assessments and treatments appear equal across the intervention groups |
| Compliance | Unclear risk | Appears to have been assessed at meetings or on the phone monthly, but results unclear |
| Other bias | Low risk | None noted |
| Methods | Randomisation: parallel, 3 groups (omega 3 vs olive oil vs aspirin and dipyridamole), 1 year Risk of bias: moderate or high | |
| Participants | People undergoing PTCA N: 36 intervention, 37 control (also 35 allocated to arm 3, aspirin and dipyridamole) Level of risk for CVD: high (people undergoing angioplasty) Men: 78% intervention, 76% control Mean age in years (SD): 54 (8) intervention, 55 (8) control years Age range: unclear Smokers: unclear Hypertension: unclear Medications taken by at least 50% of those in the control group: not reported Medications taken by 20%‐49% of those in the control group: not reported Medications taken by some, but less than 20% of the control group: not reported Location: New Zealand Ethnicity: unclear | |
| Interventions | Type: supplement (capsules) Comparison: EPA vs MUFA Intervention: MaxEPA capsules 12/d (2.2 g EPA). Dose: 2.2 g/d EPA Control: olive oil capsules, 12/d, identical to MaxEPA. Both capsules included vitamin E Compliance: no data Length of intervention: 12 months | |
| Outcomes | Main study outcome: angina, restenosis Dropouts: none Available outcomes: angina, interventions, lipids (Nil death) Response to contact: no | |
| Notes | Study funding: Medical Research Council of New Zealand and Scherer Ltd (who supplied MaxEPA and the olive oil capsules) | |
| Risk of bias | ||
| Bias | Authors' judgement | Support for judgement |
| Random sequence generation (selection bias) | Unclear risk | Quote: "randomly divided without exclusions into 3 groups" |
| Allocation concealment (selection bias) | Unclear risk | Unclear, no further info |
| Blinding of participants and personnel (performance bias) | Unclear risk | States that placebo capsules were identical to the MaxEPA, and "neither the patient nor the attending cardiologist knew which capsules were being used" (but no masking of taste was reported, and participant guesses as to allocation were not reported) |
| Blinding of outcome assessment (detection bias) | Low risk | Quote: "neither the patient, nor the attending cardiologist knew which capsules were being used" ... "Angioplasty was repeated electively at one year or before where symptoms recurred, and assessed without knowledge of the patient's treatment group." |
| Incomplete outcome data (attrition bias) | Unclear risk | Some participants were lost to follow‐up and reasons for this were unclear |
| Selective reporting (reporting bias) | Unclear risk | No protocol or trials registration found |
| Attention | Low risk | No suggestion of attention bias, symptomatic patients were reviewed between scheduled visits, otherwise all on the same schedule |
| Compliance | Unclear risk | No data |
| Other bias | Low risk | No further bias noted |
| Methods | Omacor Following Acute Myocardial Infarction (OFAMI) RCT, parallel, 2 arms (omega 3 vs corn oil), 2 years | |
| Participants | Patients recruited 4‐8 days after confirmed MI N: 150 intervention, 150 control Level of risk for CVD: high Men: 77% intervention, 82% control Mean age in years (SD): 64.4 intervention, 63.6 control (no SD) Age range: 28‐86 years intervention, 29‐87 years control Smokers: 39% intervention, 38% control Hypertension: 29% intervention, 23% control Medications taken by at least 50% of those in the control group: b‐blockers, aspirin Medications taken by 20%‐49% of those in the control group: statins, ACE inhibitors Medications taken by some, but less than 20% of the control group: diuretics, warfarin Location: Norway Ethnicity: unclear | |
| Interventions | Type: supplement (capsules) Comparison: EPA + DHA vs omega 6 Intervention: 4 gelatin capsules of omega‐3‐acid ethyl esters 90 (Omacor, Pronova A/S, Oslo, Norway), each is 1 g containing 850‐882 mg EPA and DHA as concentrated ethylesters Dose ˜3.4‐ 3.5 g/d EPA + DHA Control: corn oil capsules, 4/d, each contains 1 g of corn oil Compliance: assessed by questionnaire and capsule count, 82% intervention group had complete compliance after 6 weeks, 86% of controls Length of intervention: 24 months | |
| Outcomes | Main study outcome: CV events Available outcomes: total and CV deaths, MI, unstable angina, interventions, combined CV events, BMI, lipids, BP (authors provided additional data on glucose, AF, stroke) Response to contact: yes | |
| Notes | Study funding: Pharmacia‐Upjohn and Pronova | |
| Risk of bias | ||
| Bias | Authors' judgement | Support for judgement |
| Random sequence generation (selection bias) | Unclear risk | Quote: "randomly assigned" – Pharmacia was responsible for randomisation. Author response: participants were randomised in blocks of 4 |
| Allocation concealment (selection bias) | Low risk | Author confirmed allocation was concealed |
| Blinding of participants and personnel (performance bias) | Low risk | Identical capsules containing either Omacor or corn oil. Double blinding stated, but taste not reported as masked and blinding of participants not checked |
| Blinding of outcome assessment (detection bias) | Low risk | Author stated: all later analyses performed without the knowledge of outcome |
| Incomplete outcome data (attrition bias) | Unclear risk | Number of dropouts was unclear |
| Selective reporting (reporting bias) | Unclear risk | Trials registry NCT01422317. Outcomes reported in trials registry appear to have been published, but registration was retrospective. |
| Attention | Low risk | All participants appear to have been reviewed at the same intervals |
| Compliance | Unclear risk | Assessed by questionnaire and capsule count, 82% intervention group had complete compliance after 6 weeks, 86% of controls |
| Other bias | Low risk | No further bias noted |
| Methods | Effect of Omega 3 fatty acids on reduction of sudden cardiac death after MI (OMEGA) 2 arm, parallel RCT (omega 3 vs olive oil), 12 months Summary risk of bias: low | |
| Participants | People who have had an acute myocardial infarction N: 1940 intervention,1911 control (analysed for primary endpoints 1919 intervention, 1885 control) Level of risk for CVD: high Men: 75.1% intervention, 73.7% control Age (median): 64.0 years, intervention, 64.0 years control Age range: unclear (upper and lower quartiles 54‐72) Smokers: 35.9% intervention, 37.5% control Hypertension: 66.9% intervention, 66.1% control Medications taken by at least 50% of those in the control group: statins, ACE inhibitors, beta‐blockers, clopidogrel, aspirin Medications taken by 20%‐49%: diuretics Medications taken by some, but < 20%: AT1 receptor blockers, vit K antagonist, calcium channel blockers, digitalis, amiodarone, oral antidiabetics, insulin Location: Germany Ethnicity: not reported | |
| Interventions | Type: supplement (capsules) Comparison: EPA + DHA vs MUFA Intervention: 1 × 1 g/d Pronova BiCare soft gelatin capsule 'zodin' omega‐3 acid ethyl esters (460 mg/d EPA and 386 mg/d DHA). Dose: 0.85 g/d EPA + DHA Control: 1 × 1 g/d olive oil capsule identical to intervention Compliance: 93.1% of intervention group and 93.2% of control participants took > 70% of capsules Duration of intervention: 12 months | |
| Outcomes | Main study outcome: sudden cardiac death, cardiac arrest Dropouts: Control: 26 (8‐lost to follow‐up, 2‐withdrew before allocation, 16‐excluded.) intervention: 21 Available outcomes: deaths, CV mortality, MACCE, MI, arrhythmias, heart failure, stroke, revascularisation, lipids, authors supplied information on angina, depression, cancers, AF Response to contact: yes | |
| Notes | Study funding: Tromsdorff Arzneimittel commissioned the research | |
| Risk of bias | ||
| Bias | Authors' judgement | Support for judgement |
| Random sequence generation (selection bias) | Low risk | Randomisation code generated by alpha med PHARBIL, done in blocks of 8. Randomisation was stratified by centre. |
| Allocation concealment (selection bias) | Low risk | Appearance of the drugs or the drug containers did not allow patients and physicians to deduce the study arm. 4‐digit number on a concealed container |
| Blinding of participants and personnel (performance bias) | Low risk | Capsules for placebo and intervention looked the same, randomisation code unknown to investigator (taste and smell not mentioned) |
| Blinding of outcome assessment (detection bias) | Low risk | Classification of adverse events blinded to allocation, and there was a blinded endpoint committee for all pre‐specified outcomes |
| Incomplete outcome data (attrition bias) | Low risk | All events were documented by the investigators and reported to the assigned clinical research organisation and the sponsor. The data safety monitoring board judged any imbalances between the study arms. |
| Selective reporting (reporting bias) | Low risk | NCT00251134 registered in 2005. Study start date: 2003, Completed: 2008, study design: 2006, Published paper: 2010. All trials registry primary and secondary outcomes reported |
| Attention | Low risk | Capsules for both arms |
| Compliance | Low risk | 93.1% of intervention group and 93.2% of control participants took > 70% of capsules. EAIC 0.65 intervention, and control |
| Other bias | Low risk | None noted |
| Methods | Older People And n‐3 Long‐chain polyunsaturated fatty acid (OPAL) 2 arm, parallel, RCT, 12 months | |
| Participants | Healthy cognitively normal adults aged 70‐79 years N: 434 intervention, 433 control (analysed 376 intervention, 372 control) Level of risk for CVD: low Men: 53.4% intervention, 56.6% control Mean age in years (SD): 74.7 (2.5) intervention, 74.6 (2.7) control Age range: 70‐79 years Smokers: not reported Hypertension: 54.9% intervention, 56.9% control Medications taken by at least 50% of those in the control group: not reported Medications taken by 20%‐49%: not reported Medications taken by some, but < 20%: not reported Location: England and Wales Ethnicity: not reported | |
| Interventions | Type: supplement (capsules) Comparison: EPA + DHA vs MUFA Intervention: 2 × 650 mg capsule/d Ocean Nutrition vanilla flavoured soft gelatin capsule (total daily dose of 200 mg EPA and 500 mg DHA). Dose: 0.7 g/d EPA + DHA Control: 2 × 650 mg olive oil capsule identical to intervention Compliance: count returned capsules. Capsules not returned:
Fasting serum fatty acids, mg/L, mean (SD)
Length of intervention: 24 months | |
| Outcomes | Main study outcome: delayed onset of cognitive decline Dropouts: control: 78 (8 died, 53 withdrew, 17 discontinued intervention but provided data); intervention: 67 (9 died, 49 withdrew, 9 discontinued intervention but provided data) Available outcomes: deaths, MI, arrhythmias, stroke, diabetes, lipids Response to contact: yes | |
| Notes | Study funding: UK Food Standards Agency, NHS R&D provided support costs | |
| Risk of bias | ||
| Bias | Authors' judgement | Support for judgement |
| Random sequence generation (selection bias) | Low risk | Participants were "selected in random blocks". "Research nurses telephoned a central computerized randomization service to obtain treatment allocation codes". |
| Allocation concealment (selection bias) | Low risk | Central allocation via telephone |
| Blinding of participants and personnel (performance bias) | Low risk | Identical capsules (vanilla‐flavoured, dark‐brown coloured). Supplements packaged into identical pots, each containing 180 capsules, labelled by staff not involved in the study. All project staff were unaware of group assignments until after data analysis. |
| Blinding of outcome assessment (detection bias) | Low risk | All project staff were unaware of group assignments until after data analysis. |
| Incomplete outcome data (attrition bias) | Low risk | Participants who discontinued the supplements invited to an interview at 24 months. Dropouts explained and similar in both arms (intervention 49 withdrew, control 53 withdrew) |
| Selective reporting (reporting bias) | High risk | ISRCTN72331636. Trial registered 2004, before study began. Protocol published 2006. Publication of first results 2010. Many outcomes, such as depression and BP were stated in trials registry entry but not reported. |
| Attention | Low risk | All participants had the same review schedule, and staff were unaware of assignments |
| Compliance | Low risk | Count returned capsules. Capsules not returned (intervention ‐ median: 0.95; IQR: 0.82, 1.00; control ‐ median: 0.95; IQR: 0.81, 1.00). Fasting serum fatty acids, mg/L, mean (SD): EPA, intervention 49.9 (2.7); control 39.1 (3.1). DHA, intervention 95.6 (3.1); control 70.7 (2.9). α‐linoleic: intervention 21.5 (0.8); control 22.0 (0.9) |
| Other bias | Low risk | No further bias noted |
| Methods | Outcome Reduction With Initial Glargine Intervention (ORIGIN) RCT, 2 × 2 factorial, (capsule of n‐3 fatty acids or placebo), 72 months Summary risk of bias: low | |
| Participants | People at high risk of CV events with impaired fasting glucose, impaired glucose tolerance or diabetes N: 6319 intervention, 6292 control. (analysed, intervention: 6281 control: 6255) Level of risk for CVD: moderate Men: 65.4% intervention, 64.7% control Mean age in years (SD): 63.5 (7.8) intervention, 63.6 (7.9) control Age range: unclear, eligible if aged ≥ 50 years Smokers: current smokers 12.1% intervention, 12.6% control Hypertension: 78.7% intervention, 80.3% control Medications taken by at least 50% of those in the control group: ACE inhibitor or ARB, aspirin or other antiplatelet, beta‐blocker, statin, glucose‐lowering drug Medications taken by 20%‐49%: calcium‐channel blocker Medications taken by some, but less than 20%: thiazide diuretics, anticoagulant Location: 40 study locations in Europe and the Americas Ethnicity: unclear | |
| Interventions | Type: supplement capsule (Omacor) Comparison: EPA + DHA vs MUFA Intervention: 1 gelatin capsule/d Omacor containing at least 900 mg ethyl esters of n‐3 fats (465 mg EPA + 375 mg DHA). Dose: 0.84 g/d EPA + DHA Control: 1 × 1 g gelatin capsule/d olive oil Compliance: methods of assessment unclear, but reported that "rates of adherence to the study‐drug regimen were similar in the two groups with 96% of patients continuing to receive the study drug at 1 year ... and 88% at the end of the study". Length of intervention: 74 months mean follow‐up (median 6.2 years) | |
| Outcomes | Main study outcome: composite of the First Occurrence of Cardiovascular (CV) Death, Nonfatal Myocardial Infarction (MI) or Nonfatal Stroke Dropouts: 38 intervention, 37 control (some of the remainder did not have final outcome status, were lost or withdrew consent, but were included in analysis) Available outcomes: mortality, CV mortality, fatal arrhythmia, MI, stroke, heart failure, angina, revascularisation, breast cancer, cancer diagnoses and cancer deaths, BP, lipids (HbA1c given as medians only) Response to contact: yes but no data provided | |
| Notes | The other 2 × 2 assignment was to insulin glargine versus standard care, and is not discussed here. Results are reported here for the trial duration and not the follow‐up post trial (the ORIGIN and Legacy Effects, ORIGINALE). Study funding: Sanofi Aventis, Omacor provided by Pronova Biocare | |
| Risk of bias | ||
| Bias | Authors' judgement | Support for judgement |
| Random sequence generation (selection bias) | Low risk | Quote: "randomized by an automated telephone randomization system (using randomly varying block sizes)" |
| Allocation concealment (selection bias) | Low risk | As above |
| Blinding of participants and personnel (performance bias) | Low risk | Study described as "double blind" and placebo described as identical. Blinding of patients, investigators, local and central trials personnel described. However, no information provided as to the capsule's smell and taste |
| Blinding of outcome assessment (detection bias) | Low risk | Quote: "all primary and secondary outcomes were adjudicated with the use of prespecified definitions by a committee whose members were unaware of study‐group assignments" |
| Incomplete outcome data (attrition bias) | Low risk | Almost all participants were included in outcomes |
| Selective reporting (reporting bias) | Low risk | NCT00069784 – registered October 2003, study started August 2003, final data collection December 2011. Most outcomes appear to have been reported in various publications (cardiovascular events only reported by glargine randomisation). |
| Attention | Low risk | No suggestion of differences between groups |
| Compliance | Unclear risk | Methods of assessment unclear, but reported that "rates of adherence to the study‐drug regimen were similar in the two groups with 96% of patients continuing to receive the study drug at 1 year ... and 88% at the end of the study" |
| Other bias | Low risk | None noted |
| Methods | Omega‐3 fatty acids randomised long‐term (ORL) RCT‐ parallel, 3 arms (TAK‐085 2 g, TAK‐085 4 g, and EPA‐E 1.8 g), 12 months Summary risk of bias: moderate or high | |
| Participants | Population: Japanese adults with hypertriglyceridaemia N: 171 intervention (4 g TAK), 165 control (2 g TAK) Level of risk for CVD: moderate Men: 70.8% intervention, 71.5% control Mean age in years (SD): 55.9 (10.12) intervention, 56 (10.95) control Age range: 20‐74 Smokers (current): 27.5% intervention, 31.5% control Hypertension: 66.7% intervention, 67.3% control Medications taken by at least 50% of those in the control group: HMG‐CoA reductase inhibitor Medications taken by 20%‐49%: statin Medications taken by some, but less than 20%: not reported Location: Japan Ethnicity: unclear | |
| Interventions | Type: supplement (TAK‐085 capsules) Comparison: EPA + DHA higher vs lower dose Intervention: 1 × 2/d capsule each containing 2 g of TAK‐085 (1 g of fatty acid in TAK‐085 capsules contains approximately 465 mg of EPA‐E plus 375 mg of DHA‐E). Total dose of 1.86 g/d EPA + 1.5 g/d DHA. Dose: ˜3.4 g/d EPA + DHA) (difference of +1.7 g/d from control arm) Control: 1 capsule/d containing 2 g of TAK‐085 (1 g of fatty acid in TAK‐085 capsules contains approximately 465 mg of EPA‐E plus 375 mg of DHA‐E). Total dose of 0.93 g/d EPA + 0.75 g/d DHA. Dose: 1.7 g/d EPA + DHA Compliance: monitored every 4 weeks, mean rate of compliance reported as > 96% in each group Length of intervention: 12 months | |
| Outcomes | Main study outcome: safety outcomes and adverse events Dropouts: group 1: 8, group 2: 14, group 3 (not analysed): 21 Available outcomes: adverse events (including CVD events, cancers), CRP, waist circumference, weight, blood pressure (nil death), lipids provided as % change from baseline, but no baseline data available, so not used in meta‐analyses Response to contact: no | |
| Notes | A third arm of EPA‐E 1.8 g supplementation is not used here. Outcome data used TAK‐4 vs TAK‐2 Study funding: Takeda Pharmaceutical Company | |
| Risk of bias | ||
| Bias | Authors' judgement | Support for judgement |
| Random sequence generation (selection bias) | Low risk | Randomisation was stratified according to statin use and performed by an independent registration centre |
| Allocation concealment (selection bias) | Low risk | As above |
| Blinding of participants and personnel (performance bias) | High risk | Open label |
| Blinding of outcome assessment (detection bias) | High risk | Open label |
| Incomplete outcome data (attrition bias) | Low risk | All participants were accounted for and analysed for main outcomes |
| Selective reporting (reporting bias) | Low risk | Trials registry entry May 2011, study start date November 2009, completion November 2011, so partially retrospective. However, entry appears to reflect reported outcomes. |
| Attention | Low risk | Capsules, appears similar |
| Compliance | Low risk | Monitored every 4 weeks, mean rate of compliance reported as > 96% in each group |
| Other bias | Low risk | None noted |
| Methods | RCT, parallel, (EPA + DHA fish oil vs omega 6 sunola oil), 12 months Summary risk of bias: low | |
| Participants | Patients with rheumatoid arthritis < 12 months' duration, DMARD‐naive N: 87 intervention, 53 control. (analysed, intervention: 75 control: 47) Level of risk for CVD: low Men: 29% intervention, 25% control Mean age in years (SD): 56.1 (15.9) intervention, 55.5 (14.1) control Age range: unclear Smokers: 65.1% intervention, 54.7% control (includes current and previous smokers) Hypertension: not reported Medications taken by at least 50% of those in the control group: triple DMARD therapy (SSZ 0.5 g/d, HCQ 200 mg twice/day and MTX 10 mg once per week) Medications taken by 20%‐49% of those in the control group: NSAIDS Medications taken by some, but less than 20% of the control group: oral or parenteral steroids Location: Australia Ethnicity: not reported | |
| Interventions | Type: supplement (fish oil) Comparison: high EPA + DHA vs omega 6 (low EPA + DHA with sunola oil) Intervention: 10 mL/d fish oil concentrate (BLT Incromega TG3525) providing 5.5 g/day (3.2 EPA + 2.3 DHA). Dose: 5.5 g/d EPA + DHA Control: 10 mL/d sunola oil:capelin oil (2:1) providing 0.21 g EPA + 0.19 g DHA/d as TAG (0.40 g/day EPA + DHA). Compliance: consumption checked at each visit. 100% compliance would be consumption of 3650 mL oil at 12 months. The fish oil group was less compliant than the control group with median intakes of 2482 mL and 3248 mL, respectively (P = 0.015, Mann‐Whitney U test). This provided an average daily intake of EPA + DHA of 3.7 g and 0.36 g in the fish oil and control groups, respectively. Duration of intervention: 12 months | |
| Outcomes | Main study outcome: disease‐modifying anti‐rheumatic drugs (DMARD) failure and remission Dropouts: 11 intervention, 6 control Available outcomes: mortality (nil death), adverse events including CVD, DAS score, diabetes, authors supplied methodology data plus BMI change Response to contact: yes | |
| Notes | DAS scores are reported as median and IQR in Proudman 2012 abstract Study funding: National Health Medical Research Council of Australia and Royal Adelaide Hospital Research Committee. Melrose Health provided support for ongoing studies. The oil was made by the Royal Adelaide Hospital Pharmacy | |
| Risk of bias | ||
| Bias | Authors' judgement | Support for judgement |
| Random sequence generation (selection bias) | Low risk | Quote: "The randomisation schedule was prepared using an online random number generator and involved randomly permuted blocks of size six." |
| Allocation concealment (selection bias) | Low risk | Quote: "Randomisation was performed by the RAH pharmacy, which also prepared and provided the study oils in 500 mL identical dark brown bottles labelled with consecutive study numbers" |
| Blinding of participants and personnel (performance bias) | Low risk | Quote: "Both participants and investigators/assessors were blinded to the group allocation. Although the control oil was paler in colour than the fish oil, this was not evident in the brown bottles. The 'fishy' odour of each oil was similar." |
| Blinding of outcome assessment (detection bias) | Low risk | Both participants and investigators/assessors were blinded to the group allocation. Quote: "Investigators and subjects remained blinded for all withdrawals." |
| Incomplete outcome data (attrition bias) | Low risk | The flow of all study participants shown in FIGURE 2 |
| Selective reporting (reporting bias) | Unclear risk | Outcomes reported in trial register matched with the outcomes reported in publications. However, the study was retrospectively registered – registered in 2013, recruitment began in 2001 |
| Attention | Low risk | No difference between groups |
| Compliance | High risk | Consumption checked at each visit. 100% compliance would be consumption of 3650 mL oil at 12 months. The fish oil group was less compliant than the control group with median intakes of 2482 mL (68%) and 3248 mL (89%), respectively (P = 0.015, Mann‐Whitney U test). This provided an average daily intake of EPA + DHA of 3.7 g and 0.36 g in the fish oil and control groups, respectively |
| Other bias | Low risk | None noted |
| Methods | RCT, parallel (ethyl‐EPA vs paraffin), 2 arm, 12 months Summary risk of bias: low | |
| Participants | People with Huntington's Disease N: 67 intervention, 68 control (analysed, intervention: 39 control: 44) Level of risk for CVD: low Men: 57% intervention, 44% control Mean age in years (SD): 50 (9.3) intervention, 49 (9.0) control Age range: not reported Smokers: not reported Hypertension: not reported Medications taken by at least 50% of those in the control group: not reported Medications taken by 20%‐49% of those in the control group: antidepressants Medications taken by some, but < 20%: neuroleptics Location: UK, USA, Canada, Australia Ethnicity: intervention: 94% white, 4% black, 1% Asian; control: 97%, 3%, 0%, respectively | |
| Interventions | Type: supplement (ethyl‐EPA) Comparison: EPA vs paraffin (non‐fat) Intervention: 2 × 2 × 500 mg capsules/d, total dose of 2 g/day ethyl‐EPA (code name LAX‐101, purity 95%). Dose: 1.9 g/d EPA Control: 2 × 2 × 500 mg capsules/d liquid paraffin Compliance: 38 were excluded for protocol violations, 4 intervention and 16 control were non‐compliant with capsules Duration of intervention: 12 months | |
| Outcomes | Main study outcome: functional status in Huntington's Disease Dropouts: 7 intervention, 7 control Available outcomes: measures of functional capacity, CV events, cancers (nil deaths) Response to contact: yes (no additional data provided) | |
| Notes | Study funding: Amarin Neuroscience Ltd. (formerly known as Laxdale Ltd.), provided organisation, funding and salaries | |
| Risk of bias | ||
| Bias | Authors' judgement | Support for judgement |
| Random sequence generation (selection bias) | Low risk | Quote: "After screening and acceptance... patients were assigned to treatment by receiving a numbered pack supplied by a clinical trials packaging organization ... independent of all other aspects of the trial. Randomization was stratified in a block size of four, with the appropriate number of blocks allocated to each center. PCI Clinical Services held the randomization code until the database had been closed and all patients had been assigned" |
| Allocation concealment (selection bias) | Low risk | As above |
| Blinding of participants and personnel (performance bias) | Low risk | Quote: "[p]lacebo and ethyl‐EPA capsules were of identical appearance" (though taste and smell not reported). |
| Blinding of outcome assessment (detection bias) | Low risk | Randomisation described as "double‐blind", "neither the patients nor the participating medical staff had access to this code during the course of the study" |
| Incomplete outcome data (attrition bias) | High risk | Clearly reported and complete, however > 20% attrition |
| Selective reporting (reporting bias) | Unclear risk | No protocol or trials registry entry identified |
| Attention | Low risk | Unlikely |
| Compliance | Unclear risk | 38 were excluded for protocol violations, 4 intervention and 16 control were non‐compliant with capsules |
| Other bias | Low risk | None noted |
| Methods | RCT, parallel, (fish oil or olive oil), 24 months Summary risk of bias: moderate or high | |
| Participants | People with implantable cardioverter defibrillators and recent sustained ventricular tachycardia or ventricular fibrillation (VT/VF) N: 100 intervention, 100 control Level of risk for CVD: high Men: 86% intervention, 86% control Mean age in years (SD): 63 (13) intervention, 62 (13) control Age range: not reported but 18‐75 inclusion criteria Smokers: not reported Hypertension: 46% intervention, 55% control Medications taken by at least 50% of those in the control group: diuretic, beta blockers, ACE inhibitors Medications taken by 20%‐49% of those in the control group: digoxin, statins Medications taken by some, but less than 20% of the control group: calcium channel blocker Location: USA Ethnicity: 94% white in intervention group, 97% in control group | |
| Interventions | Type: supplement (fish oil capsules vs olive oil capsules) Comparison: EPA + DHA vs MUFA Intervention: 1.8 g/d fish oil capsules (Hoffman LaRoche, including ethyl esters of EPA and DHA, 0.76 g/d EPA, 0.54 g/d DHA). Dose: 1.3 g/d EPA + DHA Control: 1.8 g/d olive oil capsules (Hoffman LaRoche, 73% oleic acid) Compliance: while control group plasma and platelet DHA and EPA did not change, there were increases of 2%‐8.3% in the intervention group Duration of intervention: 24 months (median 718 days) | |
| Outcomes | Main study outcome: time to first episode of VT/VF Dropouts: 17 intervention, 26 control Available outcomes: deaths, CV death, MI, angina, revascularisation, arrhythmias, sudden cardiac death, cancer Response to contact: yes but no data provided | |
| Notes | Study funding: NIH and Hoffman LaRoche | |
| Risk of bias | ||
| Bias | Authors' judgement | Support for judgement |
| Random sequence generation (selection bias) | Low risk | Quote: "computer generated block randomisation scheme" |
| Allocation concealment (selection bias) | Unclear risk | Not described |
| Blinding of participants and personnel (performance bias) | Unclear risk | Participant blinding unclear |
| Blinding of outcome assessment (detection bias) | Low risk | ICD traces were viewed by researchers blinded to allocation, "double blind placebo‐controlled" |
| Incomplete outcome data (attrition bias) | Low risk | Almost all participants were included in outcome assessment, well described |
| Selective reporting (reporting bias) | High risk | NCT registered in February 2000, study carried out from February 1999 to January 2004. Most outcomes stated in registry entry reported, but quality of life missing |
| Attention | Low risk | Capsules were the only different interventions between arms, little opportunity for attention bias |
| Compliance | Low risk | While control group plasma and platelet DHA and EPA did not change, there were increases of 2%‐8.3% in the intervention group |
| Other bias | Low risk | None noted |
| Methods | RCT, parallel, (fish oil vs sunflower oil), 12 months Summary risk of bias: moderate or high | |
| Participants | People with relapsing remitting multiple sclerosis N: 25 intervention, 25 control. (analysed, intervention: 20 control: 19) Level of risk for CVD: low Men: 83% intervention, 82% control (but these appear unlikely) Mean age (SD) years: 35.1 (7.6) intervention, 34.9 (7.8) control Age range: not reported but 18‐55 years were inclusion criteria Smokers: not reported Hypertension: not reported Medications taken by at least 50% of those in the control group: 100% treated with interferon beta1b for at least 1 year before the trial began Medications taken by 20%‐49% of those in the control group: not reported Medications taken by some, but less than 20% of the control group: not reported Location: Mexico Ethnicity: not reported | |
| Interventions | Type: supplement Comparison: DHA + EPA vs sunflower oil Intervention: 4 g/d omega Rx capsules (Dr Sears zone diet, with excipient of glycerin, water, tocopherol, sunflower oil, titanium dioxide, includes 0.8 g/d EPA plus 1.6 g/d DHA). Dose: 2.4 g/d EPA + DHA Control: excipient only (Perfect Source Natural Products, glycerin, water, tocopherol, sunflower oil, titanium dioxide) Compliance: consumption diary plus pills returned at each visit, adherence calculated (correct formula?? pills consumed × 100/pills returned), optimal adherence was considered to be > 80%, 1 intervention and 3 control were excluded due to compliance < 80%. Blood DHA and EPA were significantly different at 12 months. Duration of intervention: 12 months | |
| Outcomes | Main study outcome: TNF‐alpha Dropouts: 5 of 25 intervention, 6 of 25 control Available outcomes: TNF‐alpha, IL‐6, IL‐1 beta, nitric oxide catabolites, MS relapse, disability EDSS, liver and renal function tests, haemoglobin, leucocytes, platelets, oxidative outcomes (glucose and lipids data collected but not reported, for BMI and BP paper reports "no difference through study") Response to contact: not yet attempted | |
| Notes | Study funding: not reported | |
| Risk of bias | ||
| Bias | Authors' judgement | Support for judgement |
| Random sequence generation (selection bias) | Low risk | Computer‐generated randomisation sequence (blocks of 4) |
| Allocation concealment (selection bias) | Unclear risk | Not described |
| Blinding of participants and personnel (performance bias) | Low risk | Quote: "capsules were identical in appearance, packaging and labelling", "physicians and patients were blind to the intervention", and there was a rosemary flavour to mask. |
| Blinding of outcome assessment (detection bias) | Low risk | Quote: "an independent physician evaluated the EDSS score and collected samples at each clinic visit" |
| Incomplete outcome data (attrition bias) | High risk | Loss of 11/50 over 1 year, 22% loss |
| Selective reporting (reporting bias) | High risk | Paper reports analysis of glucose and lipids but these are not reported |
| Attention | Low risk | Appeared similar, reviewed every 3 months |
| Compliance | Low risk | Blood DHA and EPA were significantly different at 12 months |
| Other bias | Low risk | None noted |
| Methods | RCT, parallel, 3 arms (fish oil or borage oil), 18 months Summary risk of bias: low | |
| Participants | Adults with rheumatoid arthritis N: 53 intervention, 52 control (28 intervention, 24 control analysed) Level of risk for CVD: low Men: 13.2% intervention, 23.1% control Mean age in years (SD): 57.3 (12.3) intervention, 60.3 (9.2) control Age range: not reported but 18‐85 inclusion criteria Smokers: not reported Hypertension: not reported Medications taken by at least 50% of those in the control group: methotrexate, DMARDs, and TNF blockers Medications taken by 20%‐49% of those in the control group: corticosteroids and TNF blockers Medications taken by some, but less than 20% of the control group: not reported Location: USA Ethnicity: black/African‐American: intervention (fish oil): 7.8% control (borage oil): 7.8% | |
| Interventions | Type: supplement (fish oil vs borage oil) Comparison: EPA + DHA vs Omega 6 Intervention: 7 fish oil (2.1 gm EPA:1.4 gm DHA) capsules and 6 sunflower seed oil capsules daily = 13 capsules divided doses. Dose: 3.5 g/d EPA + DHA Control: 6 borage seed oil (1.8 g GLA) capsules plus 7 sunflower seed oil capsules daily Compliance: assessed by capsule counts and patient report. Patient report, indicates that 45% of patients reported ever missing a dose (borage: 42%, fish 48%). Median total capsules missed (excluding those with 0) were 182 (borage: 164, fish 169) Duration of intervention: 18 months | |
| Outcomes | Main study outcome: RA modified disease activity score Dropouts: 25 intervention, 28 control Available outcomes: mortality (nil death), CVD events (nil), DAS score, CDAI score. Authors suggested that LDL and total cholesterol were reduced in the intervention group at 18 months, and HDL was increased in both intervention and control at 18 months, while diastolic BP was reduced in the intervention group at 18 months, but no numbers provided. CRP and ESR data were provided combined for the intervention and control arms in the author response, so not useable Response to contact: yes, authors supplied details of methodology but no usable outcome data | |
| Notes | A third arm (45 participants) were given a combination of both oils but not discussed here. Study funding: National Institutes of Health Grant RO1‐AT000309 from the National Center for Complementary and Alternative Medicine | |
| Risk of bias | ||
| Bias | Authors' judgement | Support for judgement |
| Random sequence generation (selection bias) | Low risk | Author stated "stratified random block, stratified by site using random blocks of 3 & 6" |
| Allocation concealment (selection bias) | Low risk | No methodology provided in the paper, but the author suggested concealment |
| Blinding of participants and personnel (performance bias) | Low risk | Double‐blind, all capsules were identical in appearance and colour, they were shipped in opaque plastic bottles to the University of Massachusetts University Hospital pharmacy, from where they were distributed to participating centres. However no information provided as to their smell and taste. |
| Blinding of outcome assessment (detection bias) | Low risk | Author confirmed outcome assessors were blinded. |
| Incomplete outcome data (attrition bias) | High risk | Authors mention intention‐to‐treat analysis but shows completers analysis. Numbers of participants are not provided for all outcomes measured. Provide results for the overall group (69 participants table 3a) while the flow diagram states there are 74 completers. 51% dropped out. |
| Selective reporting (reporting bias) | Low risk | Study prospectively registered in 2003, estimated study completion November 2008, published in 2014. Both outcomes reported in registry are reported in the publication. |
| Attention | Low risk | All patients were evaluated at 3‐month intervals, by the same examiner. |
| Compliance | Unclear risk | Assessed by capsule counts and patient report. Patient report, indicates that 45% of patients reported ever missing a dose (borage: 42%, fish 48%). Median total capsules missed (excluding those with 0) were 182 (borage: 164, fish 169) |
| Other bias | Low risk | None noted |
| Methods | RCT, parallel, (n‐3 vs olive oil), 60 months Summary risk of bias: moderate or high | |
| Participants | Patients with multiple cardiovascular risk factors N: 6244 intervention, 6269 control (analysed, intervention: 6239 control: 6266) Level of risk for CVD: high Men: 62.3% intervention, 60.6% control Mean age in years (SD): 63.9 (9.3) intervention, 64.0 (9.6) control Age range: not reported Smokers: 22.1% intervention, 21.4% control. Hypertension: 84.6% intervention, 84.5% control Medications taken by at least 50% of those in the control group: not reported Medications taken by 20%‐49% of those in the control group: ACE inhibitor; ARB; diuretic agent; calcium‐channel blocker; beta‐blocker; oral hypoglycaemic drug; statin; antiplatelet agent Medications taken by some, but less than 20% of the control group: insulin Location: Italy Ethnicity: not reported | |
| Interventions | Type: supplement (n‐3 capsules) Comparison: EPA + DHA vs MUFA Intervention: 1 g/d n‐3 capsules polyunsaturated fatty acid ethyl esters (EPA and DHA content 850‐882 mg with an average ratio of 1.0 to 1.2). Dose: ˜0.87 g/d EPA + DHA Control: 1 g/d olive oil capsules Compliance: measured by self‐report during follow‐up visits but no results reported Duration of intervention: 60 months | |
| Outcomes | Main study outcome: composite of time to death from cardiovascular causes or hospital admission for cardiovascular causes Dropouts: intervention: 5 withdrew consent before baseline, 43 lost to follow‐up, 1115 stopped treatment. 6239 analysed. Control: 3 (withdrew consent before baseline), 39 lost to follow‐up, 1218 stopped treatment. 6266 analysed Available outcomes: mortality, CV mortality, CV events, coronary related events and mortality, MI, AF, heart failure, side effects, stroke, cancer diagnosis, cancer death. Authors provided data on diabetes diagnosis, glucose and HbA1c. Response to contact: yes | |
| Notes | All continuous outcomes change data are reported as least squares mean hence not used. Study funding, quote: "The steering committee had the full and sole responsibility for planning and coordinating the study, analyzing and interpreting the data, and preparing the manuscript and submitting it for publication. Società Prodotti Antibiotici, Pfizer, and Sigma Tau funded the trial but had no role in the study design, planning, conduct, or analysis or in the interpretation or reporting of the results" | |
| Risk of bias | ||
| Bias | Authors' judgement | Support for judgement |
| Random sequence generation (selection bias) | Low risk | Quote: "Treatment was centrally assigned by means of telephone on the basis of a concealed, computer‐generated randomization list, stratified according to general practitioner." |
| Allocation concealment (selection bias) | Low risk | As above |
| Blinding of participants and personnel (performance bias) | Unclear risk | Quote: "Patients, general practitioners, coordination and statistical staff, and outcome assessors were unaware of the study assignments until the final analyses were completed." However, there was no mention of placebo appearance or other methods of blinding, so unclear. |
| Blinding of outcome assessment (detection bias) | Low risk | Quote: "Patients, general practitioners, coordination and statistical staff, and outcome assessors were unaware of the study assignments until the final analyses were completed." Quote: "All events included in the primary efficacy end point were documented with the use of a narrative summary and supporting documentation and were adjudicated on the basis of prespecified criteria by an ad hoc committee consisting of a cardiologist, an internist, and a neurologist who were unaware of the study assignments" |
| Incomplete outcome data (attrition bias) | Low risk | Quote: "Analyses were performed in the intention‐to‐treat population, except for a prespecified per protocol analysis of the primary end point in patients with no major protocol violations who did not permanently stop treatment." Figures differ in Visentin 2008: (p. i73)"At the end of March 2006, 12 521 patients have been Randomized"; "After 1‐year of follow‐up, 2.5% of the patients withdrawn from the trial and 5% of the patients discontinued treatment. The reasons for drug discontinuation were 1.7% for side effects (mainly gastrointestinal) and 3.3% others (clinical or patient's refusal)… After 1‐year of follow‐up, 1.0% had CV death and 3.4% hospitalisation for CV events (primary end point)" |
| Selective reporting (reporting bias) | High risk | Primary endpoint was amended part way through study. Differences in groupings of cardiovascular events in tables 2; S4 and S5. For hospital admissions notes each patient could have more than one cardiovascular cause |
| Attention | Unclear risk | Does not state attention differs or is the same between groups‐ regularly see GP for follow‐up and blinding not clear |
| Compliance | Unclear risk | No results |
| Other bias | Low risk | None noted |
| Methods | RCT, parallel, (fish oil vs olive oil), 12 months Summary risk of bias: moderate or high | |
| Participants | Adults with insulin‐dependant diabetes mellitus, diabetic nephropathy and normal BP N: 18 intervention, 18 control (analysed, 17 intervention, 15 control) Level of risk for CVD: moderate Men: 64% intervention, 67% control Mean age (SD) years: 32 (7) intervention, 34 (10) control Age range: 18‐55 years Smokers: 50% intervention, 47% control Hypertension: not reported Medications taken by at least 50% of those in the control group: insulin Medications taken by 20%‐49% of those in the control group: not reported Medications taken by some, but less than 20% of the control group: not reported Location: Denmark Ethnicity: not reported | |
| Interventions | Type: supplement Comparison: EPA + DHA vs MUFA Intervention: cod‐liver oil emulsion (Pharma‐Vinci A/S Denmark). EPA 2 g, DHA 2.6 g, total PUFA 4.6 g/day. Dose: 4.6 g/d EPA + DHA Control: olive oil emulsion (Pharma‐Vinci A/S Denmark) Compliance: assessed through omega 3 incorporation in platelets, and the paper reports significantly higher omega 3 levels in platelets at 12 months Duration of intervention: 12 months | |
| Outcomes | Main study outcome: diabetic nephropathy Dropouts: 1 intervention, 3 control (though 3 further intervention participants are not included in all data) Available outcomes: mortality (nil), breast cancer, total and LDL cholesterol, sBP (TGs reported as medians so not used, albuminurea, fractional albumin clearance, transcapillary escape rate of albumin, prothrombin fragment reported as geometric means or medians, HbA1c, HDL and diastolic BP too different at baseline to include, GFR, PAI1, TPA, fibrinogen, etc. not relevant) Response to contact: yes | |
| Notes | Study funding: the Danish Heart Association. Eskisol Fish oil and placebo oil emulsions were provided by Pharma‐Vinci A/S, Frederiksvaerk, Denmark | |
| Risk of bias | ||
| Bias | Authors' judgement | Support for judgement |
| Random sequence generation (selection bias) | Low risk | Patients were randomised using concealed randomisation to receive either fish oil or olive oil in blocks of 4 according to their glomerular filtration rate." |
| Allocation concealment (selection bias) | Unclear risk | No further details |
| Blinding of participants and personnel (performance bias) | Low risk | "Active and placebo (olive oil) were given as emulsions with orange flavour. At the end patients were allowed to guess about treatment and ˜50% were right" |
| Blinding of outcome assessment (detection bias) | Unclear risk | No details |
| Incomplete outcome data (attrition bias) | Low risk | Dropouts similar between groups although relatively high for small sample size. 3 dropouts from fish oil and 1 from control due to side effects. Intention‐to‐treat analysis appears to have been given for albuminuria only |
| Selective reporting (reporting bias) | Unclear risk | No trials registry entry or protocol found |
| Attention | Low risk | Time and attention appear to be the same. All patients were given dietary advice. |
| Compliance | Low risk | Reports significantly higher omega 3 levels in platelets at 12 months for the intervention group |
| Other bias | Low risk | None noted |
| Methods | RCT, parallel 5 arms (combined groups 4 and 5 omega‐3‐acid ethyl esters (Lovaza) n‐3 ± raloxifene vs control groups 1 and 3 ± raloxifene), 24 months Summary risk of bias: moderate or high | |
| Participants | Healthy postmenopausal women (50% normal weight, 30% overweight, 20% obese) with high breast density detected on their routine screening mammograms N: 54 + 53 intervention, 53 + 53 control Level of risk for CVD: low Men: 0% intervention, 0% control Mean age in years (SD): 56.56 (6.9) + 57.85 (5.1) intervention, 57.11 (5.9) + 57.68 (5.1) control Age range: not reported Smokers: 0% intervention, 0% control Hypertension: not reported Medications taken by at least 50% of those in the control group: not reported Medications taken by 20%‐49% of those in the control group: not reported Medications taken by some, but less than 20% of the control group: not reported Location: USA Ethnicity: not reported | |
| Interventions | Type: supplement (n‐3 capsules) Comparison: EPA + DHA vs nil Intervention: group 4, Lovaza 4 g per day. Lovaza is the FDA‐approved n‐3 FA formulation containing 465 mg of EPA + 375 mg of DHA per gram, total dose; 1860 mg/d EPA, 1500 mg/d DHA. Group 5 as group 4 plus 30 mg raloxifene/d. Dose: 3.36 g/d EPA + DHA Control: group 1, no treatment; group 3, 30 mg raloxifene/d Compliance: measured by pill count, recorded at follow‐up visits and further verified by serum fatty acids monitoring. Compliance was 94% (SE 2%) at 6 months and 97% (SE 2%) at 12 months. Only 2 participants had a compliance < 85% (84% and 81%). Duration of intervention: 24 months | |
| Outcomes | Main study outcome: change in breast density Dropouts: 5 intervention, 6 control Available outcomes: cardiovascular events, breast cancer, lipids, dietary intake, plasma FAs, adverse events (including one incidence of hyperglycaemia) Response to contact: yes | |
| Notes | The study had 5 arms: group 1, no treatment, control; group 2, raloxifene 60 mg orally daily; group 3, raloxifene 30 mg orally daily; group 4, Lovaza 4 g orally daily; and group 5, Lovaza 4 g/d plus raloxifene 30 mg orally daily. Data here is combined for groups 4 and 5 vs 1 and 3 for binary outcomes and group 1 vs 4 used for continuous outcomes Study funding: GlaxoSmith Kline and Eli Lilly provided Lovaza and raloxifene, respectively. Funded by Susan G Komen for the Cure, KG081632 (A Manni) and pilot funds from the Penn State Hershey Cancer Institute (K El‐Bayoumy) | |
| Risk of bias | ||
| Bias | Authors' judgement | Support for judgement |
| Random sequence generation (selection bias) | Low risk | Sandhu 2016 pg 276: "each study participant was randomly assigned with equal probability to one of the following five groups. A block randomization scheme was used to ensure balance treatment allocation during the course of enrolment." |
| Allocation concealment (selection bias) | Unclear risk | No description of concealment of allocation |
| Blinding of participants and personnel (performance bias) | High risk | Open label |
| Blinding of outcome assessment (detection bias) | High risk | Open label |
| Incomplete outcome data (attrition bias) | Low risk | < 20% lost over 2 years, detailed reasons provided, no suggestion these are unbalanced |
| Selective reporting (reporting bias) | High risk | Biomarkers of oxidative stress (Urinary 8‐(isoprostane) F‐2α and 8OHdG, Lymphocyte 8‐OHdG, DNA etheno adducts), Urinary 2‐OHE1, 4‐OHE1, and 16α‐OHE1, Serum level of C‐reactive protein and IL‐6, Serum level of IGF‐I and IGFBP‐3, complete blood count mentioned in trial registry but not reported in Sandhu 2016. (More outcomes reported than in registry – diet, physical activity levels, adverse events) |
| Attention | Low risk | Participants assessed at baseline, 1‐year and 2‐year follow‐up |
| Compliance | Unclear risk | Measured by pill count, recorded at follow‐up visits and further verified by serum fatty acids monitoring. Compliance was 94% (SE 2%) at 6 months and 97% (SE 2%) at 12 months. Only 2 participants had a compliance < 85% (84% and 81%) |
| Other bias | Low risk | None noted |
| Methods | Study on prevention of Coronary atherosclerosis with Marine Omega 3 fatty acids (SCIMO) RCT, parallel (omega 3 vs average European fats), 2 years Summary risk of bias: low | |
| Participants | People with angiographically proven coronary artery disease N: 112 intervention, 111 control (analysed 82 intervention, 80 control) Level of risk for CVD: high Men: 82% intervention, 78.6% control Mean age in years (SD): 57.8 (9.7) intervention, 58.9 (8.1) control Age range: unclear (18‐75 inclusion criteria) Smokers: 16.2% intervention, 22.3% control Hypertension: 53.1% intervention, 45.5% control (history of high blood pressure) Medications taken by at least 50% of those in the control group: platelet inhibitors, beta‐blockers Medications taken by 20%‐49% of those in the control group: long‐term nitrate therapy, lipid‐lowering agents, ACE inhibitors, diuretics, calcium antagonists, other antihypertensive agents and digitalis. Medications taken by some, but less than 20% of the control group: nitrates only on demand Location: Germany Ethnicity: not reported | |
| Interventions | Type: supplement (capsule) Comparison: EPA + DHA vs SFA + MUFA (average European fat composition) Intervention: concentrated fish oil capsules, 6x 1 g capsules/d for first 3 months, 3 × 1 g/d for rest of study (4 g/d EPA +DHA + DPA + ALA for first 3 months, then 2 g/d). Dose: ˜2 g/d LCn3 Control: capsules containing fat which replicated the fat composition of the average European diet, 6/d for first 3 months, 3/d for rest of study, opaque soft gelatin capsules identical to fish capsules in identical screw‐top containers Compliance: capsule count, overall 2284 (SD 313) capsules taken of 2460 prescribed for each person, erythrocyte phospholipids rose from 4.6% to 11.8% at 24 months in intervention, and didn't alter from baseline in controls | |
| Outcomes | Main study outcome: changes in stenosis on angiography Dropouts: unclear Available outcomes: mortality, MI, CV events, revascularisation, angina, stroke, cancer diagnosis, weight, lipids, BP, side effects Response to contact: yes | |
| Notes | Asked participants to guess treatment allocation, of those in intervention 63/90 were unsure, 5/90 guessed placebo and 22/90 guessed fish oil; of those in control 66/85 were unsure, 9/85 guessed placebo and 10/85 guessed fish oil Study funding: Pronova provided capsules and funds for study monitoring but it was stated that the funders played no part in analysis or publication | |
| Risk of bias | ||
| Bias | Authors' judgement | Support for judgement |
| Random sequence generation (selection bias) | Low risk | Stratified, and for the resulting 9 strata "a random sequence of study group assignments was computer generated by the trial monitor" |
| Allocation concealment (selection bias) | Low risk | Sealed, sequential numbered envelopes used (opaque not stated, but provided only a random number which linked to a specific container of capsules). |
| Blinding of participants and personnel (performance bias) | Low risk | Placebo and fish oil capsules "looked identical and were made of soft opaque gelatin and each contained 1 g of a fatty acid mixture". These were provided in identical containers with identical labels with a randomisation number. Patients were told that capsules differed in composition but not in taste. |
| Blinding of outcome assessment (detection bias) | Low risk | Blinding is described and is very strong for angiographic outcomes, but there is no description of how cardiovascular events were assessed or recorded. However outcomes assessors were probably the same assessors and so blinded |
| Incomplete outcome data (attrition bias) | Unclear risk | Unclear for how many participants clinical events were assessed (though described in detail for angiographic outcomes), so trial flow unclear |
| Selective reporting (reporting bias) | Unclear risk | No study trials register entry or protocol was found |
| Attention | Low risk | As study personnel were unaware of assignments bias in attention was not possible |
| Compliance | Low risk | Capsule count, overall 2284 (SD 313) capsules taken of 2460 prescribed for each person, erythrocyte phospholipids rose from 4.6% to 11.8% at 24 months in intervention and didn't alter from baseline in controls |
| Other bias | Low risk | No further bias noted |
| Methods | RCT, parallel (fish oil capsule vs soybean oil capsule), 12 months Summary risk of bias: moderate to high | |
| Participants | Patients aged 55 or more with probable Alzheimer dementia diagnosis N: 13 intervention, 13 control Level of risk for CVD: low Men: 61% intervention 46% control Mean age in years (SD): 75.9 (8.1) intervention, 75.2 (10.8) control Age range: 55+ (inclusion criteria) Smokers: not reported Hypertension: not reported Medications taken by at least 50% of those in the control group: anti‐cholinesterases or memantine Medications taken by 20%‐49% of those in the control group: not reported Medications taken by some, but less than 20% of the control group: not reported Lipid‐lowering medications and many other drugs were not allowed Location: USA Ethnicity: 100% white | |
| Interventions | Type: fish oil capsules Comparison: EPA + DHA vs n‐6 Intervention: 3 × 1 g capsules/day of fish oils (975 mg EPA, 675 mg DHA per day). Dose: 1.65 g/d EPA + DHA Control: 3 × 1 g capsules/day soybean oil (which contains 5% fish oil) Both groups had a placebo lipoic acid tablet and lemon‐flavoured capsules Compliance: assessed by pill counts and FA in red blood cell membranes. Results showed increased EPA + DHA levels in the intervention group. Length of intervention: 12 months | |
| Outcomes | Main study outcome: F2‐isoprostane levels (oxidative stress measure) Dropouts: 2 intervention, 2 control Available outcomes: mortality, CVD events, adverse events, serum fatty acids, measures of cognition (ADAS Cog and MMSE), ADL, IADL (also F2 isoprostane) Response to contact: not attempted | |
| Notes | Study funding: National Institutes of Health/National Institute of Aging (NIH/NIA) and NIH General Clinical Research | |
| Risk of bias | ||
| Bias | Authors' judgement | Support for judgement |
| Random sequence generation (selection bias) | Low risk | Participants were randomised by a computer‐generated scheme that was stratified by smoking status |
| Allocation concealment (selection bias) | Unclear risk | No details |
| Blinding of participants and personnel (performance bias) | Low risk | Capsules matched for taste and flavour. Blinding assessed at the end and majority of staff and participants were unaware of treatment |
| Blinding of outcome assessment (detection bias) | Low risk | As above |
| Incomplete outcome data (attrition bias) | Low risk | 15% dropouts explained and included |
| Selective reporting (reporting bias) | Low risk | NCT00090402 first received: 25 August 2004, study start date April 2004. More secondary outcomes reported than included in the trial register entry |
| Attention | Low risk | Both arms seem to have had the same contact |
| Compliance | Low risk | Compliance measured and FAs levels reported. Results showed increased EPA + DHA levels in the intervention group |
| Other bias | Low risk | None noted |
| Methods | SHunt Occlusion Trial (SHOT) RCT, parallel (omega 3 vs nil), 4 arms, 1 year | |
| Participants | People admitted for coronary bypass grafting N: 317 intervention, 293 control Level of risk for CVD: high Men: 86% intervention, 88% control Mean age in years (SD): 59.9 (8.7) intervention, 59.4 (8.8) control Age range: unclear Smokers: 19% intervention, 20% control Hypertension: 20% intervention, 25% control Medications taken by at least 50% of those in the control group: not reported Medications taken by 20%‐49% of those in the control group: antihypertensives Medications taken by some, but less than 20% of the control group: not reported Location: Norway Ethnicity: not reported | |
| Interventions | Type: supplement (capsule) Comparison: EPA + DHA vs nil Intervention: 4 fish‐oil concentrate soft gelatin capsules/d (Omacor; Pronova AS, Oslo,Norway) containing 51% EPA and 32% DHA ethyl esters and 3.7 mg Control: no treatment Compliance: capsule count, 88% taken, serum EPA + DHA rose in the intervention group (176 to 257 mg/L at 9 months) and fell in the control group (170 to 169 mg/L at 9 months) Length of intervention: 12 months | |
| Outcomes | Main study outcome: CABG graft patency | |
| Notes | The study had 4 arms; aspirin; warfarin; fish oil + aspirin; and warfarin + fish oil. The first 2 groups are combined as the control and the last two combined as intervention. Dietary assessment suggested total diet plus supplement intakes as follows: 2.7 g/d EPA + DHA at baseline, 5.5 g/d at 9 months intervention, 2.5 g/d at baseline, 2.2 g/d at 9 months control group Study funding: in part by Pronova and Nycomed Pharma | |
| Risk of bias | ||
| Bias | Authors' judgement | Support for judgement |
| Random sequence generation (selection bias) | Low risk | Random numbers were provided in consecutively sealed envelopes generated centrally |
| Allocation concealment (selection bias) | Unclear risk | Envelopes not reported as opaque |
| Blinding of participants and personnel (performance bias) | High risk | Open trial, no blinding apart from outcome assessors so participants and study personnel were aware of assignments. However, author suggested in personal communication that participants were not aware of their assignments. |
| Blinding of outcome assessment (detection bias) | Low risk | Outcome assessors (radiologists) reported as blinded |
| Incomplete outcome data (attrition bias) | Low risk | Reasons for attrition and exclusions stated, numbers clear, dropouts < 20% per year |
| Selective reporting (reporting bias) | Unclear risk | No study protocol or trials register entry was found |
| Attention | Low risk | Appeared equivalent between arms |
| Compliance | Low risk | Capsule count, 88% taken, serum EPA + DHA rose in the intervention group (176 to 257 mg/L at 9 months) and fell in the control group (170 to 169 mg/L at 9 months) |
| Other bias | Low risk | No further bias noted |
| Methods | RCT, parallel, (fish oil vs placebo), 12 months Summary risk of bias: moderate or high | |
| Participants | Patients with hypertension and paroxysmal or persistent atrial fibrillation (AF) N: 268 intervention, 60 control Level of risk for CVD: moderate Men: not reported Mean age (SD) years: 62 (6), not reported by arm Age range: not reported Smokers: not reported Hypertension: 100% Medications taken by at least 50% of those in the control group: not reported Medications taken by 20%‐49% of those in the control group: not reported Medications taken by some, but less than 20% of the control group: not reported Location: Greece Ethnicity: not reported | |
| Interventions | Type: supplement Comparison: fish oil vs unclear placebo Intervention: omega‐3 fatty acids with no further details. Dose: 4 g/d omega Control: placebo, no further details Compliance: no details Duration of intervention: 12 months | |
| Outcomes | Main study outcome: AF recurrence and BP Dropouts: no details Available outcomes: new AF episodes, BP (not in a usable format) Response to contact: no | |
| Notes | Study funding: unclear The study's only publication was a conference abstract. | |
| Risk of bias | ||
| Bias | Authors' judgement | Support for judgement |
| Random sequence generation (selection bias) | Unclear risk | No details, probably randomised but unclear |
| Allocation concealment (selection bias) | Unclear risk | No details |
| Blinding of participants and personnel (performance bias) | Unclear risk | No details |
| Blinding of outcome assessment (detection bias) | Unclear risk | No details |
| Incomplete outcome data (attrition bias) | Unclear risk | No details |
| Selective reporting (reporting bias) | Unclear risk | No protocol or trial register record found |
| Attention | Unclear risk | No details |
| Compliance | Unclear risk | No details |
| Other bias | Unclear risk | No details |
| Methods | SMART trial (from the Smart Foods Centre) RCT, 3‐arm parallel, (Fish + S: hypocaloric diet plus fish plus fish oil capsules vs Fish: hypocaloric diet plus fish plus olive oil capsules vs control: hypocaloric diet plus olive oil capsules), 12 months Summary risk of bias: moderate or high | |
| Participants | Overweight adults N: fish + S intervention 41, fish 43, control 42. (analysed, fish + S intervention 21, fish 25, control 18) Level of risk for CVD: low Men: 27% fish + S intervention, 23% fish intervention, 28% control Mean age (SD) years: unclear by arm, overall 45.1 (8.4) Age range: not reported but 18‐60 years eligible Smokers: not reported but 5.9% overall Hypertension: not reported Medications taken by at least 50% of those in the control group: not reported Medications taken by 20%‐49% of those in the control group: not reported Medications taken by some, but less than 20% of the control group: not reported Location: Australia Ethnicity: not reported | |
| Interventions | Type: supplement and food Comparison: EPA + DHA vs MUFA (Fish plus fish oil supplements vs Fish plus olive oil supplements vs olive oil supplements) Intervention, Fish + S: hypocaloric diet aiming at 30% E from fat, 25% E from protein, 45% E from CHO, plus 180 g fish/week plus capsules including 420 mg/d EPA + 210 mg/d DHA (Blackmores Promega Heart). Dose: 0.63 g/d EPA + DHA Intervention, fish: hypocaloric diet aiming at 30% E from fat, 25% E from protein, 45% E from CHO, plus 180 g fish/week plus capsules including 1 g olive oil/d Control: hypocaloric diet aiming at 30% E from fat, 25% E from protein, 45% E from CHO, plus capsules including 1 g olive oil/d Compliance: assessed through diet histories (fish) and erythrocyte fatty acid supplements (capsules), but results not reported Duration of intervention: 12 months | |
| Outcomes | Main study outcome: total % body fat Dropouts: fish + supplement intervention 20, fish intervention 18, control 24 Available outcomes: weight, BMI, lipids, BP, fasting glucose, fasting insulin, % body fat (leptin also reported), no deaths or cardiovascular events occurred (authors report) Response to contact: authors provided data on CVD events (none) and mean/SD data for TGs and fasting insulin | |
| Notes | To assess effects of omega 3 fats the best comparison in this study is fish + S vs fish, so numerical data reflect this comparison. Study funding: Australian National Health and Medical Research Council, fish and olive oil capsules were provided free by Blackmores Australia | |
| Risk of bias | ||
| Bias | Authors' judgement | Support for judgement |
| Random sequence generation (selection bias) | Low risk | Quote: "A researcher independent of the subject interface undertook the randomisation of participants into diet groups (stratified by sex and block randomised...)" |
| Allocation concealment (selection bias) | Low risk | Quote: "Randomisation was performed centrally, off‐site and the holder of the allocation schedule provided the codes to a single researcher who was independent to the subject interface. The placebo and active ingredient capsules were coded off‐site . The codes were kept from the researchers collecting dietary data and delivering treatment. Allocation concealment was maintained as the persons responsible for screening eligible participants for inclusion in the trial was unaware to which supplement group the subject would be allocated. Different dietitians collected the dietary data and provided dietary advice" |
| Blinding of participants and personnel (performance bias) | High risk | As above, but impossible to blind participants to the fish advice |
| Blinding of outcome assessment (detection bias) | Unclear risk | As above |
| Incomplete outcome data (attrition bias) | Low risk | Very high levels of attrition, though intention‐to‐treat analyses carried out |
| Selective reporting (reporting bias) | High risk | We were unable to find data on 24 hour energy expenditure, oxidation or heart rate which were stated as primary and secondary outcomes in the trials registry. |
| Attention | Unclear risk | While dietary education was for 1 hour then 6 further half hour follow‐ups plus written materials and monthly newsletters plus dietary interviews it is not clear whether this was in all arms or only some of them. |
| Compliance | High risk | Quote: "Of the 12 months completers, 57% were judged to be compliant, 39% (n = 7) for the control group who reported < 180 g fish/week, 48% (n = 12) for the Fish group who reported ≥180 g fish/week, and 85% (n = 17) for the Fish + S group who reported ≥180 g fish/week or ≥90% supplements". However, erythrocyte (EPA + DHA)/total fatty acids × 100 was significantly different for the fish oil supplemented group compared to the two others – but it was only measured in around half of the participants as the others dropped out, so presumably were non‐compliant. |
| Other bias | Low risk | None noted |
| Methods | Study on Omega‐3 Fatty Acids and Ventricular Arrhythmia (SOFA) 2 arm, parallel RCT (n‐3 EPA + DHA vs MUFA), 12 months Summary risk of bias: low | |
| Participants | People with previous ventricular arrhythmias and implantable cardioverter defibrillators N: 273 intervention, 273 control (273 intervention, 273 control analysed) Level of risk for CVD: high Men: 84% intervention, 85 % control Mean age in years (SD): 60.5 (12.8) intervention, 62.4 (11.4) control Age range: unclear (18 years and older) Smokers: 16% intervention, 8% control Hypertension: 53% intervention, 49% control Medications taken by at least 50% of those in the control group: beta‐blockers Medications taken by 20%‐49% of those in the control group: lipid lowering, antiarrythmic medications (combined) Medications taken by some, but less than 20% of the control group: amiodarone, sotalol Location: 8 countries in Europe Ethnicity: not reported | |
| Interventions | Type: supplement (capsule) Comparison: EPA + DHA vs MUFA + omega 6 Control: 2 g/d high‐oleic acid sunflower oil. 3000 ppm vitamin E (Loders Croklann, Wormeveer) Compliance: daily diary, checked by research nurses every 4 months. Judging by capsule count, 207 patients in the fish oil group and 218 in the placebo took more than 80% of their capsules. N‐3 fatty acid composition in serum cholesterol levels was measured at baseline and the end of the trial. The EPA concentration in serum cholesterol esters increased in the expected range. No data provided Length of intervention: 12 months | |
| Outcomes | Main study outcome: spontaneous ventricular tachyarrhythmias and all‐cause mortality Dropouts: 33 intervention (23 partial follow‐up), 33 control (14 partial follow‐up) Available outcomes: deaths, MI, new angina, new heart failure, no fatal arrhythmias, cancer, cardiovascular events, side effects Response to contact: yes but no data provided | |
| Notes | Study funding: Wageningen Centre for Food Sciences (alliance of major Dutch food industries and others) | |
| Risk of bias | ||
| Bias | Authors' judgement | Support for judgement |
| Random sequence generation (selection bias) | Low risk | Patients using beta‐blockers were separately randomised in blocks of 2. A computer randomisation programme randomly took the first treatment of a block. The second patient in a block of 2 always received the opposite treatment. |
| Allocation concealment (selection bias) | Low risk | Treatments (blinded medication numbers) were centrally assigned by a telephone allocation service. |
| Blinding of participants and personnel (performance bias) | Low risk | Double blinding. Bottles containing capsules labelled with medication numbers that are unidentifiable for patients as well as investigators. Fish oil and placebo capsules have identical appearance. Difference can't be tasted if swallowed with water (as suggested) |
| Blinding of outcome assessment (detection bias) | Low risk | Quote: "blinded endpoint adjudication committee" |
| Incomplete outcome data (attrition bias) | Low risk | ITT analysis. Did a partial follow‐up on some patients who dropped out due to non‐compliance. |
| Selective reporting (reporting bias) | Low risk | NCT00110838, trial registered in May 2005, end of trial January 2005, trial results published in 2006. However, rationale and design paper (stating outcomes) published in 2003. Outcomes in the 2006 paper appear to be the same as in Rationale paper. |
| Attention | Low risk | Unlikely as intervention blinded to investigators and only intervention was capsules |
| Compliance | Unclear risk | Daily diary, checked by research nurses every 4 months. Judging by capsule count, 207 patients in the fish oil group and 218 in the placebo took more than 80% of their capsules. N‐3 fatty acid composition in serum cholesterol levels was measured at baseline and the end of the trial. The EPA concentration in serum cholesterol esters increased in the expected range. No data provided |
| Other bias | Low risk | No further bias noted |
| Methods | 2‐arm, parallel RCT (enriched olive oil vs olive oil), 12 months Summary risk of bias: moderate or high | |
| Participants | Non‐alcoholic fatty liver disease patients N: 6 intervention, 5 control Level of risk for CVD: low Men: 66.7% intervention, 100% control Median age: 55 intervention, 54 control Age range: 30‐41 intervention, 42‐70 control Smokers: not reported Hypertension: not reported Medications taken by at least 50% of those in the control group: not reported Medications taken by 20%‐49% of those in the control group: not reported Medications taken by some, but less than 20% of the control group: not reported Location: Italy Ethnicity: not reported | |
| Interventions | Type: supplement (oil) Comparison: EPA + DHA vs MUFA Control: 6.5 mL/d olive oil plus dietary recommendations Compliance: was verified by counting the empty boxes on return but no data reported Length of intervention: 12 months | |
| Outcomes | Main study outcome: fatty liver status Dropouts: unclear Available outcomes: lipids, glucose, insulin, HOMA, (BMI not in usable format, also LFTs, oxidative markers, adiponectin, fatty liver and steatosis outcomes) | |
| Notes | Study funding: oil supplied by tFarma and funding not stated | |
| Risk of bias | ||
| Bias | Authors' judgement | Support for judgement |
| Random sequence generation (selection bias) | Unclear risk | Quote: "The patients were randomized into two groups" |
| Allocation concealment (selection bias) | Unclear risk | No details |
| Blinding of participants and personnel (performance bias) | Unclear risk | No details |
| Blinding of outcome assessment (detection bias) | Unclear risk | No details |
| Incomplete outcome data (attrition bias) | Unclear risk | Numbers analysed for liver health are for those randomised. Numbers analysed for other outcomes not stated. No mention of dropouts |
| Selective reporting (reporting bias) | Unclear risk | No protocol or trial registration |
| Attention | Low risk | Both groups received same contact |
| Compliance | Unclear risk | Measured but no results reported |
| Other bias | Low risk | None noted |
| Methods | Supplementation en Folates et Omega 3 (SU.FOL.OM3) RCT, 2 × 2 factorial (LCn3 omega 3 vs placebo, also B vitamin comparison), 4 years | |
| Participants | People with a history of MI, unstable angina or ischemic stroke N: control: 1248, intervention: 1253 Level of risk for CVD: high Men: 80.85% intervention, 78.25% control Mean age in years (SD): 61.1 (8.8) intervention, 60.8 (8.7) control Age range: 53‐68 years intervention, 54‐68 years control Smokers: 11.1% intervention, 10.4% control Hypertension: not reported Medications taken by at least 50% of those in the control group: beta‐blockers, aspirin or antiplatelets, lipid lowering, ACE inhibitors Medications taken by 20%‐49%: not reported Medications taken by some, but < 20%: calcium channel blocker, angiotensin II receptor blockers Location: France Ethnicity: not reported | |
| Interventions | Type: supplement (capsule) Comparison: EPA + DHA vs non fat placebo Intervention: 2 gelatin capsules Pierre Fabre omega 3 (400 mg/d EPA and 200 mg/d DHA) Control: 2 gelatin capsules/d placebo (liquid paraffin with fish flavour) Compliance: tested by questionnaire, response rate was on average 96%. Out of this, 86% complied Duration of intervention: 4 years | |
| Outcomes | Main study outcome: composite of myocardial infarction, cerebral vascular ischemic accident or cardiovascular deaths Dropouts: control: 145 (66 withdrew, 11 lost to follow‐up, 68 deaths), intervention: 134 (61 withdrew, 7 lost to follow‐up, 66 deaths) Available outcomes: deaths, cardiovascular death, non fatal MI, stroke, CV events, coronary events, cancer events, Geriatric Depression Scale score, authors provided additional information on outcomes and methodology Response to contact: yes (data provided) | |
| Notes | The other factorial intervention was B‐vitamins (560 µg methyl‐terahydrofolate, 3 mg B‐6, 20 µg B12) vs placebo Study funding: French Ministry of Research, Ministry of Health, Sodexo, Candia, Unilever, Danone, Roche, Merck | |
| Risk of bias | ||
| Bias | Authors' judgement | Support for judgement |
| Random sequence generation (selection bias) | Low risk | Quote: "Used computerized block randomisation with stratification by sex, age, prior CVD, and city of residence". "Permuted block randomisation (with a block size randomly selected as 8) was used". |
| Allocation concealment (selection bias) | Low risk | Allocation of participants was programmed by the statistical coordinating centre, who sent participants sufficient treatment capsules for 1 year in an appropriately labelled package |
| Blinding of participants and personnel (performance bias) | Low risk | Quote: "All subjects and investigators were blinded to treatment allocation", and placebo capsules looked and tasted "identical to the active supplementation". Fish oil flavour was used in placebos. |
| Blinding of outcome assessment (detection bias) | Low risk | Outcome investigators were blinded to allocation |
| Incomplete outcome data (attrition bias) | Low risk | Attritions and exclusions were well described. Only 10% loss over 4 years, well balanced |
| Selective reporting (reporting bias) | Low risk | ISRCTN41926726 registered 2005, 2003 publication on background and rationale, recruitment started April 2003, 2008 protocol, recruitment ended June 2009, 2010 results published. Outcomes in registry entry appear to have been published. |
| Attention | Low risk | Not likely as capsules used |
| Compliance | Low risk | Quote: "Allocation to omega 3 fatty acids increased plasma concentrations of omega 3 fatty acids by 37% compared with placebo" (appears statistically significantly different, though not explicitly stated) … "The overall response rate for return of completed questionnaires was 99%, 96%, 94%, and 95% at 6, 12, and 24 months and at the end of the trial, respectively. About 86% of those who returned a questionnaire reported that they were compliant with the study treatment and compliance was similar in all four groups" |
| Other bias | Low risk | No further bias noted |
| Methods | 2 arm, parallel RCT (calanus (marine) oil vs olive oil), 12 months Summary risk of bias: moderate to high | |
| Participants | Healthy male and female volunteers with BMI 25‐35 kg/m2 N: 64 intervention, 63 control (50 intervention, 50 control analysed) Medications taken by at least 50% of those in the control group: not reported Medications taken by 20%‐49% of those in the control group: not reported Medications taken by some, but less than 20% of the control group: not reported Location: Norway Ethnicity: not reported | |
| Interventions | Type: supplement (capsule) Comparison: EPA + DHA vs MUFA Control: identical capsules of olive oil. Compositional analysis indicated that the fatty acid content of the olive oil was primarily oleic acid (76.9%), palmitic acid (10.2%), and linoleic acid (7.7%). Compliance: assessed through the return of unused capsules. Compliance rate reported for both intervention and placebo groups was good (86‐88%) | |
| Outcomes | Main study outcome: safety of Calanus oil consumption Available outcomes: BMI, waist‐hip ratio, BP, pulse, HbA1c, ESR, CRP, lipids, glucose tolerance, insulin, clinical chemistry parameters, adverse events (no CVD events, deaths or other major health outcomes occurred according to author reply) Response to contact: author replied with methodological and event information | |
| Notes | Study funding: Calanus AS | |
| Risk of bias | ||
| Bias | Authors' judgement | Support for judgement |
| Random sequence generation (selection bias) | Low risk | Quote: "Randomization of the study subjects into the intervention group or the placebo group was performed by the University Hospital of North Norway clinical research unit and was stratified by gender." Author reply stated that "[r]andomization was performed by competent people at the drugstore affiliated to the University Hospital, with no interconnection, formally or materially with the research department from where the study was managed. Randomization was performed prior to recruiting subjects." |
| Allocation concealment (selection bias) | Unclear risk | As above, unclear. |
| Blinding of participants and personnel (performance bias) | Low risk | Participants in the placebo group received identical capsules at similar daily doses as the intervention group. However, no information provided as to their smell and taste. Also unclear if investigators were blinded. Author reply stated "Each study subject was given a randomization number, which carried the name of the person, date of birth and treatment information (intervention or control). The randomization number was the only information made available to the study personnel, and the code was managed by personnel outside the research department. This code was broken after the completion of all analysis with all primary data processed." Blinding of participants only possible for fish plus supplementation vs fish plus placebo. |
| Blinding of outcome assessment (detection bias) | Low risk | As above |
| Incomplete outcome data (attrition bias) | Low risk | All dropouts (˜20%) are explained |
| Selective reporting (reporting bias) | Unclear risk | No trials registry entry or protocol found |
| Attention | Low risk | Appear to be similar in both groups |
| Compliance | Unclear risk | Quote: "levels of DHA and EPA in the blood were generally higher in the Calanus oil group over baseline values relative to the placebo controls" but no data provided |
| Other bias | Low risk | None noted |
| Methods | The Heart Institute of Spokane Diet Study (THIS‐DIET) RCT‐ parallel, 24 months Summary risk of bias: moderate or high | |
| Participants | Recent survivors of first myocardial infarction (within < 6 weeks) N: 51 intervention, 50 control Level of CVD risk: high Men: 80% intervention, 68% control Mean age in years (SD): 58 (10) intervention, 58 (9) control Age range: unclear Smokers: 25% intervention, 30% control Hypertension: 43% intervention, 50% control (uncontrolled or secondary hypertension excluded) Medications taken by at least 50% of those in the control group: aspirin, statins, beta‐blockers, and ACE inhibitors or angiotensin receptor blockers. Medications taken by 20%‐49%: not reported Medications taken by some, but < 20%: not reported Location: USA Ethnicity: intervention 98% white; control 94% white | |
| Interventions | Type: dietary advice (to follow a Mediterranean style diet high in n‐3) Comparison: EPA + DHA vs MUFA (biggest dietary change) Intervention: Mediterranean style diet high in n‐3. Dietary counselling group sessions; two in first month then at months 3, 6, 12 and 24. Sessions focused on behaviour modification and practical aspects of assigned diet including recipes, shopping and dining out. Aim to increase omega 3 fat intake to > 0.75% kcal. Dose: ˜1.5 g/d omega 3 fat, or 0.31% E by intake assessment. Control: dietary advice (to follow the American Heart Association Step II diet). Same number of group sessions as intervention. The 2 diets were low in saturated fat (< 7% kcal) and cholesterol (< 200 mg/day); the Mediterranean‐style diet was distinguished by greater omega‐3 fat intake (> 0.75% kcal). Compliance: participants were required to attend six sessions and only invited but not required to attend extra sessions. 3‐day food diaries were reviewed with dietitians. Compliance results not stated. Dietary achievements: Total fat intake, % E (at 24 months): control 29.7 (SD 9.3), intervention 29.1 (SD 8.6) Saturated fat intake, % E (at 24 months): control 8.0 (SD 2.9), intervention 7.9 (SD 3.2) PUFA intake, % E (at 24 months): control 5.7 (SD 3.1), intervention 5.7 (SD 2.4) PUFA n‐3 intake, % E: control 0.46 (SD 0.38), intervention 0.67 (SD 0.35) g/week PUFA n‐6 intake: not reported MUFA intake, % E (at 24 months): control 10.3 (SD 5.1), intervention 9.7 (SD 3.6) CHO intake, % E (at 24 months): control 54 (SD 11), intervention 54 (SD 10) Protein intake, % E (at 24 months): control 17 (SD 2), intervention 18 (SD 3) Trans fat intake: not reported Length of intervention: 24 months | |
| Outcomes | Main study outcome: a composite of endpoints including all‐cause and cardiac death, MI, hospital admissions for heart failure, unstable angina, or stroke Dropouts: none for primary outcomes Available outcomes: total and CVD deaths (nil deaths), CV events, stroke, MI, diagnosis of diabetes mellitus, BMI and weight (different at baseline hence not used), waist circum, lipids, blood pressure, albuminuria, CRP, creatinine and dietary intake (authors supplied further data on newly diagnosed DM, glucose and insulin data, cancers, depression, atrial fibrillation) Response to contact: yes further data supplied as above | |
| Notes | The study compared the 2 intervention groups to a non‐randomised usual care control group (not reported here) Study funding: no funding details is provided but some reported conflict of interests for an author. | |
| Risk of bias | ||
| Bias | Authors' judgement | Support for judgement |
| Random sequence generation (selection bias) | Low risk | Sealed envelopes concealing the allocation sequence were prepared by a research coordinator. Assignment was stratified by diabetes mellitus status using 10‐envelope blocks. Envelopes were selected in the prepared order from a locked drawer by a study dietitian to assign interventions |
| Allocation concealment (selection bias) | Unclear risk | As above but opacity of envelopes is not stated. |
| Blinding of participants and personnel (performance bias) | High risk | Neither the intervention team nor participants could be blinded to dietary assignment. |
| Blinding of outcome assessment (detection bias) | Low risk | The PI was blinded for the purpose of adjudicating clinical end points and adverse events by the removal of identifiers from records used for review. |
| Incomplete outcome data (attrition bias) | Low risk | Primary outcomes data provided for all randomised |
| Selective reporting (reporting bias) | High risk | NCT00269425. Trial was registered in 2005, data collection started in October 2000, January 2008 (final data collection date for primary outcome measure), publication 2008. A number of the outcomes from the registration were not reported e.g. cardiovascular revascularisation, peripheral revascularisation or amputation, doubling of serum creatinine, dialysis, or kidney transplant, new hypertension. Also numerous secondary measures were reported that were not in the original registration. |
| Attention | Low risk | Both arms had the same contact and attention |
| Compliance | Unclear risk | No details |
| Other bias | Low risk | None noted |
| Methods | The Walnut and Healthy Aging Study (WAHA) 2‐arm, parallel RCT (usual diet plus walnuts vs usual diet), 2 years Summary risk of bias: moderate to high | |
| Participants | Middle‐aged healthy adults N: 362 intervention, 346 control (only preliminary data on 312 participants from one of the two centres is available) Level of risk for CVD: low Men: 32.6% intervention, 31.5% control Mean age in years (SD): 69.4 (3.8) intervention, 68.9 (3.5) control Age range: 63‐79 (inclusion criteria) Smokers: 4.4% intervention, 1.2% control Hypertension: 52.8% intervention, 52.9% control Medications taken by at least 50% of those in the control group: not reported Medications taken by 20%‐49% of those in the control group: not reported Medications taken by some, but less than 20% of the control group: not reported Location: Spain and USA Ethnicity: not reported | |
| Interventions | Type: supplement (food) Comparison: ALA vs unclear Intervention: 15% of daily energy intake as walnuts. The estimated amount of walnuts ranged from about 30–60 g/day (1‐2 ounces). Sachets for daily consumption containing 30 g, 45 g, or 60 g of raw, pieced walnuts were provided as 8‐week allotments to be eaten daily, preferably as the raw product, either as a snack or by incorporating them into shakes, yogurts, cereals, or salads. To improve participants' compliance, 1‐kg extra walnut allowances were provided every 2 months to take into account family needs. Dose: ˜5 g/d ALA Control: usual diet without walnut Compliance: assessed by dietitians through FFQs, recount of empty packages, and changes in FAs concentrations. 95% consumed at least 30 g/d. The proportion of α‐linolenic acid in red blood cells increased in the walnut group by 0.16% (95% CI 0.14 to 0.18) and in the control group by 0.02% (95% CI −0.01 to 0.04; P < 0.001). No data on dietary intake provided. | |
| Outcomes | Main study outcome: change in cognitive decline (results not yet published) Dropouts: 36 intervention, 21 control (after 1 year) Available outcomes: lipids (for TG and HDL only data states "no between diet differences were observed"), weight (waist circumference was provided but without variance, abstract stated that "there were no significant changes in body fat and waist‐to‐hip ratio over time and between the two groups"). Authors provided data on mortality, CVD events, cancer deaths and diagnoses, IBD diagnosis (no CVD deaths). Cognitive, ophthalmological, inflammatory markers, glycaemic status and other outcomes are not yet available. Response to contact: authors provided additional outcome and methodology data. | |
| Notes | Study funding: Calfornia Walnut Commission The 2‐year results as well the full 1‐year results are yet to be published. Outcome data reported are for only for participants from one centre (USA) | |
| Risk of bias | ||
| Bias | Authors' judgement | Support for judgement |
| Random sequence generation (selection bias) | Low risk | Quote: "randomized to either the control or walnut group using a computerized random number table with stratification by center, sex, and age range. Couples entering the study were treated as one number and were randomized into the same group". |
| Allocation concealment (selection bias) | Low risk | Author reply states, "Baseline subject data was collected before randomization. Randomization was done by the clinician, pressing the key on the computer. Since this was a dual center (Barcelona and Loma Linda) trial, a single computer software randomized participants for both the centers." |
| Blinding of participants and personnel (performance bias) | High risk | Single blind. "An unavoidable limitation of the study is not being able to blind participants to the intervention since it consists of a whole food" Rajaram 2017. |
| Blinding of outcome assessment (detection bias) | High risk | Author reply states "Study personnel not in contact with the subjects were blind to the treatment assignment. So (lab technicians, ophthalmology technician, neuro cognitive testers) were not aware of the treatment assignment. Of course clinicians who were visited by subjects every two months, knew the treatment assignment". This suggests that allocation was known by physicians, so high risk for event data |
| Incomplete outcome data (attrition bias) | Low risk | 38/362 dropouts in intervention group = 10.5%. 34/346 dropouts in control group = 9.8%. Similar dropout in groups over 2 years. |
| Selective reporting (reporting bias) | Unclear risk | Although prospectively registered, no full results paper published – results from conference abstracts only report some secondary outcomes |
| Attention | Unclear risk | Not enough details |
| Compliance | Low risk | ALA levels were significantly higher in the intervention group |
| Other bias | Low risk | None noted |
| Methods | RCT, parallel, (low fat diet (15% fat) with n‐3 fish oils vs AHA Step I diet (fat ≤ 30%) with olive oil supplements), 12 months Summary risk of bias: moderate or high | |
| Participants | Population: adults with multiple sclerosis N: 15 intervention, 16 control (analysed, intervention: 13, control: 14) Level of risk for CVD: low Men: 15.4% intervention, 14.3% control Mean age in years (SD): 39.9 (10.0) intervention, 45.1 (7.7) control Age range: not reported Smokers: not reported Hypertension: not reported Medications taken by at least 50% of those in the control group: all patients received 400 units of vitamin E, one multivitamin tablet (not containing any PUFA) and at least 500 mg calcium per day Medications taken by 20%‐49% of those in the control group: not reported Medications taken by some, but less than 20% of the control group: not reported Location: USA Ethnicity: not reported | |
| Interventions | Type: dietary advice plus supplement Comparison: EPA + DHA vs MUFA (low fat diet (15% fat) with n‐3 fish oils vs AHA Step I diet (fat ≤ 30%) with olive oil supplements) Intervention: 1.98 g/d EPA, 1.32 g/d DHA supplements (EPAX 5500 EE, Tishcon Corp) + low fat diet (< 15% total calories). Dose: 3.3 g/d EPA + DHA Control: one 1 g olive oil placebo capsules 6 times daily, moderate fat diet (< 30% total calories) (American Heart Association Step 1 diet) Compliance: assessed by individual food records; intervention 69.2% control 66.7% compliance; also at 12 months there was a significant difference between the fatty acid status of the intervention and control groups in terms of EPA (P = 0.027), as described in table 3 of the main paper Duration of intervention: 12 months | |
| Outcomes | Main study outcome: physical component scale (PCS) Dropouts: 3 intervention, 7 control Available outcomes: Mental Health Inventory, Modified Fatigue Impact Scale, weight change, HDL and LDL cholesterol, adverse events (MS relapse, TNF‐alpha, ICAM‐1, VCAM‐1 and other inflammatory markers, SF‐36 not used) Response to contact: no | |
| Notes | Study funding: National Multiple Sclerosis Society (PP0620T), Mellen Center Foundation and ''The Jog for the Jake'' grant | |
| Risk of bias | ||
| Bias | Authors' judgement | Support for judgement |
| Random sequence generation (selection bias) | Unclear risk | States "randomly assigned", no further details |
| Allocation concealment (selection bias) | Unclear risk | Not reported |
| Blinding of participants and personnel (performance bias) | High risk | Quote: "Patients knew the percentage of dietary fat but did not know the assignment of capsules oil supplementation." |
| Blinding of outcome assessment (detection bias) | Unclear risk | Not reported |
| Incomplete outcome data (attrition bias) | High risk | Discrepancy in numbers of participants discontinued and numbers analysed. Per protocol analysis |
| Selective reporting (reporting bias) | Unclear risk | No protocol or trials register entry found |
| Attention | Low risk | Treated equally |
| Compliance | Low risk | Assessed by individual food records; intervention 69.2% control 66.7% compliance. At 12 months there was a significant difference between the EPA status of the intervention and control groups (P = 0.027). |
| Other bias | Low risk | None noted |
| Methods | Wessex Evaluation of Fatty Liver and Cardiovascular Markers in NAFLD with Omacor Therapy (WELCOME) RCT, parallel, (Omacor or placebo), 15‐18 months Summary risk of bias: low | |
| Participants | Patients with NAFLD N: 51 intervention, 52 control (analysed, 47 intervention, 48 control) Level of risk for CVD: moderate Men: 49% intervention, 67% control Mean age in years (SD): 48.6 (11.1) intervention, 54 (9.6) control Age range: not reported (18‐75 years inclusion criteria) Smokers: 14.3% intervention, 11.8% control Hypertension: not reported Medications taken by at least 50% of those in the control group: lipid lowering drugs Medications taken by 20%‐49% of those in the control group: antihypertensives, metformin (data not provided by group) Medications taken by some, but less than 20% of the control group: none reported Location: UK Ethnicity: not reported | |
| Interventions | Type: supplement (Omacor capsules) Comparison: DHA + EPA vs MUFA Intervention: 4 g OMACOR per day (providing 1.84 g EPA, 1.52 g DHA as ethyl esters)]. Dose: 3.36 g/d EPA + DHA Control: 4 g olive oil capsules/ day (providing; ALA1%, oleic acid 67%, palmitic acid 15%, stearic acid 2%, n‐6 fat: 15%) Compliance: was assessed by recording the returned unused capsules and quantification of erthrocyte EPA + DHA enrichment (a prespecified threshold of 2% for DHA & threshold of 0.7% for EPA enrichment) Duration of intervention: 15‐18 months | |
| Outcomes | Main study outcome: changes in mean liver fat %, changes in 2 liver fibrosis scores, change in serum biomarkers Dropouts: 4 intervention, 4 control Available outcomes: weight, BMI, lipids, blood pressure, glucose, insulin sensitivity, body fat measures, liver enzymes, HbA1c, serum n‐3 FAs, authors provided details of diabetes diagnoses, % body fat, BP and carotid intima media thickness Response to contact: yes | |
| Notes | Study funding: National Institute for Health Research (NIHR) Southampton Biomedical Research Unit grant and by a Diabetes UK allied health research training fellowship awarded to KGM (Diabetes UK. BDA 09/ 0003937). CDB, PCC and ES are supported in part by the NIHR Southampton Biomedical Research Centre. Omacor and placebo were provided by Pronova Biopharma through Abbott Laboratories, Southampton, UK | |
| Risk of bias | ||
| Bias | Authors' judgement | Support for judgement |
| Random sequence generation (selection bias) | Low risk | Participants were block randomised by an independent clinical trials pharmacist to treatment with identical capsules by mouth of either n‐3 fatty acid ethyl esters (4 g/d Omacor; Pronova, Sandefjord, Norway) or placebo (4 g/d olive oil) for a minimum of 15 months and a maximum of 18 months (McCormick‐2015, p2). Patients were randomised according to standardised procedures (computerised block randomisation) by a research pharmacist at University Hospital Southampton NHS Foundation Trust. Simple randomisation in blocks of 4, either to trial medication or placebo was used. (Scorletti‐2014, p 2) |
| Allocation concealment (selection bias) | Low risk | Participants were block randomised by an independent clinical trials pharmacist to treatment with identical capsules by mouth of either n‐3 fatty acid ethyl esters (4 g/d Omacor; Pronova, Sandefjord, Norway) or placebo (4 g/d olive oil) for a minimum of 15 months and a maximum of 18 months (McCormick‐2015, p2). Only the clinical trials pharmacist was unblinded, and randomisation group allocation was concealed from all study members throughout the trial. (McCormick‐2015, p 2). |
| Blinding of participants and personnel (performance bias) | Low risk | Paper states that only the clinical trials pharmacist was unblinded, and randomisation group allocation was concealed from all study members throughout the trial. However, the trial register record states "single blind (investigator)". Although the capsules were identical, no information provided as to their smell and taste |
| Blinding of outcome assessment (detection bias) | Low risk | As above |
| Incomplete outcome data (attrition bias) | Low risk | The ITT analysis included all patients randomised who had complete data (baseline and end‐of‐study measurements), regardless of whether they were later found to be ineligible, a protocol violator, given the wrong treatment allocation, or never treated) (Scorletti 2014, p 4) |
| Selective reporting (reporting bias) | Unclear risk | Prospectively registered September 2008, study start September 2009, end February 2017. Outcome data for cardiac function not yet published, though other cardiovascular measures reported – take as ongoing as recent end date |
| Attention | Low risk | Both groups had the same attention |
| Compliance | Low risk | Assessed by recording the returned unused capsules and quantification of erthrocyte EPA + DHA enrichment (a prespecified threshold of 2% for DHA and threshold of 0.7% for EPA enrichment). Quote: "Enrichment was highly variable in the DHA+EPA group and 5 and 6 participants in the DHA+EPA group did not reach the prespecified threshold for EPA and DHA enrichment, respectively. In the placebo group, we expected no enrichment between baseline and end of study in all participants in this group, but 3 and 4 participants reached the thresholds set for the DHA+EPA group, for EPA and DHA, respectively. One participant in the placebo group admitted to taking cod liver oil during the study and another markedly increased consumption of fish." 10 of 95 non‐compliant |
| Other bias | Low risk | None noted |
| Methods | RCT, parallel, (n‐3 DHA vs n‐6 LA), 12 months Summary risk of bias: moderate to high | |
| Participants | Otherwise healthy elderly people with mild cognitive impairment. N: 120 intervention, 120 control (analysed, intervention: 110 control: 109) Level of risk for CVD: low Men: 35.8% intervention, 34.2% control Mean age in years (SD): 74.5 (2.65) intervention, 74.6 (3.31) control Age range: eligibility criteria were age 65‐85 years at trial start Smokers: 59.17% intervention, 61.67% control Hypertension: 9.17% intervention, 7.50% control Medications taken by at least 50% of those in the control group: not reported Medications taken by 20%‐49% of those in the control group: not reported Medications taken by some, but less than 20% of the control group: not reported Location: China Ethnicity: assumed Chinese | |
| Interventions | Type: supplement (capsule) Comparison: DHA vs corn oil (n‐6) Intervention: 1 capsule twice a day, with meals, including 2 g algal DHA (45‐55% DHA by weight). Martek Biosciences, Columbia, MD. Dose: ˜1 g/d DHA Control: corn oil, orange‐flavoured and orange colour to protect the study blind Compliance: participants were asked to return any remaining tablets. Compliance was defined as a ratio (actually taken/should have taken). Achieved 97% for intervention, 95% for control. Serum levels of DHA also measured, DHA at 6 months barely higher in intervention than in controls Duration of intervention: 12 months | |
| Outcomes | Main study outcome: cognitive function and hippocampal volume Dropouts: 10 intervention, 11 control Available outcomes: mortality, cognitive outcomes and cerebral volume measurements Response to contact: no reply to date | |
| Notes | Study funding: Chinese Nutrition Society (CNS) Nutrition Research Foundation‐ DSM Research Fund | |
| Risk of bias | ||
| Bias | Authors' judgement | Support for judgement |
| Random sequence generation (selection bias) | Low risk | Computer‐generated, also statistics analyst ignorant to this study used random number table |
| Allocation concealment (selection bias) | Unclear risk | Insufficient information |
| Blinding of participants and personnel (performance bias) | Low risk | Placebo capsules … identical in appearance. All capsules were orange‐flavoured and orange colour to protect the study blind . Packaged into identical pots, each containing 180 capsules, and labelled by staff who were not involved in the study. A blinding key linked each participant to his or her assigned treatment. This key was kept by an investigator not involved in any data collection or analyses, in a secure electronic file. The code was revealed at the completion of the trial following analyses of the main study aims. |
| Blinding of outcome assessment (detection bias) | Low risk | All project staff were unaware of group assignments until the completion of the trial and after data analysis |
| Incomplete outcome data (attrition bias) | Unclear risk | They did not describe how they imputed missing data (lost contact with patients, but called this an ITT analysis). Overall well matched and not high attrition. |
| Selective reporting (reporting bias) | Low risk | Registered trial prospectively. Outcomes match protocol |
| Attention | Low risk | "Adherence was encouraged and monitored throughout the trial by telephone assessment at 15 time points, and by blood assay at baseline" 6 months and 12 months. This and assessments were described as same for both arms. |
| Compliance | Unclear risk | Quote: "participants were requested to return any remaining tablets in order to measure compliance, together with the replenishment of capsules for the following month." Compliance … defined "as a ratio = actually taken/should have taken". "Adherence was encouraged and monitored throughout the trial by telephone assessment at 15 time points, and by blood assay at baseline" 6 months and 12 months On compliance tree, leads to "No, because no P values were supplied" therefore risk of compliance bias unclear |
| Other bias | Unclear risk | Although the register says single blind, the publication very clearly describes a double‐blind RCT |
| Methods | RCT, parallel, (n‐3 fish oil + amiodarone vs amiodarone), 12 months Summary risk of bias: moderate or high | |
| Participants | Patients with persistent atrial fibrillation (AF) referred to cardioversion N: 23 intervention, 24 control Level of risk for CVD: high Men: 47.8% intervention, 37.5% control Mean age in years (SD): 62 (12) intervention, 61 (11) control Age range: 37‐81 Smokers: not reported Hypertension: 56.5% intervention, 50% control Medications taken by at least 50% of those in the control group: all patients received amiodarone (an antiarrhythmic medication) Medications taken by 20%‐49% of those in the control group: beta‐blockers, statins, ACE inhibitors and ARBs Medications taken by some, but less than 20% of the control group: calcium antagonists Location: Turkey Ethnicity: not reported | |
| Interventions | Type: supplement (capsule) Comparison: LCn3 vs nil Intervention: 2 g/d n‐3 PUFA (Marincap, Kocak, Turkey). 4 × 500 mg capsules providing EPA 18% (360 mg/d); DHA 12% (240 mg/d). Dose: 0.6 g/d EPA + DHA Control: no placebo. Amiodarone was given to both groups. Compliance: no details Duration of intervention: 12 months or AF recurrence | |
| Outcomes | Main study outcome: AF recurrence(endpoint) Dropouts: no details Available outcomes: all cause mortality (nil death), stroke, TIA, AF recurrence (hyperthyroidism diagnosis, hospitalisation) Response to contact: not yet attempted | |
| Notes | Study funding: unclear | |
| Risk of bias | ||
| Bias | Authors' judgement | Support for judgement |
| Random sequence generation (selection bias) | Unclear risk | No details |
| Allocation concealment (selection bias) | Unclear risk | Quote: "randomised"; no further details |
| Blinding of participants and personnel (performance bias) | High risk | No placebo |
| Blinding of outcome assessment (detection bias) | Unclear risk | No details |
| Incomplete outcome data (attrition bias) | Low risk | All were accounted for |
| Selective reporting (reporting bias) | Unclear risk | No trial registry entry or protocol found |
| Attention | Low risk | Both groups seem to have the same care |
| Compliance | Unclear risk | No information |
| Other bias | Low risk | None noted |
ACE: angiotensin‐converting enzyme; ADAS: Alzheimer's Disease Assessment Scale; ADL: activities of daily living; AF: atrial fibrillation; AHA: American Heart Association; BMI: body mass index; ALT: alanine transaminase; ARB: angiotensin‐receptor blocker; BMD: bone mineral density; BMI: body mass index; BP: blood pressure; CABG: coronary artery bypass grafting; CDAI: Clinical Disease Activity Index; CHD: coronary heart disease; CHO: carbohydrate; CV: cardiovascular;CRP: C‐reactive protein; CVD: cardiovascular disease; DAS: Disease Activity Score; DBP: diastolic blood pressure; DHA: docosahexaenoic acid; DM: diabetes mellitus; DMARD: disease‐modifying antirheumatic drugs; DPA: docosapentaenoic acid; E: dietary energy; ECG: electrocardiogram; EDSS: Expanded Disability Status Scale; EPA: eicosapentaenoic acid; ESR: erythrocyte sedimentation rate; FA: fatty acid; FFQ: food frequency questionnaire; FH: family history; FMD: flow‐mediated dilation; GFR: glomular filtration rate; GLA: gamma linolenic acid; HbA1c: glycated haemoglobin; HCQ: hydroxychloroquine; HDL: high‐density lipoprotein; H/O: personal history of; HOMA‐IR: homeostatic model assessment of insulin resistance; HRT: hormone replacement therapy; HT: hypertension; IBD: inflammatory bowel disease; IADL: instrumental activities of daily living; ICAM‐1: intercellular adhesion molecule 1; IL: interleukin;IMT: immune‐mediated thrombocytopenia; IQR: interquartile range; LCn3: long‐chain omega‐3 fatty acids; LDL: low‐density lipoprotein; MD: mean difference; MDA: malondialdehyde; MI: myocardial infarction; MMSE: Mini–Mental State Examination; MS: multiple sclerosis; MUFA: mono‐unsaturated fatty acids; MXT: methotrexate;n‐3: omega‐3; NASH: non‐alcoholic steatohepatitis; NSAID: non‐steroidal anti‐inflammatory drug; PAI1: plasminogen activator inhibitor‐1; PI: principal investigator;PUFA: poly‐unsaturated fatty acids; PTCA: percutaneous transluminal coronary angioplasty; P/S: poly‐unsaturated/saturated fat ratio; QoL: quality of life; QUICKI: quantitative insulin sensitivity check index; RA: rheumatoid arthritis; RCT: randomised controlled trial; SBP: systolic blood pressure; SD: standard deviation;SE: standard error; RCT: randomised controlled trial; SFA: saturated fatty acids; SSZ: sulfasalazine; TAG: triacylglycerol; TG: serum triglycerides; TIA: transient ischaemic attack; TNF: tumour necrosis factor; VCAM‐1: vascular cell adhesion molecule 1; WHO: World Health Organization.
Characteristics of excluded studies [ordered by study ID]
| Study | Reason for exclusion |
| Study not randomised | |
| No relevant outcomes measured | |
| No relevant outcomes measured | |
| Authors confirmed no relevant outcomes measured | |
| Participants not adult humans, or participants unwell at baseline | |
| Mean duration of intervention 10 months (range 3 to 16 months) | |
| Participants not adult humans, or participants unwell at baseline | |
| Intervention is multifactorial (FA/flavanoid blend) | |
| Participants not adult humans, or participants unwell at baseline | |
| Multisupplement intervention | |
| No appropriate control group | |
| No appropriate control group | |
| No relevant outcomes measured | |
| Participants not adult humans, or participants unwell at baseline | |
| Participants not adult humans, or participants unwell at baseline | |
| Multifactorial intervention (cannot separate effects of omega‐3 fats from those of other dietary, behavioural or drug interventions) | |
| No omega‐3 supplementation or dietary advice | |
| Participants not adult humans, or participants unwell at baseline | |
| Multifactorial intervention (cannot separate effects of omega‐3 fats from those of other dietary, behavioural or drug interventions) | |
| No relevant outcomes measured | |
| Study not randomised | |
| Intervention is multifactorial (omega 3 given with coenzyme Q and other compounds vs placebo) | |
| No clinical outcomes collected (confirmed by corresponding author, 30 November 2016) | |
| Intervention was milk enriched with EPA and DHA but also other vitamins and minerals ‐ multifactorial dietary intervention | |
| Intervention was milk enriched with EPA and DHA but also other vitamins and minerals ‐ multifactorial dietary intervention | |
| Study not randomised | |
| 9‐month intervention period | |
| Study not randomised | |
| No omega‐3 supplementation or dietary advice | |
| No relevant outcomes measured | |
| Participants not adult humans, or participants unwell at baseline | |
| Study not randomised | |
| Study not randomised | |
| Participants not adult humans, or participants unwell at baseline | |
| Multi‐factorial intervention (cannot separate effects of omega‐3 fats from those of other dietary, behavioural or drug interventions) | |
| No appropriate control group | |
| No relevant outcomes measured | |
| No relevant outcomes measured | |
| Authors confirmed no relevant outcomes measured | |
| Intervention included intensive behavioural changes including exercise and nutrition counselling geared towards weight loss | |
| Participants not adult humans, or participants unwell at baseline | |
| Trial recruitment was suspended due to lack of funding | |
| No relevant outcomes measured | |
| Intervention was 9 months and no relevant outcomes | |
| The proposed one‐year study was never conducted | |
| Follow‐up not at least a year | |
| No omega‐3 supplementation or dietary advice | |
| LCn3 compared to sotalol (group 1), sotalol & perindopril (group 2), sotalol, perindopril & rosuvastatin (group 3), so no useful control group | |
| Multifactorial intervention (cannot separate effects of omega‐3 fats from those of other dietary, behavioural or drug interventions) | |
| Intervention duration 6 months | |
| Intervention was 8 months | |
| Study not randomised | |
| < 1 year duration | |
| No relevant outcomes measured | |
| < 1 year duration | |
| Authors confirmed no relevant outcomes | |
| Study not randomised | |
| Authors confirmed no relevant outcomes measured | |
| Multifactorial intervention (cannot separate effects of omega‐3 fats from those of other dietary, behavioural or drug interventions) | |
| Multifactorial dietary intervention that included omega 3 fats but many other nutrition components | |
| No relevant outcomes measured | |
| Multisupplement intervention | |
| Multifactorial intervention (cannot separate effects of omega‐3 fats from those of other dietary interventions) | |
| Participants not adult humans, or participants unwell at baseline | |
| No relevant outcomes measured | |
| Not an omega‐3 intervention | |
| No relevant outcomes measured | |
| Authors confirmed no relevant outcomes | |
| Publication retracted (fraudulent) | |
| Unbalanced intervention as the intervention arm contains additional GLA | |
| Multisupplement intervention | |
| No planned relevant outcomes. Follow‐up < 12 months | |
| 48 weeks intervention planned in trials register entry | |
| Multifactorial dietary intervention | |
| Mutlisupplement intervention | |
| No relevant outcomes measured | |
| No appropriate control group | |
| Study was not funded and did not achieve full recruitment (info provided by co‐author) | |
| Multifactorial intervention (cannot separate effects of omega‐3 fats from those of other dietary, behavioural or drug interventions) | |
| Study not randomised | |
| Study not randomised | |
| Authors confirmed no relevant outcomes | |
| Study not randomised, < 1 year intervention | |
| < 1 year intervention | |
| Study not randomised | |
| No appropriate control group | |
| Intervention was < 1 year | |
| Authors confirmed no relevant outcomes | |
| Expressions of concern issued by the BMJ and The Lancet regarding research by this first author (BMJ 2005; Horton 2005) | |
| Expressions of concern issued by theBMJ and The Lancet regarding research by this first author (BMJ 2005; Horton 2005) | |
| Expressions of concern issued by the BMJ and The Lancet regarding research by this first author (BMJ 2005; Horton 2005) | |
| Expressions of concern issued by the BMJ and The Lancet regarding research by this first author (BMJ 2005; Horton 2005) | |
| Participants not adult humans, or participants unwell at baseline and intervention is < 1 year | |
| Authors confirmed no relevant outcomes during trial | |
| No relevant outcomes. Measured lipids but unclear baseline and endpoint is probably 4 weeks | |
| Multifactorial intervention (cannot separate effects of omega‐3 fats from those of other dietary, behavioural or drug interventions) | |
| The supplement (Nutrof Omega) contained DHA, Vit C, E, B1, B2, B3, B6, B9, B12, Zn, Mn, Se, Cu, lutein and zeaxanthin (multifactorial dietary intervention) | |
| Participants were not a minimum of 18 years old | |
| No appropriate control group | |
| Study not randomised |
DHA: docosahexaenoic acid; EPA: eicosapentaenoic acid; FA: fatty acid; GLA: gamma linolenic acid.
Characteristics of ongoing studies [ordered by study ID]
| Trial name or title | Aboriginal Cardiovascular Omega‐3 randomised controlled trial (AC Omega3) |
| Methods | RCT |
| Participants | Indigenous Australian adults with stable coronary artery disease |
| Interventions | Each for 12 months: Arm 1: omega‐3 (1800 mg/d AlaskOmega: 3 capsules/d: 400 mg EPA and 200 mg DHA) Arm 2: placebo mixed oil capsules (1000 mg/d: 3 capsules/d containing palm oil, gelatin, glycerol, sunflower oil, rapeseed oil, mixed tocopherols, and a "small amount" of fish oil (for taste to aid blinding) |
| Outcomes | Primary: serum non‐HDL‐C Secondary: triglycerides, total cholesterol, LDL cholesterol, HDL cholesterol, lipid functionality by cholesterol efflux and CETP, heart rate variability, platelet function and thrombosis markers, inflammation markers, cumulative combined rate of major adverse cardiac events (including death, non‐fatal MI, unstable angina, non‐fatal stroke, revascularisation and cardiac related hospital admissions) |
| Starting date | Registered on trials registry: 10 July 2014 Study start date: 1 October 2014 Estimated study completion date: unclear |
| Contact information | Alex Brown (PI), Wardliparingga Aboriginal Unit, Adelaide, Australia, [email protected] |
| Notes | ACTRN12614000732684 Alex Brown contacted in 2016: confirmed study is actively recruiting |
| Trial name or title | Atorvastatin in Factorial with Omega‐3 fatty acid Risk Reduction in Diabetes (AFORRD) |
| Methods | RCT |
| Participants | Patients with type 2 diabetes with no known CVD and not taking lipid‐lowering therapy, adults (> 18 years) N: intervention 397, control 403 (analysed intervention 371, control 361) |
| Interventions | Each for 12 months: Arm 1: atorvastatin (Lipitor 20 mg/d) and olive oil placebo (2 g/d) Arm 2: omega‐3 (Omacor 2 g/d: 46% EPA, 38% DHA) and placebo tablets for atorvastatin Arm 3: atorvastatin (Lipitor 20 mg/d) and Omega‐3 (Omacor 2 g/d: 46% EPA, 38% DHA) Arm 4: placebo tablets for atorvastatin and olive oil placebo (2 g/d) |
| Outcomes | Primary: lipid profiles Secondary: phytosterol changes, HbA1c, estimated CVD risk using the UK Prospective Diabetes Study risk engine |
| Starting date | Registered on trials registry: 4 April 2004 Study start date: 1 November 2004 Estimated study completion date: 31 July 2006 |
| Contact information | Rury Holman, Oxford Centre for Diabetes |
| Notes | ISRCTN76737502 Rury Holman contacted in 2016: confirmed results are not yet published, but planned |
| Trial name or title | A Study of Cardiovascular Events iN Diabetes (ASCEND) |
| Methods | RCT |
| Participants | Patients with diabetes, without vascular disease |
| Interventions | Each for 7 years: Arm 1: omega‐3 (1 g/d: 0.41 g EPA, 0.34 g DHA) and placebo tablets for aspirin Arm 2: aspirin (100 mg/d) and olive oil placebo capsule Arm 3: omega‐3 (1 g/d) and aspirin (100 mg/d) Arm 4: olive oil placebo and placebo tablets for aspirin |
| Outcomes | Primary: cardiovascular events Secondary: mortality, hospitalisations, cancer |
| Starting date | Registered on trials registry: 24 August 2005 Study start date: March 2005 Estimated study completion date: September 2017 |
| Contact information | Jane Armitage (PI), University of Oxford Clinical Trial Service Unit |
| Notes | NCT00135226 Trial website: ascend.medsci.ox.ac.uk; rum.ctsu.ox.ac.uk/ascend |
| Trial name or title | Clinical efficacy of fish oil as adjunct therapy for patients with chronic periodontitis |
| Methods | RCT |
| Participants | Patients (25‐80 years, non‐smokers) with newly diagnosed severe but non‐aggressive periodontitis |
| Interventions | Each for 13 months: Arm 1: fish oil rich in EPA (6 × 500 mg capsules/d: 277 mg EPA; 27 mg DHA) and standard periodontal treatment (scaling and debridement) Arm 2: fish oil rich in DHA (6 × 500 mg capsules/d: 66 mg EPA; 258 mg DHA) and standard periodontal treatment Arm 3: soya oil placebo (6 × 500 mg capsules/d) and standard periodontal treatment |
| Outcomes | Primary: probing pocket depth, clinical attachment level (CAL) Secondary: inflammatory biomarkers in gingival crevicular fluid, erythrocyte omega‐3, C‐reactive protein |
| Starting date | Registered on trials registry: 23 July 2010 Study start date: July 2010 Estimated study completion date: unclear |
| Contact information | Mark Bartold, University of Adelaide, [email protected] |
| Notes | ACTRN12610000594022 PhD, Boram Park, available giving 4 month outcome data for pilot study N = 33 participants Mark Bartold written to in 2016. Confirmed preparing full publications for submission |
| Trial name or title | Beyond Ageing Project phase 2: a selective prevention trial using novel pharmacotherapies in an older age cohort at risk for depression |
| Methods | RCT |
| Participants | Older adults (60+ years) at risk of depression (K‐10 score ranging from 16‐29) who initially participated in the first Beyond Ageing Project |
| Interventions | Each for 12 months: Arm 1: omega‐3 (4 capsules, total 2 g/d: 1200 mg EPA and 800 mg DHA) and placebo microcrystalline cellulose (1 capsule) Arm 2: paraffin oil placebo (4 capsules) and sertraline hydrochloride (1 capsule, 50 mg) Arm 3: paraffin oil placebo (4 capsules) and placebo microcrystalline cellulose (1 capsule) |
| Outcomes | Primary: depressive symptoms (PHQ‐9, patient health questionnaire 9) Secondary: cognitive decline, MMSE, brain metabolism, hippocampal volume, anxiety (assessed using GAD‐7), disability (WHODAS‐II), sleeping problems (PSQI, Pittsburgh Sleep Quality Index), exercise (Active Australian Survey) |
| Starting date | Registered on trials registry: 12 January 2010 Study start date: June 2011 Estimated study completion date: main results expected in 2017 |
| Contact information | Ian Hickie (PI), Brain and Mind Centre, University of Sydney, [email protected] |
| Notes | ACTRN12610000032055 |
| Trial name or title | Long‐term effects of a reduced fat diet intervention in pre‐diabetes |
| Methods | RCT |
| Participants | Participants with pre‐diabetes, impaired fasting glucose (IFG) or impaired glucose tolerance (IGT), 201 participants discussed in one abstract, 134 in a later abstract |
| Interventions | Each for 3 years: Arm 1: reduced fat diet (fat content at or below 20% total energy, ratio of PUFA/SFA 0.8 to 1.0) Arm 2: normal/control diet |
| Outcomes | Incidence of diabetes, BMI, lipids, insulin, plasma glucose, HbA1c, blood pressure, nutritional intake |
| Starting date | Registered on trials registry: no registration found Study start date: not stated Estimated study completion date: not stated |
| Contact information | Chandrakala Galla, [email protected]; Arpana Gaddam, [email protected] |
| Notes | Authors written to in 2016: Dr Gaddam confirmed work submitted as a PhD but not published in full. Requested copy of PhD thesis, but no reply to date. Funding: DiabetOmics India |
| Trial name or title | Influence of different sources of n‐3 fatty acid on plasma lipid in moderately hypercholesterolaemic subjects |
| Methods | RCT |
| Participants | Adults (40‐65 years) with mild to moderate hypercholesterolaemia |
| Interventions | Arm 1: EPA/DHA 1.8 g/d Arm 2: EPA/DHA 3.6 g/d Arm 3: ALA 4 g/d Arm 4: placebo |
| Outcomes | Fatty acids, lipids, cytokines (IL‐6, IL‐1a) |
| Starting date | Registered on trials registry: 13 March 2012 Study start date: unclear Estimated study completion date: unclear |
| Contact information | Su Yixiang, Sun‐Yat Sen University, China, [email protected]; Zhou Quan, Guangzhou Medical University, [email protected] |
| Notes | ChiCTR‐TRC−12002014 Su Yixiang and Zhou Quan contacted in 2016: no response |
| Trial name or title | Vitamin D3‐ omega3‐ home exercise‐ healthy ageing and longevity trial (DO‐HEALTH) |
| Methods | RCT |
| Participants | Community dwelling adults 70 years and older, 50% of seniors enrolled based on a fall in the year before enrolment |
| Interventions | Each for 3 years: Arm 1: omega‐3 (1 g/d, ratio EPA:DHA = 1:2) and vitamin D3 (2000 IU/d) capsules and strength home exercise (3 × 30 min/week) Arm 2: omega‐3 (1 g/d, ratio EPA:DHA = 1:2) and vitamin D3 (2000 IU/d) capsules and flexibility home exercise (3 × 30 min/week) Arm 3: omega‐3 (1 g/d, ratio EPA:DHA = 1:2) and placebo capsules and strength home exercise (3 × 30 min/week) Arm 4: omega‐3 (1 g/d, ratio EPA:DHA = 1:2) and placebo capsules and flexibility home exercise (3 × 30 min/week) Arm 5: placebo and vitamin D3 (2000 IU/d) capsules and strength home exercise (3 × 30 min/week) Arm 6: placebo and vitamin D3 (2000 IU/d) capsules and flexibility home exercise (3 × 30 min/week) Arm 7: placebo and placebo capsules and strength home exercise (3 × 30 min/week) Arm 8: placebo and placebo capsules and flexibility home exercise (3 × 30 min/week) |
| Outcomes | Primary: non‐vertebral fractures, functional decline, blood pressure, cognitive decline, rate of any infection Secondary: other fractures, falls, pain in knee osteoarthritis, musculoskeletal changes, gastro‐intestinal symptoms, mental and oral health, quality of life, life‐expectancy, cardiovascular events, cancer, glucose measures, cost‐benefit. All endpoints supported by a DO‐HEALTH biomarker study |
| Starting date | Registered on trials registry: 6 December 2012 Study start date: December 2012 Estimated study completion date: November 2017 |
| Contact information | Heike Bischoff‐Ferrari (PI), Centre on Aging and Mobility, University of Zurich |
| Notes | NCT01745263 EudraCT: 2012−001249‐41 |
| Trial name or title | DRy Eye Assessment and Management study (DREAM) |
| Methods | RCT |
| Participants | Adults with dry eye |
| Interventions | Each for 2 years Arm 1: omega‐3 supplements (2000 mg EPA + 1000 mgDHA/d as 5 gel caps) Arm 2: olive oil supplements (5 gel caps) |
| Outcomes | Primary: OSDI score (ocular surface disease index) Secondary: other eye health measures, SF‐36, healthcare utilisation costs, cost‐effectiveness |
| Starting date | Registered on Trials Registry 28 April 2014 Study start date: November 2014 Estimated study completion date: July 2017 |
| Contact information | Penny Asbell, Mount Sinai Icahn School of Medicine (Study Chair), Maureen Maguire, University of Pennsylvania (PI) |
| Notes | NCT02128763 |
| Trial name or title | ENabling Reduction of low‐Grade Inflammation in SEniors (ENRGISE) |
| Methods | RCT |
| Participants | People aged 70+ years with self‐reported walking or stair‐climbing difficulty |
| Interventions | Each for 1 year Arm 1: omega‐3 fish oil (1.4 g/d for 6 months, possibly increasing to 2.8 g/d) Arm 2: losartan 25 mg/d Arm 3: placebo corn oil (for omega‐3) plus placebo cellulose (for losartan) Arm 4: omega‐3 plus losartan Arm 5: placebo corn oil (for omega‐3) Arm 6: placebo cellulose (for losartan) |
| Outcomes | Primary: IL‐6, 400 meter walk test Secondary: short physical performance battery, frailty, hand grip strength, knee dynamometry, SF‐36 |
| Starting date | Registered on Trials Registry 3 February 2016 Study start date: February 2016 Estimated study completion date: March 2018 |
| Contact information | Jane Lu [email protected] Michael Stancil [email protected] |
| Notes | NCT02676466 |
| Trial name or title | Intervention of testosterone and fish oil for the prevention of Alzheimer's Disease: InTrePad |
| Methods | RCT |
| Participants | PiB‐PET (Pittsburgh compound B) positive men aged 60 years and over with subjective memory complaints |
| Interventions | Each for 56 weeks: Arm 1: DHA capsules (1720 mg/d) and testosterone undecanoate (intramuscular injection 1000 mg/4 mL every 8 weeks) Arm 2: placebo DHA and testosterone undecanoate (intramuscular injection 1000 mg/4 mL every 8 weeks) Arm 3: placebo DHA and placebo testosterone |
| Outcomes | Primary: PiB score Secondary: neuropsychological, mood and daily functioning questionnaires, beta amyloid levels, fluorodeoxyglucose to assess brain glucose metabolism, inflammatory and oxidative biomarkers, hippocampal volume, quality of life, safety and tolerability of treatment |
| Starting date | Registered on trials registry: 14 January 2013 Study start date: 28 February 2013 Estimated study completion date: not stated |
| Contact information | Ralph Martins (PI), Sir James McCusker Alzheimer's Disease Research Unit, Hollywood Medical Centre, Nedlands, Australia, [email protected] |
| Notes | ACTRN12613000034730 Ralph Martins written to in 2016‐ no response |
| Trial name or title | Long‐term effects of interventional strategies to prevent cognitive decline in elderly (MAPT PLUS) |
| Methods | RCT – extension of MAPT trial |
| Participants | Participants of MAPT trial |
| Interventions | Follow‐up 2 year extension of patients in MAPT, after completion of MAPT interventions |
| Outcomes | Primary: cognitive and functional status (Grober and Buschke test) Secondary: markers of cerebral atrophy, cost‐effectiveness |
| Starting date | Registered on trials registry: 30 December 2011 Study start date: December 2011 Estimated study completion date: November 2016 |
| Contact information | Bruno Vellas (PI), University Hospital, Toulouse, vellas.b@chu‐toulouse.fr |
| Notes | NCT01513252 Bruno Vellas written to in 2016‐ no response |
| Trial name or title | Omega 3 fatty acids in bipolar disorder prophylaxis |
| Methods | RCT |
| Participants | People aged 18 to 65 with bipolar disorder |
| Interventions | Each for 12 months: Arm 1: omega‐3 Arm 2: placebo |
| Outcomes | Prophylactic efficacy |
| Starting date | Trial Registration entry: 2 February 2001 Trial start date: July 2000 Estimated study completion: July 2004 |
| Contact information | Andrew Stoll, Mclean Hospital |
| Notes | NCT00010868 The PI, Andrew Stoll, appears to have been struck off the medical register in Massachusetts in 2011 (Commonwealth of Massachusetts Board of Registration in Medicine, Adjudicatory Case number 2011−026) so it has not been possible to contact him and no publication of results has been found |
| Trial name or title | Studies of serum PSA (prostate specific antigen) to help resolve the current implication of alpha‐linolenic acid and prostate cancer |
| Methods | RCT |
| Participants | Adults 18‐77 years |
| Interventions | Arm 1: ALA rich diet Arm 2: control (not detailed) |
| Outcomes | Prostate specific antigen, atrial fibrillation |
| Starting date | Registered on trials registry: 29 March 2006 Study start date: unclear Estimated study completion date: unclear |
| Contact information | David Jenkins, University of Toronnto, [email protected] |
| Notes | NCT00309439 David Jenkins written to in 2016: confirmed not published in full and data incomplete |
| Trial name or title | Arrhythmia prevention with an alpha‐linolenic enriched diet |
| Methods | RCT, parallel, 2 arm, 12 months |
| Participants | 98 people with successful atrial fibrillation electrical cardioversion |
| Interventions | Canola margarine and oil, rich in ALA, versus a conventional diet (control), for 1 year |
| Outcomes | Length of time to first recurrence of AF |
| Starting date | June 1999, expected finish date June 2003, registered December 2006 so appears to have been carried out |
| Contact information | Principal Investigator: Jean‐Paul Broustet, MD, PhD, Universitary Hospital Haut‐Lévêque Bordeaux France |
| Notes | NCT00410020, registered December 2006, no publication found |
| Trial name or title | Dietary energy restriction and omega‐3 fatty acids on mammary tissue |
| Methods | RCT |
| Participants | Overweight women (30‐55 years) with increased breast cancer risk |
| Interventions | For 1 year: Arm 1: lovaza (omega‐3‐acid ethyl esters) Arm 2: lovaza and dietary energy restriction Arm 3: placebo Arm 4: placebo and dietary energy restriction |
| Outcomes | Ki67 expression at 1 year |
| Starting date | Registered on trials registry: 31 January 2013 Study start date: March 2013 Estimated study completion date: March 2018 |
| Contact information | Andrea Manni, Hershey Medical Centre, [email protected] (PI) or Cynthia DuBrock, [email protected] |
| Notes | NCT01784042. Trials register states "Withdrawn (no funding)" |
| Trial name or title | Investigating a phosphatidylserine based dietary approach for the management of mild cognitive impairment |
| Methods | RCT |
| Participants | People with mild cognitive impairment (MCI) aged 65‐85 years |
| Interventions | Each for 24 months: Arm 1: phosphatidylserine omega‐3 (DHA enriched) Arm 2: placebo cellulose capsules |
| Outcomes | Primary: selective reminding test (SRT) Secondary: mini mental state examination (MMSE), neurological battery test (NBT), dementia (DSM‐4 criteria), mini sleep questionnaire (MSQ), Hamilton Anxiety rating scale (HAM‐A), safety and adverse events |
| Starting date | Registered on trials registry: 6 August 2014 Study start date: September 2014 Estimated study completion date: September 2019 |
| Contact information | Nadia Niemerzyanski, [email protected]; Yael Richter, [email protected] |
| Notes | NCT02211560 |
| Trial name or title | Omega 3 fatty acids and ERPR(‐)HER2(±) breast cancer prevention |
| Methods | RCT |
| Participants | Women at risk for recurrent breast cancer‐ with prior diagnosis of stage 0 to III breast cancer and completion of surgery, chemotherapy or trastuzumab or radiation therapy |
| Interventions | Each for 12 months: Arm 1: omega‐3 high dose capsules (5 g/d EPA + DHA) Arm 2: omega‐3 low dose capsules (0.9 g/d EPA + DHA) |
| Outcomes | Primary: breast adipose tissue metabolites Secondary: cytomorphology or cell proliferation of mammary epithelial cells, DNA promoter methylation and pro‐inflammatory gene expression in mammary epithelial and adipose tissue |
| Starting date | Registered on trials registry: 14 October 2014 Study start date: August 2014 Estimated study completion date: January 2019 |
| Contact information | Anitra Sumbry, [email protected]; Lisa Yee (PI), Ohio State University |
| Notes | NCT02295059 |
| Trial name or title | Impact of icosapent ethyl on Alzheimer's disease (AD) biomarkers in preclinical adults |
| Methods | RCT |
| Participants | Cognitively healthy adults aged 50 to 70 years whose parents had AD |
| Interventions | Each for 18 months: Arm 1: Icosapent ethyl EPA (Vascepa) 4 g/d gel cap Arm 2: matching gel cap placebo |
| Outcomes | Primary: cerebral blood flow by MRI (magnetic resonance imaging) Secondary: CSF biomarkers of AD, cognitive performance (preclinical Alzheimer's cognitive composite, PACC) |
| Starting date | Registered on trials registry: 21 March 2016 Study start date: December 2016 Estimated study completion date: November 2021 |
| Contact information | Cynthia Carlsson, [email protected]; Elena Beckman, [email protected] |
| Notes | NCT02719327 |
| Trial name or title | OMega‐3 fatty acids in Elderly patients with Myocardial Infarction study (OMEMI) |
| Methods | RCT |
| Participants | Elderly patients (70‐82 years) with acute MI |
| Interventions | Each for 24 months: Arm 1: omega‐3 capsules, 3/d (Pikasol, total of 1.8 g/d EPA + DHA) and standard therapy Arm 2: corn oil placebo, 3/d and standard therapy |
| Outcomes | Primary: composite of total mortality, first non‐fatal recurring AMI, stroke and revascularisation Secondary: new onset atrial fibrillation, adipose tissue, serum fatty acids, makers of endothelial function, inflammation, coagulation and fibrinolytic activity, genes associated with atherothrombosis |
| Starting date | Registered on trials registry: 16 April 2013 Study start date: November 2012 Estimated study completion date: November 2019 |
| Contact information | Svein Solheim, Center for Clinical Heart Research, Oslo University Hospital, [email protected] |
| Notes | NCT01841944 |
| Trial name or title | Reduction of cardiovascular events with EPA‐intervention trial (REDUCE‐IT) |
| Methods | RCT |
| Participants | Patients (45 years or over) with hypertriglyceridaemia, with cardiovascular disease or at high risk for cardiovascular disease, and on statin |
| Interventions | Each for 4‐6 years: Arm 1: EPA ethyl ester (AMR101 4 g/d) Arm 2: placebo |
| Outcomes | Primary: composite of cardiovascular death, MI, stroke, coronary revascularisation and hospitalisation for unstable angina Secondary: incidence of additional cardiovascular events, lipid and lipoprotein levels |
| Starting date | Registered on trials registry: 13 December 2011 Study start date: November 2011 Estimated study completion date: December 2017 |
| Contact information | Deepak Bhatt (PI), Brigham and Women's Hospital |
| Notes | NCT01492361 |
| Trial name or title | The seAFOod (systematic evaluation of Aspirin and Fish Oil) Polyp Prevention Trial |
| Methods | RCT |
| Participants | NHS Bowel Cancer Screening Programme patients (55‐73 years) identified as "high risk" (5 or more small adenomas; or 3 or more adenomas with at least one being 10 mm or more in diameter) after their 1st screening colonoscopy |
| Interventions | Each for 12 months: Arm 1: EPA (ALFA capsules: 2 × 500 mg twice daily = 2 g/d) and aspirin placebo (1/d) Arm 2: EPA placebo (capric and capryllic acid triglycerides: 2/d) and aspirin (1/d = 300 mg/d) Arm 3: EPA (ALFA capsules: 2 × 500 mg twice daily = 2 g/d) and aspirin (1/d = 300 mg/d) Arm 4: EPA placebo (cparic and capryllic acid triglycerides: 2/d) and aspirin placebo (1/d) |
| Outcomes | Primary: number of patients with one or more adenomas at 12 months Secondary: adverse events, number of "advanced" adenomas per patients, number of "high risk" patients re‐classified as "intermediate risk", number patients with one or more advanced adenomas, adenoma region in the colorectum, total number of adenomas per patient, number of patients with colorectal cancer, levels of bioactive lipid mediators e.g. omega‐3 |
| Starting date | Trial Registration entry: 6 May 2011 Trial start date: 30 May 2011 Estimated study completion: 31 July 2017 |
| Contact information | Mark Hull, Leeds Institute of Molecular Medicine, [email protected] |
| Notes | ISRCTN05926847 EudraCT 2010−020943−10 |
| Trial name or title | N‐3 PUFA for vascular cognitive aging |
| Methods | RCT |
| Participants | Older adults (80 years and older) at high risk for cognitive decline and dementia of Alzheimer's type |
| Interventions | Each for 3 years: Arm 1: omega‐3 fish oil (1.65 g/d EPA + DHA) Arm 2: soybean oil placebo (1.65 g/d) |
| Outcomes | Primary: total cerebral white matter volume Secondary: biomarkers of endothelial health, total brain atrophy, medial temporal lobe atrophy, ventricular expansion, trail making test part B, digit symbol WAIS‐R, cerebral blood flow, fractional anisotropy within frontal gyri |
| Starting date | Registered on trials registry: 24 September 2013 Study start date: May 2014 Estimated study completion date: March 2019 |
| Contact information | Alena Borgatti, [email protected]; James Dursch, [email protected]; Gene Bowman and Lynne Shinto (PIs), Oregon Health and Science University |
| Notes | NCT01953705 |
| Trial name or title | A long‐term outcomes study to assess statin residual risk reduction with EpaNova in high cardiovascular risk patients with hypertriglyceridemia (STRENGTH) |
| Methods | RCT |
| Participants | Adult patients with hypertriglyceridaemia and low HDL and high risk for CVD |
| Interventions | Each for 3‐5 years: Arm 1: omega‐3 carboxylic acid capsule (Epanova, not less than 800 mg/g) and statin (once daily) Arm 2: corn oil placebo capsule and statin (once daily) |
| Outcomes | Primary: time to first occurrence of any component of the composite MACE (cardiovascular death, nonfatal MI, nonfatal stroke, emergent/elective coronary revascularisation, hospitalisation for unstable angina) Secondary: composite measure of cardiovascular events that include the first occurrence of cardiovascular death, nonfatal MI and non‐fatal stroke; composite measure of coronary events that include the first occurrence of cardiac death; first occurrence of individual components of MACE; time to cardiovascular death. Other measures include: all cause mortality, new atrial fibrillation, thrombotic events, heart failure events |
| Starting date | Trial Registration entry: 2 April 2014 Trial start date: October 2014 Estimated study completion: November 2019 |
| Contact information | AstraZeneca Clinical Study Information Centre, [email protected]. PIs Steven Nissen (Cleveland Clinic), Michael Lincoff (Cleveland Clinic) Stephen Nicholls (Adelaide Clinical Research) |
| Notes | NCT02104817 EudraCT: 2014−001069−28 |
| Trial name or title | Improving the results of heart bypass surgery using new approaches to surgery and medication (SUPERIORSVG) |
| Methods | RCT |
| Participants | Adults having coronary artery bypass graft (CABG) using saphenous vein graft (SVG) |
| Interventions | Each for 12 months: Arm 1: fish oil supplements (2 × 1 g/d Ocean Nutrition capsules: 55% fish oils EPA:DHA 33%:22%) and SVG conventionally harvested Arm 2: placebo and SVG conventionally harvested Arm 3: fish oil supplements (2 × 1 g/d Ocean Nutrition capsules: 55% fish oils EPA:DHA 33%:22%) and SVG no‐touch harvest Arm 4: placebo and SVG no‐touch harvest |
| Outcomes | Primary: proportion of grafts occluded Secondary: significant stenosis, adverse SVG harvesting events, composite outcome of all‐cause mortality, non‐fatal MI and repeat revascularisation |
| Starting date | Registered on trials registry: 12 January 2010 Study start date: July 2011 Estimated study completion date: December 2016 |
| Contact information | Stephen Fremes, Sunnybrook Health Sciences Centre (PI) |
| Notes | NCT01047449 |
| Trial name or title | Effect of PUFA on vascular healing process in hypercholesterolemic patients with ACS |
| Methods | RCT |
| Participants | Hypercholesterolemic patients (20‐80 years) with acute coronary syndrome who have received successful OCT‐guided PCI (optical coherence tomography‐guided percutaneous coronary intervention) |
| Interventions | Each for 12 months: Arm 1: intensive lipid lowering therapy with both statin and EPA + DHA Arm 2: intensive lipid lowering therapy with both statin and EPA Arm 3: standard lipid lowering therapy with statins |
| Outcomes | Primary: changes in OCT parameter Secondary: lipids, serum plasma profile, inflammatory parameters, adverse cardiovascular events |
| Starting date | Registered on trials registry: 1 February 2014 Study start date: 1 February 2014 Estimated study completion date: 30 June 2019 |
| Contact information | Shiro Uemura (PI), Nara Medical University, Japan, suemura@naramed‐u.ac.jp |
| Notes | UMIN000012825 |
| Trial name or title | VITamin D and omegA‐3 triaL (VITAL) |
| Methods | RCT |
| Participants | Multi‐ethnic population of > 25,000 apparently healthy adults (men 50 years plus, women 55 years plus) without cancer or CVD at baseline |
| Interventions | Each for mean 5 years: Arm 1: omega‐3 (Omacor fish oil, EPA + DHA 1 g/d: 465 mg EPA; 375 mg DHA) and placebo Arm 2: placebo and vitamin D3 (1/d, 2,000IU) Arm 3: omega‐3 (Omacor fish oil, EPA + DHA 1 g/d: 465 mg EPA; 375 mg DHA) and vitamin D3 (1/d, 2000 IU) Arm 4: placebo and placebo |
| Outcomes | Primary: reduction in risk for total cancer and CVD events (a composite of MI, stroke, and cardiovascular mortality) Secondary: lowered risk for expanded composite cardiovascular endpoint (MI, stroke, cardiovascular mortality, coronary revascularisation), the individual components of the primary endpoint, site specific cancers, mortality, diabetes, hypertension, cognitive decline, autoimmune conditions, infections, chronic respiratory disease, depression, bone health, fractures, chronic knee pain, body composition, physical disability, falls, plasma biomarker measures |
| Starting date | Registered on trials registry: 13 January 2010 Study start date: July 2010 Estimated study completion date: December 2017 |
| Contact information | JoAnn Manson or Julie Buring (PIs), Brigham and Women's Hospital, Boston and Harvard School of Public Health, Boston, [email protected] |
| Notes | NCT01169259 |
ACS: acute coronary syndrome; AD: Alzheimer's disease; AF: atrial fibrillation; BMI: body mass index; BMI: body mass index; CABG: coronary artery bypass graft; CETP: cholesteryl ester transfer protein; CHD: coronary heart disease; CVD: cardiovascular disease; DHA: docosahexaenoic acid; EPA: eicosapentaenoic acid; GAD‐7: generalised anxiety disorder 7; HbA1c: glycated haemoglobin; HDL: high‐density lipoprotein; IFG: impaired fasting glucose; IGT: impaired glucose tolerance; IL: interleukin; LDL: low‐density lipoprotein; MACE: major adverse coronary event; MI: myocardial infarction; MRI: magentic resonance imaging; OCT: optical coherence tomography; OSDI: ocular surface disease index; PCI: percutaneous coronary intervention; PHQ‐9: patient health questionnaire 9; PI: principal investigator; PSA: prostate specific antigen; PSQI: Pittsburgh Sleep Quality Index; PUFA: poly‐unsaturated fatty acids; RCT: randomised controlled trial; RCT: randomised controlled trial; SFA: saturated fatty acids; SVG: saphenous vein graft.
Data and analyses
| Outcome or subgroup title | No. of studies | No. of participants | Statistical method | Effect size |
| 1 All‐cause mortality (overall) ‐ LCn3 Show forest plot | 39 | 92653 | Risk Ratio (M‐H, Random, 95% CI) | 0.98 [0.93, 1.03] |
| Analysis 1.1  Comparison 1 High vs low LCn3 omega‐3 fats (primary outcomes), Outcome 1 All‐cause mortality (overall) ‐ LCn3. | ||||
| 2 All‐cause mortality ‐ LCn3 ‐ sensitivity analysis (SA) fixed‐effect Show forest plot | 39 | 90244 | Risk Ratio (M‐H, Fixed, 95% CI) | 0.97 [0.93, 1.01] |
| Analysis 1.2  Comparison 1 High vs low LCn3 omega‐3 fats (primary outcomes), Outcome 2 All‐cause mortality ‐ LCn3 ‐ sensitivity analysis (SA) fixed‐effect. | ||||
| 3 All‐cause mortality ‐ LCn3 ‐ SA by summary risk of bias Show forest plot | 39 | 92653 | Risk Ratio (M‐H, Random, 95% CI) | 0.98 [0.93, 1.03] |
| Analysis 1.3  Comparison 1 High vs low LCn3 omega‐3 fats (primary outcomes), Outcome 3 All‐cause mortality ‐ LCn3 ‐ SA by summary risk of bias. | ||||
| 3.1 Low risk of bias | 15 | 33146 | Risk Ratio (M‐H, Random, 95% CI) | 1.01 [0.94, 1.08] |
| 3.2 Moderate/high risk of bias | 24 | 59507 | Risk Ratio (M‐H, Random, 95% CI) | 0.94 [0.86, 1.03] |
| 4 All‐cause mortality ‐ LCn3 ‐ SA by compliance and study size Show forest plot | 38 | Risk Ratio (M‐H, Random, 95% CI) | Subtotals only | |
| Analysis 1.4  Comparison 1 High vs low LCn3 omega‐3 fats (primary outcomes), Outcome 4 All‐cause mortality ‐ LCn3 ‐ SA by compliance and study size. | ||||
| 4.1 SA ‐ low risk of compliance bias | 18 | 15654 | Risk Ratio (M‐H, Random, 95% CI) | 0.99 [0.86, 1.14] |
| 4.2 SA ‐ 100+ randomised | 35 | 92397 | Risk Ratio (M‐H, Random, 95% CI) | 0.98 [0.93, 1.03] |
| 5 All‐cause mortality ‐ LCn3 ‐ subgroup by dose Show forest plot | 39 | 92653 | Risk Ratio (M‐H, Random, 95% CI) | 0.98 [0.93, 1.03] |
| Analysis 1.5  Comparison 1 High vs low LCn3 omega‐3 fats (primary outcomes), Outcome 5 All‐cause mortality ‐ LCn3 ‐ subgroup by dose. | ||||
| 5.1 LCn3 ≤150 mg/d | 0 | 0 | Risk Ratio (M‐H, Random, 95% CI) | 0.0 [0.0, 0.0] |
| 5.2 LCn3 > 150 ≤ 250 mg/d | 1 | 407 | Risk Ratio (M‐H, Random, 95% CI) | 0.77 [0.27, 2.18] |
| 5.3 LCn3 > 250 ≤400 mg/d | 1 | 2033 | Risk Ratio (M‐H, Random, 95% CI) | 0.72 [0.56, 0.92] |
| 5.4 LCn3 > 400 ≤ 2400 mg/d | 28 | 87445 | Risk Ratio (M‐H, Random, 95% CI) | 0.99 [0.93, 1.05] |
| 5.5 LCn3 > 2.4 ≤ 4.4 g/d | 7 | 2486 | Risk Ratio (M‐H, Random, 95% CI) | 1.06 [0.67, 1.70] |
| 5.6 LCn3 > 4.4 g/d | 2 | 282 | Risk Ratio (M‐H, Random, 95% CI) | 0.33 [0.03, 3.08] |
| 6 All‐cause mortality ‐ LCn3 ‐ subgroup by replacement Show forest plot | 39 | Risk Ratio (M‐H, Random, 95% CI) | Subtotals only | |
| Analysis 1.6  Comparison 1 High vs low LCn3 omega‐3 fats (primary outcomes), Outcome 6 All‐cause mortality ‐ LCn3 ‐ subgroup by replacement. | ||||
| 6.1 LCn3 replacing SFA | 5 | 3279 | Risk Ratio (M‐H, Random, 95% CI) | 0.72 [0.56, 0.92] |
| 6.2 LCn3 replacing MUFA | 15 | 46176 | Risk Ratio (M‐H, Random, 95% CI) | 0.96 [0.90, 1.02] |
| 6.3 LCn3 replacing N‐6 | 9 | 2806 | Risk Ratio (M‐H, Random, 95% CI) | 0.74 [0.51, 1.09] |
| 6.4 LCn3 replacing CHO | 1 | 281 | Risk Ratio (M‐H, Random, 95% CI) | 0.52 [0.05, 5.65] |
| 6.5 LCn3 replacing nil/low n‐3 placebo | 10 | 39601 | Risk Ratio (M‐H, Random, 95% CI) | 0.99 [0.86, 1.14] |
| 6.6 LCn3 replacement unclear | 3 | 3593 | Risk Ratio (M‐H, Random, 95% CI) | 0.91 [0.46, 1.79] |
| 7 All‐cause mortality ‐ LCn3 ‐ subgroup by intervention type Show forest plot | 39 | 92653 | Risk Ratio (M‐H, Random, 95% CI) | 0.98 [0.93, 1.03] |
| Analysis 1.7  Comparison 1 High vs low LCn3 omega‐3 fats (primary outcomes), Outcome 7 All‐cause mortality ‐ LCn3 ‐ subgroup by intervention type. | ||||
| 7.1 Dietary advice | 3 | 5554 | Risk Ratio (M‐H, Random, 95% CI) | 0.90 [0.60, 1.35] |
| 7.2 Supplemental foods | 2 | 5039 | Risk Ratio (M‐H, Random, 95% CI) | 1.02 [0.84, 1.24] |
| 7.3 Supplements (capsule) | 33 | 81855 | Risk Ratio (M‐H, Random, 95% CI) | 0.97 [0.92, 1.01] |
| 7.4 Any combination | 1 | 205 | Risk Ratio (M‐H, Random, 95% CI) | 0.65 [0.11, 3.79] |
| 8 All‐cause mortality ‐ LCn3 ‐ subgroup by duration Show forest plot | 39 | 92653 | Risk Ratio (M‐H, Random, 95% CI) | 0.98 [0.93, 1.03] |
| Analysis 1.8  Comparison 1 High vs low LCn3 omega‐3 fats (primary outcomes), Outcome 8 All‐cause mortality ‐ LCn3 ‐ subgroup by duration. | ||||
| 8.1 Medium duration 1 to < 2 years in study | 18 | 9737 | Risk Ratio (M‐H, Random, 95% CI) | 1.03 [0.82, 1.30] |
| 8.2 Medium‐long duration: 2 to < 4 years in study | 14 | 29234 | Risk Ratio (M‐H, Random, 95% CI) | 0.91 [0.86, 0.96] |
| 8.3 Long duration: ≥ 4 years in study | 7 | 53682 | Risk Ratio (M‐H, Random, 95% CI) | 1.03 [0.98, 1.09] |
| 9 All‐cause mortality ‐ LCn3 ‐ subgroup by primary or secondary prevention Show forest plot | 39 | 92653 | Risk Ratio (M‐H, Random, 95% CI) | 0.98 [0.93, 1.03] |
| Analysis 1.9  Comparison 1 High vs low LCn3 omega‐3 fats (primary outcomes), Outcome 9 All‐cause mortality ‐ LCn3 ‐ subgroup by primary or secondary prevention. | ||||
| 9.1 Primary CVD prevention | 17 | 41202 | Risk Ratio (M‐H, Random, 95% CI) | 1.01 [0.94, 1.08] |
| 9.2 Secondary CVD prevention | 22 | 51451 | Risk Ratio (M‐H, Random, 95% CI) | 0.95 [0.88, 1.04] |
| 10 All‐cause mortality ‐ LCn3 ‐ subgroup by statin use Show forest plot | 39 | 90244 | Risk Ratio (M‐H, Random, 95% CI) | 0.98 [0.92, 1.03] |
| Analysis 1.10  Comparison 1 High vs low LCn3 omega‐3 fats (primary outcomes), Outcome 10 All‐cause mortality ‐ LCn3 ‐ subgroup by statin use. | ||||
| 10.1 LCn3 ‐ ≥50% of control group on statins | 8 | 40500 | Risk Ratio (M‐H, Random, 95% CI) | 1.02 [0.93, 1.11] |
| 10.2 LCn3 ‐ < 50% of control group on statins | 26 | 46604 | Risk Ratio (M‐H, Random, 95% CI) | 0.95 [0.88, 1.03] |
| 10.3 LCn3 ‐ use of statins unclear | 5 | 3140 | Risk Ratio (M‐H, Random, 95% CI) | 0.97 [0.58, 1.63] |
| 11 Cardiovascular mortality (overall) ‐ LCn3 Show forest plot | 25 | 67772 | Risk Ratio (M‐H, Random, 95% CI) | 0.95 [0.87, 1.03] |
| Analysis 1.11  Comparison 1 High vs low LCn3 omega‐3 fats (primary outcomes), Outcome 11 Cardiovascular mortality (overall) ‐ LCn3. | ||||
| 12 CVD mortality ‐ LCn3 ‐ SA fixed‐effect Show forest plot | 25 | 67772 | Risk Ratio (M‐H, Fixed, 95% CI) | 0.94 [0.89, 1.00] |
| Analysis 1.12  Comparison 1 High vs low LCn3 omega‐3 fats (primary outcomes), Outcome 12 CVD mortality ‐ LCn3 ‐ SA fixed‐effect. | ||||
| 13 CVD mortality ‐ LCn3 ‐ SA by summary risk of bias Show forest plot | 25 | 67772 | Risk Ratio (M‐H, Random, 95% CI) | 0.95 [0.87, 1.03] |
| Analysis 1.13  Comparison 1 High vs low LCn3 omega‐3 fats (primary outcomes), Outcome 13 CVD mortality ‐ LCn3 ‐ SA by summary risk of bias. | ||||
| 13.1 Low risk of bias | 9 | 29133 | Risk Ratio (M‐H, Random, 95% CI) | 0.99 [0.90, 1.09] |
| 13.2 Moderate/high risk of bias | 16 | 38639 | Risk Ratio (M‐H, Random, 95% CI) | 0.92 [0.80, 1.05] |
| 14 CVD mortality ‐ LCn3 ‐ SA by compliance and study size Show forest plot | 24 | Risk Ratio (M‐H, Random, 95% CI) | Subtotals only | |
| Analysis 1.14  Comparison 1 High vs low LCn3 omega‐3 fats (primary outcomes), Outcome 14 CVD mortality ‐ LCn3 ‐ SA by compliance and study size. | ||||
| 14.1 SA ‐ low risk of compliance bias | 12 | 13244 | Risk Ratio (M‐H, Random, 95% CI) | 1.00 [0.82, 1.23] |
| 14.2 SA ‐ 100+ randomised | 21 | 67516 | Risk Ratio (M‐H, Random, 95% CI) | 0.95 [0.87, 1.04] |
| 15 CVD mortality ‐ LCn3 ‐ subgroup by dose Show forest plot | 26 | 67873 | Risk Ratio (M‐H, Random, 95% CI) | 0.95 [0.87, 1.03] |
| Analysis 1.15  Comparison 1 High vs low LCn3 omega‐3 fats (primary outcomes), Outcome 15 CVD mortality ‐ LCn3 ‐ subgroup by dose. | ||||
| 15.1 LCn3 ≤ 150 mg/d | 0 | 0 | Risk Ratio (M‐H, Random, 95% CI) | 0.0 [0.0, 0.0] |
| 15.2 LCn3 > 150 ≤ 250 mg/d | 0 | 0 | Risk Ratio (M‐H, Random, 95% CI) | 0.0 [0.0, 0.0] |
| 15.3 LCn3 > 250 ≤ 400 mg/d | 1 | 2033 | Risk Ratio (M‐H, Random, 95% CI) | 0.70 [0.53, 0.91] |
| 15.4 LCn3 > 400 ≤ 2400 mg/d | 19 | 64126 | Risk Ratio (M‐H, Random, 95% CI) | 0.97 [0.89, 1.06] |
| 15.5 LCn3 > 2.4 ≤ 4.4 g/d | 4 | 1432 | Risk Ratio (M‐H, Random, 95% CI) | 1.01 [0.58, 1.77] |
| 15.6 LCn3 > 4.4 g/d | 2 | 282 | Risk Ratio (M‐H, Random, 95% CI) | 0.33 [0.03, 3.08] |
| 16 CVD mortality ‐ LCn3 ‐ subgroup by replacement Show forest plot | 26 | Risk Ratio (M‐H, Random, 95% CI) | Subtotals only | |
| Analysis 1.16  Comparison 1 High vs low LCn3 omega‐3 fats (primary outcomes), Outcome 16 CVD mortality ‐ LCn3 ‐ subgroup by replacement. | ||||
| 16.1 N‐3 replacing SFA | 3 | 2537 | Risk Ratio (M‐H, Random, 95% CI) | 0.69 [0.53, 0.90] |
| 16.2 N‐3 replacing MUFA | 12 | 44242 | Risk Ratio (M‐H, Random, 95% CI) | 0.94 [0.86, 1.04] |
| 16.3 N‐3 replacing N‐6 | 4 | 1435 | Risk Ratio (M‐H, Random, 95% CI) | 0.69 [0.41, 1.19] |
| 16.4 N‐3 replacing carbohydrates/sugars | 1 | 281 | Risk Ratio (M‐H, Random, 95% CI) | 0.69 [0.12, 4.07] |
| 16.5 N‐3 replacing nil/low n‐3 placebo | 8 | 19275 | Risk Ratio (M‐H, Random, 95% CI) | 0.84 [0.73, 0.96] |
| 16.6 Replacement unclear | 2 | 3186 | Risk Ratio (M‐H, Random, 95% CI) | 0.54 [0.05, 5.77] |
| 17 CVD mortality ‐ LCn3 ‐ subgroup by intervention type Show forest plot | 25 | 67772 | Risk Ratio (M‐H, Random, 95% CI) | 0.95 [0.87, 1.03] |
| Analysis 1.17  Comparison 1 High vs low LCn3 omega‐3 fats (primary outcomes), Outcome 17 CVD mortality ‐ LCn3 ‐ subgroup by intervention type. | ||||
| 17.1 Dietary advice | 2 | 5147 | Risk Ratio (M‐H, Random, 95% CI) | 0.95 [0.52, 1.71] |
| 17.2 Supplemental foods | 2 | 5039 | Risk Ratio (M‐H, Random, 95% CI) | 0.98 [0.72, 1.32] |
| 17.3 Supplements (capsule) | 21 | 57586 | Risk Ratio (M‐H, Random, 95% CI) | 0.94 [0.88, 0.99] |
| 17.4 Any combination | 0 | 0 | Risk Ratio (M‐H, Random, 95% CI) | 0.0 [0.0, 0.0] |
| 18 CVD mortality ‐ LCn3 ‐ subgroup by duration Show forest plot | 25 | 67772 | Risk Ratio (M‐H, Random, 95% CI) | 0.95 [0.87, 1.03] |
| Analysis 1.18  Comparison 1 High vs low LCn3 omega‐3 fats (primary outcomes), Outcome 18 CVD mortality ‐ LCn3 ‐ subgroup by duration. | ||||
| 18.1 Medium duration 1 to < 2 years in study | 10 | 6177 | Risk Ratio (M‐H, Random, 95% CI) | 0.88 [0.57, 1.36] |
| 18.2 Medium‐long duration: 2 to < 4 years in study | 10 | 26736 | Risk Ratio (M‐H, Random, 95% CI) | 0.89 [0.82, 0.95] |
| 18.3 Long duration: ≥ 4 years in study | 5 | 34859 | Risk Ratio (M‐H, Random, 95% CI) | 1.05 [0.93, 1.18] |
| 19 CVD mortality ‐ LCn3 ‐ subgroup by primary or secondary prevention Show forest plot | 25 | 67772 | Risk Ratio (M‐H, Random, 95% CI) | 0.95 [0.87, 1.03] |
| Analysis 1.19  Comparison 1 High vs low LCn3 omega‐3 fats (primary outcomes), Outcome 19 CVD mortality ‐ LCn3 ‐ subgroup by primary or secondary prevention. | ||||
| 19.1 Primary prevention | 7 | 17931 | Risk Ratio (M‐H, Random, 95% CI) | 0.98 [0.88, 1.09] |
| 19.2 Secondary prevention | 18 | 49841 | Risk Ratio (M‐H, Random, 95% CI) | 0.94 [0.83, 1.06] |
| 20 CVD mortality ‐ LCn3 ‐ subgroup by statin uses Show forest plot | 25 | 67772 | Risk Ratio (M‐H, Random, 95% CI) | 0.95 [0.87, 1.03] |
| Analysis 1.20  Comparison 1 High vs low LCn3 omega‐3 fats (primary outcomes), Outcome 20 CVD mortality ‐ LCn3 ‐ subgroup by statin uses. | ||||
| 20.1 LCn3 ‐ ≥ 50% of control group on statins | 6 | 23994 | Risk Ratio (M‐H, Random, 95% CI) | 0.99 [0.90, 1.10] |
| 20.2 LCn3 ‐ < 50% of control group on statins | 17 | 43425 | Risk Ratio (M‐H, Random, 95% CI) | 0.92 [0.82, 1.04] |
| 20.3 LCn3‐ Use of statins unclear | 2 | 353 | Risk Ratio (M‐H, Random, 95% CI) | 0.36 [0.06, 2.30] |
| 21 Cardiovascular events (overall) ‐ LCn3 Show forest plot | 38 | 90378 | Risk Ratio (M‐H, Random, 95% CI) | 0.99 [0.94, 1.04] |
| Analysis 1.21  Comparison 1 High vs low LCn3 omega‐3 fats (primary outcomes), Outcome 21 Cardiovascular events (overall) ‐ LCn3. | ||||
| 22 CVD events ‐ LCn3 ‐ SA fixed‐effect Show forest plot | 38 | 90378 | Risk Ratio (M‐H, Fixed, 95% CI) | 0.98 [0.95, 1.00] |
| Analysis 1.22  Comparison 1 High vs low LCn3 omega‐3 fats (primary outcomes), Outcome 22 CVD events ‐ LCn3 ‐ SA fixed‐effect. | ||||
| 23 CVD events ‐ LCn3 ‐ SA by summary risk of bias Show forest plot | 38 | 90378 | Risk Ratio (M‐H, Random, 95% CI) | 0.99 [0.94, 1.04] |
| Analysis 1.23  Comparison 1 High vs low LCn3 omega‐3 fats (primary outcomes), Outcome 23 CVD events ‐ LCn3 ‐ SA by summary risk of bias. | ||||
| 23.1 Low risk of bias | 14 | 31649 | Risk Ratio (M‐H, Random, 95% CI) | 1.00 [0.96, 1.05] |
| 23.2 Moderate/high risk of bias | 24 | 58729 | Risk Ratio (M‐H, Random, 95% CI) | 0.95 [0.87, 1.03] |
| 24 CVD events ‐ LCn3 ‐ SA by compliance and study size Show forest plot | 37 | Risk Ratio (M‐H, Random, 95% CI) | Subtotals only | |
| Analysis 1.24  Comparison 1 High vs low LCn3 omega‐3 fats (primary outcomes), Outcome 24 CVD events ‐ LCn3 ‐ SA by compliance and study size. | ||||
| 24.1 SA ‐ low risk of compliance bias | 16 | 13649 | Risk Ratio (M‐H, Random, 95% CI) | 0.98 [0.84, 1.14] |
| 24.2 SA ‐ 100+ randomised | 33 | 90058 | Risk Ratio (M‐H, Random, 95% CI) | 0.99 [0.94, 1.04] |
| 25 CVD events ‐ LCn3 ‐ subgroup by dose Show forest plot | 38 | 90453 | Risk Ratio (M‐H, Random, 95% CI) | 0.99 [0.94, 1.04] |
| Analysis 1.25  Comparison 1 High vs low LCn3 omega‐3 fats (primary outcomes), Outcome 25 CVD events ‐ LCn3 ‐ subgroup by dose. | ||||
| 25.1 LCn3 ≤ 150 mg/d | 0 | 0 | Risk Ratio (M‐H, Random, 95% CI) | 0.0 [0.0, 0.0] |
| 25.2 LCn3 > 150 ≤ 250 mg/d | 0 | 0 | Risk Ratio (M‐H, Random, 95% CI) | 0.0 [0.0, 0.0] |
| 25.3 LCn3 > 250 ≤ 400 mg/d | 1 | 2033 | Risk Ratio (M‐H, Random, 95% CI) | 0.96 [0.88, 1.05] |
| 25.4 LCn3 > 400 ≤ 2400 mg/d | 28 | 85818 | Risk Ratio (M‐H, Random, 95% CI) | 0.99 [0.93, 1.05] |
| 25.5 LCn3 > 2.4 ≤ 4.4 g/d | 7 | 2180 | Risk Ratio (M‐H, Random, 95% CI) | 0.98 [0.75, 1.28] |
| 25.6 LCn3 > 4.4 g/d | 3 | 422 | Risk Ratio (M‐H, Random, 95% CI) | 1.09 [0.65, 1.81] |
| 26 CVD events ‐ LCn3 ‐ subgroup by replacement Show forest plot | 38 | Risk Ratio (M‐H, Random, 95% CI) | Subtotals only | |
| Analysis 1.26  Comparison 1 High vs low LCn3 omega‐3 fats (primary outcomes), Outcome 26 CVD events ‐ LCn3 ‐ subgroup by replacement. | ||||
| 26.1 N‐3 replacing SFA | 4 | 2888 | Risk Ratio (M‐H, Random, 95% CI) | 0.95 [0.87, 1.04] |
| 26.2 N‐3 replacing MUFA | 16 | 45065 | Risk Ratio (M‐H, Random, 95% CI) | 0.98 [0.94, 1.02] |
| 26.3 N‐3 replacing n‐6 | 6 | 1891 | Risk Ratio (M‐H, Random, 95% CI) | 1.10 [0.90, 1.35] |
| 26.4 N‐3 replacing carbohydrates/sugars | 1 | 258 | Risk Ratio (M‐H, Random, 95% CI) | 0.68 [0.12, 3.98] |
| 26.5 N‐3 replacing nil/low n‐3 placebo | 12 | 39907 | Risk Ratio (M‐H, Random, 95% CI) | 0.95 [0.85, 1.07] |
| 26.6 Replacement unclear | 3 | 3429 | Risk Ratio (M‐H, Random, 95% CI) | 0.58 [0.16, 2.07] |
| 27 CVD events ‐ LCn3 ‐ subgroup by intervention type Show forest plot | 38 | 90378 | Risk Ratio (M‐H, Random, 95% CI) | 0.99 [0.94, 1.04] |
| Analysis 1.27  Comparison 1 High vs low LCn3 omega‐3 fats (primary outcomes), Outcome 27 CVD events ‐ LCn3 ‐ subgroup by intervention type. | ||||
| 27.1 Dietary advice | 3 | 5248 | Risk Ratio (M‐H, Random, 95% CI) | 1.13 [0.86, 1.49] |
| 27.2 Supplemental foods | 2 | 5039 | Risk Ratio (M‐H, Random, 95% CI) | 1.02 [0.89, 1.17] |
| 27.3 Supplements (capsule) | 33 | 80091 | Risk Ratio (M‐H, Random, 95% CI) | 0.97 [0.91, 1.02] |
| 27.4 Any combination | 0 | 0 | Risk Ratio (M‐H, Random, 95% CI) | 0.0 [0.0, 0.0] |
| 28 CVD events ‐ LCn3 ‐ subgroup by duration Show forest plot | 38 | 90378 | Risk Ratio (M‐H, Random, 95% CI) | 0.99 [0.94, 1.04] |
| Analysis 1.28  Comparison 1 High vs low LCn3 omega‐3 fats (primary outcomes), Outcome 28 CVD events ‐ LCn3 ‐ subgroup by duration. | ||||
| 28.1 Medium duration 1 to < 2 years in study | 18 | 8107 | Risk Ratio (M‐H, Random, 95% CI) | 0.89 [0.68, 1.16] |
| 28.2 Medium‐long duration: 2 to < 4 years in study | 14 | 28767 | Risk Ratio (M‐H, Random, 95% CI) | 0.97 [0.93, 1.01] |
| 28.3 Long duration: ≥ 4 years in study | 6 | 53504 | Risk Ratio (M‐H, Random, 95% CI) | 0.99 [0.91, 1.08] |
| 29 CVD events ‐ LCn3 ‐ subgroup by primary or secondary prevention Show forest plot | 38 | 90378 | Risk Ratio (M‐H, Random, 95% CI) | 0.99 [0.94, 1.04] |
| Analysis 1.29  Comparison 1 High vs low LCn3 omega‐3 fats (primary outcomes), Outcome 29 CVD events ‐ LCn3 ‐ subgroup by primary or secondary prevention. | ||||
| 29.1 Primary prevention of CVD | 16 | 39751 | Risk Ratio (M‐H, Random, 95% CI) | 0.97 [0.89, 1.05] |
| 29.2 Secondary prevention | 22 | 50627 | Risk Ratio (M‐H, Random, 95% CI) | 1.00 [0.93, 1.07] |
| 30 CVD events ‐ LCn3 ‐ subgroup by statin use Show forest plot | 38 | 90378 | Risk Ratio (M‐H, Random, 95% CI) | 0.99 [0.94, 1.04] |
| Analysis 1.30  Comparison 1 High vs low LCn3 omega‐3 fats (primary outcomes), Outcome 30 CVD events ‐ LCn3 ‐ subgroup by statin use. | ||||
| 30.1 LCn3 ‐ ≥ 50% of control group on statins | 8 | 42389 | Risk Ratio (M‐H, Random, 95% CI) | 0.98 [0.89, 1.08] |
| 30.2 LCn3 ‐ < 50% of control group on statins | 24 | 45160 | Risk Ratio (M‐H, Random, 95% CI) | 0.98 [0.91, 1.04] |
| 30.3 LCn3 ‐ use of statins unclear | 6 | 2829 | Risk Ratio (M‐H, Random, 95% CI) | 0.93 [0.53, 1.63] |
| 31 Coronary heart disease mortality (overall) ‐ LCn3 Show forest plot | 21 | 73491 | Risk Ratio (M‐H, Random, 95% CI) | 0.93 [0.79, 1.09] |
| Analysis 1.31  Comparison 1 High vs low LCn3 omega‐3 fats (primary outcomes), Outcome 31 Coronary heart disease mortality (overall) ‐ LCn3. | ||||
| 32 CHD mortality ‐ LCn3 ‐ SA fixed‐effect Show forest plot | 21 | 73491 | Risk Ratio (M‐H, Fixed, 95% CI) | 0.94 [0.85, 1.03] |
| Analysis 1.32  Comparison 1 High vs low LCn3 omega‐3 fats (primary outcomes), Outcome 32 CHD mortality ‐ LCn3 ‐ SA fixed‐effect. | ||||
| 33 CHD mortality ‐ LCn3 ‐ SA by summary risk of bias Show forest plot | 21 | 73491 | Risk Ratio (M‐H, Random, 95% CI) | 0.93 [0.79, 1.09] |
| Analysis 1.33  Comparison 1 High vs low LCn3 omega‐3 fats (primary outcomes), Outcome 33 CHD mortality ‐ LCn3 ‐ SA by summary risk of bias. | ||||
| 33.1 Low risk of bias | 7 | 16372 | Risk Ratio (M‐H, Random, 95% CI) | 1.00 [0.72, 1.37] |
| 33.2 Moderate/high risk of bias | 14 | 57119 | Risk Ratio (M‐H, Random, 95% CI) | 0.91 [0.75, 1.10] |
| 34 CHD mortality ‐ LCn3 ‐ SA by compliance and study size Show forest plot | 21 | Risk Ratio (M‐H, Random, 95% CI) | Subtotals only | |
| Analysis 1.34  Comparison 1 High vs low LCn3 omega‐3 fats (primary outcomes), Outcome 34 CHD mortality ‐ LCn3 ‐ SA by compliance and study size. | ||||
| 34.1 SA ‐ low risk of compliance bias | 9 | 12938 | Risk Ratio (M‐H, Random, 95% CI) | 1.05 [0.83, 1.32] |
| 34.2 SA ‐ 100+ randomised | 20 | 73411 | Risk Ratio (M‐H, Random, 95% CI) | 0.93 [0.79, 1.09] |
| 35 CHD mortality ‐ LCn3 ‐ SA omitting cardiac death Show forest plot | 16 | 65325 | Risk Ratio (M‐H, Random, 95% CI) | 0.83 [0.74, 0.94] |
| Analysis 1.35  Comparison 1 High vs low LCn3 omega‐3 fats (primary outcomes), Outcome 35 CHD mortality ‐ LCn3 ‐ SA omitting cardiac death. | ||||
| 35.1 Low risk of bias | 5 | 12022 | Risk Ratio (M‐H, Random, 95% CI) | 0.95 [0.69, 1.30] |
| 35.2 Moderate/high risk of bias | 11 | 53303 | Risk Ratio (M‐H, Random, 95% CI) | 0.82 [0.72, 0.94] |
| 36 CHD mortality ‐ LCn3 ‐ subgroup by dose Show forest plot | 21 | 73491 | Risk Ratio (M‐H, Random, 95% CI) | 0.93 [0.79, 1.09] |
| Analysis 1.36  Comparison 1 High vs low LCn3 omega‐3 fats (primary outcomes), Outcome 36 CHD mortality ‐ LCn3 ‐ subgroup by dose. | ||||
| 36.1 LCn3 ≤ 150 mg/d | 0 | 0 | Risk Ratio (M‐H, Random, 95% CI) | 0.0 [0.0, 0.0] |
| 36.2 LCn3 > 150 ≤ 250 mg/d | 0 | 0 | Risk Ratio (M‐H, Random, 95% CI) | 0.0 [0.0, 0.0] |
| 36.3 LCn3 > 250 ≤ 400 mg/d | 2 | 5147 | Risk Ratio (M‐H, Random, 95% CI) | 0.93 [0.50, 1.74] |
| 36.4 LCn3 > 400 ≤ 2400 mg/d | 15 | 67442 | Risk Ratio (M‐H, Random, 95% CI) | 0.92 [0.80, 1.07] |
| 36.5 LCn3 > 2.4 ≤ 4.4 g/d | 3 | 822 | Risk Ratio (M‐H, Random, 95% CI) | 0.93 [0.49, 1.78] |
| 36.6 LCn3 > 4.4 g/d | 1 | 80 | Risk Ratio (M‐H, Random, 95% CI) | 0.32 [0.01, 7.57] |
| 37 CHD mortality ‐ LCn3 ‐ subgroup by replacement Show forest plot | 21 | Risk Ratio (M‐H, Random, 95% CI) | Subtotals only | |
| Analysis 1.37  Comparison 1 High vs low LCn3 omega‐3 fats (primary outcomes), Outcome 37 CHD mortality ‐ LCn3 ‐ subgroup by replacement. | ||||
| 37.1 N‐3 replacing SFA | 3 | 2514 | Risk Ratio (M‐H, Random, 95% CI) | 0.67 [0.51, 0.88] |
| 37.2 N‐3 replacing MUFA | 10 | 31605 | Risk Ratio (M‐H, Random, 95% CI) | 0.89 [0.72, 1.10] |
| 37.3 N‐3 replacing n‐6 | 3 | 1409 | Risk Ratio (M‐H, Random, 95% CI) | 0.64 [0.33, 1.24] |
| 37.4 N‐3 replacing carbohydrates/sugars | 1 | 258 | Risk Ratio (M‐H, Random, 95% CI) | 0.34 [0.01, 8.23] |
| 37.5 N‐3 replacing nil/low n‐3 placebo | 7 | 37651 | Risk Ratio (M‐H, Random, 95% CI) | 0.83 [0.70, 0.97] |
| 37.6 Replacement unclear | 1 | 3114 | Risk Ratio (M‐H, Random, 95% CI) | 1.27 [1.03, 1.57] |
| 38 CHD mortality ‐ LCn3 ‐ subgroup by intervention type Show forest plot | 21 | 73491 | Risk Ratio (M‐H, Random, 95% CI) | 0.93 [0.79, 1.09] |
| Analysis 1.38  Comparison 1 High vs low LCn3 omega‐3 fats (primary outcomes), Outcome 38 CHD mortality ‐ LCn3 ‐ subgroup by intervention type. | ||||
| 38.1 Dietary advice | 2 | 5147 | Risk Ratio (M‐H, Random, 95% CI) | 0.93 [0.50, 1.74] |
| 38.2 Supplemental foods | 1 | 4837 | Risk Ratio (M‐H, Random, 95% CI) | 0.96 [0.69, 1.33] |
| 38.3 Supplements (capsule) | 18 | 63507 | Risk Ratio (M‐H, Random, 95% CI) | 0.90 [0.79, 1.02] |
| 38.4 Any combination | 0 | 0 | Risk Ratio (M‐H, Random, 95% CI) | 0.0 [0.0, 0.0] |
| 39 CHD mortality ‐ LCn3 ‐ subgroup by duration Show forest plot | 21 | 73491 | Risk Ratio (M‐H, Random, 95% CI) | 0.93 [0.79, 1.09] |
| Analysis 1.39  Comparison 1 High vs low LCn3 omega‐3 fats (primary outcomes), Outcome 39 CHD mortality ‐ LCn3 ‐ subgroup by duration. | ||||
| 39.1 Medium duration 1 to < 2 years in study | 7 | 5978 | Risk Ratio (M‐H, Random, 95% CI) | 0.96 [0.62, 1.50] |
| 39.2 Medium‐long duration: 2 to < 4 years in study | 9 | 26545 | Risk Ratio (M‐H, Random, 95% CI) | 0.79 [0.69, 0.90] |
| 39.3 Long duration: ≥ 4 years in study | 5 | 40968 | Risk Ratio (M‐H, Random, 95% CI) | 1.18 [1.00, 1.39] |
| 40 CHD mortality ‐ LCn3 ‐ subgroup by primary or secondary prevention Show forest plot | 21 | 73491 | Risk Ratio (M‐H, Random, 95% CI) | 0.93 [0.79, 1.09] |
| Analysis 1.40  Comparison 1 High vs low LCn3 omega‐3 fats (primary outcomes), Outcome 40 CHD mortality ‐ LCn3 ‐ subgroup by primary or secondary prevention. | ||||
| 40.1 Primary prevention of CVD | 5 | 23789 | Risk Ratio (M‐H, Random, 95% CI) | 0.86 [0.46, 1.61] |
| 40.2 Secondary prevention of CVD | 16 | 49702 | Risk Ratio (M‐H, Random, 95% CI) | 0.93 [0.79, 1.11] |
| 41 CHD mortality ‐ LCn3 ‐ subgroup by statin use Show forest plot | 21 | 73491 | Risk Ratio (M‐H, Random, 95% CI) | 0.93 [0.79, 1.09] |
| Analysis 1.41  Comparison 1 High vs low LCn3 omega‐3 fats (primary outcomes), Outcome 41 CHD mortality ‐ LCn3 ‐ subgroup by statin use. | ||||
| 41.1 LCn3 ‐ ≥ 50% of control group on statins | 5 | 30025 | Risk Ratio (M‐H, Random, 95% CI) | 1.05 [0.84, 1.30] |
| 41.2 LCn3 ‐ < 50% of control group on statins | 15 | 43208 | Risk Ratio (M‐H, Random, 95% CI) | 0.89 [0.72, 1.10] |
| 41.3 LCn3 ‐ use of statins unclear | 1 | 258 | Risk Ratio (M‐H, Random, 95% CI) | 0.34 [0.01, 8.23] |
| 42 CHD mortality ‐ LCn3 ‐ subgroup by CAD history Show forest plot | 21 | 73491 | Risk Ratio (M‐H, Random, 95% CI) | 0.93 [0.80, 1.09] |
| Analysis 1.42  Comparison 1 High vs low LCn3 omega‐3 fats (primary outcomes), Outcome 42 CHD mortality ‐ LCn3 ‐ subgroup by CAD history. | ||||
| 42.1 Previous CAD | 11 | 29074 | Risk Ratio (M‐H, Random, 95% CI) | 0.96 [0.77, 1.20] |
| 42.2 No previous CAD | 10 | 44417 | Risk Ratio (M‐H, Random, 95% CI) | 0.93 [0.74, 1.16] |
| 43 Coronary heart disease events (overall) ‐ LCn3 Show forest plot | 28 | 84301 | Risk Ratio (M‐H, Random, 95% CI) | 0.93 [0.88, 0.97] |
| Analysis 1.43  Comparison 1 High vs low LCn3 omega‐3 fats (primary outcomes), Outcome 43 Coronary heart disease events (overall) ‐ LCn3. | ||||
| 44 CHD events ‐ LCn3 ‐ SA fixed‐effect Show forest plot | 28 | 84301 | Risk Ratio (M‐H, Fixed, 95% CI) | 0.93 [0.88, 0.97] |
| Analysis 1.44  Comparison 1 High vs low LCn3 omega‐3 fats (primary outcomes), Outcome 44 CHD events ‐ LCn3 ‐ SA fixed‐effect. | ||||
| 45 CHD events ‐ LCn3 ‐ SA by summary risk of bias Show forest plot | 28 | 84301 | Risk Ratio (M‐H, Random, 95% CI) | 0.93 [0.88, 0.97] |
| Analysis 1.45  Comparison 1 High vs low LCn3 omega‐3 fats (primary outcomes), Outcome 45 CHD events ‐ LCn3 ‐ SA by summary risk of bias. | ||||
| 45.1 Low risk of bias | 12 | 30227 | Risk Ratio (M‐H, Random, 95% CI) | 0.97 [0.90, 1.05] |
| 45.2 Moderate/high risk of bias | 16 | 54074 | Risk Ratio (M‐H, Random, 95% CI) | 0.89 [0.84, 0.95] |
| 46 CHD events ‐ LCn3 ‐ SA by compliance and study size Show forest plot | 27 | Risk Ratio (M‐H, Random, 95% CI) | Subtotals only | |
| Analysis 1.46  Comparison 1 High vs low LCn3 omega‐3 fats (primary outcomes), Outcome 46 CHD events ‐ LCn3 ‐ SA by compliance and study size. | ||||
| 46.1 SA ‐ low risk of compliance bias | 12 | 13447 | Risk Ratio (M‐H, Random, 95% CI) | 0.94 [0.86, 1.02] |
| 46.2 SA ‐ 100+ randomised | 25 | 84084 | Risk Ratio (M‐H, Random, 95% CI) | 0.93 [0.88, 0.98] |
| 47 CHD events ‐ LCn3 ‐ subgroup by dose Show forest plot | 28 | 84376 | Risk Ratio (M‐H, Random, 95% CI) | 0.93 [0.89, 0.98] |
| Analysis 1.47  Comparison 1 High vs low LCn3 omega‐3 fats (primary outcomes), Outcome 47 CHD events ‐ LCn3 ‐ subgroup by dose. | ||||
| 47.1 LCn3 ≤ 150 mg/d | 0 | 0 | Risk Ratio (M‐H, Random, 95% CI) | 0.0 [0.0, 0.0] |
| 47.2 LCn3 > 150 ≤ 250 mg/d | 0 | 0 | Risk Ratio (M‐H, Random, 95% CI) | 0.0 [0.0, 0.0] |
| 47.3 LCn3 > 250 ≤ 400 mg/d | 1 | 2033 | Risk Ratio (M‐H, Random, 95% CI) | 0.92 [0.82, 1.04] |
| 47.4 LCn3 > 400 ≤ 2400 mg/d | 21 | 80730 | Risk Ratio (M‐H, Random, 95% CI) | 0.93 [0.88, 0.98] |
| 47.5 LCn3 > 2.4 ≤ 4.4 g/d | 4 | 1191 | Risk Ratio (M‐H, Random, 95% CI) | 0.90 [0.53, 1.53] |
| 47.6 LCn3 > 4.4 g/d | 3 | 422 | Risk Ratio (M‐H, Random, 95% CI) | 1.00 [0.54, 1.85] |
| 48 CHD events ‐ LCn3 ‐ subgroup by replacement Show forest plot | 28 | Risk Ratio (M‐H, Random, 95% CI) | Subtotals only | |
| Analysis 1.48  Comparison 1 High vs low LCn3 omega‐3 fats (primary outcomes), Outcome 48 CHD events ‐ LCn3 ‐ subgroup by replacement. | ||||
| 48.1 N‐3 replacing SFA | 3 | 2514 | Risk Ratio (M‐H, Random, 95% CI) | 0.53 [0.16, 1.75] |
| 48.2 N‐3 replacing MUFA | 15 | 44954 | Risk Ratio (M‐H, Random, 95% CI) | 0.96 [0.90, 1.01] |
| 48.3 N‐3 replacing n‐6 | 4 | 1549 | Risk Ratio (M‐H, Random, 95% CI) | 1.10 [0.88, 1.39] |
| 48.4 N‐3 replacing carbohydrates/sugars | 1 | 258 | Risk Ratio (M‐H, Random, 95% CI) | 0.11 [0.01, 2.07] |
| 48.5 N‐3 replacing nil/low n‐3 placebo | 8 | 37843 | Risk Ratio (M‐H, Random, 95% CI) | 0.85 [0.78, 0.94] |
| 48.6 Replacement unclear | 1 | 243 | Risk Ratio (M‐H, Random, 95% CI) | 0.89 [0.08, 9.70] |
| 49 CHD events ‐ LCn3 ‐ subgroup by intervention type Show forest plot | 28 | 84301 | Risk Ratio (M‐H, Random, 95% CI) | 0.93 [0.89, 0.98] |
| Analysis 1.49  Comparison 1 High vs low LCn3 omega‐3 fats (primary outcomes), Outcome 49 CHD events ‐ LCn3 ‐ subgroup by intervention type. | ||||
| 49.1 Dietary advice | 2 | 2134 | Risk Ratio (M‐H, Random, 95% CI) | 1.01 [0.67, 1.52] |
| 49.2 Supplemental foods | 2 | 5039 | Risk Ratio (M‐H, Random, 95% CI) | 0.94 [0.75, 1.18] |
| 49.3 Supplements (capsule) | 24 | 77128 | Risk Ratio (M‐H, Random, 95% CI) | 0.93 [0.88, 0.98] |
| 49.4 Any combination | 0 | 0 | Risk Ratio (M‐H, Random, 95% CI) | 0.0 [0.0, 0.0] |
| 50 CHD events ‐ LCn3 ‐ subgroup by duration Show forest plot | 28 | 84301 | Risk Ratio (M‐H, Random, 95% CI) | 0.93 [0.89, 0.98] |
| Analysis 1.50  Comparison 1 High vs low LCn3 omega‐3 fats (primary outcomes), Outcome 50 CHD events ‐ LCn3 ‐ subgroup by duration. | ||||
| 50.1 Medium duration 1 to < 2 years in study | 11 | 7009 | Risk Ratio (M‐H, Random, 95% CI) | 0.94 [0.86, 1.03] |
| 50.2 Medium‐long duration: 2 to < 4 years in study | 12 | 26902 | Risk Ratio (M‐H, Random, 95% CI) | 0.91 [0.84, 0.98] |
| 50.3 Long duration: ≥ 4 years in study | 5 | 50390 | Risk Ratio (M‐H, Random, 95% CI) | 0.95 [0.83, 1.07] |
| 51 CHD events ‐ LCn3 ‐ subgroup by primary or secondary prevention Show forest plot | 28 | 84301 | Risk Ratio (M‐H, Random, 95% CI) | 0.93 [0.89, 0.98] |
| Analysis 1.51  Comparison 1 High vs low LCn3 omega‐3 fats (primary outcomes), Outcome 51 CHD events ‐ LCn3 ‐ subgroup by primary or secondary prevention. | ||||
| 51.1 Primary prevention of CVD | 11 | 37365 | Risk Ratio (M‐H, Random, 95% CI) | 0.94 [0.81, 1.10] |
| 51.2 Secondary prevention of CVD | 17 | 46936 | Risk Ratio (M‐H, Random, 95% CI) | 0.93 [0.88, 0.98] |
| 52 CHD events ‐ LCn3 ‐ subgroup by statin use Show forest plot | 28 | 84301 | Risk Ratio (M‐H, Random, 95% CI) | 0.93 [0.89, 0.98] |
| Analysis 1.52  Comparison 1 High vs low LCn3 omega‐3 fats (primary outcomes), Outcome 52 CHD events ‐ LCn3 ‐ subgroup by statin use. | ||||
| 52.1 LCn3 ‐ ≥ 50% of control group on statins | 8 | 42735 | Risk Ratio (M‐H, Random, 95% CI) | 0.94 [0.85, 1.05] |
| 52.2 LCn3 ‐ < 50% of control group on statins | 17 | 40674 | Risk Ratio (M‐H, Random, 95% CI) | 0.92 [0.86, 0.98] |
| 52.3 LCn3 ‐ use of statins unclear | 3 | 892 | Risk Ratio (M‐H, Random, 95% CI) | 0.65 [0.11, 3.83] |
| 53 CHD events ‐ LCn3 subgroup by CAD history Show forest plot | 28 | 84301 | Risk Ratio (M‐H, Random, 95% CI) | 0.93 [0.88, 0.97] |
| Analysis 1.53  Comparison 1 High vs low LCn3 omega‐3 fats (primary outcomes), Outcome 53 CHD events ‐ LCn3 subgroup by CAD history. | ||||
| 53.1 Previous CAD | 12 | 26124 | Risk Ratio (M‐H, Random, 95% CI) | 0.92 [0.87, 0.98] |
| 53.2 No previous CAD | 16 | 58177 | Risk Ratio (M‐H, Random, 95% CI) | 0.94 [0.86, 1.01] |
| 54 Stroke (overall) ‐ LCn3 Show forest plot | 28 | 89358 | Risk Ratio (M‐H, Random, 95% CI) | 1.06 [0.96, 1.16] |
| Analysis 1.54  Comparison 1 High vs low LCn3 omega‐3 fats (primary outcomes), Outcome 54 Stroke (overall) ‐ LCn3. | ||||
| 55 Stroke ‐ LCn3 ‐ SA fixed‐effect Show forest plot | 28 | 89358 | Risk Ratio (M‐H, Fixed, 95% CI) | 1.06 [0.97, 1.16] |
| Analysis 1.55  Comparison 1 High vs low LCn3 omega‐3 fats (primary outcomes), Outcome 55 Stroke ‐ LCn3 ‐ SA fixed‐effect. | ||||
| 56 Stroke ‐ LCn3 ‐ SA by summary risk of bias Show forest plot | 28 | 89358 | Risk Ratio (M‐H, Random, 95% CI) | 1.06 [0.96, 1.16] |
| Analysis 1.56  Comparison 1 High vs low LCn3 omega‐3 fats (primary outcomes), Outcome 56 Stroke ‐ LCn3 ‐ SA by summary risk of bias. | ||||
| 56.1 Low risk of bias | 12 | 32039 | Risk Ratio (M‐H, Random, 95% CI) | 0.98 [0.86, 1.12] |
| 56.2 Moderate/high risk of bias | 16 | 57319 | Risk Ratio (M‐H, Random, 95% CI) | 1.13 [1.00, 1.29] |
| 57 Stroke ‐ LCn3 ‐ SA by compliance and study size Show forest plot | 27 | Risk Ratio (M‐H, Random, 95% CI) | Subtotals only | |
| Analysis 1.57  Comparison 1 High vs low LCn3 omega‐3 fats (primary outcomes), Outcome 57 Stroke ‐ LCn3 ‐ SA by compliance and study size. | ||||
| 57.1 SA ‐ low risk of compliance bias | 12 | 14451 | Risk Ratio (M‐H, Random, 95% CI) | 1.19 [0.86, 1.65] |
| 57.2 SA ‐ 100+ randomised | 26 | 89231 | Risk Ratio (M‐H, Random, 95% CI) | 1.07 [0.97, 1.18] |
| 58 Stroke ‐ LCn3 ‐ subgroup by stroke type Show forest plot | 13 | Risk Ratio (M‐H, Random, 95% CI) | Subtotals only | |
| Analysis 1.58  Comparison 1 High vs low LCn3 omega‐3 fats (primary outcomes), Outcome 58 Stroke ‐ LCn3 ‐ subgroup by stroke type. | ||||
| 58.1 Ischaemic stroke ‐ LCn3 | 8 | 35040 | Risk Ratio (M‐H, Random, 95% CI) | 1.09 [0.89, 1.33] |
| 58.2 Haemorrhagic stroke ‐ LCn3 | 8 | 36645 | Risk Ratio (M‐H, Random, 95% CI) | 1.20 [0.85, 1.69] |
| 58.3 Transient ischaemic attack (TIA) | 5 | 5032 | Risk Ratio (M‐H, Random, 95% CI) | 0.74 [0.39, 1.39] |
| 59 Stroke ‐ LCn3 ‐ subgroup by dose Show forest plot | 28 | Risk Ratio (M‐H, Random, 95% CI) | Subtotals only | |
| Analysis 1.59  Comparison 1 High vs low LCn3 omega‐3 fats (primary outcomes), Outcome 59 Stroke ‐ LCn3 ‐ subgroup by dose. | ||||
| 59.1 LCn3 ≤ 150 mg/d | 0 | 0 | Risk Ratio (M‐H, Random, 95% CI) | 0.0 [0.0, 0.0] |
| 59.2 LCn3 > 150 ≤ 250 mg/d | 0 | 0 | Risk Ratio (M‐H, Random, 95% CI) | 0.0 [0.0, 0.0] |
| 59.3 LCn3 > 250 ≤ 400 mg/d | 1 | 2033 | Risk Ratio (M‐H, Random, 95% CI) | 0.45 [0.14, 1.44] |
| 59.4 LCn3 > 400 ≤ 2400 mg/d | 24 | 86335 | Risk Ratio (M‐H, Random, 95% CI) | 1.06 [0.97, 1.16] |
| 59.5 LCn3 > 2.4 ≤ 4.4 g/d | 1 | 610 | Risk Ratio (M‐H, Random, 95% CI) | 0.69 [0.16, 3.07] |
| 59.6 LCn3 > 4.4 g/d | 2 | 380 | Risk Ratio (M‐H, Random, 95% CI) | 6.58 [0.78, 55.16] |
| 60 Stroke ‐ LCn3 ‐ subgroup by replacement Show forest plot | 28 | Risk Ratio (M‐H, Random, 95% CI) | Subtotals only | |
| Analysis 1.60  Comparison 1 High vs low LCn3 omega‐3 fats (primary outcomes), Outcome 60 Stroke ‐ LCn3 ‐ subgroup by replacement. | ||||
| 60.1 N‐3 replacing SFA | 3 | 2514 | Risk Ratio (M‐H, Random, 95% CI) | 0.53 [0.19, 1.50] |
| 60.2 N‐3 replacing MUFA | 14 | 45252 | Risk Ratio (M‐H, Random, 95% CI) | 1.11 [0.94, 1.31] |
| 60.3 N‐3 replacing n‐6 | 3 | 1179 | Risk Ratio (M‐H, Random, 95% CI) | 2.08 [0.18, 24.31] |
| 60.4 N‐3 replacing carbohydrates/sugars | 1 | 258 | Risk Ratio (M‐H, Random, 95% CI) | 0.34 [0.01, 8.23] |
| 60.5 N‐3 replacing nil/low n‐3 placebo | 9 | 39555 | Risk Ratio (M‐H, Random, 95% CI) | 1.07 [0.92, 1.24] |
| 60.6 Replacement unclear | 1 | 3114 | Risk Ratio (M‐H, Random, 95% CI) | 1.12 [0.55, 2.29] |
| 61 Stroke ‐ LCn3 ‐ subgroup by intervention type Show forest plot | 28 | 89358 | Risk Ratio (M‐H, Random, 95% CI) | 1.06 [0.96, 1.16] |
| Analysis 1.61  Comparison 1 High vs low LCn3 omega‐3 fats (primary outcomes), Outcome 61 Stroke ‐ LCn3 ‐ subgroup by intervention type. | ||||
| 61.1 Dietary advice | 3 | 5248 | Risk Ratio (M‐H, Random, 95% CI) | 0.93 [0.42, 2.05] |
| 61.2 Supplemental foods | 1 | 4837 | Risk Ratio (M‐H, Random, 95% CI) | 1.11 [0.47, 2.62] |
| 61.3 Supplements (capsule) | 24 | 79273 | Risk Ratio (M‐H, Random, 95% CI) | 1.07 [0.97, 1.18] |
| 61.4 Any combination | 0 | 0 | Risk Ratio (M‐H, Random, 95% CI) | 0.0 [0.0, 0.0] |
| 62 Stroke ‐ LCn3 ‐ subgroup by duration Show forest plot | 28 | 89358 | Risk Ratio (M‐H, Random, 95% CI) | 1.06 [0.96, 1.16] |
| Analysis 1.62  Comparison 1 High vs low LCn3 omega‐3 fats (primary outcomes), Outcome 62 Stroke ‐ LCn3 ‐ subgroup by duration. | ||||
| 62.1 Medium duration 1 to < 2 years in study | 11 | 7467 | Risk Ratio (M‐H, Random, 95% CI) | 1.35 [0.86, 2.12] |
| 62.2 Medium‐long duration: 2 to < 4 years in study | 11 | 28387 | Risk Ratio (M‐H, Random, 95% CI) | 1.15 [0.93, 1.41] |
| 62.3 Long duration: ≥ 4 years in study | 6 | 53504 | Risk Ratio (M‐H, Random, 95% CI) | 1.01 [0.91, 1.13] |
| 63 Stroke ‐ LCn3 ‐ subgroup by primary or secondary prevention Show forest plot | 28 | 89358 | Risk Ratio (M‐H, Random, 95% CI) | 1.06 [0.96, 1.16] |
| Analysis 1.63  Comparison 1 High vs low LCn3 omega‐3 fats (primary outcomes), Outcome 63 Stroke ‐ LCn3 ‐ subgroup by primary or secondary prevention. | ||||
| 63.1 Primary prevention of CVD | 9 | 39332 | Risk Ratio (M‐H, Random, 95% CI) | 0.97 [0.86, 1.09] |
| 63.2 Secondary prevention of CVD | 19 | 50026 | Risk Ratio (M‐H, Random, 95% CI) | 1.21 [1.05, 1.40] |
| 64 Stroke ‐ LCn3 ‐ subgroup by statin use Show forest plot | 28 | 89358 | Risk Ratio (M‐H, Random, 95% CI) | 1.06 [0.96, 1.16] |
| Analysis 1.64  Comparison 1 High vs low LCn3 omega‐3 fats (primary outcomes), Outcome 64 Stroke ‐ LCn3 ‐ subgroup by statin use. | ||||
| 64.1 LCn3 ‐ ≥ 50% of control group on statins | 8 | 42962 | Risk Ratio (M‐H, Random, 95% CI) | 1.03 [0.86, 1.23] |
| 64.2 LCn3 ‐ < 50% of control group on statins | 17 | 44999 | Risk Ratio (M‐H, Random, 95% CI) | 1.18 [1.02, 1.37] |
| 64.3 LCn3 ‐ use of statins unclear | 3 | 1397 | Risk Ratio (M‐H, Random, 95% CI) | 0.94 [0.38, 2.34] |
| 65 Arrythmia (overall) ‐ LCn3 Show forest plot | 27 | 53796 | Risk Ratio (M‐H, Random, 95% CI) | 0.97 [0.90, 1.05] |
| Analysis 1.65  Comparison 1 High vs low LCn3 omega‐3 fats (primary outcomes), Outcome 65 Arrythmia (overall) ‐ LCn3. | ||||
| 66 Arrhythmia‐ LCn3 ‐ SA fixed‐effect Show forest plot | 27 | 53796 | Risk Ratio (M‐H, Fixed, 95% CI) | 1.01 [0.96, 1.07] |
| Analysis 1.66  Comparison 1 High vs low LCn3 omega‐3 fats (primary outcomes), Outcome 66 Arrhythmia‐ LCn3 ‐ SA fixed‐effect. | ||||
| 67 Arrhythmia‐ LCn3 ‐ SA by summary risk of bias Show forest plot | 27 | 53796 | Risk Ratio (M‐H, Random, 95% CI) | 0.97 [0.90, 1.05] |
| Analysis 1.67  Comparison 1 High vs low LCn3 omega‐3 fats (primary outcomes), Outcome 67 Arrhythmia‐ LCn3 ‐ SA by summary risk of bias. | ||||
| 67.1 Low risk of bias | 10 | 25801 | Risk Ratio (M‐H, Random, 95% CI) | 1.10 [0.98, 1.23] |
| 67.2 Moderate/high risk of bias | 17 | 27995 | Risk Ratio (M‐H, Random, 95% CI) | 0.93 [0.84, 1.02] |
| 68 Arrhythmia‐ LCn3 ‐ SA by compliance and study size Show forest plot | 26 | Risk Ratio (M‐H, Random, 95% CI) | Subtotals only | |
| Analysis 1.68  Comparison 1 High vs low LCn3 omega‐3 fats (primary outcomes), Outcome 68 Arrhythmia‐ LCn3 ‐ SA by compliance and study size. | ||||
| 68.1 SA ‐ low risk of compliance bias | 10 | 12914 | Risk Ratio (M‐H, Random, 95% CI) | 0.97 [0.86, 1.09] |
| 68.2 SA ‐ 100+ randomised | 26 | 53749 | Risk Ratio (M‐H, Random, 95% CI) | 0.97 [0.89, 1.05] |
| 69 Arrhythmia ‐ LCn3 ‐ subgroup by new or recurrent Show forest plot | 27 | Risk Ratio (M‐H, Random, 95% CI) | Subtotals only | |
| Analysis 1.69  Comparison 1 High vs low LCn3 omega‐3 fats (primary outcomes), Outcome 69 Arrhythmia ‐ LCn3 ‐ subgroup by new or recurrent. | ||||
| 69.1 New arrhythmia | 16 | 50175 | Risk Ratio (M‐H, Random, 95% CI) | 1.07 [0.99, 1.16] |
| 69.2 Recurrent arrhythmia | 12 | 4425 | Risk Ratio (M‐H, Random, 95% CI) | 0.93 [0.84, 1.03] |
| 70 Arrhythmia ‐ LCn3 ‐ subgroup by fatality Show forest plot | 17 | Risk Ratio (M‐H, Random, 95% CI) | Subtotals only | |
| Analysis 1.70  Comparison 1 High vs low LCn3 omega‐3 fats (primary outcomes), Outcome 70 Arrhythmia ‐ LCn3 ‐ subgroup by fatality. | ||||
| 70.1 Fatal arrhythmias ‐ LCn3 | 2 | 12938 | Risk Ratio (M‐H, Random, 95% CI) | 1.11 [0.95, 1.31] |
| 70.2 Non‐fatal arrhythmias ‐ LCn3 | 8 | 2079 | Risk Ratio (M‐H, Random, 95% CI) | 0.74 [0.57, 0.96] |
| 70.3 Fatal and non‐fatal arrhythmias combined ‐ LCn3 | 10 | 36007 | Risk Ratio (M‐H, Random, 95% CI) | 1.06 [0.97, 1.17] |
| 71 Arrhythmia ‐ LCn3 ‐ subgroup by dose Show forest plot | 27 | 53796 | Risk Ratio (M‐H, Random, 95% CI) | 0.97 [0.89, 1.04] |
| Analysis 1.71  Comparison 1 High vs low LCn3 omega‐3 fats (primary outcomes), Outcome 71 Arrhythmia ‐ LCn3 ‐ subgroup by dose. | ||||
| 71.1 LCn3 ≤ 150 mg/d | 0 | 0 | Risk Ratio (M‐H, Random, 95% CI) | 0.0 [0.0, 0.0] |
| 71.2 LCn3 > 150 ≤ 250 mg/d | 1 | 407 | Risk Ratio (M‐H, Random, 95% CI) | 1.01 [0.90, 1.12] |
| 71.3 LCn3 > 250 ≤ 400 mg/d | 0 | 0 | Risk Ratio (M‐H, Random, 95% CI) | 0.0 [0.0, 0.0] |
| 71.4 LCn3 > 400 ≤ 2400 mg/d | 19 | 51535 | Risk Ratio (M‐H, Random, 95% CI) | 0.98 [0.88, 1.08] |
| 71.5 LCn3 > 2.4 ≤ 4.4 g/d | 3 | 1076 | Risk Ratio (M‐H, Random, 95% CI) | 0.72 [0.55, 0.94] |
| 71.6 LCn3 > 4.4 g/d | 2 | 342 | Risk Ratio (M‐H, Random, 95% CI) | 1.10 [0.32, 3.83] |
| 71.7 Unclear LCn3 dose | 2 | 436 | Risk Ratio (M‐H, Random, 95% CI) | 0.99 [0.76, 1.28] |
| 72 Arrhythmia ‐ LCn3 ‐ subgroup by replacement Show forest plot | 27 | Risk Ratio (M‐H, Random, 95% CI) | Subtotals only | |
| Analysis 1.72  Comparison 1 High vs low LCn3 omega‐3 fats (primary outcomes), Outcome 72 Arrhythmia ‐ LCn3 ‐ subgroup by replacement. | ||||
| 72.1 N‐3 replacing SFA | 2 | 632 | Risk Ratio (M‐H, Random, 95% CI) | 0.74 [0.10, 5.67] |
| 72.2 N‐3 replacing MUFA | 12 | 42246 | Risk Ratio (M‐H, Random, 95% CI) | 0.99 [0.88, 1.11] |
| 72.3 N‐3 replacing n‐6 | 4 | 1302 | Risk Ratio (M‐H, Random, 95% CI) | 1.00 [0.86, 1.16] |
| 72.4 N‐3 replacing carbohydrates/sugars | 1 | 258 | Risk Ratio (M‐H, Random, 95% CI) | 0.34 [0.04, 3.21] |
| 72.5 N‐3 replacing nil/low n‐3 placebo | 6 | 8983 | Risk Ratio (M‐H, Random, 95% CI) | 0.80 [0.69, 0.91] |
| 72.6 Replacement unclear | 4 | 1179 | Risk Ratio (M‐H, Random, 95% CI) | 0.99 [0.91, 1.08] |
| 73 Arrhythmia ‐ LCn3 ‐ subgroup by intervention type Show forest plot | 27 | 53796 | Risk Ratio (M‐H, Random, 95% CI) | 0.97 [0.90, 1.05] |
| Analysis 1.73  Comparison 1 High vs low LCn3 omega‐3 fats (primary outcomes), Outcome 73 Arrhythmia ‐ LCn3 ‐ subgroup by intervention type. | ||||
| 73.1 Dietary advice | 2 | 508 | Risk Ratio (M‐H, Random, 95% CI) | 0.87 [0.44, 1.72] |
| 73.2 Supplemental foods | 2 | 5039 | Risk Ratio (M‐H, Random, 95% CI) | 0.92 [0.67, 1.26] |
| 73.3 Supplements (capsule) | 23 | 48249 | Risk Ratio (M‐H, Random, 95% CI) | 0.97 [0.88, 1.06] |
| 73.4 Any combination | 0 | 0 | Risk Ratio (M‐H, Random, 95% CI) | 0.0 [0.0, 0.0] |
| 74 Arrhythmia ‐ LCn3 ‐ subgroup by duration Show forest plot | 27 | 53796 | Risk Ratio (M‐H, Random, 95% CI) | 0.97 [0.89, 1.04] |
| Analysis 1.74  Comparison 1 High vs low LCn3 omega‐3 fats (primary outcomes), Outcome 74 Arrhythmia ‐ LCn3 ‐ subgroup by duration. | ||||
| 74.1 Medium duration 1 to < 2 years in study | 17 | 8553 | Risk Ratio (M‐H, Random, 95% CI) | 0.93 [0.84, 1.04] |
| 74.2 Medium‐long duration: 2 to < 4 years in study | 7 | 17701 | Risk Ratio (M‐H, Random, 95% CI) | 0.96 [0.84, 1.10] |
| 74.3 Long duration: ≥ 4 years in study | 3 | 27542 | Risk Ratio (M‐H, Random, 95% CI) | 1.13 [0.99, 1.29] |
| 75 Arrhythmia ‐ LCn3 ‐ subgroup by primary or secondary prevention3 Show forest plot | 27 | Risk Ratio (M‐H, Random, 95% CI) | Subtotals only | |
| Analysis 1.75  Comparison 1 High vs low LCn3 omega‐3 fats (primary outcomes), Outcome 75 Arrhythmia ‐ LCn3 ‐ subgroup by primary or secondary prevention3. | ||||
| 75.1 Primary prevention | 8 | 14565 | Risk Ratio (M‐H, Random, 95% CI) | 1.11 [0.97, 1.28] |
| 75.2 Secondary prevention | 19 | 39231 | Risk Ratio (M‐H, Random, 95% CI) | 0.95 [0.86, 1.03] |
| 76 Arrhythmia ‐ LCn3 ‐ subgroup by statin use Show forest plot | 27 | Risk Ratio (M‐H, Random, 95% CI) | Subtotals only | |
| Analysis 1.76  Comparison 1 High vs low LCn3 omega‐3 fats (primary outcomes), Outcome 76 Arrhythmia ‐ LCn3 ‐ subgroup by statin use. | ||||
| 76.1 LCn3 ‐ ≥ 50% of control group on statins | 5 | 23779 | Risk Ratio (M‐H, Random, 95% CI) | 1.07 [0.95, 1.22] |
| 76.2 LCn3 ‐ < 50% of control group on statins | 18 | 28932 | Risk Ratio (M‐H, Random, 95% CI) | 0.94 [0.85, 1.04] |
| 76.3 LCn3 ‐ use of statins unclear | 4 | 1085 | Risk Ratio (M‐H, Random, 95% CI) | 0.97 [0.80, 1.18] |
| Outcome or subgroup title | No. of studies | No. of participants | Statistical method | Effect size |
| 1 MACCEs ‐ LCn3 Show forest plot | 5 | 34730 | Risk Ratio (M‐H, Random, 95% CI) | 1.03 [0.97, 1.09] |
| Analysis 2.1  Comparison 2 High vs low LCn3 omega‐3 fats (secondary outcomes), Outcome 1 MACCEs ‐ LCn3. | ||||
| 2 Myocardial infarction (overall) ‐ LCn3 Show forest plot | 23 | 72159 | Risk Ratio (M‐H, Random, 95% CI) | 0.95 [0.88, 1.03] |
| Analysis 2.2  Comparison 2 High vs low LCn3 omega‐3 fats (secondary outcomes), Outcome 2 Myocardial infarction (overall) ‐ LCn3. | ||||
| 3 Total MI ‐ sensitivity analysis (SA) by summary risk of bias Show forest plot | 23 | 72159 | Risk Ratio (M‐H, Random, 95% CI) | 0.95 [0.88, 1.03] |
| Analysis 2.3  Comparison 2 High vs low LCn3 omega‐3 fats (secondary outcomes), Outcome 3 Total MI ‐ sensitivity analysis (SA) by summary risk of bias. | ||||
| 3.1 Low summary risk of bias | 11 | 30025 | Risk Ratio (M‐H, Random, 95% CI) | 1.03 [0.92, 1.15] |
| 3.2 Moderate to high risk of bias | 12 | 42134 | Risk Ratio (M‐H, Random, 95% CI) | 0.88 [0.79, 0.99] |
| 4 Total MI ‐ LCn3 ‐ SA by compliance and study size Show forest plot | 23 | Risk Ratio (M‐H, Random, 95% CI) | Subtotals only | |
| Analysis 2.4  Comparison 2 High vs low LCn3 omega‐3 fats (secondary outcomes), Outcome 4 Total MI ‐ LCn3 ‐ SA by compliance and study size. | ||||
| 4.1 SA ‐ low risk of compliance bias | 10 | 13002 | Risk Ratio (M‐H, Random, 95% CI) | 0.94 [0.79, 1.13] |
| 4.2 SA ‐ 100+ randomised | 21 | 72015 | Risk Ratio (M‐H, Random, 95% CI) | 0.95 [0.88, 1.03] |
| 5 Total MI ‐ LCn3 ‐ subgroup by fatality Show forest plot | 23 | Risk Ratio (M‐H, Random, 95% CI) | Subtotals only | |
| Analysis 2.5  Comparison 2 High vs low LCn3 omega‐3 fats (secondary outcomes), Outcome 5 Total MI ‐ LCn3 ‐ subgroup by fatality. | ||||
| 5.1 Fatal MI | 15 | 60471 | Risk Ratio (M‐H, Random, 95% CI) | 0.76 [0.53, 1.10] |
| 5.2 Non‐fatal MI | 21 | 70407 | Risk Ratio (M‐H, Random, 95% CI) | 0.96 [0.87, 1.06] |
| 6 Sudden cardiac death (overall) ‐ LCn3 Show forest plot | 14 | 65004 | Risk Ratio (M‐H, Random, 95% CI) | 0.97 [0.80, 1.18] |
| Analysis 2.6  Comparison 2 High vs low LCn3 omega‐3 fats (secondary outcomes), Outcome 6 Sudden cardiac death (overall) ‐ LCn3. | ||||
| 7 Angina ‐ LCn3 Show forest plot | 11 | 39907 | Risk Ratio (M‐H, Random, 95% CI) | 0.99 [0.91, 1.06] |
| Analysis 2.7  Comparison 2 High vs low LCn3 omega‐3 fats (secondary outcomes), Outcome 7 Angina ‐ LCn3. | ||||
| 8 Heart failure ‐ LCn3 Show forest plot | 15 | 49644 | Risk Ratio (M‐H, Random, 95% CI) | 0.93 [0.85, 1.03] |
| Analysis 2.8  Comparison 2 High vs low LCn3 omega‐3 fats (secondary outcomes), Outcome 8 Heart failure ‐ LCn3. | ||||
| 8.1 Low summary risk of bias | 6 | 24176 | Risk Ratio (M‐H, Random, 95% CI) | 0.97 [0.89, 1.06] |
| 8.2 Moderate to high risk of bias | 9 | 25468 | Risk Ratio (M‐H, Random, 95% CI) | 0.78 [0.57, 1.08] |
| 9 Revascularisation ‐ LCn3 Show forest plot | 15 | Risk Ratio (M‐H, Random, 95% CI) | Subtotals only | |
| Analysis 2.9  Comparison 2 High vs low LCn3 omega‐3 fats (secondary outcomes), Outcome 9 Revascularisation ‐ LCn3. | ||||
| 9.1 CABG ‐ LCn3 | 5 | 1535 | Risk Ratio (M‐H, Random, 95% CI) | 0.56 [0.15, 2.14] |
| 9.2 Angioplasty ‐ LCn3 | 4 | 3195 | Risk Ratio (M‐H, Random, 95% CI) | 0.96 [0.74, 1.24] |
| 9.3 Any revascularisation ‐ LCn3 | 12 | 66095 | Risk Ratio (M‐H, Random, 95% CI) | 0.98 [0.94, 1.03] |
| 10 Peripheral arterial disease ‐ LCn3 Show forest plot | 6 | 49035 | Risk Ratio (M‐H, Random, 95% CI) | 0.93 [0.74, 1.18] |
| Analysis 2.10  Comparison 2 High vs low LCn3 omega‐3 fats (secondary outcomes), Outcome 10 Peripheral arterial disease ‐ LCn3. | ||||
| 11 PAD ‐ LCn3 ‐ SA by summary risk of bias Show forest plot | 6 | Risk Ratio (M‐H, Random, 95% CI) | Subtotals only | |
| Analysis 2.11  Comparison 2 High vs low LCn3 omega‐3 fats (secondary outcomes), Outcome 11 PAD ‐ LCn3 ‐ SA by summary risk of bias. | ||||
| 11.1 Low summary risk of bias | 2 | 12738 | Risk Ratio (M‐H, Random, 95% CI) | 1.10 [0.75, 1.62] |
| 11.2 Moderate to high summary risk of bias | 4 | 36297 | Risk Ratio (M‐H, Random, 95% CI) | 0.85 [0.64, 1.14] |
| 12 PAD ‐ LCn3 ‐ SA compliance and study size Show forest plot | 6 | Risk Ratio (M‐H, Random, 95% CI) | Subtotals only | |
| Analysis 2.12  Comparison 2 High vs low LCn3 omega‐3 fats (secondary outcomes), Outcome 12 PAD ‐ LCn3 ‐ SA compliance and study size. | ||||
| 12.1 SA compliance | 1 | 202 | Risk Ratio (M‐H, Random, 95% CI) | 1.0 [0.06, 15.77] |
| 12.2 SA study size 100+ | 6 | 49035 | Risk Ratio (M‐H, Random, 95% CI) | 0.93 [0.74, 1.18] |
| 13 Acute coronary syndrome ‐ LCn3 Show forest plot | 2 | Risk Ratio (M‐H, Random, 95% CI) | Subtotals only | |
| Analysis 2.13  Comparison 2 High vs low LCn3 omega‐3 fats (secondary outcomes), Outcome 13 Acute coronary syndrome ‐ LCn3. | ||||
| 13.1 LCn3 | 2 | 2703 | Risk Ratio (M‐H, Random, 95% CI) | 1.19 [0.71, 2.00] |
| 14 Body weight, kg ‐ LCn3 Show forest plot | 12 | 15812 | Mean Difference (IV, Random, 95% CI) | ‐0.01 [‐0.84, 0.82] |
| Analysis 2.14  Comparison 2 High vs low LCn3 omega‐3 fats (secondary outcomes), Outcome 14 Body weight, kg ‐ LCn3. | ||||
| 15 Weight, kg ‐ LCn3 ‐ SA by summary risk of bias Show forest plot | 12 | 15812 | Mean Difference (IV, Random, 95% CI) | ‐0.01 [‐0.84, 0.82] |
| Analysis 2.15  Comparison 2 High vs low LCn3 omega‐3 fats (secondary outcomes), Outcome 15 Weight, kg ‐ LCn3 ‐ SA by summary risk of bias. | ||||
| 15.1 Low risk of bias | 7 | 15458 | Mean Difference (IV, Random, 95% CI) | ‐0.01 [‐0.91, 0.90] |
| 15.2 Moderate/high risk of bias | 5 | 354 | Mean Difference (IV, Random, 95% CI) | ‐0.28 [‐3.12, 2.55] |
| 16 Weight, kg ‐ LCn3 ‐ SA by compliance and study size Show forest plot | 10 | Mean Difference (IV, Random, 95% CI) | Subtotals only | |
| Analysis 2.16  Comparison 2 High vs low LCn3 omega‐3 fats (secondary outcomes), Outcome 16 Weight, kg ‐ LCn3 ‐ SA by compliance and study size. | ||||
| 16.1 SA ‐ low risk of compliance bias | 7 | 828 | Mean Difference (IV, Random, 95% CI) | 0.58 [‐0.52, 1.69] |
| 16.2 SA ‐ 100+ randomised | 7 | 15545 | Mean Difference (IV, Random, 95% CI) | 0.07 [‐0.84, 0.97] |
| 17 Weight, kg ‐ LCn3 ‐ subgroup by dose Show forest plot | 12 | Mean Difference (IV, Random, 95% CI) | Subtotals only | |
| Analysis 2.17  Comparison 2 High vs low LCn3 omega‐3 fats (secondary outcomes), Outcome 17 Weight, kg ‐ LCn3 ‐ subgroup by dose. | ||||
| 17.1 LCn3 ≤ 150 mg/d | 0 | 0 | Mean Difference (IV, Random, 95% CI) | 0.0 [0.0, 0.0] |
| 17.2 LCn3 > 150 ≤ 250 mg/d | 0 | 0 | Mean Difference (IV, Random, 95% CI) | 0.0 [0.0, 0.0] |
| 17.3 LCn3 > 250 ≤ 400 mg/d | 0 | 0 | Mean Difference (IV, Random, 95% CI) | 0.0 [0.0, 0.0] |
| 17.4 LCn3 > 400 ≤ 2400 mg/d | 8 | 15420 | Mean Difference (IV, Random, 95% CI) | ‐0.29 [‐1.16, 0.58] |
| 17.5 LCn3 > 2.4 ≤ 4.4 g/d | 3 | 241 | Mean Difference (IV, Random, 95% CI) | 0.07 [‐6.38, 6.51] |
| 17.6 LCn3 > 4.4 g/d | 2 | 261 | Mean Difference (IV, Random, 95% CI) | 1.51 [0.28, 2.75] |
| 18 Weight, kg ‐ LCn3 ‐ subgroup by replacement Show forest plot | 12 | Mean Difference (IV, Random, 95% CI) | Subtotals only | |
| Analysis 2.18  Comparison 2 High vs low LCn3 omega‐3 fats (secondary outcomes), Outcome 18 Weight, kg ‐ LCn3 ‐ subgroup by replacement. | ||||
| 18.1 N‐3 replacing SFA | 2 | 433 | Mean Difference (IV, Random, 95% CI) | ‐2.51 [‐4.30, ‐0.72] |
| 18.2 N‐3 replacing MUFA | 7 | 15088 | Mean Difference (IV, Random, 95% CI) | 0.23 [‐0.28, 0.75] |
| 18.3 N‐3 replacing n‐6 | 1 | 41 | Mean Difference (IV, Random, 95% CI) | ‐1.3 [‐3.83, 1.23] |
| 18.4 N‐3 replacing carbs/sugars | 1 | 258 | Mean Difference (IV, Random, 95% CI) | ‐2.70 [‐4.75, ‐0.65] |
| 18.5 N‐3 replacing nil/low n‐3 placebo | 1 | 202 | Mean Difference (IV, Random, 95% CI) | 1.5 [0.25, 2.75] |
| 18.6 Replacement unclear | 2 | 223 | Mean Difference (IV, Random, 95% CI) | 0.60 [‐4.93, 6.13] |
| 19 Weight, kg ‐ LCn3 ‐ subgroup by intervention type Show forest plot | 12 | 15812 | Mean Difference (IV, Random, 95% CI) | ‐0.01 [‐0.84, 0.82] |
| Analysis 2.19  Comparison 2 High vs low LCn3 omega‐3 fats (secondary outcomes), Outcome 19 Weight, kg ‐ LCn3 ‐ subgroup by intervention type. | ||||
| 19.1 Dietary advice | 0 | 0 | Mean Difference (IV, Random, 95% CI) | 0.0 [0.0, 0.0] |
| 19.2 Supplemental foods | 1 | 202 | Mean Difference (IV, Random, 95% CI) | 1.5 [0.25, 2.75] |
| 19.3 Supplement (capsule) | 9 | 15538 | Mean Difference (IV, Random, 95% CI) | ‐0.23 [‐1.08, 0.63] |
| 19.4 Any combination | 2 | 72 | Mean Difference (IV, Random, 95% CI) | ‐0.43 [‐6.47, 5.61] |
| 20 Weight, kg ‐ LCn3 ‐ subgroup by duration Show forest plot | 12 | Mean Difference (IV, Random, 95% CI) | Subtotals only | |
| Analysis 2.20  Comparison 2 High vs low LCn3 omega‐3 fats (secondary outcomes), Outcome 20 Weight, kg ‐ LCn3 ‐ subgroup by duration. | ||||
| 20.1 Medium duration 1 to < 2 years in study | 8 | 840 | Mean Difference (IV, Random, 95% CI) | ‐0.54 [‐2.21, 1.12] |
| 20.2 Medium‐long duration: 2 to < 4 years in study | 3 | 436 | Mean Difference (IV, Random, 95% CI) | 0.67 [‐1.58, 2.91] |
| 20.3 Long duration ≥ 4 years in study | 1 | 14536 | Mean Difference (IV, Random, 95% CI) | 0.10 [‐0.48, 0.68] |
| 21 Weight, kg ‐ LCn3 ‐ subgroup by primary or secondary prevention Show forest plot | 12 | Mean Difference (IV, Random, 95% CI) | Subtotals only | |
| Analysis 2.21  Comparison 2 High vs low LCn3 omega‐3 fats (secondary outcomes), Outcome 21 Weight, kg ‐ LCn3 ‐ subgroup by primary or secondary prevention. | ||||
| 21.1 Primary CVD prevention | 10 | 15578 | Mean Difference (IV, Random, 95% CI) | 0.05 [‐0.83, 0.92] |
| 21.2 Secondary CVD prevention | 2 | 234 | Mean Difference (IV, Random, 95% CI) | ‐1.13 [‐4.43, 2.16] |
| 22 Weight, kg ‐ LCn3 ‐ subgroup by statin use Show forest plot | 12 | Mean Difference (IV, Random, 95% CI) | Subtotals only | |
| Analysis 2.22  Comparison 2 High vs low LCn3 omega‐3 fats (secondary outcomes), Outcome 22 Weight, kg ‐ LCn3 ‐ subgroup by statin use. | ||||
| 22.1 LCn3 ‐ ≥ 50% of control group on statins | 2 | 14631 | Mean Difference (IV, Random, 95% CI) | 0.64 [‐1.88, 3.17] |
| 22.2 LCn3 ‐ < 50% of control group on statins | 5 | 614 | Mean Difference (IV, Random, 95% CI) | 0.47 [‐0.66, 1.60] |
| 22.3 LCn3 ‐ use of statins unclear | 5 | 567 | Mean Difference (IV, Random, 95% CI) | ‐1.51 [‐3.30, 0.27] |
| 23 Body mass index, kg/m² ‐ LCn3 Show forest plot | 14 | 15234 | Mean Difference (IV, Random, 95% CI) | 0.04 [‐0.16, 0.24] |
| Analysis 2.23  Comparison 2 High vs low LCn3 omega‐3 fats (secondary outcomes), Outcome 23 Body mass index, kg/m² ‐ LCn3. | ||||
| 24 BMI, kg/m²‐ LCn3 ‐ SA by summary risk of bias Show forest plot | 14 | 15234 | Mean Difference (IV, Random, 95% CI) | 0.04 [‐0.16, 0.24] |
| Analysis 2.24  Comparison 2 High vs low LCn3 omega‐3 fats (secondary outcomes), Outcome 24 BMI, kg/m²‐ LCn3 ‐ SA by summary risk of bias. | ||||
| 24.1 Low risk of bias | 5 | 14190 | Mean Difference (IV, Random, 95% CI) | ‐0.01 [‐0.36, 0.33] |
| 24.2 Moderate/high risk of bias | 9 | 1044 | Mean Difference (IV, Random, 95% CI) | 0.04 [‐0.13, 0.20] |
| 25 BMI, kg/m²‐ LCn3 ‐ SA by compliance and study size Show forest plot | 10 | Mean Difference (IV, Random, 95% CI) | Subtotals only | |
| Analysis 2.25  Comparison 2 High vs low LCn3 omega‐3 fats (secondary outcomes), Outcome 25 BMI, kg/m²‐ LCn3 ‐ SA by compliance and study size. | ||||
| 25.1 SA ‐ low risk of compliance bias | 5 | 1848 | Mean Difference (IV, Random, 95% CI) | 0.09 [‐0.21, 0.38] |
| 25.2 SA ‐ 100+ randomised | 9 | 14982 | Mean Difference (IV, Random, 95% CI) | 0.01 [‐0.12, 0.14] |
| 26 BMI, kg/m² ‐ LCn3 ‐ subgroup by dose Show forest plot | 14 | Mean Difference (IV, Random, 95% CI) | Subtotals only | |
| Analysis 2.26  Comparison 2 High vs low LCn3 omega‐3 fats (secondary outcomes), Outcome 26 BMI, kg/m² ‐ LCn3 ‐ subgroup by dose. | ||||
| 26.1 LCn3 > 150 ≤ 250 mg/d | 0 | 0 | Mean Difference (IV, Random, 95% CI) | 0.0 [0.0, 0.0] |
| 26.2 LCn3 ≤ 150 mg/d | 0 | 0 | Mean Difference (IV, Random, 95% CI) | 0.0 [0.0, 0.0] |
| 26.3 LCn3 > 250 ≤ 400 mg/d | 0 | 0 | Mean Difference (IV, Random, 95% CI) | 0.0 [0.0, 0.0] |
| 26.4 LCn3 > 400 ≤ 2400 mg/d | 11 | 14789 | Mean Difference (IV, Random, 95% CI) | 0.01 [‐0.11, 0.13] |
| 26.5 LCn3 > 2.4 ≤ 4.4 g/d | 3 | 445 | Mean Difference (IV, Random, 95% CI) | 1.42 [‐0.51, 3.35] |
| 26.6 LCn3 > 4.4 g/d | 0 | 0 | Mean Difference (IV, Random, 95% CI) | 0.0 [0.0, 0.0] |
| 27 BMI, kg/m² ‐ LCn3 ‐ subgroup by replacement Show forest plot | 14 | Mean Difference (IV, Random, 95% CI) | Subtotals only | |
| Analysis 2.27  Comparison 2 High vs low LCn3 omega‐3 fats (secondary outcomes), Outcome 27 BMI, kg/m² ‐ LCn3 ‐ subgroup by replacement. | ||||
| 27.1 N‐3 replacing SFA | 1 | 258 | Mean Difference (IV, Random, 95% CI) | ‐0.60 [‐1.14, ‐0.06] |
| 27.2 N‐3 replacing MUFA | 7 | 14180 | Mean Difference (IV, Random, 95% CI) | 0.08 [‐0.12, 0.28] |
| 27.3 N‐3 replacing n‐6 | 3 | 513 | Mean Difference (IV, Random, 95% CI) | 0.18 [‐0.46, 0.81] |
| 27.4 N‐3 replacing carbs/sugars | 1 | 258 | Mean Difference (IV, Random, 95% CI) | ‐0.60 [‐1.14, ‐0.06] |
| 27.5 N‐3 replacing nil/low n‐3 placebo | 1 | 60 | Mean Difference (IV, Random, 95% CI) | 1.0 [‐1.18, 3.18] |
| 27.6 Replacement unclear | 2 | 223 | Mean Difference (IV, Random, 95% CI) | 0.58 [‐1.17, 2.33] |
| 28 BMI, kg/m² ‐ LCn3 ‐ subgroup by intervention type Show forest plot | 14 | 15234 | Mean Difference (IV, Random, 95% CI) | 0.04 [‐0.16, 0.24] |
| Analysis 2.28  Comparison 2 High vs low LCn3 omega‐3 fats (secondary outcomes), Outcome 28 BMI, kg/m² ‐ LCn3 ‐ subgroup by intervention type. | ||||
| 28.1 Dietary advice | 0 | 0 | Mean Difference (IV, Random, 95% CI) | 0.0 [0.0, 0.0] |
| 28.2 Supplemental foods | 1 | 1260 | Mean Difference (IV, Random, 95% CI) | 0.1 [‐0.10, 0.30] |
| 28.3 Supplement (capsule) | 12 | 13929 | Mean Difference (IV, Random, 95% CI) | 0.01 [‐0.25, 0.27] |
| 28.4 Any combination | 1 | 45 | Mean Difference (IV, Random, 95% CI) | 1.60 [‐0.43, 3.63] |
| 29 BMI, kg/m² ‐ LCn3 ‐ subgroup by duration Show forest plot | 14 | Mean Difference (IV, Random, 95% CI) | Subtotals only | |
| Analysis 2.29  Comparison 2 High vs low LCn3 omega‐3 fats (secondary outcomes), Outcome 29 BMI, kg/m² ‐ LCn3 ‐ subgroup by duration. | ||||
| 29.1 Medium duration 1 to < 2 years in study | 9 | 906 | Mean Difference (IV, Random, 95% CI) | 0.24 [‐0.40, 0.88] |
| 29.2 Medium‐long duration: 2 to < 4 years in study | 4 | 1792 | Mean Difference (IV, Random, 95% CI) | 0.12 [‐0.07, 0.31] |
| 29.3 Long duration ≥ 4 years in study | 1 | 12536 | Mean Difference (IV, Random, 95% CI) | 0.0 [‐0.20, 0.20] |
| 30 BMI, kg/m² ‐ LCn3 ‐ subgroup by primary or secondary prevention Show forest plot | 14 | Mean Difference (IV, Random, 95% CI) | Subtotals only | |
| Analysis 2.30  Comparison 2 High vs low LCn3 omega‐3 fats (secondary outcomes), Outcome 30 BMI, kg/m² ‐ LCn3 ‐ subgroup by primary or secondary prevention. | ||||
| 30.1 Primary CVD prevention | 11 | 13610 | Mean Difference (IV, Random, 95% CI) | 0.15 [‐0.36, 0.66] |
| 30.2 Secondary CVD prevention | 3 | 1624 | Mean Difference (IV, Random, 95% CI) | 0.05 [‐0.08, 0.18] |
| 31 BMI, kg/m² ‐ LCn3 ‐ subgroup by statin use Show forest plot | 14 | Mean Difference (IV, Random, 95% CI) | Subtotals only | |
| Analysis 2.31  Comparison 2 High vs low LCn3 omega‐3 fats (secondary outcomes), Outcome 31 BMI, kg/m² ‐ LCn3 ‐ subgroup by statin use. | ||||
| 31.1 LCn3 ‐ ≥ 50% of control group on statins | 3 | 13891 | Mean Difference (IV, Random, 95% CI) | 0.13 [‐0.22, 0.48] |
| 31.2 LCn3 ‐ < 50% of control group on statins | 4 | 665 | Mean Difference (IV, Random, 95% CI) | 0.02 [‐0.15, 0.19] |
| 31.3 LCn3 ‐ use of statins unclear | 7 | 678 | Mean Difference (IV, Random, 95% CI) | 0.06 [‐0.86, 0.97] |
| 32 Other measures of adiposity ‐ LCn3 Show forest plot | 6 | Mean Difference (IV, Random, 95% CI) | Subtotals only | |
| Analysis 2.32  Comparison 2 High vs low LCn3 omega‐3 fats (secondary outcomes), Outcome 32 Other measures of adiposity ‐ LCn3. | ||||
| 32.1 Percentage body fat | 2 | 127 | Mean Difference (IV, Random, 95% CI) | 0.85 [‐6.87, 8.57] |
| 32.2 Percentage visceral fat | 1 | 95 | Mean Difference (IV, Random, 95% CI) | ‐1.80 [‐15.03, 11.43] |
| 32.3 Waist circumference, cm | 3 | 676 | Mean Difference (IV, Random, 95% CI) | 0.66 [‐0.09, 1.42] |
| 32.4 Waist‐hip ratio | 1 | 100 | Mean Difference (IV, Random, 95% CI) | 0.0 [‐0.01, 0.01] |
| 32.5 Abdominal circumference, cm | 1 | 256 | Mean Difference (IV, Random, 95% CI) | ‐0.70 [‐8.78, 7.38] |
| 32.6 Hip circumference, cm | 1 | 258 | Mean Difference (IV, Random, 95% CI) | ‐2.40 [‐9.80, 5.00] |
| 33 Total cholesterol, serum, mmoL/L ‐ LCn3 Show forest plot | 28 | 37281 | Mean Difference (IV, Random, 95% CI) | ‐0.01 [‐0.05, 0.04] |
| Analysis 2.33  Comparison 2 High vs low LCn3 omega‐3 fats (secondary outcomes), Outcome 33 Total cholesterol, serum, mmoL/L ‐ LCn3. | ||||
| 34 TC, mmoL/L ‐ LCn3 ‐ SA by summary risk of bias Show forest plot | 28 | 37281 | Mean Difference (IV, Random, 95% CI) | ‐0.01 [‐0.05, 0.03] |
| Analysis 2.34  Comparison 2 High vs low LCn3 omega‐3 fats (secondary outcomes), Outcome 34 TC, mmoL/L ‐ LCn3 ‐ SA by summary risk of bias. | ||||
| 34.1 Low risk of bias | 9 | 14930 | Mean Difference (IV, Random, 95% CI) | 0.01 [‐0.05, 0.06] |
| 34.2 Moderate/high risk of bias | 19 | 22351 | Mean Difference (IV, Random, 95% CI) | ‐0.03 [‐0.09, 0.03] |
| 35 TC, mmoL/L ‐ LCn3 ‐ SA by compliance and study size Show forest plot | 20 | Mean Difference (IV, Random, 95% CI) | Subtotals only | |
| Analysis 2.35  Comparison 2 High vs low LCn3 omega‐3 fats (secondary outcomes), Outcome 35 TC, mmoL/L ‐ LCn3 ‐ SA by compliance and study size. | ||||
| 35.1 SA ‐ low risk of compliance bias | 14 | 3341 | Mean Difference (IV, Random, 95% CI) | 0.02 [‐0.05, 0.09] |
| 35.2 SA ‐ 100+ randomised | 15 | 36622 | Mean Difference (IV, Random, 95% CI) | 0.00 [‐0.05, 0.06] |
| 36 TC, mmoL/L ‐ LCn3 ‐ subgroup by dose Show forest plot | 28 | Mean Difference (IV, Random, 95% CI) | Subtotals only | |
| Analysis 2.36  Comparison 2 High vs low LCn3 omega‐3 fats (secondary outcomes), Outcome 36 TC, mmoL/L ‐ LCn3 ‐ subgroup by dose. | ||||
| 36.1 LCn3 ≤ 150 mg/d | 0 | 0 | Mean Difference (IV, Random, 95% CI) | 0.0 [0.0, 0.0] |
| 36.2 LCn3 > 150 ≤ 250 mg/d | 0 | 0 | Mean Difference (IV, Random, 95% CI) | 0.0 [0.0, 0.0] |
| 36.3 LCn3 > 250 ≤ 400 mg/d | 1 | 1715 | Mean Difference (IV, Random, 95% CI) | 0.10 [‐0.01, 0.21] |
| 36.4 LCn3 > 400 ≤ 2400 mg/d | 18 | 34262 | Mean Difference (IV, Random, 95% CI) | ‐0.03 [‐0.06, 0.00] |
| 36.5 LCn3 > 2.4 ≤ 4.4 g/d | 7 | 1216 | Mean Difference (IV, Random, 95% CI) | ‐0.14 [‐0.28, ‐0.01] |
| 36.6 LCn3 > 4.4 g/d | 2 | 88 | Mean Difference (IV, Random, 95% CI) | 0.08 [‐0.28, 0.45] |
| 37 TC, mmoL/L ‐ LCn3 ‐ subgroup by replacement Show forest plot | 28 | Mean Difference (IV, Random, 95% CI) | Subtotals only | |
| Analysis 2.37  Comparison 2 High vs low LCn3 omega‐3 fats (secondary outcomes), Outcome 37 TC, mmoL/L ‐ LCn3 ‐ subgroup by replacement. | ||||
| 37.1 N‐3 replacing SFA | 3 | 2148 | Mean Difference (IV, Random, 95% CI) | 0.10 [‐0.01, 0.20] |
| 37.2 N‐3 replacing MUFA | 15 | 16504 | Mean Difference (IV, Random, 95% CI) | 0.01 [‐0.04, 0.06] |
| 37.3 N‐3 replacing n‐6 | 5 | 895 | Mean Difference (IV, Random, 95% CI) | 0.02 [‐0.22, 0.26] |
| 37.4 N‐3 replacing carbs/sugars | 1 | 258 | Mean Difference (IV, Random, 95% CI) | ‐0.20 [‐1.03, 0.63] |
| 37.5 N‐3 replacing nil/low n‐3 placebo | 5 | 19431 | Mean Difference (IV, Random, 95% CI) | ‐0.05 [‐0.07, ‐0.03] |
| 37.6 Replacement unclear | 2 | 193 | Mean Difference (IV, Random, 95% CI) | ‐0.15 [‐0.47, 0.17] |
| 38 TC, mmoL/L ‐ LCn3 ‐ subgroup by intervention type Show forest plot | 28 | Mean Difference (IV, Random, 95% CI) | Subtotals only | |
| Analysis 2.38  Comparison 2 High vs low LCn3 omega‐3 fats (secondary outcomes), Outcome 38 TC, mmoL/L ‐ LCn3 ‐ subgroup by intervention type. | ||||
| 38.1 Dietary advice | 1 | 1715 | Mean Difference (IV, Random, 95% CI) | 0.10 [‐0.01, 0.21] |
| 38.2 Supplemental foods | 1 | 1210 | Mean Difference (IV, Random, 95% CI) | 0.02 [‐0.09, 0.13] |
| 38.3 Supplement (capsule) | 24 | 34145 | Mean Difference (IV, Random, 95% CI) | ‐0.05 [‐0.07, ‐0.03] |
| 38.4 Any combination | 2 | 211 | Mean Difference (IV, Random, 95% CI) | 0.13 [‐0.10, 0.37] |
| 39 TC, mmoL/L ‐ LCn3 ‐ subgroup by duration Show forest plot | 28 | Mean Difference (IV, Random, 95% CI) | Subtotals only | |
| Analysis 2.39  Comparison 2 High vs low LCn3 omega‐3 fats (secondary outcomes), Outcome 39 TC, mmoL/L ‐ LCn3 ‐ subgroup by duration. | ||||
| 39.1 Medium duration 1 to < 2 years in study | 15 | 1661 | Mean Difference (IV, Random, 95% CI) | ‐0.06 [‐0.16, 0.04] |
| 39.2 Medium‐long duration: 2 to < 4 years in study | 10 | 4231 | Mean Difference (IV, Random, 95% CI) | 0.02 [‐0.05, 0.10] |
| 39.3 Long duration ≥ 4 years in study | 3 | 31389 | Mean Difference (IV, Random, 95% CI) | 0.00 [‐0.09, 0.09] |
| 40 TC, mmoL/L ‐ LCn3 ‐ subgroup by primary or secondary prevention Show forest plot | 28 | Mean Difference (IV, Random, 95% CI) | Subtotals only | |
| Analysis 2.40  Comparison 2 High vs low LCn3 omega‐3 fats (secondary outcomes), Outcome 40 TC, mmoL/L ‐ LCn3 ‐ subgroup by primary or secondary prevention. | ||||
| 40.1 Primary prevention | 17 | 32796 | Mean Difference (IV, Random, 95% CI) | ‐0.04 [‐0.07, ‐0.02] |
| 40.2 Secondary prevention | 11 | 4485 | Mean Difference (IV, Random, 95% CI) | ‐0.01 [‐0.09, 0.08] |
| 41 TC, mmoL/L ‐ LCn3 ‐ subgroup by statin use Show forest plot | 28 | Mean Difference (IV, Random, 95% CI) | Subtotals only | |
| Analysis 2.41  Comparison 2 High vs low LCn3 omega‐3 fats (secondary outcomes), Outcome 41 TC, mmoL/L ‐ LCn3 ‐ subgroup by statin use. | ||||
| 41.1 LCn3 ‐ ≥ 50% of control group on statins | 6 | 32823 | Mean Difference (IV, Random, 95% CI) | ‐0.05 [‐0.07, ‐0.02] |
| 41.2 LCn3 ‐ < 50% of control group on statins | 15 | 3871 | Mean Difference (IV, Random, 95% CI) | 0.01 [‐0.08, 0.10] |
| 41.3 LCn3 ‐ use of statins unclear | 7 | 587 | Mean Difference (IV, Random, 95% CI) | ‐0.03 [‐0.27, 0.22] |
| 42 Triglycerides, fasting, serum, mmoL/L ‐ LCn3 Show forest plot | 25 | 35579 | Mean Difference (IV, Random, 95% CI) | ‐0.24 [‐0.31, ‐0.16] |
| Analysis 2.42  Comparison 2 High vs low LCn3 omega‐3 fats (secondary outcomes), Outcome 42 Triglycerides, fasting, serum, mmoL/L ‐ LCn3. | ||||
| 43 TG, fasting, mmoL/L ‐ LCn3 ‐ SA by summary risk of bias Show forest plot | 25 | 35579 | Mean Difference (IV, Random, 95% CI) | ‐0.23 [‐0.30, ‐0.16] |
| Analysis 2.43  Comparison 2 High vs low LCn3 omega‐3 fats (secondary outcomes), Outcome 43 TG, fasting, mmoL/L ‐ LCn3 ‐ SA by summary risk of bias. | ||||
| 43.1 Low risk of bias | 8 | 14654 | Mean Difference (IV, Random, 95% CI) | ‐0.17 [‐0.25, ‐0.09] |
| 43.2 Moderate/high risk of bias | 17 | 20925 | Mean Difference (IV, Random, 95% CI) | ‐0.25 [‐0.35, ‐0.15] |
| 44 TG, fasting, mmoL/L ‐ LCn3 ‐ SA by compliance and study size Show forest plot | 19 | Mean Difference (IV, Random, 95% CI) | Subtotals only | |
| Analysis 2.44  Comparison 2 High vs low LCn3 omega‐3 fats (secondary outcomes), Outcome 44 TG, fasting, mmoL/L ‐ LCn3 ‐ SA by compliance and study size. | ||||
| 44.1 SA ‐ low risk of compliance bias | 12 | 3306 | Mean Difference (IV, Random, 95% CI) | ‐0.26 [‐0.36, ‐0.16] |
| 44.2 SA ‐ 100+ randomised | 18 | 35197 | Mean Difference (IV, Random, 95% CI) | ‐0.24 [‐0.32, ‐0.16] |
| 45 TG, fasting, mmoL/L ‐ LCn3 ‐ subgroup by dose Show forest plot | 25 | Mean Difference (IV, Random, 95% CI) | Subtotals only | |
| Analysis 2.45  Comparison 2 High vs low LCn3 omega‐3 fats (secondary outcomes), Outcome 45 TG, fasting, mmoL/L ‐ LCn3 ‐ subgroup by dose. | ||||
| 45.1 LCn3 ≤ 150 mg/d | 0 | 0 | Mean Difference (IV, Random, 95% CI) | 0.0 [0.0, 0.0] |
| 45.2 LCn3 > 150 ≤ 250 mg/d | 0 | 0 | Mean Difference (IV, Random, 95% CI) | 0.0 [0.0, 0.0] |
| 45.3 LCn3 > 250 ≤ 400 mg/d | 0 | 0 | Mean Difference (IV, Random, 95% CI) | 0.0 [0.0, 0.0] |
| 45.4 LCn3 > 400 ≤ 2400 mg/d | 18 | 34388 | Mean Difference (IV, Random, 95% CI) | ‐0.18 [‐0.25, ‐0.11] |
| 45.5 LCn3 > 2.4 ≤ 4.4 g/d | 5 | 1107 | Mean Difference (IV, Random, 95% CI) | ‐0.36 [‐0.53, ‐0.20] |
| 45.6 LCn3 > 4.4 g/d | 2 | 84 | Mean Difference (IV, Random, 95% CI) | ‐0.41 [‐0.68, ‐0.14] |
| 46 TG, fasting, mmoL/L ‐ LCn3 ‐ subgroup by replacement Show forest plot | 25 | Mean Difference (IV, Random, 95% CI) | Subtotals only | |
| Analysis 2.46  Comparison 2 High vs low LCn3 omega‐3 fats (secondary outcomes), Outcome 46 TG, fasting, mmoL/L ‐ LCn3 ‐ subgroup by replacement. | ||||
| 46.1 N‐3 replacing SFA | 2 | 429 | Mean Difference (IV, Random, 95% CI) | ‐0.27 [‐0.59, 0.04] |
| 46.2 N‐3 replacing MUFA | 13 | 14634 | Mean Difference (IV, Random, 95% CI) | ‐0.18 [‐0.25, ‐0.10] |
| 46.3 N‐3 replacing n‐6 | 5 | 876 | Mean Difference (IV, Random, 95% CI) | ‐0.27 [‐0.45, ‐0.08] |
| 46.4 N‐3 replacing carbs/sugars | 1 | 258 | Mean Difference (IV, Random, 95% CI) | ‐0.5 [‐1.49, 0.49] |
| 46.5 N‐3 replacing nil/low n‐3 placebo | 4 | 19357 | Mean Difference (IV, Random, 95% CI) | ‐0.18 [‐0.51, 0.14] |
| 46.6 Replacement unclear | 2 | 454 | Mean Difference (IV, Random, 95% CI) | ‐0.38 [‐0.57, ‐0.19] |
| 47 TG, fasting, mmoL/L ‐ LCn3 ‐ subgroup by intervention type Show forest plot | 25 | Mean Difference (IV, Random, 95% CI) | Subtotals only | |
| Analysis 2.47  Comparison 2 High vs low LCn3 omega‐3 fats (secondary outcomes), Outcome 47 TG, fasting, mmoL/L ‐ LCn3 ‐ subgroup by intervention type. | ||||
| 47.1 Dietary advice | 1 | 71 | Mean Difference (IV, Random, 95% CI) | 0.02 [‐0.36, 0.40] |
| 47.2 Supplemental foods | 1 | 1210 | Mean Difference (IV, Random, 95% CI) | ‐0.03 [‐0.15, 0.09] |
| 47.3 Supplement (capsule) | 22 | 34137 | Mean Difference (IV, Random, 95% CI) | ‐0.19 [‐0.38, ‐0.00] |
| 47.4 Any combination | 1 | 161 | Mean Difference (IV, Random, 95% CI) | 0.01 [‐0.28, 0.30] |
| 48 TG, fasting, mmoL/L ‐ LCn3 ‐ subgroup by duration Show forest plot | 25 | Mean Difference (IV, Random, 95% CI) | Subtotals only | |
| Analysis 2.48  Comparison 2 High vs low LCn3 omega‐3 fats (secondary outcomes), Outcome 48 TG, fasting, mmoL/L ‐ LCn3 ‐ subgroup by duration. | ||||
| 48.1 Medium duration 1 to < 2 years in study | 13 | 1880 | Mean Difference (IV, Random, 95% CI) | ‐0.27 [‐0.36, ‐0.19] |
| 48.2 Medium‐long duration: 2 to < 4 years in study | 9 | 2310 | Mean Difference (IV, Random, 95% CI) | ‐0.16 [‐0.31, ‐0.02] |
| 48.3 Long duration ≥ 4 years in study | 3 | 31389 | Mean Difference (IV, Random, 95% CI) | ‐0.20 [‐0.32, ‐0.07] |
| 49 TG, fasting, mmoL/L ‐ LCn3 ‐ subgroup by primary or secondary prevention Show forest plot | 25 | Mean Difference (IV, Random, 95% CI) | Subtotals only | |
| Analysis 2.49  Comparison 2 High vs low LCn3 omega‐3 fats (secondary outcomes), Outcome 49 TG, fasting, mmoL/L ‐ LCn3 ‐ subgroup by primary or secondary prevention. | ||||
| 49.1 Primary prevention | 17 | 33114 | Mean Difference (IV, Random, 95% CI) | ‐0.20 [‐0.26, ‐0.14] |
| 49.2 Secondary prevention | 8 | 2465 | Mean Difference (IV, Random, 95% CI) | ‐0.27 [‐0.44, ‐0.10] |
| 50 TG, fasting, mmoL/L ‐ LCn3 ‐ subgroup by statin use Show forest plot | 25 | Mean Difference (IV, Random, 95% CI) | Subtotals only | |
| Analysis 2.50  Comparison 2 High vs low LCn3 omega‐3 fats (secondary outcomes), Outcome 50 TG, fasting, mmoL/L ‐ LCn3 ‐ subgroup by statin use. | ||||
| 50.1 LCn3 ‐ ≥ 50% of control group on statins | 5 | 32557 | Mean Difference (IV, Random, 95% CI) | ‐0.11 [‐0.21, ‐0.01] |
| 50.2 LCn3 ‐ < 50% of control group on statins | 14 | 2414 | Mean Difference (IV, Random, 95% CI) | ‐0.27 [‐0.36, ‐0.18] |
| 50.3 LCn3 ‐ use of statins unclear | 6 | 608 | Mean Difference (IV, Random, 95% CI) | ‐0.23 [‐0.38, ‐0.08] |
| 51 High‐density lipoprotein, serum, mmoL/L ‐ LCn3 Show forest plot | 27 | 37237 | Mean Difference (IV, Random, 95% CI) | 0.02 [0.00, 0.04] |
| Analysis 2.51  Comparison 2 High vs low LCn3 omega‐3 fats (secondary outcomes), Outcome 51 High‐density lipoprotein, serum, mmoL/L ‐ LCn3. | ||||
| 52 HDL, mmoL/L ‐ LCn3 ‐ SA by summary risk of bias Show forest plot | 27 | 37237 | Mean Difference (IV, Random, 95% CI) | 0.03 [0.01, 0.05] |
| Analysis 2.52  Comparison 2 High vs low LCn3 omega‐3 fats (secondary outcomes), Outcome 52 HDL, mmoL/L ‐ LCn3 ‐ SA by summary risk of bias. | ||||
| 52.1 Low risk of bias | 8 | 14892 | Mean Difference (IV, Random, 95% CI) | 0.03 [‐0.01, 0.07] |
| 52.2 Moderate/high risk of bias | 19 | 22345 | Mean Difference (IV, Random, 95% CI) | 0.03 [0.00, 0.06] |
| 53 HDL, mmoL/L ‐ LCn3 ‐ SA by compliance and study size Show forest plot | 20 | Mean Difference (IV, Random, 95% CI) | Subtotals only | |
| Analysis 2.53  Comparison 2 High vs low LCn3 omega‐3 fats (secondary outcomes), Outcome 53 HDL, mmoL/L ‐ LCn3 ‐ SA by compliance and study size. | ||||
| 53.1 SA ‐ low risk of compliance bias | 13 | 3202 | Mean Difference (IV, Random, 95% CI) | 0.05 [0.01, 0.10] |
| 53.2 SA ‐ 100+ randomised | 15 | 36573 | Mean Difference (IV, Random, 95% CI) | 0.03 [0.00, 0.05] |
| 54 HDL, mmoL/L ‐ LCn3 ‐ subgroup by dose Show forest plot | 27 | Mean Difference (IV, Random, 95% CI) | Subtotals only | |
| Analysis 2.54  Comparison 2 High vs low LCn3 omega‐3 fats (secondary outcomes), Outcome 54 HDL, mmoL/L ‐ LCn3 ‐ subgroup by dose. | ||||
| 54.1 LCn3 ≤ 150 mg/d | 0 | 0 | Mean Difference (IV, Random, 95% CI) | 0.0 [0.0, 0.0] |
| 54.2 LCn3 > 150 ≤ 250 mg/d | 0 | 0 | Mean Difference (IV, Random, 95% CI) | 0.0 [0.0, 0.0] |
| 54.3 LCn3 > 250 ≤ 400 mg/d | 0 | 0 | Mean Difference (IV, Random, 95% CI) | 0.0 [0.0, 0.0] |
| 54.4 LCn3 > 400 ≤ 2400 mg/d | 19 | 35972 | Mean Difference (IV, Random, 95% CI) | 0.02 [‐0.00, 0.04] |
| 54.5 LCn3 > 2.4 ≤ 4.4 g/d | 7 | 1206 | Mean Difference (IV, Random, 95% CI) | 0.06 [0.00, 0.12] |
| 54.6 LCn3 > 4.4 g/d | 1 | 59 | Mean Difference (IV, Random, 95% CI) | 0.0 [‐0.16, 0.16] |
| 55 HDL, mmoL/L ‐ LCn3 ‐ subgroup by replacement Show forest plot | 27 | Mean Difference (IV, Random, 95% CI) | Subtotals only | |
| Analysis 2.55  Comparison 2 High vs low LCn3 omega‐3 fats (secondary outcomes), Outcome 55 HDL, mmoL/L ‐ LCn3 ‐ subgroup by replacement. | ||||
| 55.1 N‐3 replacing SFA | 3 | 2143 | Mean Difference (IV, Random, 95% CI) | ‐0.02 [‐0.10, 0.07] |
| 55.2 N‐3 replacing MUFA | 15 | 16505 | Mean Difference (IV, Random, 95% CI) | 0.02 [‐0.01, 0.06] |
| 55.3 N‐3 replacing n‐6 | 4 | 850 | Mean Difference (IV, Random, 95% CI) | 0.04 [‐0.01, 0.09] |
| 55.4 N‐3 replacing carbs/sugars | 1 | 258 | Mean Difference (IV, Random, 95% CI) | 0.10 [‐0.17, 0.37] |
| 55.5 N‐3 replacing nil/low n‐3 placebo | 5 | 19431 | Mean Difference (IV, Random, 95% CI) | 0.04 [‐0.03, 0.11] |
| 55.6 Replacement unclear | 2 | 193 | Mean Difference (IV, Random, 95% CI) | 0.05 [‐0.10, 0.20] |
| 56 HDL, mmoL/L ‐ LCn3 ‐ subgroup by intervention type Show forest plot | 27 | Mean Difference (IV, Random, 95% CI) | Subtotals only | |
| Analysis 2.56  Comparison 2 High vs low LCn3 omega‐3 fats (secondary outcomes), Outcome 56 HDL, mmoL/L ‐ LCn3 ‐ subgroup by intervention type. | ||||
| 56.1 Dietary advice | 2 | 1785 | Mean Difference (IV, Random, 95% CI) | 0.01 [‐0.02, 0.04] |
| 56.2 Supplemental foods | 1 | 1210 | Mean Difference (IV, Random, 95% CI) | 0.03 [0.00, 0.06] |
| 56.3 Supplement (capsule) | 21 | 34008 | Mean Difference (IV, Random, 95% CI) | 0.03 [0.00, 0.06] |
| 56.4 Any combination | 3 | 234 | Mean Difference (IV, Random, 95% CI) | 0.10 [‐0.10, 0.31] |
| 57 HDL, mmoL/L ‐ LCn3 ‐ subgroup by duration Show forest plot | 27 | Mean Difference (IV, Random, 95% CI) | Subtotals only | |
| Analysis 2.57  Comparison 2 High vs low LCn3 omega‐3 fats (secondary outcomes), Outcome 57 HDL, mmoL/L ‐ LCn3 ‐ subgroup by duration. | ||||
| 57.1 Medium duration 1 to < 2 years in study | 13 | 1562 | Mean Difference (IV, Random, 95% CI) | 0.08 [0.01, 0.14] |
| 57.2 Medium‐long duration: 2 to < 4 years in study | 11 | 4286 | Mean Difference (IV, Random, 95% CI) | 0.02 [‐0.01, 0.04] |
| 57.3 Long duration ≥ 4 years in study | 3 | 31389 | Mean Difference (IV, Random, 95% CI) | 0.00 [‐0.01, 0.01] |
| 58 HDL, mmoL/L ‐ LCn3 ‐ subgroup by primary or secondary prevention Show forest plot | 26 | Mean Difference (IV, Random, 95% CI) | Subtotals only | |
| Analysis 2.58  Comparison 2 High vs low LCn3 omega‐3 fats (secondary outcomes), Outcome 58 HDL, mmoL/L ‐ LCn3 ‐ subgroup by primary or secondary prevention. | ||||
| 58.1 Primary prevention | 17 | 32856 | Mean Difference (IV, Random, 95% CI) | 0.03 [‐0.00, 0.05] |
| 58.2 Secondary prevention | 9 | 4307 | Mean Difference (IV, Random, 95% CI) | 0.03 [‐0.01, 0.07] |
| 59 HDL, mmoL/L ‐ LCn3 ‐ subgroup by statin use Show forest plot | 27 | Mean Difference (IV, Random, 95% CI) | Subtotals only | |
| Analysis 2.59  Comparison 2 High vs low LCn3 omega‐3 fats (secondary outcomes), Outcome 59 HDL, mmoL/L ‐ LCn3 ‐ subgroup by statin use. | ||||
| 59.1 LCn3 ‐ ≥ 50% of control group on statins | 7 | 32894 | Mean Difference (IV, Random, 95% CI) | 0.01 [‐0.01, 0.03] |
| 59.2 LCn3 ‐ < 50% of control group on statins | 13 | 3690 | Mean Difference (IV, Random, 95% CI) | 0.04 [‐0.00, 0.08] |
| 59.3 LCn3 ‐ use of statins unclear | 7 | 653 | Mean Difference (IV, Random, 95% CI) | 0.07 [‐0.07, 0.21] |
| 60 Low‐density lipoprotein, serum, mmoL/L ‐ LCn3 Show forest plot | 23 | 35035 | Mean Difference (IV, Random, 95% CI) | 0.01 [‐0.01, 0.03] |
| Analysis 2.60  Comparison 2 High vs low LCn3 omega‐3 fats (secondary outcomes), Outcome 60 Low‐density lipoprotein, serum, mmoL/L ‐ LCn3. | ||||
| 61 LDL, mmoL/L ‐ LCn3 ‐ SA by summary risk of bias Show forest plot | 23 | 35035 | Mean Difference (IV, Random, 95% CI) | 0.01 [‐0.01, 0.03] |
| Analysis 2.61  Comparison 2 High vs low LCn3 omega‐3 fats (secondary outcomes), Outcome 61 LDL, mmoL/L ‐ LCn3 ‐ SA by summary risk of bias. | ||||
| 61.1 Low risk of bias | 9 | 14840 | Mean Difference (IV, Random, 95% CI) | 0.02 [‐0.03, 0.07] |
| 61.2 Moderate/high risk of bias | 14 | 20195 | Mean Difference (IV, Random, 95% CI) | 0.00 [‐0.02, 0.03] |
| 62 LDL, mmoL/L ‐ LCn3 ‐ SA by compliance and study size Show forest plot | 17 | 37718 | Mean Difference (IV, Random, 95% CI) | 0.02 [‐0.01, 0.05] |
| Analysis 2.62  Comparison 2 High vs low LCn3 omega‐3 fats (secondary outcomes), Outcome 62 LDL, mmoL/L ‐ LCn3 ‐ SA by compliance and study size. | ||||
| 62.1 SA ‐ low risk of compliance bias | 13 | 3165 | Mean Difference (IV, Random, 95% CI) | 0.05 [‐0.02, 0.11] |
| 62.2 SA ‐ 100+ randomised | 14 | 34553 | Mean Difference (IV, Random, 95% CI) | 0.01 [‐0.02, 0.04] |
| 63 LDL, mmoL/L ‐ LCn3 ‐ subgroup by dose Show forest plot | 23 | Mean Difference (IV, Random, 95% CI) | Subtotals only | |
| Analysis 2.63  Comparison 2 High vs low LCn3 omega‐3 fats (secondary outcomes), Outcome 63 LDL, mmoL/L ‐ LCn3 ‐ subgroup by dose. | ||||
| 63.1 LCn3 ≤ 150 mg/d | 0 | 0 | Mean Difference (IV, Random, 95% CI) | 0.0 [0.0, 0.0] |
| 63.2 LCn3 > 150 ≤ 250 mg/d | 0 | 0 | Mean Difference (IV, Random, 95% CI) | 0.0 [0.0, 0.0] |
| 63.3 LCn3 > 250 ≤ 400 mg/d | 0 | 0 | Mean Difference (IV, Random, 95% CI) | 0.0 [0.0, 0.0] |
| 63.4 LCn3 > 400 ≤ 2400 mg/d | 16 | 34054 | Mean Difference (IV, Random, 95% CI) | 0.01 [‐0.01, 0.02] |
| 63.5 LCn3 > 2.4 ≤ 4.4 g/d | 5 | 893 | Mean Difference (IV, Random, 95% CI) | 0.01 [‐0.14, 0.15] |
| 63.6 LCn3 > 4.4 g/d | 2 | 88 | Mean Difference (IV, Random, 95% CI) | 0.22 [‐0.09, 0.54] |
| 64 LDL, mmoL/L ‐ LCn3 ‐ subgroup by replacement Show forest plot | 23 | Mean Difference (IV, Random, 95% CI) | Subtotals only | |
| Analysis 2.64  Comparison 2 High vs low LCn3 omega‐3 fats (secondary outcomes), Outcome 64 LDL, mmoL/L ‐ LCn3 ‐ subgroup by replacement. | ||||
| 64.1 N‐3 replacing SFA | 2 | 429 | Mean Difference (IV, Random, 95% CI) | 0.17 [‐0.14, 0.47] |
| 64.2 N‐3 replacing MUFA | 14 | 14710 | Mean Difference (IV, Random, 95% CI) | 0.01 [‐0.03, 0.05] |
| 64.3 N‐3 replacing n‐6 | 2 | 242 | Mean Difference (IV, Random, 95% CI) | 0.14 [‐0.26, 0.55] |
| 64.4 N‐3 replacing carbs/sugars | 1 | 258 | Mean Difference (IV, Random, 95% CI) | 0.20 [‐0.51, 0.91] |
| 64.5 N‐3 replacing nil/low n‐3 placebo | 3 | 19297 | Mean Difference (IV, Random, 95% CI) | 0.00 [‐0.02, 0.02] |
| 64.6 Replacement unclear | 3 | 528 | Mean Difference (IV, Random, 95% CI) | 0.10 [‐0.03, 0.23] |
| 65 LDL, mmoL/L ‐ LCn3 ‐ subgroup by intervention type Show forest plot | 23 | Mean Difference (IV, Random, 95% CI) | Subtotals only | |
| Analysis 2.65  Comparison 2 High vs low LCn3 omega‐3 fats (secondary outcomes), Outcome 65 LDL, mmoL/L ‐ LCn3 ‐ subgroup by intervention type. | ||||
| 65.1 Dietary advice | 1 | 71 | Mean Difference (IV, Random, 95% CI) | 0.08 [‐0.22, 0.38] |
| 65.2 Supplemental foods | 1 | 1124 | Mean Difference (IV, Random, 95% CI) | ‐0.02 [‐0.10, 0.06] |
| 65.3 Supplement (capsule) | 19 | 33768 | Mean Difference (IV, Random, 95% CI) | 0.01 [‐0.01, 0.03] |
| 65.4 Any combination | 2 | 72 | Mean Difference (IV, Random, 95% CI) | 0.08 [‐0.44, 0.61] |
| 66 LDL, mmoL/L ‐ LCn3 ‐ subgroup by duration Show forest plot | 23 | Mean Difference (IV, Random, 95% CI) | Subtotals only | |
| Analysis 2.66  Comparison 2 High vs low LCn3 omega‐3 fats (secondary outcomes), Outcome 66 LDL, mmoL/L ‐ LCn3 ‐ subgroup by duration. | ||||
| 66.1 Medium duration 1 to < 2 years in study | 14 | 1862 | Mean Difference (IV, Random, 95% CI) | 0.06 [‐0.03, 0.14] |
| 66.2 Medium‐long duration: 2 to < 4 years in study | 6 | 1784 | Mean Difference (IV, Random, 95% CI) | ‐0.01 [‐0.08, 0.06] |
| 66.3 Long duration ≥ 4 years in study | 3 | 31389 | Mean Difference (IV, Random, 95% CI) | 0.03 [‐0.04, 0.10] |
| 67 LDL, mmoL/L ‐ LCn3 ‐ subgroup by primary or secondary prevention Show forest plot | 23 | Mean Difference (IV, Random, 95% CI) | Subtotals only | |
| Analysis 2.67  Comparison 2 High vs low LCn3 omega‐3 fats (secondary outcomes), Outcome 67 LDL, mmoL/L ‐ LCn3 ‐ subgroup by primary or secondary prevention. | ||||
| 67.1 Primary prevention | 16 | 32717 | Mean Difference (IV, Random, 95% CI) | 0.01 [‐0.01, 0.03] |
| 67.2 Secondary prevention | 7 | 2318 | Mean Difference (IV, Random, 95% CI) | 0.01 [‐0.05, 0.08] |
| 68 LDL, mmoL/L ‐ LCn3 ‐ subgroup by statin use Show forest plot | 23 | Mean Difference (IV, Random, 95% CI) | Subtotals only | |
| Analysis 2.68  Comparison 2 High vs low LCn3 omega‐3 fats (secondary outcomes), Outcome 68 LDL, mmoL/L ‐ LCn3 ‐ subgroup by statin use. | ||||
| 68.1 LCn3 ‐ ≥ 50% of control group on statins | 7 | 32808 | Mean Difference (IV, Random, 95% CI) | 0.00 [‐0.02, 0.02] |
| 68.2 LCn3 ‐ < 50% of control group on statins | 9 | 1564 | Mean Difference (IV, Random, 95% CI) | 0.12 [0.03, 0.21] |
| 68.3 LCn3 ‐ use of statins unclear | 7 | 663 | Mean Difference (IV, Random, 95% CI) | ‐0.01 [‐0.17, 0.14] |
| Outcome or subgroup title | No. of studies | No. of participants | Statistical method | Effect size |
| 1 Blood pressure, mmHg ‐ LCn3 Show forest plot | 15 | Mean Difference (IV, Random, 95% CI) | Subtotals only | |
| Analysis 3.1  Comparison 3 High vs low LCn3 omega‐3 fats (tertiary outcomes), Outcome 1 Blood pressure, mmHg ‐ LCn3. | ||||
| 1.1 Systolic BP ‐ LCn3 | 15 | 34413 | Mean Difference (IV, Random, 95% CI) | 0.02 [‐0.32, 0.35] |
| 1.2 Diastolic BP ‐ LCn3 | 14 | 35386 | Mean Difference (IV, Random, 95% CI) | ‐0.02 [‐0.22, 0.17] |
| 2 Serious adverse events ‐ LCn3 Show forest plot | 14 | Risk Ratio (M‐H, Random, 95% CI) | Subtotals only | |
| Analysis 3.2  Comparison 3 High vs low LCn3 omega‐3 fats (tertiary outcomes), Outcome 2 Serious adverse events ‐ LCn3. | ||||
| 2.1 Any serious adverse events | 1 | 402 | Risk Ratio (M‐H, Random, 95% CI) | 1.05 [0.78, 1.41] |
| 2.2 Bleeding | 8 | 45562 | Risk Ratio (M‐H, Random, 95% CI) | 1.06 [0.73, 1.52] |
| 2.3 GI hospitalisation | 1 | 200 | Risk Ratio (M‐H, Random, 95% CI) | 1.75 [0.53, 5.79] |
| 2.4 Pulmonary embolus or DVT ‐ LCn3 | 4 | 3011 | Risk Ratio (M‐H, Random, 95% CI) | 1.25 [0.41, 3.78] |
| 2.5 Progression to advanced AMD (age‐related macular degeneration) | 1 | 4203 | Risk Ratio (M‐H, Random, 95% CI) | 0.96 [0.90, 1.02] |
| 3 Side effects ‐ LCn3 Show forest plot | 33 | Risk Ratio (M‐H, Random, 95% CI) | Subtotals only | |
| Analysis 3.3  Comparison 3 High vs low LCn3 omega‐3 fats (tertiary outcomes), Outcome 3 Side effects ‐ LCn3. | ||||
| 3.1 Dropouts due to side effects | 23 | 16755 | Risk Ratio (M‐H, Random, 95% CI) | 1.16 [0.99, 1.36] |
| 3.2 Abdominal pain or discomfort | 7 | 14650 | Risk Ratio (M‐H, Random, 95% CI) | 1.10 [0.84, 1.45] |
| 3.3 Diarrhoea | 10 | 2428 | Risk Ratio (M‐H, Random, 95% CI) | 1.15 [0.92, 1.43] |
| 3.4 Nausea | 5 | 1234 | Risk Ratio (M‐H, Random, 95% CI) | 1.73 [1.23, 2.44] |
| 3.5 Any gastrointestinal side effect ‐ LCn3 fats | 29 | 65185 | Risk Ratio (M‐H, Random, 95% CI) | 1.12 [0.94, 1.34] |
| 3.6 Skin problems (itching, rashes) | 8 | 36186 | Risk Ratio (M‐H, Random, 95% CI) | 1.04 [0.47, 2.30] |
| 3.7 Headache or worsening migraine | 3 | 991 | Risk Ratio (M‐H, Random, 95% CI) | 0.80 [0.48, 1.35] |
| 3.8 Reflux | 1 | 202 | Risk Ratio (M‐H, Random, 95% CI) | 1.42 [0.71, 2.81] |
| 3.9 Pain (joint, lumbar, muscle pain) | 1 | 18645 | Risk Ratio (M‐H, Random, 95% CI) | 0.80 [0.64, 0.99] |
| 3.10 All side effects combined | 13 | 38904 | Risk Ratio (M‐H, Random, 95% CI) | 1.01 [0.95, 1.08] |
| 4 Dropouts ‐ LCn3 Show forest plot | 30 | 31321 | Risk Ratio (M‐H, Random, 95% CI) | 1.02 [0.95, 1.09] |
| Analysis 3.4  Comparison 3 High vs low LCn3 omega‐3 fats (tertiary outcomes), Outcome 4 Dropouts ‐ LCn3. | ||||
| Outcome or subgroup title | No. of studies | No. of participants | Statistical method | Effect size |
| 1 All‐cause mortality (overall) ‐ ALA Show forest plot | 5 | 19327 | Risk Ratio (M‐H, Random, 95% CI) | 1.01 [0.84, 1.20] |
| Analysis 4.1  Comparison 4 High vs low ALA omega‐3 fat (primary outcomes), Outcome 1 All‐cause mortality (overall) ‐ ALA. | ||||
| 2 All‐cause mortality ‐ ALA ‐ sensitivity analysis (SA) fixed‐effect Show forest plot | 5 | 16923 | Risk Ratio (M‐H, Fixed, 95% CI) | 1.06 [0.84, 1.34] |
| Analysis 4.2  Comparison 4 High vs low ALA omega‐3 fat (primary outcomes), Outcome 2 All‐cause mortality ‐ ALA ‐ sensitivity analysis (SA) fixed‐effect. | ||||
| 3 All‐cause mortality ‐ ALA ‐ SA by summary risk of bias Show forest plot | 5 | 19327 | Risk Ratio (M‐H, Random, 95% CI) | 1.01 [0.84, 1.20] |
| Analysis 4.3  Comparison 4 High vs low ALA omega‐3 fat (primary outcomes), Outcome 3 All‐cause mortality ‐ ALA ‐ SA by summary risk of bias. | ||||
| 3.1 Low risk of bias | 3 | 5213 | Risk Ratio (M‐H, Random, 95% CI) | 1.02 [0.72, 1.45] |
| 3.2 Moderate/high risk of bias | 2 | 14114 | Risk Ratio (M‐H, Random, 95% CI) | 1.09 [0.71, 1.67] |
| 4 All‐cause mortality ‐ ALA ‐ SA by compliance and study size Show forest plot | 5 | Risk Ratio (M‐H, Random, 95% CI) | Subtotals only | |
| Analysis 4.4  Comparison 4 High vs low ALA omega‐3 fat (primary outcomes), Outcome 4 All‐cause mortality ‐ ALA ‐ SA by compliance and study size. | ||||
| 4.1 SA ‐ low risk of compliance bias | 3 | 5811 | Risk Ratio (M‐H, Random, 95% CI) | 1.05 [0.68, 1.63] |
| 4.2 SA ‐ 100+ randomised | 5 | 19327 | Risk Ratio (M‐H, Random, 95% CI) | 1.01 [0.84, 1.20] |
| 5 All‐cause mortality ‐ ALA ‐ subgroup by dose Show forest plot | 5 | 19327 | Risk Ratio (M‐H, Random, 95% CI) | 1.01 [0.84, 1.20] |
| Analysis 4.5  Comparison 4 High vs low ALA omega‐3 fat (primary outcomes), Outcome 5 All‐cause mortality ‐ ALA ‐ subgroup by dose. | ||||
| 5.1 ALA low < 5 g/d | 1 | 4837 | Risk Ratio (M‐H, Random, 95% CI) | 0.98 [0.80, 1.19] |
| 5.2 ALA high ≥ 5 g/d | 4 | 14490 | Risk Ratio (M‐H, Random, 95% CI) | 1.16 [0.77, 1.75] |
| 6 All‐cause mortality ‐ ALA ‐ subgroup by replacement Show forest plot | 5 | Risk Ratio (M‐H, Random, 95% CI) | Subtotals only | |
| Analysis 4.6  Comparison 4 High vs low ALA omega‐3 fat (primary outcomes), Outcome 6 All‐cause mortality ‐ ALA ‐ subgroup by replacement. | ||||
| 6.1 ALA replacing SFA | 0 | 0 | Risk Ratio (M‐H, Random, 95% CI) | 0.0 [0.0, 0.0] |
| 6.2 ALA replacing MUFA | 1 | 4837 | Risk Ratio (M‐H, Random, 95% CI) | 0.98 [0.80, 1.19] |
| 6.3 ALA replacing n‐6 | 2 | 13672 | Risk Ratio (M‐H, Random, 95% CI) | 1.37 [0.48, 3.86] |
| 6.4 ALA replacing CHO | 0 | 0 | Risk Ratio (M‐H, Random, 95% CI) | 0.0 [0.0, 0.0] |
| 6.5 ALA replacing nil/low n‐3 placebo | 0 | 0 | Risk Ratio (M‐H, Random, 95% CI) | 0.0 [0.0, 0.0] |
| 6.6 ALA replacement unclear | 2 | 818 | Risk Ratio (M‐H, Random, 95% CI) | 2.78 [0.29, 26.49] |
| 7 All cause mortality ‐ ALA ‐ subgroup by intervention type Show forest plot | 5 | 19327 | Risk Ratio (M‐H, Random, 95% CI) | 1.01 [0.84, 1.20] |
| Analysis 4.7  Comparison 4 High vs low ALA omega‐3 fat (primary outcomes), Outcome 7 All cause mortality ‐ ALA ‐ subgroup by intervention type. | ||||
| 7.1 Dietary advice | 0 | 0 | Risk Ratio (M‐H, Random, 95% CI) | 0.0 [0.0, 0.0] |
| 7.2 Supplemental foods | 4 | 5921 | Risk Ratio (M‐H, Random, 95% CI) | 0.99 [0.82, 1.21] |
| 7.3 Supplements (capsule) | 1 | 13406 | Risk Ratio (M‐H, Random, 95% CI) | 1.07 [0.70, 1.64] |
| 7.4 Any combination | 0 | 0 | Risk Ratio (M‐H, Random, 95% CI) | 0.0 [0.0, 0.0] |
| 8 All‐cause mortality ‐ ALA ‐ subgroup by duration Show forest plot | 5 | 19327 | Risk Ratio (M‐H, Random, 95% CI) | 1.01 [0.84, 1.20] |
| Analysis 4.8  Comparison 4 High vs low ALA omega‐3 fat (primary outcomes), Outcome 8 All‐cause mortality ‐ ALA ‐ subgroup by duration. | ||||
| 8.1 Medium duration 1 to < 2 years in study | 2 | 13516 | Risk Ratio (M‐H, Random, 95% CI) | 1.09 [0.71, 1.67] |
| 8.2 Medium‐long duration: 2 to < 4 years in study | 3 | 5811 | Risk Ratio (M‐H, Random, 95% CI) | 1.05 [0.68, 1.63] |
| 8.3 Long duration: ≥ 4 years in study | 0 | 0 | Risk Ratio (M‐H, Random, 95% CI) | 0.0 [0.0, 0.0] |
| 9 All‐cause mortality ‐ ALA ‐ subgroup by primary or secondary prevention Show forest plot | 5 | 19327 | Risk Ratio (M‐H, Random, 95% CI) | 1.01 [0.84, 1.20] |
| Analysis 4.9  Comparison 4 High vs low ALA omega‐3 fat (primary outcomes), Outcome 9 All‐cause mortality ‐ ALA ‐ subgroup by primary or secondary prevention. | ||||
| 9.1 Primary CVD prevention | 3 | 14380 | Risk Ratio (M‐H, Random, 95% CI) | 1.14 [0.75, 1.74] |
| 9.2 Secondary CVD prevention | 2 | 4947 | Risk Ratio (M‐H, Random, 95% CI) | 0.98 [0.81, 1.19] |
| 10 All‐cause mortality ‐ ALA ‐ subgroup by statin use Show forest plot | 5 | 16923 | Risk Ratio (M‐H, Random, 95% CI) | 1.05 [0.84, 1.33] |
| Analysis 4.10  Comparison 4 High vs low ALA omega‐3 fat (primary outcomes), Outcome 10 All‐cause mortality ‐ ALA ‐ subgroup by statin use. | ||||
| 10.1 ALA ‐ ≥ 50% of control group on statins | 2 | 2543 | Risk Ratio (M‐H, Random, 95% CI) | 1.02 [0.77, 1.34] |
| 10.2 ALA ‐ < 50% of control group on statins | 3 | 14380 | Risk Ratio (M‐H, Random, 95% CI) | 1.14 [0.75, 1.74] |
| 11 Cardiovascular mortality (overall) ‐ ALA Show forest plot | 4 | 18619 | Risk Ratio (M‐H, Random, 95% CI) | 0.96 [0.74, 1.25] |
| Analysis 4.11  Comparison 4 High vs low ALA omega‐3 fat (primary outcomes), Outcome 11 Cardiovascular mortality (overall) ‐ ALA. | ||||
| 12 CVD mortality ‐ ALA ‐ SA fixed‐effect Show forest plot | 4 | 18619 | Risk Ratio (M‐H, Fixed, 95% CI) | 0.96 [0.74, 1.25] |
| Analysis 4.12  Comparison 4 High vs low ALA omega‐3 fat (primary outcomes), Outcome 12 CVD mortality ‐ ALA ‐ SA fixed‐effect. | ||||
| 13 CVD mortality ‐ ALA ‐ SA by summary risk of bias Show forest plot | 4 | 18619 | Risk Ratio (M‐H, Random, 95% CI) | 0.96 [0.74, 1.25] |
| Analysis 4.13  Comparison 4 High vs low ALA omega‐3 fat (primary outcomes), Outcome 13 CVD mortality ‐ ALA ‐ SA by summary risk of bias. | ||||
| 13.1 Low risk of bias | 3 | 5213 | Risk Ratio (M‐H, Random, 95% CI) | 0.95 [0.70, 1.28] |
| 13.2 Moderate/high risk of bias | 1 | 13406 | Risk Ratio (M‐H, Random, 95% CI) | 1.00 [0.58, 1.70] |
| 14 CVD mortality ‐ ALA ‐ SA by compliance and study size Show forest plot | 4 | 23722 | Risk Ratio (M‐H, Random, 95% CI) | 0.95 [0.78, 1.16] |
| Analysis 4.14  Comparison 4 High vs low ALA omega‐3 fat (primary outcomes), Outcome 14 CVD mortality ‐ ALA ‐ SA by compliance and study size. | ||||
| 14.1 SA ‐ low risk of compliance bias | 2 | 5103 | Risk Ratio (M‐H, Random, 95% CI) | 0.94 [0.70, 1.27] |
| 14.2 SA ‐ 100+ randomised | 4 | 18619 | Risk Ratio (M‐H, Random, 95% CI) | 0.96 [0.74, 1.25] |
| 15 CVD mortality ‐ ALA ‐ subgroup by dose Show forest plot | 4 | 18619 | Risk Ratio (M‐H, Random, 95% CI) | 0.96 [0.74, 1.25] |
| Analysis 4.15  Comparison 4 High vs low ALA omega‐3 fat (primary outcomes), Outcome 15 CVD mortality ‐ ALA ‐ subgroup by dose. | ||||
| 15.1 ALA low < 5 g/d | 1 | 4837 | Risk Ratio (M‐H, Random, 95% CI) | 0.94 [0.69, 1.27] |
| 15.2 ALA high ≥ 5 g/d | 3 | 13782 | Risk Ratio (M‐H, Random, 95% CI) | 1.04 [0.62, 1.73] |
| 16 CVD mortality ‐ ALA ‐ subgroup by replacement Show forest plot | 4 | Risk Ratio (M‐H, Random, 95% CI) | Subtotals only | |
| Analysis 4.16  Comparison 4 High vs low ALA omega‐3 fat (primary outcomes), Outcome 16 CVD mortality ‐ ALA ‐ subgroup by replacement. | ||||
| 16.1 N‐3 replacing SFA | 0 | 0 | Risk Ratio (M‐H, Random, 95% CI) | 0.0 [0.0, 0.0] |
| 16.2 N‐3 replacing MUFA | 1 | 4837 | Risk Ratio (M‐H, Random, 95% CI) | 0.94 [0.69, 1.27] |
| 16.3 N‐3 replacing n‐6 | 2 | 13672 | Risk Ratio (M‐H, Random, 95% CI) | 1.01 [0.60, 1.70] |
| 16.4 N‐3 replacing carbohydrates/sugars | 0 | 0 | Risk Ratio (M‐H, Random, 95% CI) | 0.0 [0.0, 0.0] |
| 16.5 N‐3 replacing nil/low n‐3 placebo | 0 | 0 | Risk Ratio (M‐H, Random, 95% CI) | 0.0 [0.0, 0.0] |
| 16.6 Replacement unclear | 1 | 110 | Risk Ratio (M‐H, Random, 95% CI) | 2.69 [0.11, 64.74] |
| 17 CVD mortality ‐ ALA ‐ subgroup by intervention type Show forest plot | 4 | 18619 | Risk Ratio (M‐H, Random, 95% CI) | 0.96 [0.74, 1.25] |
| Analysis 4.17  Comparison 4 High vs low ALA omega‐3 fat (primary outcomes), Outcome 17 CVD mortality ‐ ALA ‐ subgroup by intervention type. | ||||
| 17.1 Dietary advice | 0 | 0 | Risk Ratio (M‐H, Random, 95% CI) | 0.0 [0.0, 0.0] |
| 17.2 Supplemental foods | 3 | 5213 | Risk Ratio (M‐H, Random, 95% CI) | 0.95 [0.70, 1.28] |
| 17.3 Supplements (capsule) | 1 | 13406 | Risk Ratio (M‐H, Random, 95% CI) | 1.00 [0.58, 1.70] |
| 17.4 Any combination | 0 | 0 | Risk Ratio (M‐H, Random, 95% CI) | 0.0 [0.0, 0.0] |
| 18 CVD mortality ‐ ALA ‐ subgroup by duration Show forest plot | 4 | 18619 | Risk Ratio (M‐H, Random, 95% CI) | 0.96 [0.74, 1.25] |
| Analysis 4.18  Comparison 4 High vs low ALA omega‐3 fat (primary outcomes), Outcome 18 CVD mortality ‐ ALA ‐ subgroup by duration. | ||||
| 18.1 Medium duration 1 to < 2 years in study | 2 | 13516 | Risk Ratio (M‐H, Random, 95% CI) | 1.02 [0.61, 1.73] |
| 18.2 Medium‐long duration: 2 to < 4 years in study | 2 | 5103 | Risk Ratio (M‐H, Random, 95% CI) | 0.94 [0.70, 1.27] |
| 18.3 Long duration: ≥ 4 years in study | 0 | 0 | Risk Ratio (M‐H, Random, 95% CI) | 0.0 [0.0, 0.0] |
| 19 CVD mortality ‐ ALA ‐ subgroup by primary or secondary prevention Show forest plot | 4 | 18619 | Risk Ratio (M‐H, Random, 95% CI) | 0.96 [0.74, 1.25] |
| Analysis 4.19  Comparison 4 High vs low ALA omega‐3 fat (primary outcomes), Outcome 19 CVD mortality ‐ ALA ‐ subgroup by primary or secondary prevention. | ||||
| 19.1 Primary prevention | 1 | 13406 | Risk Ratio (M‐H, Random, 95% CI) | 1.00 [0.58, 1.70] |
| 19.2 Secondary prevention | 3 | 5213 | Risk Ratio (M‐H, Random, 95% CI) | 0.95 [0.70, 1.28] |
| 20 CVD mortality ‐ ALA ‐ subgroup by statin uses Show forest plot | 4 | 18619 | Risk Ratio (M‐H, Random, 95% CI) | 0.96 [0.74, 1.25] |
| Analysis 4.20  Comparison 4 High vs low ALA omega‐3 fat (primary outcomes), Outcome 20 CVD mortality ‐ ALA ‐ subgroup by statin uses. | ||||
| 20.1 ALA ‐ ≥ 50% of control group on statins | 2 | 4947 | Risk Ratio (M‐H, Random, 95% CI) | 0.94 [0.70, 1.28] |
| 20.2 ALA ‐ < 50% of control group on statins | 2 | 13672 | Risk Ratio (M‐H, Random, 95% CI) | 1.01 [0.60, 1.70] |
| 21 Cardiovascular events (overall) ‐ ALA Show forest plot | 5 | 19327 | Risk Ratio (M‐H, Random, 95% CI) | 0.95 [0.83, 1.07] |
| Analysis 4.21  Comparison 4 High vs low ALA omega‐3 fat (primary outcomes), Outcome 21 Cardiovascular events (overall) ‐ ALA. | ||||
| 22 CVD events ‐ ALA ‐ SA fixed‐effect Show forest plot | 5 | 19327 | Risk Ratio (M‐H, Fixed, 95% CI) | 0.95 [0.84, 1.07] |
| Analysis 4.22  Comparison 4 High vs low ALA omega‐3 fat (primary outcomes), Outcome 22 CVD events ‐ ALA ‐ SA fixed‐effect. | ||||
| 23 CVD events ‐ ALA ‐ SA by summary risk of bias Show forest plot | 5 | 19327 | Risk Ratio (M‐H, Random, 95% CI) | 0.95 [0.83, 1.07] |
| Analysis 4.23  Comparison 4 High vs low ALA omega‐3 fat (primary outcomes), Outcome 23 CVD events ‐ ALA ‐ SA by summary risk of bias. | ||||
| 23.1 Low risk of bias | 3 | 5213 | Risk Ratio (M‐H, Random, 95% CI) | 0.91 [0.79, 1.04] |
| 23.2 Moderate/high risk of bias | 2 | 14114 | Risk Ratio (M‐H, Random, 95% CI) | 1.12 [0.84, 1.48] |
| 24 CVD events ‐ ALA ‐ SA by compliance and study size Show forest plot | 5 | Risk Ratio (M‐H, Random, 95% CI) | Subtotals only | |
| Analysis 4.24  Comparison 4 High vs low ALA omega‐3 fat (primary outcomes), Outcome 24 CVD events ‐ ALA ‐ SA by compliance and study size. | ||||
| 24.1 SA ‐ low risk of compliance bias | 3 | 5811 | Risk Ratio (M‐H, Random, 95% CI) | 0.90 [0.79, 1.04] |
| 24.2 SA ‐ 100+ randomised | 5 | 19327 | Risk Ratio (M‐H, Random, 95% CI) | 0.95 [0.83, 1.07] |
| 25 CVD events ‐ ALA ‐ subgroup by dose Show forest plot | 5 | 19327 | Risk Ratio (M‐H, Random, 95% CI) | 0.95 [0.83, 1.07] |
| Analysis 4.25  Comparison 4 High vs low ALA omega‐3 fat (primary outcomes), Outcome 25 CVD events ‐ ALA ‐ subgroup by dose. | ||||
| 25.1 ALA low < 5 g/d | 1 | 4837 | Risk Ratio (M‐H, Random, 95% CI) | 0.91 [0.79, 1.05] |
| 25.2 ALA high ≥ 5 g/d | 4 | 14490 | Risk Ratio (M‐H, Random, 95% CI) | 1.07 [0.82, 1.40] |
| 26 CVD events ‐ ALA ‐ subgroup by replacement Show forest plot | 5 | Risk Ratio (M‐H, Random, 95% CI) | Subtotals only | |
| Analysis 4.26  Comparison 4 High vs low ALA omega‐3 fat (primary outcomes), Outcome 26 CVD events ‐ ALA ‐ subgroup by replacement. | ||||
| 26.1 N‐3 replacing SFA | 0 | 0 | Risk Ratio (M‐H, Random, 95% CI) | 0.0 [0.0, 0.0] |
| 26.2 N‐3 replacing MUFA | 1 | 4837 | Risk Ratio (M‐H, Random, 95% CI) | 0.91 [0.79, 1.05] |
| 26.3 N‐3 replacing n‐6 | 2 | 13672 | Risk Ratio (M‐H, Random, 95% CI) | 0.76 [0.24, 2.41] |
| 26.4 N‐3 replacing carbohydrates/sugars | 0 | 0 | Risk Ratio (M‐H, Random, 95% CI) | 0.0 [0.0, 0.0] |
| 26.5 N‐3 replacing nil/low n‐3 placebo | 0 | 0 | Risk Ratio (M‐H, Random, 95% CI) | 0.0 [0.0, 0.0] |
| 26.6 Replacement unclear | 2 | 818 | Risk Ratio (M‐H, Random, 95% CI) | 0.93 [0.36, 2.43] |
| 27 CVD events ‐ ALA ‐ subgroup by intervention type Show forest plot | 6 | 19526 | Risk Ratio (M‐H, Random, 95% CI) | 0.95 [0.83, 1.07] |
| Analysis 4.27  Comparison 4 High vs low ALA omega‐3 fat (primary outcomes), Outcome 27 CVD events ‐ ALA ‐ subgroup by intervention type. | ||||
| 27.1 Dietary advice | 0 | 0 | Risk Ratio (M‐H, Random, 95% CI) | 0.0 [0.0, 0.0] |
| 27.2 Supplemental foods | 5 | 6120 | Risk Ratio (M‐H, Random, 95% CI) | 0.91 [0.79, 1.04] |
| 27.3 Supplements (capsule) | 1 | 13406 | Risk Ratio (M‐H, Random, 95% CI) | 1.13 [0.85, 1.51] |
| 27.4 Any combination | 0 | 0 | Risk Ratio (M‐H, Random, 95% CI) | 0.0 [0.0, 0.0] |
| 28 CVD events ‐ ALA ‐ subgroup by duration Show forest plot | 5 | 19327 | Risk Ratio (M‐H, Random, 95% CI) | 0.95 [0.83, 1.07] |
| Analysis 4.28  Comparison 4 High vs low ALA omega‐3 fat (primary outcomes), Outcome 28 CVD events ‐ ALA ‐ subgroup by duration. | ||||
| 28.1 Medium duration 1 to < 2 years in study | 2 | 13516 | Risk Ratio (M‐H, Random, 95% CI) | 1.13 [0.86, 1.50] |
| 28.2 Medium‐long duration: 2 to < 4 years in study | 3 | 5811 | Risk Ratio (M‐H, Random, 95% CI) | 0.90 [0.79, 1.04] |
| 28.3 Long duration: ≥ 4 years in study | 0 | 0 | Risk Ratio (M‐H, Random, 95% CI) | 0.0 [0.0, 0.0] |
| 29 CVD events ‐ ALA ‐ subgroup by primary or secondary prevention Show forest plot | 5 | 19327 | Risk Ratio (M‐H, Random, 95% CI) | 0.95 [0.83, 1.07] |
| Analysis 4.29  Comparison 4 High vs low ALA omega‐3 fat (primary outcomes), Outcome 29 CVD events ‐ ALA ‐ subgroup by primary or secondary prevention. | ||||
| 29.1 Primary prevention | 3 | 14380 | Risk Ratio (M‐H, Random, 95% CI) | 0.87 [0.46, 1.67] |
| 29.2 Secondary prevention | 2 | 4947 | Risk Ratio (M‐H, Random, 95% CI) | 0.92 [0.80, 1.05] |
| 30 CVD events ‐ ALA ‐ subgroup by statin use Show forest plot | 5 | 19327 | Risk Ratio (M‐H, Random, 95% CI) | 0.95 [0.83, 1.07] |
| Analysis 4.30  Comparison 4 High vs low ALA omega‐3 fat (primary outcomes), Outcome 30 CVD events ‐ ALA ‐ subgroup by statin use. | ||||
| 30.1 ALA ‐ ≥ 50% of control group on statins | 2 | 4947 | Risk Ratio (M‐H, Random, 95% CI) | 0.92 [0.80, 1.05] |
| 30.2 ALA ‐ < 50% of control group on statins | 3 | 14380 | Risk Ratio (M‐H, Random, 95% CI) | 0.87 [0.46, 1.67] |
| 31 Coronary heart disease mortality (overall) ‐ ALA Show forest plot | 3 | 18353 | Risk Ratio (M‐H, Random, 95% CI) | 0.95 [0.72, 1.26] |
| Analysis 4.31  Comparison 4 High vs low ALA omega‐3 fat (primary outcomes), Outcome 31 Coronary heart disease mortality (overall) ‐ ALA. | ||||
| 32 CHD mortality ‐ ALA ‐ SA fixed‐effect Show forest plot | 3 | 18353 | Risk Ratio (M‐H, Fixed, 95% CI) | 0.95 [0.72, 1.26] |
| Analysis 4.32  Comparison 4 High vs low ALA omega‐3 fat (primary outcomes), Outcome 32 CHD mortality ‐ ALA ‐ SA fixed‐effect. | ||||
| 33 CHD mortality ‐ ALA ‐ SA by summary risk of bias Show forest plot | 3 | 18353 | Risk Ratio (M‐H, Random, 95% CI) | 0.95 [0.72, 1.26] |
| Analysis 4.33  Comparison 4 High vs low ALA omega‐3 fat (primary outcomes), Outcome 33 CHD mortality ‐ ALA ‐ SA by summary risk of bias. | ||||
| 33.1 Low risk of bias | 2 | 4947 | Risk Ratio (M‐H, Random, 95% CI) | 0.93 [0.67, 1.30] |
| 33.2 Moderate/high risk of bias | 1 | 13406 | Risk Ratio (M‐H, Random, 95% CI) | 1.00 [0.58, 1.70] |
| 34 CHD mortality ‐ ALA ‐ SA by compliance and study size Show forest plot | 3 | Risk Ratio (M‐H, Random, 95% CI) | Subtotals only | |
| Analysis 4.34  Comparison 4 High vs low ALA omega‐3 fat (primary outcomes), Outcome 34 CHD mortality ‐ ALA ‐ SA by compliance and study size. | ||||
| 34.1 SA ‐ low risk of compliance bias | 1 | 4837 | Risk Ratio (M‐H, Random, 95% CI) | 0.92 [0.66, 1.28] |
| 34.2 SA ‐ 100+ randomised | 3 | 18353 | Risk Ratio (M‐H, Random, 95% CI) | 0.95 [0.72, 1.26] |
| 35 CHD mortality ‐ ALA ‐ subgroup by dose Show forest plot | 3 | 18353 | Risk Ratio (M‐H, Random, 95% CI) | 0.95 [0.72, 1.26] |
| Analysis 4.35  Comparison 4 High vs low ALA omega‐3 fat (primary outcomes), Outcome 35 CHD mortality ‐ ALA ‐ subgroup by dose. | ||||
| 35.1 ALA low < 5 g/d | 1 | 4837 | Risk Ratio (M‐H, Random, 95% CI) | 0.92 [0.66, 1.28] |
| 35.2 ALA high ≥ 5 g/d | 2 | 13516 | Risk Ratio (M‐H, Random, 95% CI) | 1.02 [0.61, 1.73] |
| 36 CHD mortality ‐ ALA ‐ subgroup by replacement Show forest plot | 3 | Risk Ratio (M‐H, Random, 95% CI) | Subtotals only | |
| Analysis 4.36  Comparison 4 High vs low ALA omega‐3 fat (primary outcomes), Outcome 36 CHD mortality ‐ ALA ‐ subgroup by replacement. | ||||
| 36.1 N‐3 replacing SFA | 0 | 0 | Risk Ratio (M‐H, Random, 95% CI) | 0.0 [0.0, 0.0] |
| 36.2 Coronary heart mortality‐ ALA | 0 | 0 | Risk Ratio (M‐H, Random, 95% CI) | 0.0 [0.0, 0.0] |
| 36.3 N‐3 replacing MUFA | 1 | 4837 | Risk Ratio (M‐H, Random, 95% CI) | 0.92 [0.66, 1.28] |
| 36.4 N‐3 replacing n‐6 | 1 | 13406 | Risk Ratio (M‐H, Random, 95% CI) | 1.00 [0.58, 1.70] |
| 36.5 N‐3 replacing carbohydrates/sugars | 0 | 0 | Risk Ratio (M‐H, Random, 95% CI) | 0.0 [0.0, 0.0] |
| 36.6 N‐3 replacing nil/low n‐3 placebo | 0 | 0 | Risk Ratio (M‐H, Random, 95% CI) | 0.0 [0.0, 0.0] |
| 36.7 Replacement unclear | 1 | 110 | Risk Ratio (M‐H, Random, 95% CI) | 2.69 [0.11, 64.74] |
| 37 CHD mortality ‐ ALA ‐ subgroup by intervention type Show forest plot | 3 | 18353 | Risk Ratio (M‐H, Random, 95% CI) | 0.95 [0.72, 1.26] |
| Analysis 4.37  Comparison 4 High vs low ALA omega‐3 fat (primary outcomes), Outcome 37 CHD mortality ‐ ALA ‐ subgroup by intervention type. | ||||
| 37.1 Dietary advice | 0 | 0 | Risk Ratio (M‐H, Random, 95% CI) | 0.0 [0.0, 0.0] |
| 37.2 Supplemental foods | 2 | 4947 | Risk Ratio (M‐H, Random, 95% CI) | 0.93 [0.67, 1.30] |
| 37.3 Supplements (capsule) | 1 | 13406 | Risk Ratio (M‐H, Random, 95% CI) | 1.00 [0.58, 1.70] |
| 37.4 Any combination | 0 | 0 | Risk Ratio (M‐H, Random, 95% CI) | 0.0 [0.0, 0.0] |
| 38 CHD mortality ‐ ALA ‐ subgroup by duration Show forest plot | 3 | 18353 | Risk Ratio (M‐H, Random, 95% CI) | 0.95 [0.72, 1.26] |
| Analysis 4.38  Comparison 4 High vs low ALA omega‐3 fat (primary outcomes), Outcome 38 CHD mortality ‐ ALA ‐ subgroup by duration. | ||||
| 38.1 Medium duration 1 to < 2 years in study | 2 | 13516 | Risk Ratio (M‐H, Random, 95% CI) | 1.02 [0.61, 1.73] |
| 38.2 Medium‐long duration: 2 to < 4 years in study | 1 | 4837 | Risk Ratio (M‐H, Random, 95% CI) | 0.92 [0.66, 1.28] |
| 38.3 Long duration: ≥ 4 years in study | 0 | 0 | Risk Ratio (M‐H, Random, 95% CI) | 0.0 [0.0, 0.0] |
| 39 CHD mortality ‐ ALA ‐ subgroup by primary or secondary prevention Show forest plot | 3 | 18353 | Risk Ratio (M‐H, Random, 95% CI) | 0.95 [0.72, 1.26] |
| Analysis 4.39  Comparison 4 High vs low ALA omega‐3 fat (primary outcomes), Outcome 39 CHD mortality ‐ ALA ‐ subgroup by primary or secondary prevention. | ||||
| 39.1 Primary prevention of CVD | 1 | 13406 | Risk Ratio (M‐H, Random, 95% CI) | 1.00 [0.58, 1.70] |
| 39.2 Secondary prevention of CVD | 2 | 4947 | Risk Ratio (M‐H, Random, 95% CI) | 0.93 [0.67, 1.30] |
| 40 CHD mortality ‐ ALA ‐ subgroup by statin use Show forest plot | 3 | 18353 | Risk Ratio (M‐H, Random, 95% CI) | 0.95 [0.72, 1.26] |
| Analysis 4.40  Comparison 4 High vs low ALA omega‐3 fat (primary outcomes), Outcome 40 CHD mortality ‐ ALA ‐ subgroup by statin use. | ||||
| 40.1 ALA ‐ ≥ 50% of control group on statins | 2 | 4947 | Risk Ratio (M‐H, Random, 95% CI) | 0.93 [0.67, 1.30] |
| 40.2 ALA ‐ < 50% of control group on statins | 1 | 13406 | Risk Ratio (M‐H, Random, 95% CI) | 1.00 [0.58, 1.70] |
| 41 CHD mortality ‐ ALA ‐ subgroup by CAD history Show forest plot | 3 | 18353 | Risk Ratio (M‐H, Random, 95% CI) | 0.95 [0.72, 1.26] |
| Analysis 4.41  Comparison 4 High vs low ALA omega‐3 fat (primary outcomes), Outcome 41 CHD mortality ‐ ALA ‐ subgroup by CAD history. | ||||
| 41.1 Previous CAD | 1 | 4837 | Risk Ratio (M‐H, Random, 95% CI) | 0.92 [0.66, 1.28] |
| 41.2 No previous CAD | 2 | 13516 | Risk Ratio (M‐H, Random, 95% CI) | 1.02 [0.61, 1.73] |
| 42 Coronary heart disease events (overall) ‐ ALA Show forest plot | 4 | 19061 | Risk Ratio (M‐H, Random, 95% CI) | 1.00 [0.82, 1.22] |
| Analysis 4.42  Comparison 4 High vs low ALA omega‐3 fat (primary outcomes), Outcome 42 Coronary heart disease events (overall) ‐ ALA. | ||||
| 43 CHD events ‐ ALA ‐ SA fixed‐effect Show forest plot | 4 | 19061 | Risk Ratio (M‐H, Fixed, 95% CI) | 1.00 [0.82, 1.21] |
| Analysis 4.43  Comparison 4 High vs low ALA omega‐3 fat (primary outcomes), Outcome 43 CHD events ‐ ALA ‐ SA fixed‐effect. | ||||
| 44 CHD events ‐ ALA ‐ SA by summary risk of bias Show forest plot | 4 | 19061 | Risk Ratio (M‐H, Random, 95% CI) | 1.00 [0.82, 1.22] |
| Analysis 4.44  Comparison 4 High vs low ALA omega‐3 fat (primary outcomes), Outcome 44 CHD events ‐ ALA ‐ SA by summary risk of bias. | ||||
| 44.1 Low risk of bias | 2 | 4947 | Risk Ratio (M‐H, Random, 95% CI) | 0.91 [0.71, 1.15] |
| 44.2 Moderate/high risk of bias | 2 | 14114 | Risk Ratio (M‐H, Random, 95% CI) | 1.20 [0.86, 1.67] |
| 45 CHD events ‐ ALA ‐ SA by compliance and study size Show forest plot | 4 | Risk Ratio (M‐H, Random, 95% CI) | Subtotals only | |
| Analysis 4.45  Comparison 4 High vs low ALA omega‐3 fat (primary outcomes), Outcome 45 CHD events ‐ ALA ‐ SA by compliance and study size. | ||||
| 45.1 SA ‐ low risk of compliance bias | 2 | 5545 | Risk Ratio (M‐H, Random, 95% CI) | 0.92 [0.73, 1.17] |
| 45.2 SA ‐ 100+ randomised | 4 | 19061 | Risk Ratio (M‐H, Random, 95% CI) | 1.00 [0.82, 1.22] |
| 46 CHD events ‐ ALA ‐ subgroup by dose Show forest plot | 4 | 19061 | Risk Ratio (M‐H, Random, 95% CI) | 1.00 [0.82, 1.22] |
| Analysis 4.46  Comparison 4 High vs low ALA omega‐3 fat (primary outcomes), Outcome 46 CHD events ‐ ALA ‐ subgroup by dose. | ||||
| 46.1 ALA low < 5 g/d | 1 | 4837 | Risk Ratio (M‐H, Random, 95% CI) | 0.92 [0.72, 1.17] |
| 46.2 ALA high ≥ 5 g/d | 3 | 14224 | Risk Ratio (M‐H, Random, 95% CI) | 1.16 [0.84, 1.61] |
| 47 CHD events ‐ ALA ‐ subgroup by replacement Show forest plot | 4 | Risk Ratio (M‐H, Random, 95% CI) | Subtotals only | |
| Analysis 4.47  Comparison 4 High vs low ALA omega‐3 fat (primary outcomes), Outcome 47 CHD events ‐ ALA ‐ subgroup by replacement. | ||||
| 47.1 N‐3 replacing SFA | 0 | 0 | Risk Ratio (M‐H, Random, 95% CI) | 0.0 [0.0, 0.0] |
| 47.2 N‐3 replacing MUFA | 1 | 4837 | Risk Ratio (M‐H, Random, 95% CI) | 0.92 [0.72, 1.17] |
| 47.3 N‐3 replacing n‐6 | 1 | 13406 | Risk Ratio (M‐H, Random, 95% CI) | 1.19 [0.85, 1.65] |
| 47.4 N‐3 replacing carbohydrates/sugars | 0 | 0 | Risk Ratio (M‐H, Random, 95% CI) | 0.0 [0.0, 0.0] |
| 47.5 N‐3 replacing nil/low n‐3 placebo | 0 | 0 | Risk Ratio (M‐H, Random, 95% CI) | 0.0 [0.0, 0.0] |
| 47.6 Replacement unclear | 2 | 818 | Risk Ratio (M‐H, Random, 95% CI) | 0.69 [0.08, 5.81] |
| 48 CHD events ‐ ALA ‐ subgroup by intervention type Show forest plot | 4 | 19061 | Risk Ratio (M‐H, Random, 95% CI) | 1.00 [0.82, 1.22] |
| Analysis 4.48  Comparison 4 High vs low ALA omega‐3 fat (primary outcomes), Outcome 48 CHD events ‐ ALA ‐ subgroup by intervention type. | ||||
| 48.1 Dietary advice | 0 | 0 | Risk Ratio (M‐H, Random, 95% CI) | 0.0 [0.0, 0.0] |
| 48.2 Supplemental foods | 3 | 5655 | Risk Ratio (M‐H, Random, 95% CI) | 0.91 [0.72, 1.16] |
| 48.3 Supplements (capsule) | 1 | 13406 | Risk Ratio (M‐H, Random, 95% CI) | 1.19 [0.85, 1.65] |
| 48.4 Any combination | 0 | 0 | Risk Ratio (M‐H, Random, 95% CI) | 0.0 [0.0, 0.0] |
| 49 CHD events ‐ ALA ‐ subgroup by duration Show forest plot | 4 | 19061 | Risk Ratio (M‐H, Random, 95% CI) | 1.00 [0.82, 1.22] |
| Analysis 4.49  Comparison 4 High vs low ALA omega‐3 fat (primary outcomes), Outcome 49 CHD events ‐ ALA ‐ subgroup by duration. | ||||
| 49.1 Medium duration 1 to < 2 years in study | 2 | 13516 | Risk Ratio (M‐H, Random, 95% CI) | 0.94 [0.34, 2.58] |
| 49.2 Medium‐long duration: 2 to < 4 years in study | 2 | 5545 | Risk Ratio (M‐H, Random, 95% CI) | 0.92 [0.73, 1.17] |
| 49.3 Long duration: ≥ 4 years in study | 0 | 0 | Risk Ratio (M‐H, Random, 95% CI) | 0.0 [0.0, 0.0] |
| 50 CHD events ‐ ALA ‐ subgroup by primary or secondary prevention Show forest plot | 4 | 19061 | Risk Ratio (M‐H, Random, 95% CI) | 1.00 [0.82, 1.22] |
| Analysis 4.50  Comparison 4 High vs low ALA omega‐3 fat (primary outcomes), Outcome 50 CHD events ‐ ALA ‐ subgroup by primary or secondary prevention. | ||||
| 50.1 Primary prevention | 2 | 14114 | Risk Ratio (M‐H, Random, 95% CI) | 1.20 [0.86, 1.67] |
| 50.2 Secondary prevention | 2 | 4947 | Risk Ratio (M‐H, Random, 95% CI) | 0.91 [0.71, 1.15] |
| 51 CHD events ‐ ALA ‐ subgroup by statin use Show forest plot | 4 | 19061 | Risk Ratio (M‐H, Random, 95% CI) | 1.00 [0.82, 1.22] |
| Analysis 4.51  Comparison 4 High vs low ALA omega‐3 fat (primary outcomes), Outcome 51 CHD events ‐ ALA ‐ subgroup by statin use. | ||||
| 51.1 ALA ‐ ≥ 50% of control group on statins | 2 | 4947 | Risk Ratio (M‐H, Random, 95% CI) | 0.91 [0.71, 1.15] |
| 51.2 ALA ‐ < 50% of control group on statins | 2 | 14114 | Risk Ratio (M‐H, Random, 95% CI) | 1.20 [0.86, 1.67] |
| 52 CHD events ‐ ALA ‐ subgroup by CAD history Show forest plot | 4 | 19061 | Risk Ratio (M‐H, Random, 95% CI) | 1.00 [0.82, 1.22] |
| Analysis 4.52  Comparison 4 High vs low ALA omega‐3 fat (primary outcomes), Outcome 52 CHD events ‐ ALA ‐ subgroup by CAD history. | ||||
| 52.1 Previous CAD | 1 | 4837 | Risk Ratio (M‐H, Random, 95% CI) | 0.92 [0.72, 1.17] |
| 52.2 No previous CAD | 3 | 14224 | Risk Ratio (M‐H, Random, 95% CI) | 1.16 [0.84, 1.61] |
| 53 Stroke (overall) ‐ ALA Show forest plot | 5 | 19327 | Risk Ratio (M‐H, Random, 95% CI) | 1.15 [0.66, 2.01] |
| Analysis 4.53  Comparison 4 High vs low ALA omega‐3 fat (primary outcomes), Outcome 53 Stroke (overall) ‐ ALA. | ||||
| 54 Stroke ‐ ALA ‐ SA fixed‐effect Show forest plot | 5 | 19327 | Risk Ratio (M‐H, Fixed, 95% CI) | 1.23 [0.71, 2.13] |
| Analysis 4.54  Comparison 4 High vs low ALA omega‐3 fat (primary outcomes), Outcome 54 Stroke ‐ ALA ‐ SA fixed‐effect. | ||||
| 55 Stroke ‐ ALA ‐ SA by summary risk of bias Show forest plot | 5 | 19327 | Risk Ratio (M‐H, Random, 95% CI) | 1.15 [0.66, 2.01] |
| Analysis 4.55  Comparison 4 High vs low ALA omega‐3 fat (primary outcomes), Outcome 55 Stroke ‐ ALA ‐ SA by summary risk of bias. | ||||
| 55.1 Low risk of bias | 3 | 5213 | Risk Ratio (M‐H, Random, 95% CI) | 0.97 [0.45, 2.09] |
| 55.2 Moderate/high risk of bias | 2 | 14114 | Risk Ratio (M‐H, Random, 95% CI) | 1.39 [0.62, 3.13] |
| 56 Stroke ‐ ALA ‐ SA by compliance and study size Show forest plot | 5 | 25138 | Risk Ratio (M‐H, Random, 95% CI) | 1.04 [0.66, 1.64] |
| Analysis 4.56  Comparison 4 High vs low ALA omega‐3 fat (primary outcomes), Outcome 56 Stroke ‐ ALA ‐ SA by compliance and study size. | ||||
| 56.1 SA ‐ low risk of compliance bias | 3 | 5811 | Risk Ratio (M‐H, Random, 95% CI) | 0.85 [0.39, 1.87] |
| 56.2 SA ‐ 100+ randomised | 5 | 19327 | Risk Ratio (M‐H, Random, 95% CI) | 1.15 [0.66, 2.01] |
| 57 Stroke ‐ ALA ‐ subgroup by dose Show forest plot | 5 | Risk Ratio (M‐H, Random, 95% CI) | Subtotals only | |
| Analysis 4.57  Comparison 4 High vs low ALA omega‐3 fat (primary outcomes), Outcome 57 Stroke ‐ ALA ‐ subgroup by dose. | ||||
| 57.1 ALA low < 5 g/d | 1 | 4837 | Risk Ratio (M‐H, Random, 95% CI) | 0.92 [0.39, 2.15] |
| 57.2 ALA high ≥ 5 g/d | 4 | 14490 | Risk Ratio (M‐H, Random, 95% CI) | 1.36 [0.65, 2.85] |
| 58 Stroke ‐ ALA ‐ subgroup by replacement Show forest plot | 5 | Risk Ratio (M‐H, Random, 95% CI) | Subtotals only | |
| Analysis 4.58  Comparison 4 High vs low ALA omega‐3 fat (primary outcomes), Outcome 58 Stroke ‐ ALA ‐ subgroup by replacement. | ||||
| 58.1 N‐3 replacing SFA | 0 | 0 | Risk Ratio (M‐H, Random, 95% CI) | 0.0 [0.0, 0.0] |
| 58.2 N‐3 replacing MUFA | 1 | 4837 | Risk Ratio (M‐H, Random, 95% CI) | 0.92 [0.39, 2.15] |
| 58.3 N‐3 replacing n‐6 | 2 | 13672 | Risk Ratio (M‐H, Random, 95% CI) | 1.26 [0.53, 3.01] |
| 58.4 N‐3 replacing carbohydrates/sugars | 0 | 0 | Risk Ratio (M‐H, Random, 95% CI) | 0.0 [0.0, 0.0] |
| 58.5 N‐3 replacing nil/low n‐3 placebo | 0 | 0 | Risk Ratio (M‐H, Random, 95% CI) | 0.0 [0.0, 0.0] |
| 58.6 Replacement unclear | 2 | 818 | Risk Ratio (M‐H, Random, 95% CI) | 1.79 [0.31, 10.17] |
| 59 Stroke ‐ ALA ‐ subgroup by intervention type Show forest plot | 5 | 19327 | Risk Ratio (M‐H, Random, 95% CI) | 1.15 [0.66, 2.01] |
| Analysis 4.59  Comparison 4 High vs low ALA omega‐3 fat (primary outcomes), Outcome 59 Stroke ‐ ALA ‐ subgroup by intervention type. | ||||
| 59.1 Dietary advice | 0 | 0 | Risk Ratio (M‐H, Random, 95% CI) | 0.0 [0.0, 0.0] |
| 59.2 Supplemental foods | 4 | 5921 | Risk Ratio (M‐H, Random, 95% CI) | 0.97 [0.46, 2.03] |
| 59.3 Supplements (capsule) | 1 | 13406 | Risk Ratio (M‐H, Random, 95% CI) | 1.44 [0.62, 3.36] |
| 59.4 Any combination | 0 | 0 | Risk Ratio (M‐H, Random, 95% CI) | 0.0 [0.0, 0.0] |
| 60 Stroke ‐ ALA ‐ subgroup by duration Show forest plot | 5 | 19327 | Risk Ratio (M‐H, Random, 95% CI) | 1.15 [0.66, 2.01] |
| Analysis 4.60  Comparison 4 High vs low ALA omega‐3 fat (primary outcomes), Outcome 60 Stroke ‐ ALA ‐ subgroup by duration. | ||||
| 60.1 Medium duration 1 to < 2 years in study | 2 | 13516 | Risk Ratio (M‐H, Random, 95% CI) | 1.56 [0.70, 3.44] |
| 60.2 Medium‐long duration: 2 to < 4 years in study | 3 | 5811 | Risk Ratio (M‐H, Random, 95% CI) | 0.85 [0.39, 1.87] |
| 60.3 Long duration: ≥ 4 years in study | 0 | 0 | Risk Ratio (M‐H, Random, 95% CI) | 0.0 [0.0, 0.0] |
| 61 Stroke ‐ ALA ‐ subgroup by primary or secondary prevention Show forest plot | 5 | 19327 | Risk Ratio (M‐H, Random, 95% CI) | 1.15 [0.66, 2.01] |
| Analysis 4.61  Comparison 4 High vs low ALA omega‐3 fat (primary outcomes), Outcome 61 Stroke ‐ ALA ‐ subgroup by primary or secondary prevention. | ||||
| 61.1 Primary prevention | 3 | 14380 | Risk Ratio (M‐H, Random, 95% CI) | 1.25 [0.57, 2.74] |
| 61.2 Secondary prevention | 2 | 4947 | Risk Ratio (M‐H, Random, 95% CI) | 1.05 [0.47, 2.34] |
| 62 Stroke ‐ ALA ‐ subgroup by statin use Show forest plot | 5 | 19327 | Risk Ratio (M‐H, Random, 95% CI) | 1.25 [0.71, 2.18] |
| Analysis 4.62  Comparison 4 High vs low ALA omega‐3 fat (primary outcomes), Outcome 62 Stroke ‐ ALA ‐ subgroup by statin use. | ||||
| 62.1 ALA ‐ ≥ 50% of control group on statins | 2 | 4947 | Risk Ratio (M‐H, Random, 95% CI) | 1.25 [0.56, 2.77] |
| 62.2 ALA ‐ < 50% of control group on statins | 3 | 14380 | Risk Ratio (M‐H, Random, 95% CI) | 1.25 [0.57, 2.74] |
| 63 Stroke ‐ ALA ‐ subgroup by stroke type Show forest plot | 3 | 13782 | Risk Ratio (M‐H, Random, 95% CI) | 1.40 [0.65, 3.01] |
| Analysis 4.63  Comparison 4 High vs low ALA omega‐3 fat (primary outcomes), Outcome 63 Stroke ‐ ALA ‐ subgroup by stroke type. | ||||
| 63.1 Ischaemic stroke ‐ ALA | 3 | 13782 | Risk Ratio (M‐H, Random, 95% CI) | 1.40 [0.65, 3.01] |
| 63.2 Haemorrhagic stroke ‐ ALA | 0 | 0 | Risk Ratio (M‐H, Random, 95% CI) | 0.0 [0.0, 0.0] |
| 64 Arrythmia (overall) ‐ ALA Show forest plot | 1 | 4837 | Risk Ratio (M‐H, Random, 95% CI) | 0.79 [0.57, 1.10] |
| Analysis 4.64  Comparison 4 High vs low ALA omega‐3 fat (primary outcomes), Outcome 64 Arrythmia (overall) ‐ ALA. | ||||
| 64.1 ALA ‐ new arrhythmias | 1 | 4837 | Risk Ratio (M‐H, Random, 95% CI) | 0.79 [0.57, 1.10] |
| 64.2 ALA ‐ recurrent arrhythmias | 0 | 0 | Risk Ratio (M‐H, Random, 95% CI) | 0.0 [0.0, 0.0] |
| 65 Arrhythmia ‐ ALA ‐ SA by summary risk of bias Show forest plot | 1 | 4837 | Risk Ratio (M‐H, Random, 95% CI) | 0.79 [0.57, 1.10] |
| Analysis 4.65  Comparison 4 High vs low ALA omega‐3 fat (primary outcomes), Outcome 65 Arrhythmia ‐ ALA ‐ SA by summary risk of bias. | ||||
| 65.1 Low risk of bias | 1 | 4837 | Risk Ratio (M‐H, Random, 95% CI) | 0.79 [0.57, 1.10] |
| 65.2 Moderate/high risk of bias | 0 | 0 | Risk Ratio (M‐H, Random, 95% CI) | 0.0 [0.0, 0.0] |
| Outcome or subgroup title | No. of studies | No. of participants | Statistical method | Effect size |
| 1 MACCEs ‐ ALA Show forest plot | 1 | 110 | Risk Ratio (M‐H, Random, 95% CI) | 1.12 [0.32, 3.95] |
| Analysis 5.1  Comparison 5 High vs low ALA omega‐3 fat (secondary outcomes), Outcome 1 MACCEs ‐ ALA. | ||||
| 2 Myocardial infarction (overall) ‐ ALA Show forest plot | 3 | 18353 | Risk Ratio (M‐H, Random, 95% CI) | 1.00 [0.76, 1.32] |
| Analysis 5.2  Comparison 5 High vs low ALA omega‐3 fat (secondary outcomes), Outcome 2 Myocardial infarction (overall) ‐ ALA. | ||||
| 3 Total MI ‐ ALA ‐ subgroup by fatality Show forest plot | 3 | Risk Ratio (M‐H, Random, 95% CI) | Subtotals only | |
| Analysis 5.3  Comparison 5 High vs low ALA omega‐3 fat (secondary outcomes), Outcome 3 Total MI ‐ ALA ‐ subgroup by fatality. | ||||
| 3.1 Fatal MI | 2 | 4947 | Risk Ratio (M‐H, Random, 95% CI) | 0.95 [0.62, 1.46] |
| 3.2 Non‐fatal MI | 3 | 5213 | Risk Ratio (M‐H, Random, 95% CI) | 0.52 [0.15, 1.77] |
| 4 Angina ‐ ALA Show forest plot | 2 | 13516 | Risk Ratio (M‐H, Random, 95% CI) | 1.41 [0.75, 2.64] |
| Analysis 5.4  Comparison 5 High vs low ALA omega‐3 fat (secondary outcomes), Outcome 4 Angina ‐ ALA. | ||||
| 5 Revascularisation ‐ ALA Show forest plot | 1 | Risk Ratio (M‐H, Random, 95% CI) | Subtotals only | |
| Analysis 5.5  Comparison 5 High vs low ALA omega‐3 fat (secondary outcomes), Outcome 5 Revascularisation ‐ ALA. | ||||
| 5.1 CABG ‐ ALA | 1 | 266 | Risk Ratio (M‐H, Random, 95% CI) | 0.29 [0.01, 5.93] |
| 5.2 Angioplasty ‐ ALA | 0 | 0 | Risk Ratio (M‐H, Random, 95% CI) | 0.0 [0.0, 0.0] |
| 5.3 Any revascularisation ‐ ALA | 1 | 266 | Risk Ratio (M‐H, Random, 95% CI) | 0.72 [0.07, 7.84] |
| 6 Peripheral arterial disease ‐ ALA Show forest plot | 1 | Risk Ratio (M‐H, Random, 95% CI) | Subtotals only | |
| Analysis 5.6  Comparison 5 High vs low ALA omega‐3 fat (secondary outcomes), Outcome 6 Peripheral arterial disease ‐ ALA. | ||||
| 7 Body weight, kg ‐ ALA Show forest plot | 4 | 664 | Mean Difference (IV, Random, 95% CI) | ‐1.49 [‐4.17, 1.18] |
| Analysis 5.7  Comparison 5 High vs low ALA omega‐3 fat (secondary outcomes), Outcome 7 Body weight, kg ‐ ALA. | ||||
| 8 Weight, kg ‐ ALA ‐ sensitivity analysis (SA) fixed‐effect Show forest plot | 4 | 664 | Mean Difference (IV, Fixed, 95% CI) | 0.17 [‐0.61, 0.96] |
| Analysis 5.8  Comparison 5 High vs low ALA omega‐3 fat (secondary outcomes), Outcome 8 Weight, kg ‐ ALA ‐ sensitivity analysis (SA) fixed‐effect. | ||||
| 9 Weight, kg ‐ ALA ‐ SA by summary risk of bias Show forest plot | 4 | Mean Difference (IV, Random, 95% CI) | Subtotals only | |
| Analysis 5.9  Comparison 5 High vs low ALA omega‐3 fat (secondary outcomes), Outcome 9 Weight, kg ‐ ALA ‐ SA by summary risk of bias. | ||||
| 9.1 Low risk of bias | 0 | 0 | Mean Difference (IV, Random, 95% CI) | 0.0 [0.0, 0.0] |
| 9.2 Moderate/high risk of bias | 4 | 664 | Mean Difference (IV, Random, 95% CI) | ‐1.49 [‐4.17, 1.18] |
| 10 Weight, kg ‐ ALA ‐ SA by compliance and study size Show forest plot | 3 | Mean Difference (IV, Random, 95% CI) | Subtotals only | |
| Analysis 5.10  Comparison 5 High vs low ALA omega‐3 fat (secondary outcomes), Outcome 10 Weight, kg ‐ ALA ‐ SA by compliance and study size. | ||||
| 10.1 SA ‐ low risk of compliance bias | 3 | 629 | Mean Difference (IV, Random, 95% CI) | ‐1.59 [‐4.47, 1.30] |
| 10.2 SA ‐ 100+ randomised | 3 | 629 | Mean Difference (IV, Random, 95% CI) | ‐1.59 [‐4.47, 1.30] |
| 11 Weight, kg ‐ ALA ‐ subgroup by dose Show forest plot | 4 | Mean Difference (IV, Random, 95% CI) | Subtotals only | |
| Analysis 5.11  Comparison 5 High vs low ALA omega‐3 fat (secondary outcomes), Outcome 11 Weight, kg ‐ ALA ‐ subgroup by dose. | ||||
| 11.1 ALA low < 5 g/d | 3 | 485 | Mean Difference (IV, Random, 95% CI) | ‐0.71 [‐3.31, 1.90] |
| 11.2 ALA high > 5 g/d | 1 | 179 | Mean Difference (IV, Random, 95% CI) | ‐4.20 [‐7.61, ‐0.79] |
| 12 Weight, kg ‐ ALA ‐ subgroup by intervention type Show forest plot | 4 | Mean Difference (IV, Random, 95% CI) | Subtotals only | |
| Analysis 5.12  Comparison 5 High vs low ALA omega‐3 fat (secondary outcomes), Outcome 12 Weight, kg ‐ ALA ‐ subgroup by intervention type. | ||||
| 12.1 Dietary advice | 0 | 0 | Mean Difference (IV, Random, 95% CI) | 0.0 [0.0, 0.0] |
| 12.2 Supplemental foods | 3 | 526 | Mean Difference (IV, Random, 95% CI) | ‐1.23 [‐5.27, 2.80] |
| 12.3 Supplement (capsule) | 0 | 0 | Mean Difference (IV, Random, 95% CI) | 0.0 [0.0, 0.0] |
| 12.4 Any combination | 1 | 138 | Mean Difference (IV, Random, 95% CI) | ‐1.98 [‐5.89, 1.92] |
| 13 Weight, kg ‐ ALA ‐ subgroup by replacement Show forest plot | 4 | Mean Difference (IV, Random, 95% CI) | Subtotals only | |
| Analysis 5.13  Comparison 5 High vs low ALA omega‐3 fat (secondary outcomes), Outcome 13 Weight, kg ‐ ALA ‐ subgroup by replacement. | ||||
| 13.1 ALA replacing SFA | 0 | 0 | Mean Difference (IV, Random, 95% CI) | 0.0 [0.0, 0.0] |
| 13.2 ALA replacing MUFA | 1 | 138 | Mean Difference (IV, Random, 95% CI) | ‐1.98 [‐5.89, 1.92] |
| 13.3 ALA replacing n‐6 | 0 | 0 | Mean Difference (IV, Random, 95% CI) | 0.0 [0.0, 0.0] |
| 13.4 ALA replacing carbs/sugars | 0 | 0 | Mean Difference (IV, Random, 95% CI) | 0.0 [0.0, 0.0] |
| 13.5 ALA replacing nil/low n‐3 placebo | 1 | 35 | Mean Difference (IV, Random, 95% CI) | ‐0.30 [‐10.57, 9.97] |
| 13.6 Replacement unclear | 2 | 491 | Mean Difference (IV, Random, 95% CI) | ‐1.43 [‐6.26, 3.39] |
| 14 Weight, kg ‐ ALA ‐ subgroup by duration Show forest plot | 4 | Mean Difference (IV, Random, 95% CI) | Subtotals only | |
| Analysis 5.14  Comparison 5 High vs low ALA omega‐3 fat (secondary outcomes), Outcome 14 Weight, kg ‐ ALA ‐ subgroup by duration. | ||||
| 14.1 Medium duration 1 to < 2 years in study | 4 | 664 | Mean Difference (IV, Random, 95% CI) | ‐1.49 [‐4.17, 1.18] |
| 14.2 Medium‐long duration: 2 to < 4 years in study | 0 | 0 | Mean Difference (IV, Random, 95% CI) | 0.0 [0.0, 0.0] |
| 14.3 Long duration ≥ 4 years in study | 0 | 0 | Mean Difference (IV, Random, 95% CI) | 0.0 [0.0, 0.0] |
| 15 Weight, kg ‐ ALA ‐ subgroup by statin use Show forest plot | 4 | Mean Difference (IV, Random, 95% CI) | Subtotals only | |
| Analysis 5.15  Comparison 5 High vs low ALA omega‐3 fat (secondary outcomes), Outcome 15 Weight, kg ‐ ALA ‐ subgroup by statin use. | ||||
| 15.1 ALA ‐ ≥ 50% of control group on statins | 1 | 35 | Mean Difference (IV, Random, 95% CI) | ‐0.30 [‐10.57, 9.97] |
| 15.2 ALA ‐ < 50% of control group on statins | 1 | 138 | Mean Difference (IV, Random, 95% CI) | ‐1.98 [‐5.89, 1.92] |
| 15.3 ALA ‐ use of statins unclear | 2 | 491 | Mean Difference (IV, Random, 95% CI) | ‐1.43 [‐6.26, 3.39] |
| 16 Weight, kg ‐ ALA ‐ subgroup by primary or secondary prevention Show forest plot | 4 | Mean Difference (IV, Random, 95% CI) | Subtotals only | |
| Analysis 5.16  Comparison 5 High vs low ALA omega‐3 fat (secondary outcomes), Outcome 16 Weight, kg ‐ ALA ‐ subgroup by primary or secondary prevention. | ||||
| 16.1 Low CVD risk | 3 | 629 | Mean Difference (IV, Random, 95% CI) | ‐1.59 [‐4.47, 1.30] |
| 16.2 Moderate CVD risk | 1 | 35 | Mean Difference (IV, Random, 95% CI) | ‐0.30 [‐10.57, 9.97] |
| 16.3 High CVD risk | 0 | 0 | Mean Difference (IV, Random, 95% CI) | 0.0 [0.0, 0.0] |
| 17 Body mass index, kg/m² ‐ ALA Show forest plot | 3 | 1581 | Mean Difference (IV, Random, 95% CI) | ‐0.42 [‐1.53, 0.69] |
| Analysis 5.17  Comparison 5 High vs low ALA omega‐3 fat (secondary outcomes), Outcome 17 Body mass index, kg/m² ‐ ALA. | ||||
| 18 BMI, kg/m² ‐ ALA ‐ SA fixed‐effect Show forest plot | 3 | 1581 | Mean Difference (IV, Fixed, 95% CI) | 0.12 [‐0.06, 0.30] |
| Analysis 5.18  Comparison 5 High vs low ALA omega‐3 fat (secondary outcomes), Outcome 18 BMI, kg/m² ‐ ALA ‐ SA fixed‐effect. | ||||
| 19 BMI, kg/m² ‐ ALA ‐ SA by summary risk of bias Show forest plot | 3 | Mean Difference (IV, Random, 95% CI) | Subtotals only | |
| Analysis 5.19  Comparison 5 High vs low ALA omega‐3 fat (secondary outcomes), Outcome 19 BMI, kg/m² ‐ ALA ‐ SA by summary risk of bias. | ||||
| 19.1 Low risk of bias | 2 | 1402 | Mean Difference (IV, Random, 95% CI) | 0.15 [‐0.04, 0.33] |
| 19.2 Moderate/high risk of bias | 1 | 179 | Mean Difference (IV, Random, 95% CI) | ‐1.5 [‐2.86, ‐0.14] |
| 20 BMI, kg/m² ‐ ALA ‐ SA by compliance and study size Show forest plot | 3 | Mean Difference (IV, Random, 95% CI) | Subtotals only | |
| Analysis 5.20  Comparison 5 High vs low ALA omega‐3 fat (secondary outcomes), Outcome 20 BMI, kg/m² ‐ ALA ‐ SA by compliance and study size. | ||||
| 20.1 SA ‐ low risk of compliance bias | 3 | 1581 | Mean Difference (IV, Random, 95% CI) | ‐0.42 [‐1.53, 0.69] |
| 20.2 SA ‐ 100+ randomised | 3 | 1581 | Mean Difference (IV, Random, 95% CI) | ‐0.42 [‐1.53, 0.69] |
| 21 BMI, kg/m² ‐ ALA ‐ subgroup by dose Show forest plot | 3 | Mean Difference (IV, Random, 95% CI) | Subtotals only | |
| Analysis 5.21  Comparison 5 High vs low ALA omega‐3 fat (secondary outcomes), Outcome 21 BMI, kg/m² ‐ ALA ‐ subgroup by dose. | ||||
| 21.1 ALA low < 5 g/d | 1 | 1260 | Mean Difference (IV, Random, 95% CI) | 0.15 [‐0.03, 0.33] |
| 21.2 ALA high > 5 g/d | 2 | 321 | Mean Difference (IV, Random, 95% CI) | ‐1.12 [‐2.24, 0.01] |
| 22 BMI, kg/m² ‐ ALA ‐ subgroup by intervention type Show forest plot | 3 | Mean Difference (IV, Random, 95% CI) | Subtotals only | |
| Analysis 5.22  Comparison 5 High vs low ALA omega‐3 fat (secondary outcomes), Outcome 22 BMI, kg/m² ‐ ALA ‐ subgroup by intervention type. | ||||
| 22.1 Dietary advice | 0 | 0 | Mean Difference (IV, Random, 95% CI) | 0.0 [0.0, 0.0] |
| 22.2 Supplemental foods | 3 | 1581 | Mean Difference (IV, Random, 95% CI) | ‐0.42 [‐1.53, 0.69] |
| 22.3 Supplement (capsule) | 0 | 0 | Mean Difference (IV, Random, 95% CI) | 0.0 [0.0, 0.0] |
| 22.4 Any combination | 0 | 0 | Mean Difference (IV, Random, 95% CI) | 0.0 [0.0, 0.0] |
| 23 BMI, kg/m² ‐ ALA ‐ subgroup by replacement Show forest plot | 3 | 1581 | Mean Difference (IV, Random, 95% CI) | ‐0.42 [‐1.53, 0.69] |
| Analysis 5.23  Comparison 5 High vs low ALA omega‐3 fat (secondary outcomes), Outcome 23 BMI, kg/m² ‐ ALA ‐ subgroup by replacement. | ||||
| 23.1 ALA replacing SFA | 0 | 0 | Mean Difference (IV, Random, 95% CI) | 0.0 [0.0, 0.0] |
| 23.2 ALA replacing MUFA | 1 | 1260 | Mean Difference (IV, Random, 95% CI) | 0.15 [‐0.03, 0.33] |
| 23.3 ALA replacing n‐6 | 1 | 142 | Mean Difference (IV, Random, 95% CI) | ‐0.3 [‐2.29, 1.69] |
| 23.4 ALA replacing carbs/sugars | 0 | 0 | Mean Difference (IV, Random, 95% CI) | 0.0 [0.0, 0.0] |
| 23.5 ALA replacing nil/low n‐3 placebo | 0 | 0 | Mean Difference (IV, Random, 95% CI) | 0.0 [0.0, 0.0] |
| 23.6 Replacement unclear | 1 | 179 | Mean Difference (IV, Random, 95% CI) | ‐1.5 [‐2.86, ‐0.14] |
| 24 BMI, kg/m² ‐ ALA ‐ subgroup by duration Show forest plot | 3 | Mean Difference (IV, Random, 95% CI) | Subtotals only | |
| Analysis 5.24  Comparison 5 High vs low ALA omega‐3 fat (secondary outcomes), Outcome 24 BMI, kg/m² ‐ ALA ‐ subgroup by duration. | ||||
| 24.1 Medium duration 1 to < 2 years in study | 1 | 179 | Mean Difference (IV, Random, 95% CI) | ‐1.5 [‐2.86, ‐0.14] |
| 24.2 Medium‐long duration: 2 to < 4 years in study | 2 | 1402 | Mean Difference (IV, Random, 95% CI) | 0.15 [‐0.04, 0.33] |
| 24.3 Long duration ≥ 4 years in study | 0 | 0 | Mean Difference (IV, Random, 95% CI) | 0.0 [0.0, 0.0] |
| 25 BMI, kg/m² ‐ ALA ‐ subgroup by statin use Show forest plot | 3 | Mean Difference (IV, Random, 95% CI) | Subtotals only | |
| Analysis 5.25  Comparison 5 High vs low ALA omega‐3 fat (secondary outcomes), Outcome 25 BMI, kg/m² ‐ ALA ‐ subgroup by statin use. | ||||
| 25.1 ALA ‐ ≥ 50% of control group on statins | 1 | 1260 | Mean Difference (IV, Random, 95% CI) | 0.15 [‐0.03, 0.33] |
| 25.2 ALA ‐ < 50% of control group on statins | 1 | 142 | Mean Difference (IV, Random, 95% CI) | ‐0.3 [‐2.29, 1.69] |
| 25.3 ALA ‐ use of statins unclear | 1 | 179 | Mean Difference (IV, Random, 95% CI) | ‐1.5 [‐2.86, ‐0.14] |
| 26 BMI, kg/m² ‐ ALA ‐ subgroup by primary or secondary preventionA Show forest plot | 3 | Mean Difference (IV, Random, 95% CI) | Subtotals only | |
| Analysis 5.26  Comparison 5 High vs low ALA omega‐3 fat (secondary outcomes), Outcome 26 BMI, kg/m² ‐ ALA ‐ subgroup by primary or secondary preventionA. | ||||
| 26.1 Primary prevention of CVD | 2 | 321 | Mean Difference (IV, Random, 95% CI) | ‐1.12 [‐2.24, 0.01] |
| 26.2 Secondary prevention of CVD | 1 | 1260 | Mean Difference (IV, Random, 95% CI) | 0.15 [‐0.03, 0.33] |
| 27 Other measures of adiposity ‐ ALA Show forest plot | 4 | Mean Difference (IV, Fixed, 95% CI) | Subtotals only | |
| Analysis 5.27  Comparison 5 High vs low ALA omega‐3 fat (secondary outcomes), Outcome 27 Other measures of adiposity ‐ ALA. | ||||
| 27.1 Visceral adipose tissue, cm² | 1 | 35 | Mean Difference (IV, Fixed, 95% CI) | 27.0 [‐21.28, 75.28] |
| 27.2 Subcutaneous adipose tissue, cm² | 1 | 35 | Mean Difference (IV, Fixed, 95% CI) | 0.0 [0.0, 0.0] |
| 27.3 Waist circumference, cm | 3 | 629 | Mean Difference (IV, Fixed, 95% CI) | ‐1.59 [‐3.10, ‐0.07] |
| 28 Total cholesterol, serum, mmoL/L ‐ ALA Show forest plot | 6 | 2164 | Mean Difference (IV, Random, 95% CI) | ‐0.09 [‐0.23, 0.05] |
| Analysis 5.28  Comparison 5 High vs low ALA omega‐3 fat (secondary outcomes), Outcome 28 Total cholesterol, serum, mmoL/L ‐ ALA. | ||||
| 29 TC, mmoL/L ‐ ALA ‐ SA fixed‐effect Show forest plot | 6 | 2164 | Mean Difference (IV, Fixed, 95% CI) | ‐0.10 [‐0.17, ‐0.03] |
| Analysis 5.29  Comparison 5 High vs low ALA omega‐3 fat (secondary outcomes), Outcome 29 TC, mmoL/L ‐ ALA ‐ SA fixed‐effect. | ||||
| 30 TC, mmoL/L ‐ ALA ‐ SA by summary risk of bias Show forest plot | 6 | Mean Difference (IV, Random, 95% CI) | Subtotals only | |
| Analysis 5.30  Comparison 5 High vs low ALA omega‐3 fat (secondary outcomes), Outcome 30 TC, mmoL/L ‐ ALA ‐ SA by summary risk of bias. | ||||
| 30.1 Low risk of bias | 3 | 1436 | Mean Difference (IV, Random, 95% CI) | 0.00 [‐0.13, 0.14] |
| 30.2 Moderate/high risk of bias | 3 | 728 | Mean Difference (IV, Random, 95% CI) | ‐0.19 [‐0.36, ‐0.01] |
| 31 TC, mmoL/L ‐ ALA ‐ SA by compliance and study size Show forest plot | 4 | Mean Difference (IV, Random, 95% CI) | Subtotals only | |
| Analysis 5.31  Comparison 5 High vs low ALA omega‐3 fat (secondary outcomes), Outcome 31 TC, mmoL/L ‐ ALA ‐ SA by compliance and study size. | ||||
| 31.1 SA ‐ low risk of compliance bias | 4 | 2045 | Mean Difference (IV, Random, 95% CI) | ‐0.10 [‐0.25, 0.05] |
| 31.2 SA ‐ 100+ randomised | 4 | 2045 | Mean Difference (IV, Random, 95% CI) | ‐0.10 [‐0.25, 0.05] |
| 32 TC, mmoL/L ‐ ALA ‐ subgroup by dose Show forest plot | 6 | Mean Difference (IV, Random, 95% CI) | Subtotals only | |
| Analysis 5.32  Comparison 5 High vs low ALA omega‐3 fat (secondary outcomes), Outcome 32 TC, mmoL/L ‐ ALA ‐ subgroup by dose. | ||||
| 32.1 ALA low < 5 g/d | 3 | 1759 | Mean Difference (IV, Random, 95% CI) | ‐0.07 [‐0.24, 0.09] |
| 32.2 ALA high > 5 g/d | 3 | 405 | Mean Difference (IV, Random, 95% CI) | ‐0.13 [‐0.47, 0.21] |
| 33 TC, mmoL/L ‐ ALA ‐ subgroup by intervention type Show forest plot | 6 | Mean Difference (IV, Random, 95% CI) | Subtotals only | |
| Analysis 5.33  Comparison 5 High vs low ALA omega‐3 fat (secondary outcomes), Outcome 33 TC, mmoL/L ‐ ALA ‐ subgroup by intervention type. | ||||
| 33.1 Dietary advice | 0 | 0 | Mean Difference (IV, Random, 95% CI) | 0.0 [0.0, 0.0] |
| 33.2 Supplemental foods | 6 | 2164 | Mean Difference (IV, Random, 95% CI) | ‐0.09 [‐0.23, 0.05] |
| 33.3 Supplement (capsule) | 0 | 0 | Mean Difference (IV, Random, 95% CI) | 0.0 [0.0, 0.0] |
| 33.4 Any combination | 0 | 0 | Mean Difference (IV, Random, 95% CI) | 0.0 [0.0, 0.0] |
| 34 TC, mmoL/L ‐ ALA ‐ subgroup by replacement Show forest plot | 6 | Mean Difference (IV, Random, 95% CI) | Subtotals only | |
| Analysis 5.34  Comparison 5 High vs low ALA omega‐3 fat (secondary outcomes), Outcome 34 TC, mmoL/L ‐ ALA ‐ subgroup by replacement. | ||||
| 34.1 ALA replacing SFA | 0 | 0 | Mean Difference (IV, Random, 95% CI) | 0.0 [0.0, 0.0] |
| 34.2 ALA replacing MUFA | 1 | 1210 | Mean Difference (IV, Random, 95% CI) | ‐0.02 [‐0.13, 0.09] |
| 34.3 ALA replacing n‐6 | 1 | 142 | Mean Difference (IV, Random, 95% CI) | 0.14 [‐0.10, 0.38] |
| 34.4 ALA replacing carbs/sugars | 0 | 0 | Mean Difference (IV, Random, 95% CI) | 0.0 [0.0, 0.0] |
| 34.5 ALA replacing nil/low n‐3 placebo | 1 | 35 | Mean Difference (IV, Random, 95% CI) | 0.30 [‐0.30, 0.90] |
| 34.6 Replacement unclear | 3 | 777 | Mean Difference (IV, Random, 95% CI) | ‐0.21 [‐0.31, ‐0.11] |
| 35 TC, mmoL/L ‐ ALA ‐ subgroup by duration Show forest plot | 6 | Mean Difference (IV, Random, 95% CI) | Subtotals only | |
| Analysis 5.35  Comparison 5 High vs low ALA omega‐3 fat (secondary outcomes), Outcome 35 TC, mmoL/L ‐ ALA ‐ subgroup by duration. | ||||
| 35.1 Medium duration 1 to < 2 years in study | 4 | 812 | Mean Difference (IV, Random, 95% CI) | ‐0.20 [‐0.33, ‐0.07] |
| 35.2 Medium‐long duration: 2 to < 4 years in study | 2 | 1352 | Mean Difference (IV, Random, 95% CI) | 0.02 [‐0.12, 0.16] |
| 35.3 Long duration ≥ 4 years in study | 0 | 0 | Mean Difference (IV, Random, 95% CI) | 0.0 [0.0, 0.0] |
| 36 TC, mmoL/L ‐ ALA ‐ subgroup by statin use Show forest plot | 6 | Mean Difference (IV, Random, 95% CI) | Subtotals only | |
| Analysis 5.36  Comparison 5 High vs low ALA omega‐3 fat (secondary outcomes), Outcome 36 TC, mmoL/L ‐ ALA ‐ subgroup by statin use. | ||||
| 36.1 ALA ‐ ≥ 50% of control group on statins | 3 | 1329 | Mean Difference (IV, Random, 95% CI) | ‐0.02 [‐0.15, 0.11] |
| 36.2 ALA ‐ < 50% of control group on statins | 1 | 142 | Mean Difference (IV, Random, 95% CI) | 0.14 [‐0.10, 0.38] |
| 36.3 ALA ‐ use of statins unclear | 2 | 693 | Mean Difference (IV, Random, 95% CI) | ‐0.21 [‐0.30, ‐0.11] |
| 37 TC, mmoL/L ‐ ALA ‐ subgroup by primary or secondary preventionA Show forest plot | 6 | Mean Difference (IV, Random, 95% CI) | Subtotals only | |
| Analysis 5.37  Comparison 5 High vs low ALA omega‐3 fat (secondary outcomes), Outcome 37 TC, mmoL/L ‐ ALA ‐ subgroup by primary or secondary preventionA. | ||||
| 37.1 Primary prevention of CVD | 4 | 870 | Mean Difference (IV, Random, 95% CI) | ‐0.09 [‐0.30, 0.12] |
| 37.2 Secondary prevention of CVD | 2 | 1294 | Mean Difference (IV, Random, 95% CI) | ‐0.03 [‐0.14, 0.08] |
| 38 Triglycerides, fasting, serum, mmoL/L ‐ ALA Show forest plot | 6 | 1776 | Mean Difference (IV, Random, 95% CI) | ‐0.03 [‐0.11, 0.05] |
| Analysis 5.38  Comparison 5 High vs low ALA omega‐3 fat (secondary outcomes), Outcome 38 Triglycerides, fasting, serum, mmoL/L ‐ ALA. | ||||
| 39 TG, fasting, mmoL/L ‐ ALA ‐ SA fixed‐effect Show forest plot | 6 | 1776 | Mean Difference (IV, Fixed, 95% CI) | ‐0.03 [‐0.11, 0.05] |
| Analysis 5.39  Comparison 5 High vs low ALA omega‐3 fat (secondary outcomes), Outcome 39 TG, fasting, mmoL/L ‐ ALA ‐ SA fixed‐effect. | ||||
| 40 TG, fasting, mmoL/L‐ ALA ‐ SA by summary risk of bias Show forest plot | 6 | Mean Difference (IV, Random, 95% CI) | Subtotals only | |
| Analysis 5.40  Comparison 5 High vs low ALA omega‐3 fat (secondary outcomes), Outcome 40 TG, fasting, mmoL/L‐ ALA ‐ SA by summary risk of bias. | ||||
| 40.1 Low risk of bias | 3 | 1436 | Mean Difference (IV, Random, 95% CI) | 0.03 [‐0.13, 0.19] |
| 40.2 Moderate/high risk of bias | 3 | 340 | Mean Difference (IV, Random, 95% CI) | ‐0.05 [‐0.18, 0.09] |
| 41 TG, fasting, mmoL/L‐ ALA ‐ SA by compliance and study size Show forest plot | 4 | Mean Difference (IV, Random, 95% CI) | Subtotals only | |
| Analysis 5.41  Comparison 5 High vs low ALA omega‐3 fat (secondary outcomes), Outcome 41 TG, fasting, mmoL/L‐ ALA ‐ SA by compliance and study size. | ||||
| 41.1 SA ‐ low risk of compliance bias | 4 | 1657 | Mean Difference (IV, Random, 95% CI) | ‐0.05 [‐0.13, 0.04] |
| 41.2 SA ‐ 100+ randomised | 4 | 1657 | Mean Difference (IV, Random, 95% CI) | ‐0.05 [‐0.13, 0.04] |
| 42 TG, fasting, mmoL/L ‐ ALA ‐ subgroup by dose Show forest plot | 6 | Mean Difference (IV, Random, 95% CI) | Subtotals only | |
| Analysis 5.42  Comparison 5 High vs low ALA omega‐3 fat (secondary outcomes), Outcome 42 TG, fasting, mmoL/L ‐ ALA ‐ subgroup by dose. | ||||
| 42.1 ALA low < 5 g/d | 3 | 1371 | Mean Difference (IV, Random, 95% CI) | ‐0.07 [‐0.16, 0.03] |
| 42.2 ALA high > 5 g/d | 3 | 405 | Mean Difference (IV, Random, 95% CI) | 0.05 [‐0.09, 0.19] |
| 43 TG, fasting, mmoL/L‐ ALA ‐ subgroup by intervention type Show forest plot | 6 | Mean Difference (IV, Random, 95% CI) | Subtotals only | |
| Analysis 5.43  Comparison 5 High vs low ALA omega‐3 fat (secondary outcomes), Outcome 43 TG, fasting, mmoL/L‐ ALA ‐ subgroup by intervention type. | ||||
| 43.1 Dietary advice | 0 | 0 | Mean Difference (IV, Random, 95% CI) | 0.0 [0.0, 0.0] |
| 43.2 Supplemental foods | 5 | 1650 | Mean Difference (IV, Random, 95% CI) | ‐0.01 [‐0.10, 0.07] |
| 43.3 Supplement (capsule) | 0 | 0 | Mean Difference (IV, Random, 95% CI) | 0.0 [0.0, 0.0] |
| 43.4 Any combination | 1 | 126 | Mean Difference (IV, Random, 95% CI) | ‐0.12 [‐0.33, 0.09] |
| 44 TG, fasting, mmoL/L‐AL ‐ subgroup by replacementA Show forest plot | 6 | Mean Difference (IV, Random, 95% CI) | Subtotals only | |
| Analysis 5.44  Comparison 5 High vs low ALA omega‐3 fat (secondary outcomes), Outcome 44 TG, fasting, mmoL/L‐AL ‐ subgroup by replacementA. | ||||
| 44.1 ALA replacing SFA | 0 | 0 | Mean Difference (IV, Random, 95% CI) | 0.0 [0.0, 0.0] |
| 44.2 ALA replacing MUFA | 2 | 1336 | Mean Difference (IV, Random, 95% CI) | ‐0.07 [‐0.17, 0.02] |
| 44.3 ALA replacing n‐6 | 1 | 142 | Mean Difference (IV, Random, 95% CI) | 0.13 [‐0.16, 0.42] |
| 44.4 ALA replacing carbs/sugars | 0 | 0 | Mean Difference (IV, Random, 95% CI) | 0.0 [0.0, 0.0] |
| 44.5 ALA replacing nil/low n‐3 placebo | 1 | 35 | Mean Difference (IV, Random, 95% CI) | 0.30 [‐0.39, 0.99] |
| 44.6 Replacement unclear | 2 | 263 | Mean Difference (IV, Random, 95% CI) | 0.04 [‐0.15, 0.23] |
| 45 TG, fasting, mmoL/L‐ ALA ‐ subgroup by duration Show forest plot | 6 | Mean Difference (IV, Random, 95% CI) | Subtotals only | |
| Analysis 5.45  Comparison 5 High vs low ALA omega‐3 fat (secondary outcomes), Outcome 45 TG, fasting, mmoL/L‐ ALA ‐ subgroup by duration. | ||||
| 45.1 Medium duration 1 to < 2 years in study | 4 | 424 | Mean Difference (IV, Random, 95% CI) | ‐0.01 [‐0.15, 0.12] |
| 45.2 Medium‐long duration: 2 to < 4 years in study | 2 | 1352 | Mean Difference (IV, Random, 95% CI) | ‐0.01 [‐0.17, 0.15] |
| 45.3 Long duration ≥ 4 years in study | 0 | 0 | Mean Difference (IV, Random, 95% CI) | 0.0 [0.0, 0.0] |
| 46 TG, fasting, mmoL/L ‐ ALA ‐ subgroup by statin use Show forest plot | 6 | Mean Difference (IV, Random, 95% CI) | Subtotals only | |
| Analysis 5.46  Comparison 5 High vs low ALA omega‐3 fat (secondary outcomes), Outcome 46 TG, fasting, mmoL/L ‐ ALA ‐ subgroup by statin use. | ||||
| 46.1 ALA ‐ ≥ 50% of control group on statins | 3 | 1329 | Mean Difference (IV, Random, 95% CI) | 0.03 [‐0.17, 0.23] |
| 46.2 ALA ‐ < 50% of control group on statins | 2 | 268 | Mean Difference (IV, Random, 95% CI) | ‐0.02 [‐0.26, 0.23] |
| 46.3 ALA ‐ use of statins unclear | 1 | 179 | Mean Difference (IV, Random, 95% CI) | ‐0.02 [‐0.20, 0.16] |
| 47 TG, fasting, mmoL/L‐ ALA ‐ subgroup by primary or secondary prevention Show forest plot | 6 | Mean Difference (IV, Random, 95% CI) | Subtotals only | |
| Analysis 5.47  Comparison 5 High vs low ALA omega‐3 fat (secondary outcomes), Outcome 47 TG, fasting, mmoL/L‐ ALA ‐ subgroup by primary or secondary prevention. | ||||
| 47.1 Primary prevention | 4 | 482 | Mean Difference (IV, Random, 95% CI) | ‐0.02 [‐0.14, 0.11] |
| 47.2 Secondary prevention | 2 | 1294 | Mean Difference (IV, Random, 95% CI) | 0.02 [‐0.22, 0.25] |
| 48 High‐density lipoprotein, serum, mmoL/L ‐ ALA Show forest plot | 6 | 1776 | Mean Difference (IV, Random, 95% CI) | ‐0.02 [‐0.08, 0.03] |
| Analysis 5.48  Comparison 5 High vs low ALA omega‐3 fat (secondary outcomes), Outcome 48 High‐density lipoprotein, serum, mmoL/L ‐ ALA. | ||||
| 49 HDL, mmoL/L ‐ ALA ‐ SA fixed‐effect Show forest plot | 6 | 1776 | Mean Difference (IV, Fixed, 95% CI) | ‐0.02 [‐0.05, 0.00] |
| Analysis 5.49  Comparison 5 High vs low ALA omega‐3 fat (secondary outcomes), Outcome 49 HDL, mmoL/L ‐ ALA ‐ SA fixed‐effect. | ||||
| 50 HDL, mmoL/L ‐ ALA ‐ SA by summary risk of bias Show forest plot | 6 | Mean Difference (IV, Random, 95% CI) | Subtotals only | |
| Analysis 5.50  Comparison 5 High vs low ALA omega‐3 fat (secondary outcomes), Outcome 50 HDL, mmoL/L ‐ ALA ‐ SA by summary risk of bias. | ||||
| 50.1 Low risk of bias | 3 | 1436 | Mean Difference (IV, Random, 95% CI) | ‐0.03 [‐0.06, 0.00] |
| 50.2 Moderate/high risk of bias | 3 | 340 | Mean Difference (IV, Random, 95% CI) | 0.04 [‐0.14, 0.22] |
| 51 HDL, mmoL/L ‐ ALA ‐ SA by compliance and study size Show forest plot | 4 | Mean Difference (IV, Random, 95% CI) | Subtotals only | |
| Analysis 5.51  Comparison 5 High vs low ALA omega‐3 fat (secondary outcomes), Outcome 51 HDL, mmoL/L ‐ ALA ‐ SA by compliance and study size. | ||||
| 51.1 SA ‐ low risk of compliance bias | 4 | 1657 | Mean Difference (IV, Random, 95% CI) | ‐0.02 [‐0.08, 0.04] |
| 51.2 SA ‐ 100+ randomised | 4 | 1657 | Mean Difference (IV, Random, 95% CI) | ‐0.02 [‐0.08, 0.04] |
| 52 HDL, mmoL/L ‐ ALA ‐ subgroup by dose Show forest plot | 6 | Mean Difference (IV, Random, 95% CI) | Subtotals only | |
| Analysis 5.52  Comparison 5 High vs low ALA omega‐3 fat (secondary outcomes), Outcome 52 HDL, mmoL/L ‐ ALA ‐ subgroup by dose. | ||||
| 52.1 ALA low < 5 g/d | 3 | 1371 | Mean Difference (IV, Random, 95% CI) | 0.06 [‐0.08, 0.19] |
| 52.2 ALA high > 5 g/d | 3 | 405 | Mean Difference (IV, Random, 95% CI) | ‐0.07 [‐0.12, ‐0.01] |
| 53 HDL, mmoL/L ‐ ALA ‐ subgroup by intervention type Show forest plot | 6 | Mean Difference (IV, Random, 95% CI) | Subtotals only | |
| Analysis 5.53  Comparison 5 High vs low ALA omega‐3 fat (secondary outcomes), Outcome 53 HDL, mmoL/L ‐ ALA ‐ subgroup by intervention type. | ||||
| 53.1 Dietary advice | 0 | 0 | Mean Difference (IV, Random, 95% CI) | 0.0 [0.0, 0.0] |
| 53.2 Supplemental foods | 5 | 1650 | Mean Difference (IV, Random, 95% CI) | ‐0.03 [‐0.06, ‐0.00] |
| 53.3 Supplement (capsule) | 0 | 0 | Mean Difference (IV, Random, 95% CI) | 0.0 [0.0, 0.0] |
| 53.4 Any combination | 1 | 126 | Mean Difference (IV, Random, 95% CI) | 0.15 [0.01, 0.29] |
| 54 HDL, mmoL/L ‐ ALA ‐ subgroup by replacement Show forest plot | 6 | Mean Difference (IV, Random, 95% CI) | Subtotals only | |
| Analysis 5.54  Comparison 5 High vs low ALA omega‐3 fat (secondary outcomes), Outcome 54 HDL, mmoL/L ‐ ALA ‐ subgroup by replacement. | ||||
| 54.1 ALA replacing SFA | 0 | 0 | Mean Difference (IV, Random, 95% CI) | 0.0 [0.0, 0.0] |
| 54.2 ALA replacing MUFA | 2 | 1336 | Mean Difference (IV, Random, 95% CI) | 0.05 [‐0.11, 0.22] |
| 54.3 ALA replacing n‐6 | 1 | 142 | Mean Difference (IV, Random, 95% CI) | ‐0.04 [‐0.11, 0.03] |
| 54.4 ALA replacing carbs/sugars | 0 | 0 | Mean Difference (IV, Random, 95% CI) | 0.0 [0.0, 0.0] |
| 54.5 ALA replacing nil/low n‐3 placebo | 1 | 35 | Mean Difference (IV, Random, 95% CI) | 0.10 [‐0.17, 0.37] |
| 54.6 Replacement unclear | 2 | 263 | Mean Difference (IV, Random, 95% CI) | ‐0.09 [‐0.17, ‐0.02] |
| 55 HDL, mmoL/L ‐ ALA ‐ subgroup by duration Show forest plot | 6 | Mean Difference (IV, Random, 95% CI) | Subtotals only | |
| Analysis 5.55  Comparison 5 High vs low ALA omega‐3 fat (secondary outcomes), Outcome 55 HDL, mmoL/L ‐ ALA ‐ subgroup by duration. | ||||
| 55.1 Medium duration 1 to < 2 years in study | 4 | 424 | Mean Difference (IV, Random, 95% CI) | ‐0.00 [‐0.13, 0.13] |
| 55.2 Medium‐long duration: 2 to < 4 years in study | 2 | 1352 | Mean Difference (IV, Random, 95% CI) | ‐0.02 [‐0.05, 0.00] |
| 55.3 Long duration ≥ 4 years in study | 0 | 0 | Mean Difference (IV, Random, 95% CI) | 0.0 [0.0, 0.0] |
| 56 HDL, mmoL/L ‐ ALA ‐ subgroup by statin use Show forest plot | 6 | Mean Difference (IV, Random, 95% CI) | Subtotals only | |
| Analysis 5.56  Comparison 5 High vs low ALA omega‐3 fat (secondary outcomes), Outcome 56 HDL, mmoL/L ‐ ALA ‐ subgroup by statin use. | ||||
| 56.1 ALA ‐ ≥ 50% of control group on statins | 3 | 1329 | Mean Difference (IV, Random, 95% CI) | ‐0.03 [‐0.09, 0.03] |
| 56.2 ALA ‐ < 50% of control group on statins | 2 | 268 | Mean Difference (IV, Random, 95% CI) | 0.05 [‐0.14, 0.23] |
| 56.3 ALA ‐ use of statins unclear | 1 | 179 | Mean Difference (IV, Random, 95% CI) | ‐0.09 [‐0.20, 0.02] |
| 57 HDL, mmoL/L ‐ ALA ‐ subgroup by primary or secondary prevention Show forest plot | 7 | Mean Difference (IV, Random, 95% CI) | Subtotals only | |
| Analysis 5.57  Comparison 5 High vs low ALA omega‐3 fat (secondary outcomes), Outcome 57 HDL, mmoL/L ‐ ALA ‐ subgroup by primary or secondary prevention. | ||||
| 57.1 Low CVD risk | 2 | 305 | Mean Difference (IV, Random, 95% CI) | 0.03 [‐0.21, 0.26] |
| 57.2 Moderate CVD risk | 2 | 177 | Mean Difference (IV, Random, 95% CI) | ‐0.03 [‐0.10, 0.04] |
| 57.3 High CVD risk | 3 | 1368 | Mean Difference (IV, Random, 95% CI) | ‐0.03 [‐0.08, 0.03] |
| 58 Low‐density lipoprotein, serum, mmoL/L ‐ ALA Show forest plot | 7 | 2201 | Mean Difference (IV, Random, 95% CI) | ‐0.05 [‐0.15, 0.04] |
| Analysis 5.58  Comparison 5 High vs low ALA omega‐3 fat (secondary outcomes), Outcome 58 Low‐density lipoprotein, serum, mmoL/L ‐ ALA. | ||||
| 59 LDL, mmoL/L ‐ ALA ‐ SA fixed‐effect Show forest plot | 7 | 2201 | Mean Difference (IV, Fixed, 95% CI) | ‐0.05 [‐0.11, 0.00] |
| Analysis 5.59  Comparison 5 High vs low ALA omega‐3 fat (secondary outcomes), Outcome 59 LDL, mmoL/L ‐ ALA ‐ SA fixed‐effect. | ||||
| 60 LDL, mmoL/L ‐ ALA ‐ SA by summary risk of bias Show forest plot | 7 | Mean Difference (IV, Random, 95% CI) | Subtotals only | |
| Analysis 5.60  Comparison 5 High vs low ALA omega‐3 fat (secondary outcomes), Outcome 60 LDL, mmoL/L ‐ ALA ‐ SA by summary risk of bias. | ||||
| 60.1 Low risk of bias | 3 | 1350 | Mean Difference (IV, Random, 95% CI) | 0.02 [‐0.05, 0.10] |
| 60.2 Moderate/high risk of bias | 4 | 851 | Mean Difference (IV, Random, 95% CI) | ‐0.14 [‐0.22, ‐0.06] |
| 61 LDL, mmoL/L ‐ ALA ‐ SA by compliance and study size Show forest plot | 5 | Mean Difference (IV, Random, 95% CI) | Subtotals only | |
| Analysis 5.61  Comparison 5 High vs low ALA omega‐3 fat (secondary outcomes), Outcome 61 LDL, mmoL/L ‐ ALA ‐ SA by compliance and study size. | ||||
| 61.1 SA ‐ low risk of compliance bias | 5 | 2085 | Mean Difference (IV, Random, 95% CI) | ‐0.05 [‐0.16, 0.06] |
| 61.2 SA ‐ 100+ randomised | 5 | 2085 | Mean Difference (IV, Random, 95% CI) | ‐0.05 [‐0.16, 0.06] |
| 62 LDL, mmoL/L ‐ ALA ‐ subgroup by dose Show forest plot | 7 | Mean Difference (IV, Random, 95% CI) | Subtotals only | |
| Analysis 5.62  Comparison 5 High vs low ALA omega‐3 fat (secondary outcomes), Outcome 62 LDL, mmoL/L ‐ ALA ‐ subgroup by dose. | ||||
| 62.1 ALA low < 5 g/d | 4 | 1796 | Mean Difference (IV, Random, 95% CI) | ‐0.06 [‐0.17, 0.05] |
| 62.2 ALA high > 5 g/d | 3 | 405 | Mean Difference (IV, Random, 95% CI) | ‐0.04 [‐0.28, 0.19] |
| 63 LDL, mmoL/L ‐ ALA ‐ subgroup by intervention type Show forest plot | 7 | Mean Difference (IV, Random, 95% CI) | Subtotals only | |
| Analysis 5.63  Comparison 5 High vs low ALA omega‐3 fat (secondary outcomes), Outcome 63 LDL, mmoL/L ‐ ALA ‐ subgroup by intervention type. | ||||
| 63.1 Dietary advice | 0 | 0 | Mean Difference (IV, Random, 95% CI) | 0.0 [0.0, 0.0] |
| 63.2 Supplemental foods | 6 | 2075 | Mean Difference (IV, Random, 95% CI) | ‐0.06 [‐0.17, 0.05] |
| 63.3 Supplement (capsule) | 0 | 0 | Mean Difference (IV, Random, 95% CI) | 0.0 [0.0, 0.0] |
| 63.4 Any combination | 1 | 126 | Mean Difference (IV, Random, 95% CI) | 0.0 [‐0.25, 0.25] |
| 64 LDL, mmoL/L ‐ ALA ‐ subgroup by replacement Show forest plot | 7 | Mean Difference (IV, Random, 95% CI) | Subtotals only | |
| Analysis 5.64  Comparison 5 High vs low ALA omega‐3 fat (secondary outcomes), Outcome 64 LDL, mmoL/L ‐ ALA ‐ subgroup by replacement. | ||||
| 64.1 ALA replacing SFA | 0 | 0 | Mean Difference (IV, Random, 95% CI) | 0.0 [0.0, 0.0] |
| 64.2 ALA replacing MUFA | 2 | 1250 | Mean Difference (IV, Random, 95% CI) | 0.01 [‐0.07, 0.09] |
| 64.3 ALA replacing n‐6 | 1 | 142 | Mean Difference (IV, Random, 95% CI) | 0.14 [‐0.08, 0.36] |
| 64.4 ALA replacing carbs/sugars | 0 | 0 | Mean Difference (IV, Random, 95% CI) | 0.0 [0.0, 0.0] |
| 64.5 ALA replacing nil/low n‐3 placebo | 1 | 32 | Mean Difference (IV, Random, 95% CI) | ‐0.10 [‐0.59, 0.39] |
| 64.6 Replacement unclear | 3 | 777 | Mean Difference (IV, Random, 95% CI) | ‐0.16 [‐0.24, ‐0.07] |
| 65 LDL, mmoL/L ‐ ALA ‐ subgroup by duration Show forest plot | 7 | Mean Difference (IV, Random, 95% CI) | Subtotals only | |
| Analysis 5.65  Comparison 5 High vs low ALA omega‐3 fat (secondary outcomes), Outcome 65 LDL, mmoL/L ‐ ALA ‐ subgroup by duration. | ||||
| 65.1 Medium duration 1 to < 2 years in study | 5 | 935 | Mean Difference (IV, Random, 95% CI) | ‐0.14 [‐0.22, ‐0.06] |
| 65.2 Medium‐long duration: 2 to < 4 years in study | 2 | 1266 | Mean Difference (IV, Random, 95% CI) | 0.03 [‐0.06, 0.13] |
| 65.3 Long duration ≥ 4 years in study | 0 | 0 | Mean Difference (IV, Random, 95% CI) | 0.0 [0.0, 0.0] |
| 66 LDL, mmoL/L ‐ ALA ‐ subgroup by statin use Show forest plot | 7 | Mean Difference (IV, Random, 95% CI) | Subtotals only | |
| Analysis 5.66  Comparison 5 High vs low ALA omega‐3 fat (secondary outcomes), Outcome 66 LDL, mmoL/L ‐ ALA ‐ subgroup by statin use. | ||||
| 66.1 ALA ‐ ≥ 50% of control group on statins | 3 | 1240 | Mean Difference (IV, Random, 95% CI) | 0.00 [‐0.08, 0.08] |
| 66.2 ALA ‐ < 50% of control group on statins | 2 | 268 | Mean Difference (IV, Random, 95% CI) | 0.08 [‐0.09, 0.24] |
| 66.3 ALA ‐ use of statins unclear | 2 | 693 | Mean Difference (IV, Random, 95% CI) | ‐0.16 [‐0.25, ‐0.07] |
| 67 LDL, mmoL/L ‐ ALA ‐ subgroup by primary or secondary prevention Show forest plot | 7 | Mean Difference (IV, Random, 95% CI) | Subtotals only | |
| Analysis 5.67  Comparison 5 High vs low ALA omega‐3 fat (secondary outcomes), Outcome 67 LDL, mmoL/L ‐ ALA ‐ subgroup by primary or secondary prevention. | ||||
| 67.1 Primary prevention of CVD | 5 | 993 | Mean Difference (IV, Random, 95% CI) | ‐0.08 [‐0.20, 0.05] |
| 67.2 Secondary prevention of CVD | 2 | 1208 | Mean Difference (IV, Random, 95% CI) | 0.01 [‐0.08, 0.09] |
| Outcome or subgroup title | No. of studies | No. of participants | Statistical method | Effect size |
| 1 Blood pressure, mmHg ‐ ALA Show forest plot | 4 | Mean Difference (IV, Random, 95% CI) | Subtotals only | |
| Analysis 6.1  Comparison 6 High vs low ALA omega‐3 fats (tertiary outcomes), Outcome 1 Blood pressure, mmHg ‐ ALA. | ||||
| 1.1 Systolic BP ‐ ALA | 4 | 1671 | Mean Difference (IV, Random, 95% CI) | ‐0.87 [‐4.48, 2.75] |
| 1.2 Diastolic BP ‐ ALA | 4 | 1671 | Mean Difference (IV, Random, 95% CI) | ‐1.42 [‐4.40, 1.57] |
| 2 Serious adverse events ‐ ALA Show forest plot | 2 | Risk Ratio (M‐H, Random, 95% CI) | Subtotals only | |
| Analysis 6.2  Comparison 6 High vs low ALA omega‐3 fats (tertiary outcomes), Outcome 2 Serious adverse events ‐ ALA. | ||||
| 2.1 Any serious adverse events | 0 | 0 | Risk Ratio (M‐H, Random, 95% CI) | 0.0 [0.0, 0.0] |
| 2.2 Bleeding | 0 | 0 | Risk Ratio (M‐H, Random, 95% CI) | 0.0 [0.0, 0.0] |
| 2.3 GI hospitalisation | 0 | 0 | Risk Ratio (M‐H, Random, 95% CI) | 0.0 [0.0, 0.0] |
| 2.4 Pulmonary embolus or DVT | 1 | 708 | Risk Ratio (M‐H, Random, 95% CI) | 0.32 [0.01, 7.80] |
| 2.5 Thrombophleibitis | 1 | 13406 | Risk Ratio (M‐H, Random, 95% CI) | 1.59 [0.72, 3.51] |
| 2.6 Urolithiasis | 1 | 13406 | Risk Ratio (M‐H, Random, 95% CI) | 0.80 [0.47, 1.36] |
| 3 Side effects ‐ ALA Show forest plot | 5 | Risk Ratio (M‐H, Random, 95% CI) | Subtotals only | |
| Analysis 6.3  Comparison 6 High vs low ALA omega‐3 fats (tertiary outcomes), Outcome 3 Side effects ‐ ALA. | ||||
| 3.1 Dropouts due to side effects | 5 | 3480 | Risk Ratio (M‐H, Random, 95% CI) | 2.10 [0.66, 6.71] |
| 3.2 Abdominal pain or discomfort | 0 | 0 | Risk Ratio (M‐H, Random, 95% CI) | 0.0 [0.0, 0.0] |
| 3.3 Diarrhoea | 1 | 708 | Risk Ratio (M‐H, Random, 95% CI) | 3.82 [0.82, 17.88] |
| 3.4 Nausea | 1 | 110 | Risk Ratio (M‐H, Random, 95% CI) | 6.29 [0.33, 118.93] |
| 3.5 Any gastrointestinal side effect ‐ ALA | 4 | 3450 | Risk Ratio (M‐H, Random, 95% CI) | 2.06 [0.62, 6.80] |
| 3.6 Pain (joint, lumbar, muscle pain) | 0 | 0 | Risk Ratio (M‐H, Random, 95% CI) | 0.0 [0.0, 0.0] |
| 3.7 All side effects combined | 0 | 0 | Risk Ratio (M‐H, Random, 95% CI) | 0.0 [0.0, 0.0] |
| 4 Dropouts ‐ ALA Show forest plot | 6 | 3663 | Risk Ratio (M‐H, Random, 95% CI) | 1.08 [0.92, 1.25] |
| Analysis 6.4  Comparison 6 High vs low ALA omega‐3 fats (tertiary outcomes), Outcome 4 Dropouts ‐ ALA. | ||||

Study flow diagram.

Risk of bias summary: review authors' judgements about each risk of bias item for each included study.
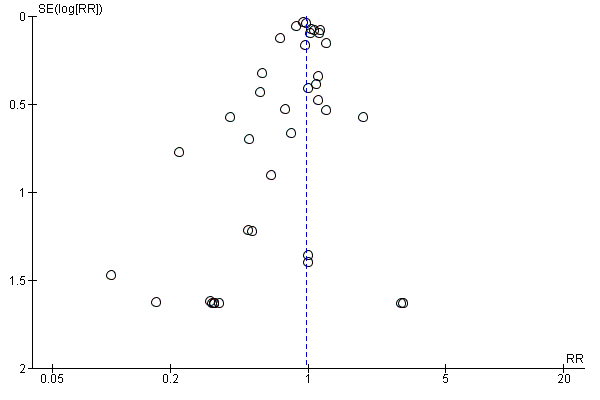
Funnel plot of comparison: 1 High vs low LCn3 omega‐3 fats (primary outcomes), outcome: 1.1 Aall‐cause mortality (overall) – LCn3.
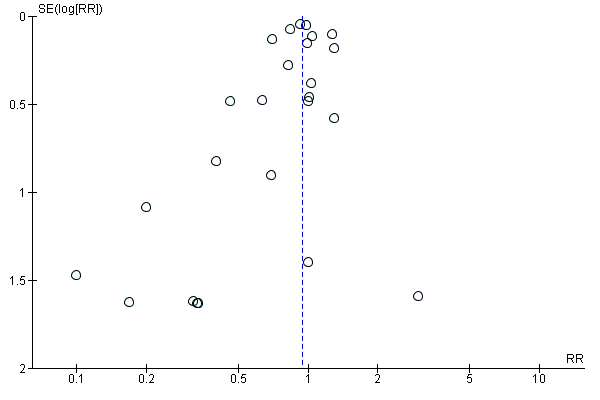
Funnel plot of comparison: 1 High vs low LCn3 omega‐3 fats (primary outcomes), outcome: 1.11 Cardiovascular mortality (overall) – LCn3.
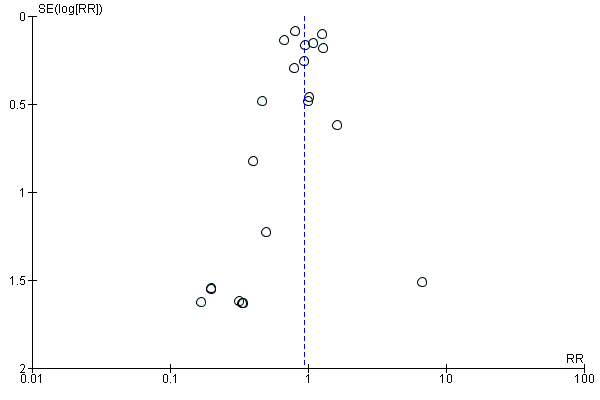
Funnel plot of comparison: 1 High vs low LCn3 omega‐3 fats (primary outcomes), outcome: 1.31 Coronary heart disease mortality (overall) – LCn3.

Funnel plot of comparison: 1 High vs low LCn3 omega‐3 fats (primary outcomes), outcome: 1.43 Coronary heart disease events (overall) – LCn3.

Comparison 1 High vs low LCn3 omega‐3 fats (primary outcomes), Outcome 1 All‐cause mortality (overall) ‐ LCn3.
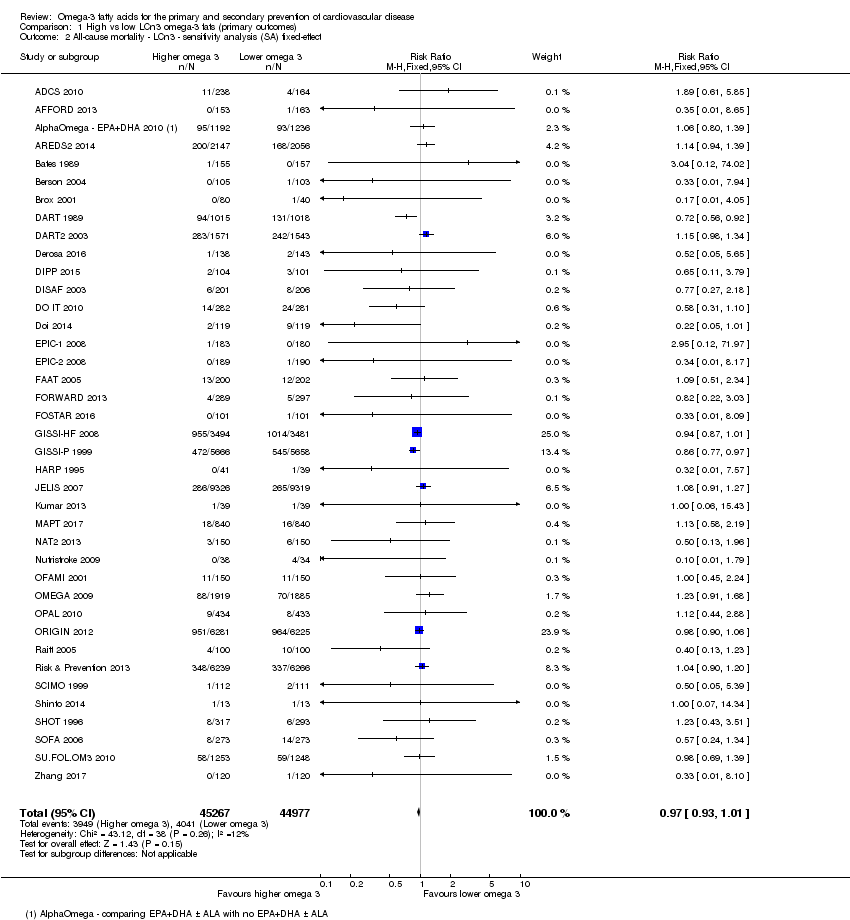
Comparison 1 High vs low LCn3 omega‐3 fats (primary outcomes), Outcome 2 All‐cause mortality ‐ LCn3 ‐ sensitivity analysis (SA) fixed‐effect.

Comparison 1 High vs low LCn3 omega‐3 fats (primary outcomes), Outcome 3 All‐cause mortality ‐ LCn3 ‐ SA by summary risk of bias.

Comparison 1 High vs low LCn3 omega‐3 fats (primary outcomes), Outcome 4 All‐cause mortality ‐ LCn3 ‐ SA by compliance and study size.

Comparison 1 High vs low LCn3 omega‐3 fats (primary outcomes), Outcome 5 All‐cause mortality ‐ LCn3 ‐ subgroup by dose.

Comparison 1 High vs low LCn3 omega‐3 fats (primary outcomes), Outcome 6 All‐cause mortality ‐ LCn3 ‐ subgroup by replacement.
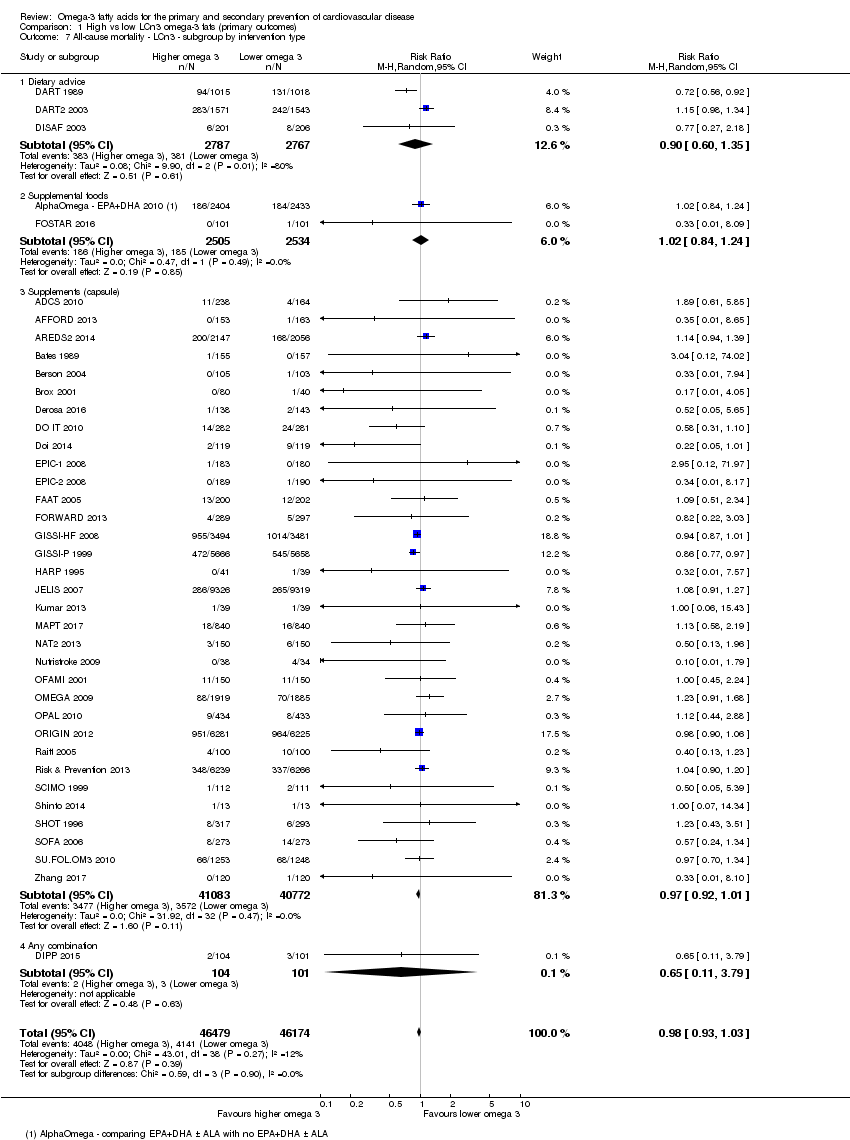
Comparison 1 High vs low LCn3 omega‐3 fats (primary outcomes), Outcome 7 All‐cause mortality ‐ LCn3 ‐ subgroup by intervention type.

Comparison 1 High vs low LCn3 omega‐3 fats (primary outcomes), Outcome 8 All‐cause mortality ‐ LCn3 ‐ subgroup by duration.
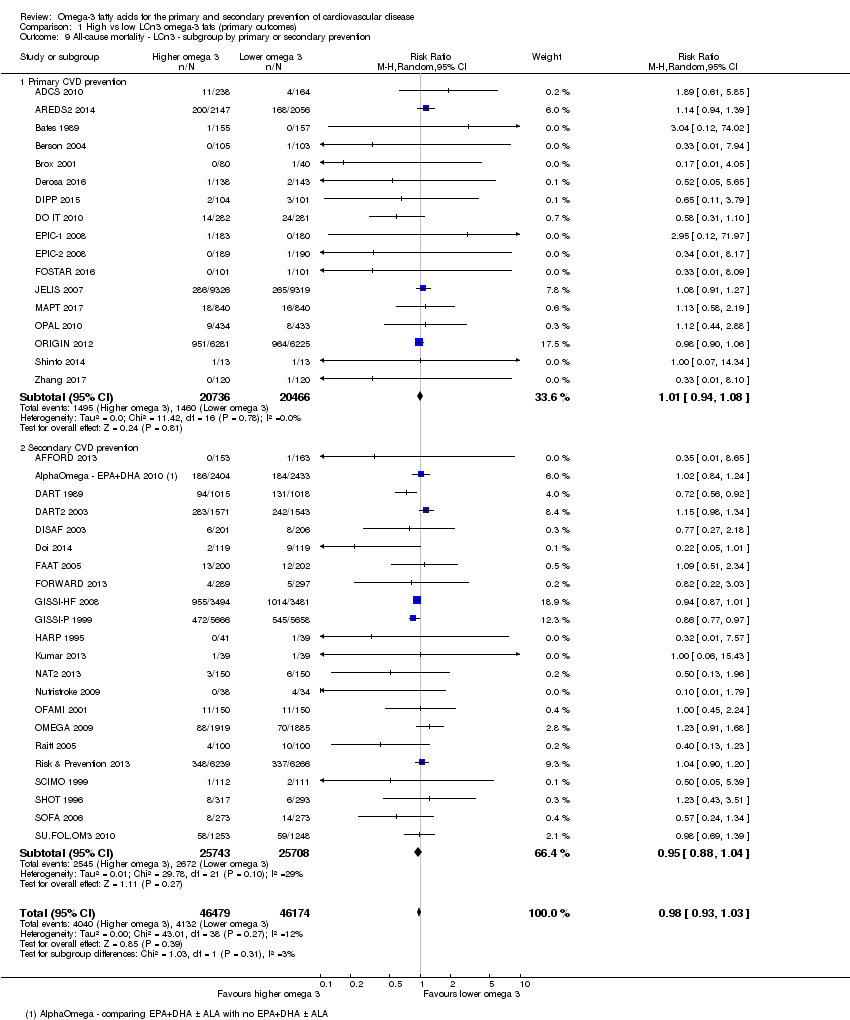
Comparison 1 High vs low LCn3 omega‐3 fats (primary outcomes), Outcome 9 All‐cause mortality ‐ LCn3 ‐ subgroup by primary or secondary prevention.
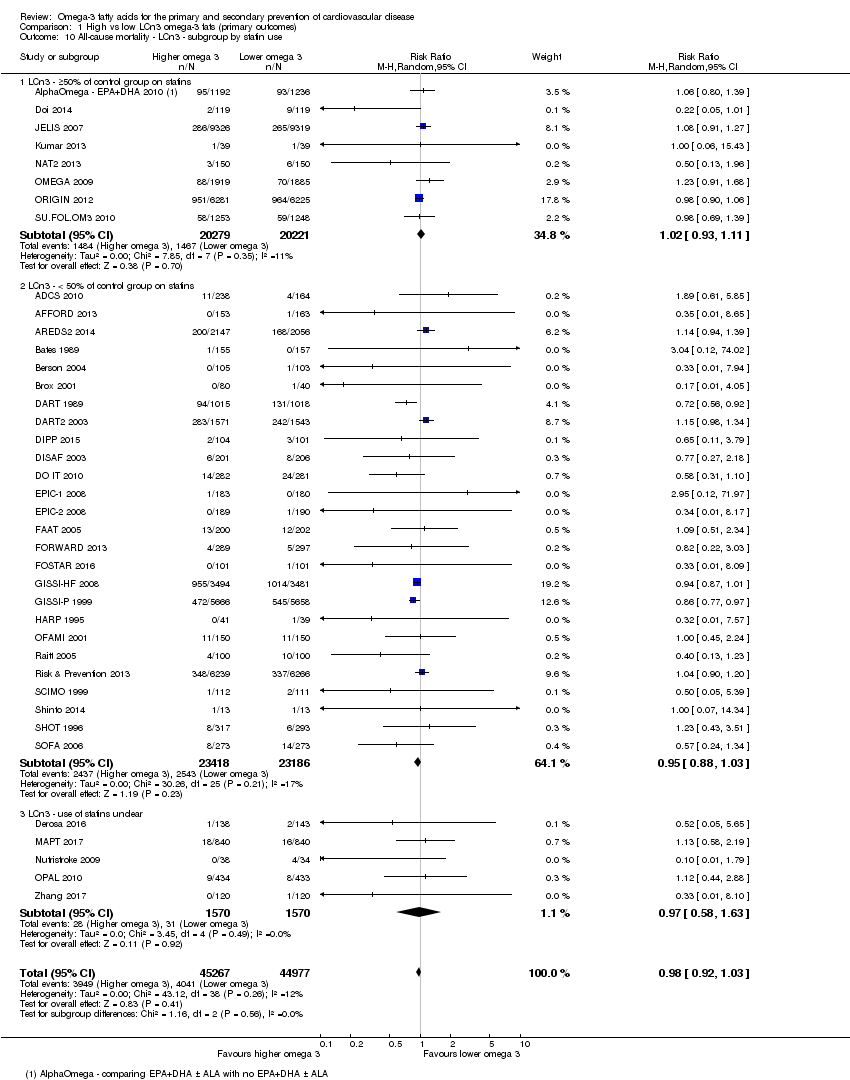
Comparison 1 High vs low LCn3 omega‐3 fats (primary outcomes), Outcome 10 All‐cause mortality ‐ LCn3 ‐ subgroup by statin use.

Comparison 1 High vs low LCn3 omega‐3 fats (primary outcomes), Outcome 11 Cardiovascular mortality (overall) ‐ LCn3.
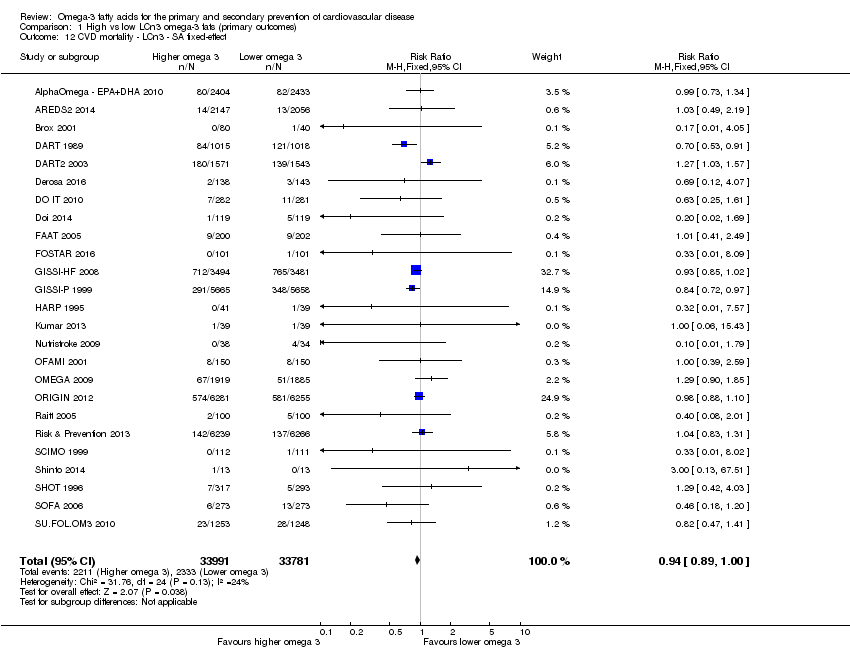
Comparison 1 High vs low LCn3 omega‐3 fats (primary outcomes), Outcome 12 CVD mortality ‐ LCn3 ‐ SA fixed‐effect.

Comparison 1 High vs low LCn3 omega‐3 fats (primary outcomes), Outcome 13 CVD mortality ‐ LCn3 ‐ SA by summary risk of bias.
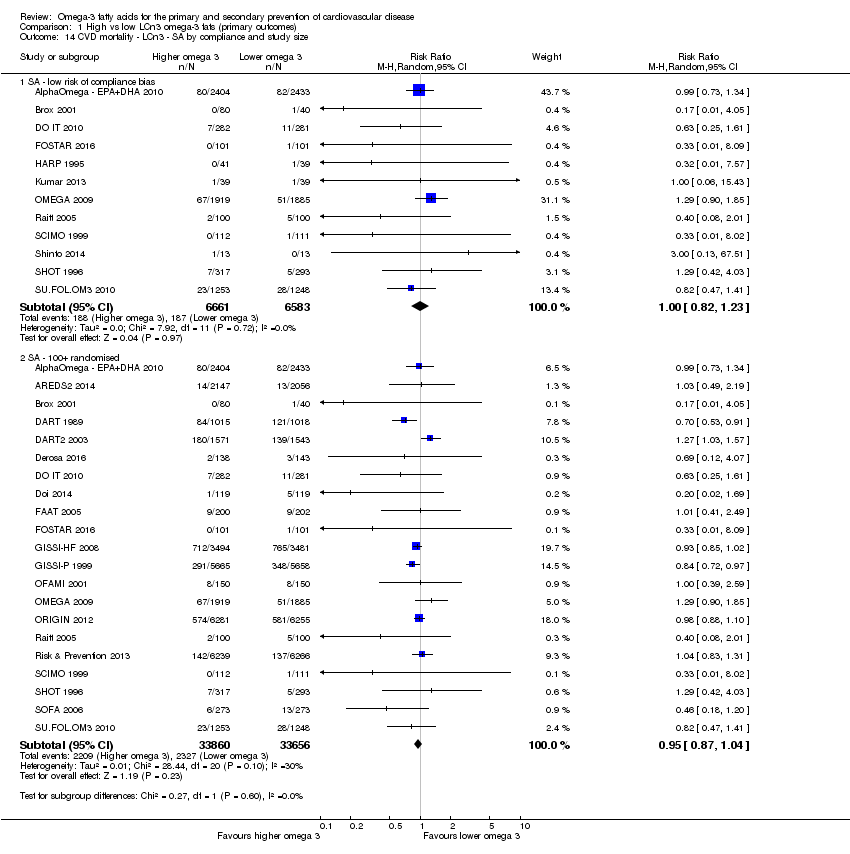
Comparison 1 High vs low LCn3 omega‐3 fats (primary outcomes), Outcome 14 CVD mortality ‐ LCn3 ‐ SA by compliance and study size.
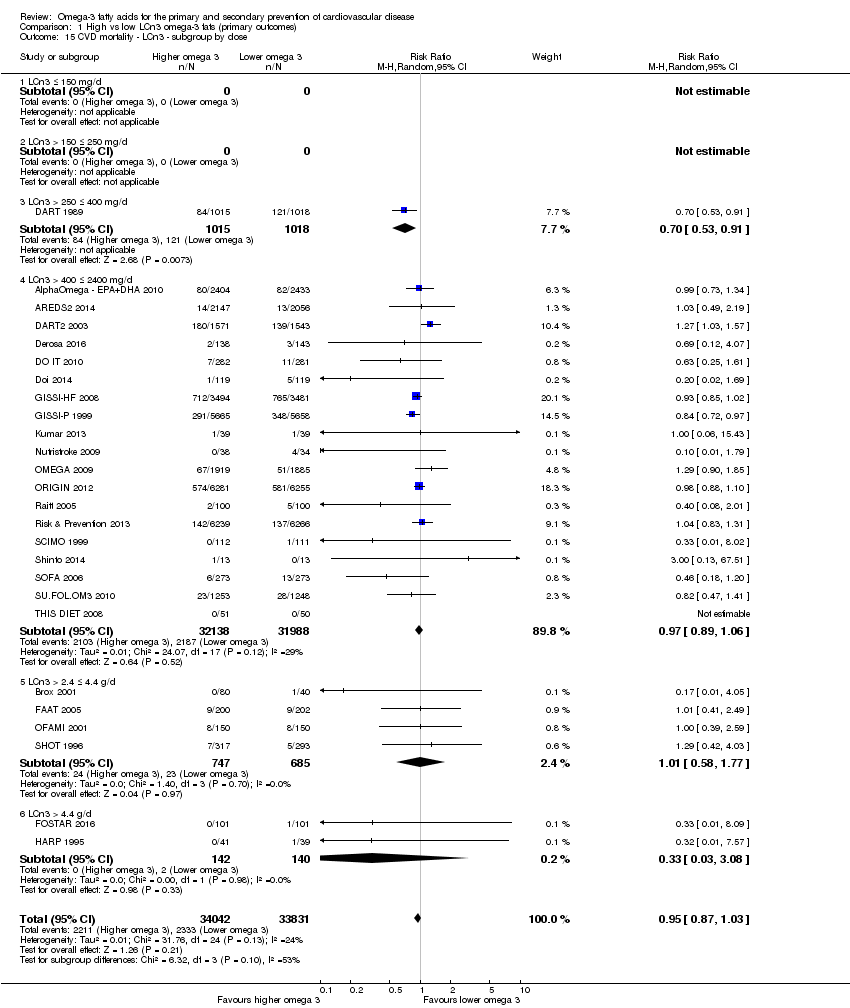
Comparison 1 High vs low LCn3 omega‐3 fats (primary outcomes), Outcome 15 CVD mortality ‐ LCn3 ‐ subgroup by dose.

Comparison 1 High vs low LCn3 omega‐3 fats (primary outcomes), Outcome 16 CVD mortality ‐ LCn3 ‐ subgroup by replacement.
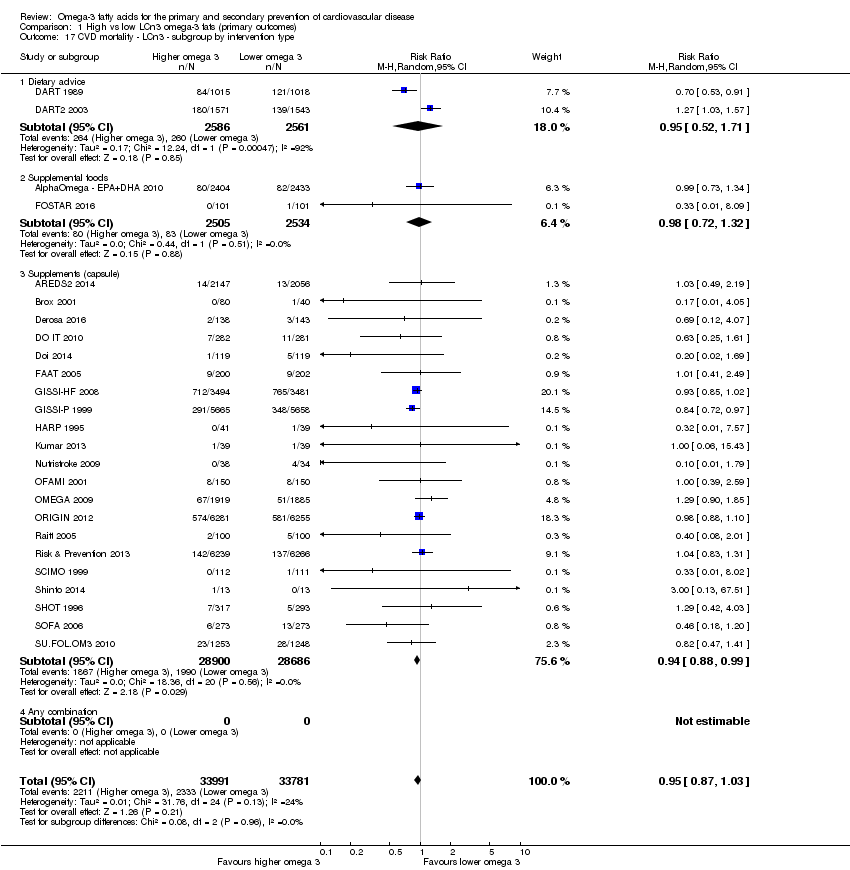
Comparison 1 High vs low LCn3 omega‐3 fats (primary outcomes), Outcome 17 CVD mortality ‐ LCn3 ‐ subgroup by intervention type.
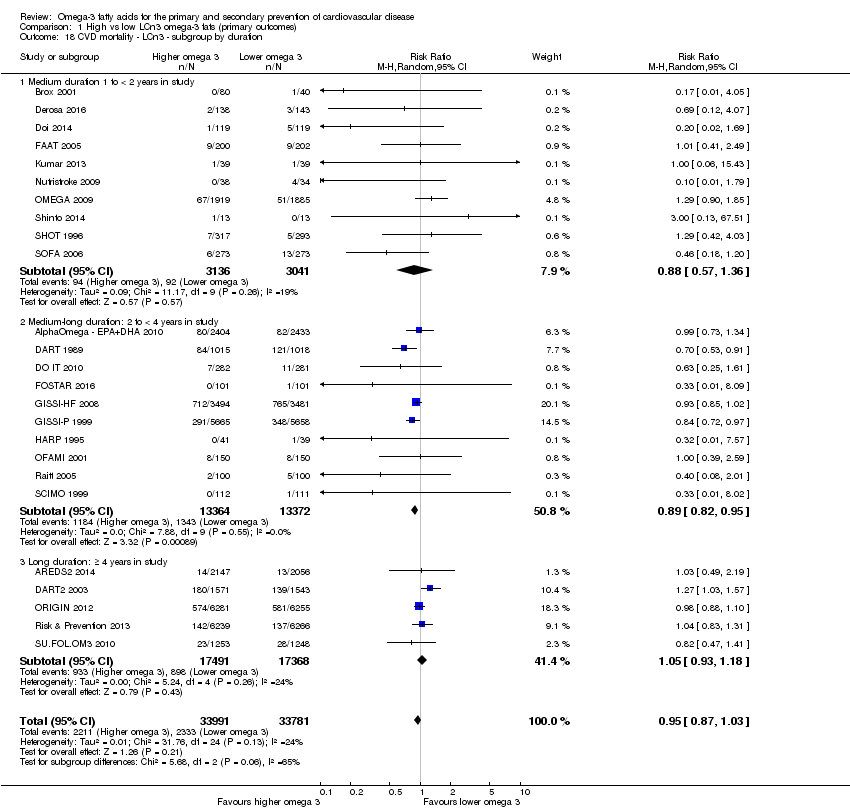
Comparison 1 High vs low LCn3 omega‐3 fats (primary outcomes), Outcome 18 CVD mortality ‐ LCn3 ‐ subgroup by duration.
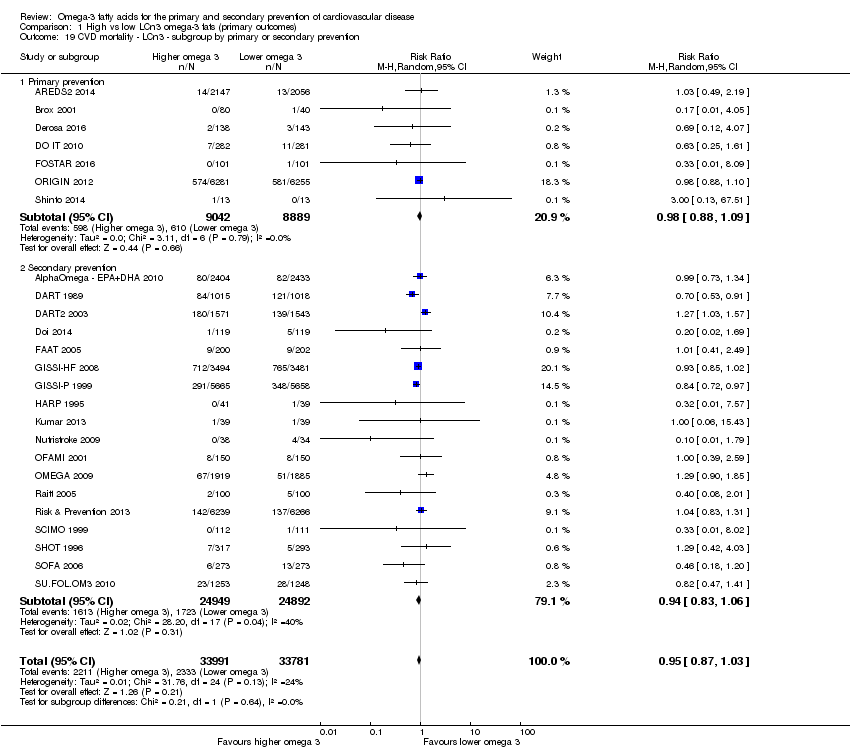
Comparison 1 High vs low LCn3 omega‐3 fats (primary outcomes), Outcome 19 CVD mortality ‐ LCn3 ‐ subgroup by primary or secondary prevention.

Comparison 1 High vs low LCn3 omega‐3 fats (primary outcomes), Outcome 20 CVD mortality ‐ LCn3 ‐ subgroup by statin uses.
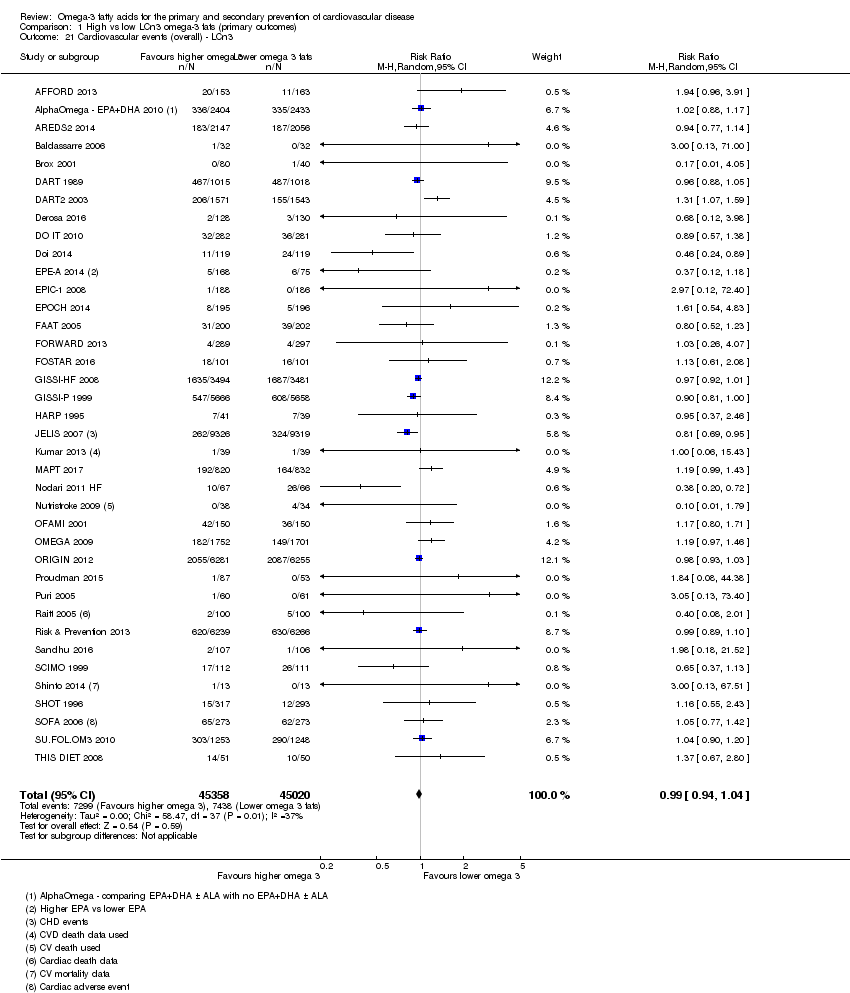
Comparison 1 High vs low LCn3 omega‐3 fats (primary outcomes), Outcome 21 Cardiovascular events (overall) ‐ LCn3.
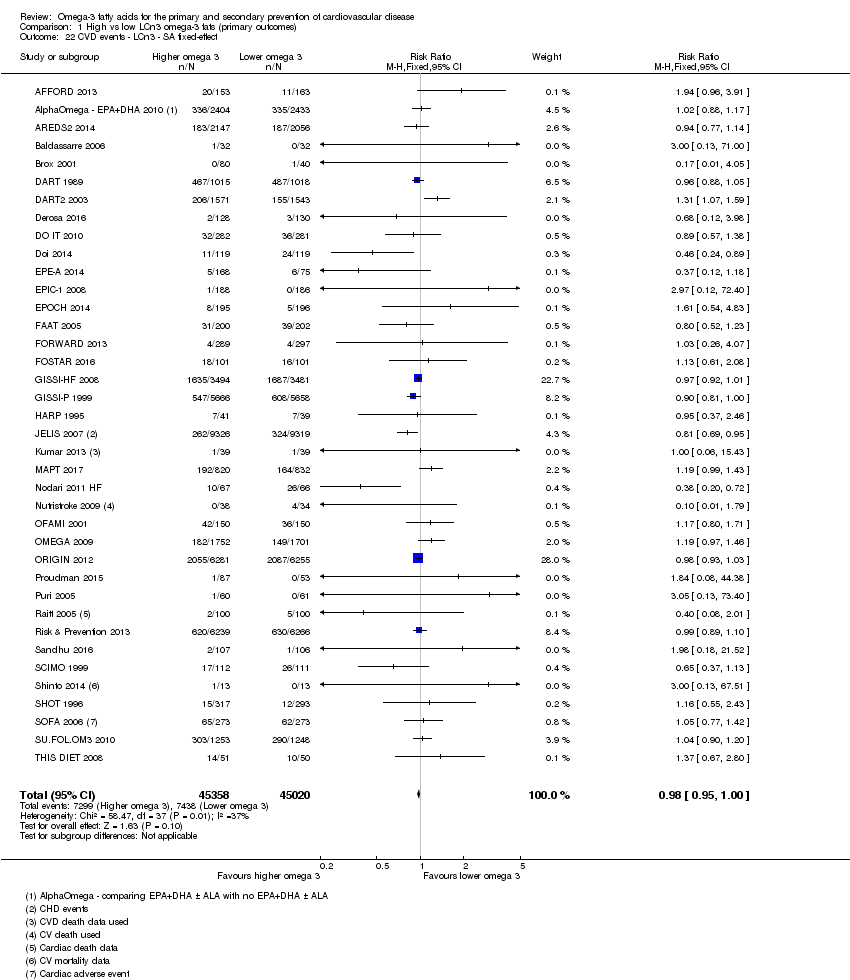
Comparison 1 High vs low LCn3 omega‐3 fats (primary outcomes), Outcome 22 CVD events ‐ LCn3 ‐ SA fixed‐effect.

Comparison 1 High vs low LCn3 omega‐3 fats (primary outcomes), Outcome 23 CVD events ‐ LCn3 ‐ SA by summary risk of bias.

Comparison 1 High vs low LCn3 omega‐3 fats (primary outcomes), Outcome 24 CVD events ‐ LCn3 ‐ SA by compliance and study size.
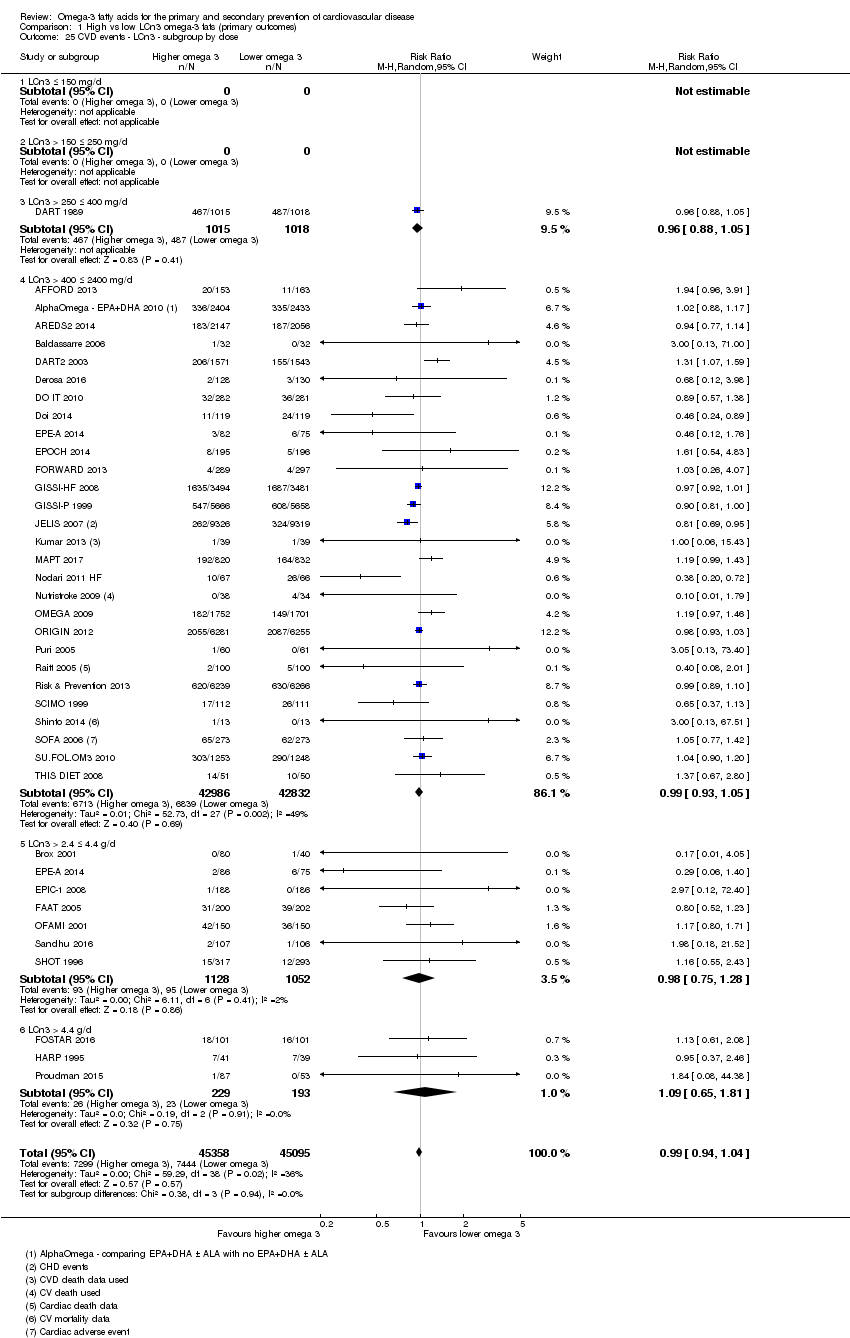
Comparison 1 High vs low LCn3 omega‐3 fats (primary outcomes), Outcome 25 CVD events ‐ LCn3 ‐ subgroup by dose.

Comparison 1 High vs low LCn3 omega‐3 fats (primary outcomes), Outcome 26 CVD events ‐ LCn3 ‐ subgroup by replacement.

Comparison 1 High vs low LCn3 omega‐3 fats (primary outcomes), Outcome 27 CVD events ‐ LCn3 ‐ subgroup by intervention type.
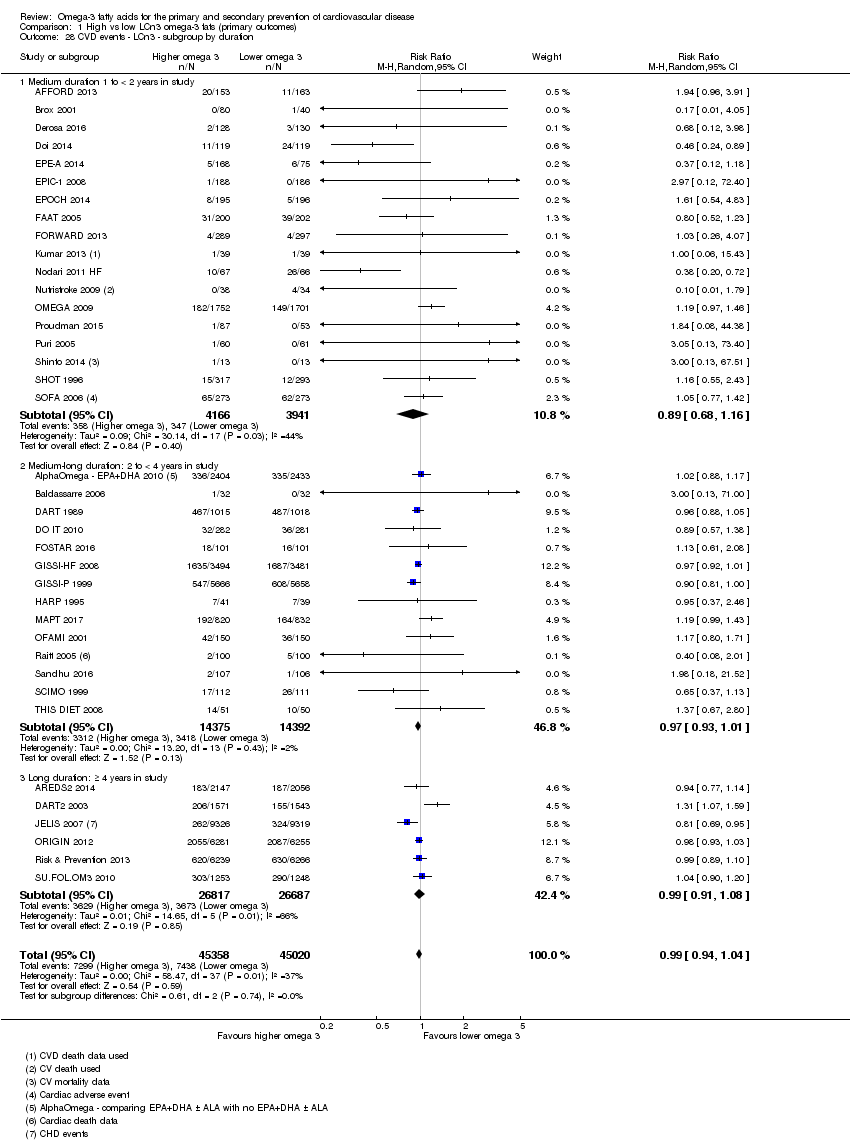
Comparison 1 High vs low LCn3 omega‐3 fats (primary outcomes), Outcome 28 CVD events ‐ LCn3 ‐ subgroup by duration.
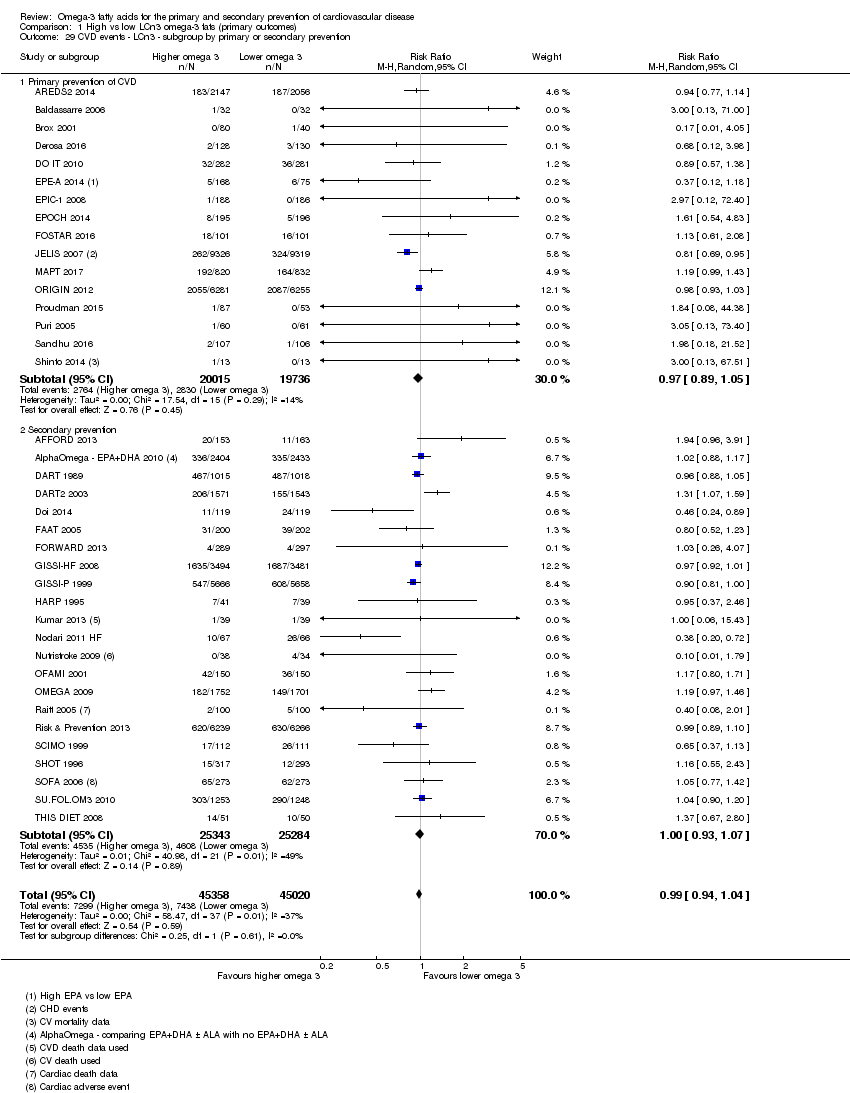
Comparison 1 High vs low LCn3 omega‐3 fats (primary outcomes), Outcome 29 CVD events ‐ LCn3 ‐ subgroup by primary or secondary prevention.

Comparison 1 High vs low LCn3 omega‐3 fats (primary outcomes), Outcome 30 CVD events ‐ LCn3 ‐ subgroup by statin use.

Comparison 1 High vs low LCn3 omega‐3 fats (primary outcomes), Outcome 31 Coronary heart disease mortality (overall) ‐ LCn3.

Comparison 1 High vs low LCn3 omega‐3 fats (primary outcomes), Outcome 32 CHD mortality ‐ LCn3 ‐ SA fixed‐effect.

Comparison 1 High vs low LCn3 omega‐3 fats (primary outcomes), Outcome 33 CHD mortality ‐ LCn3 ‐ SA by summary risk of bias.
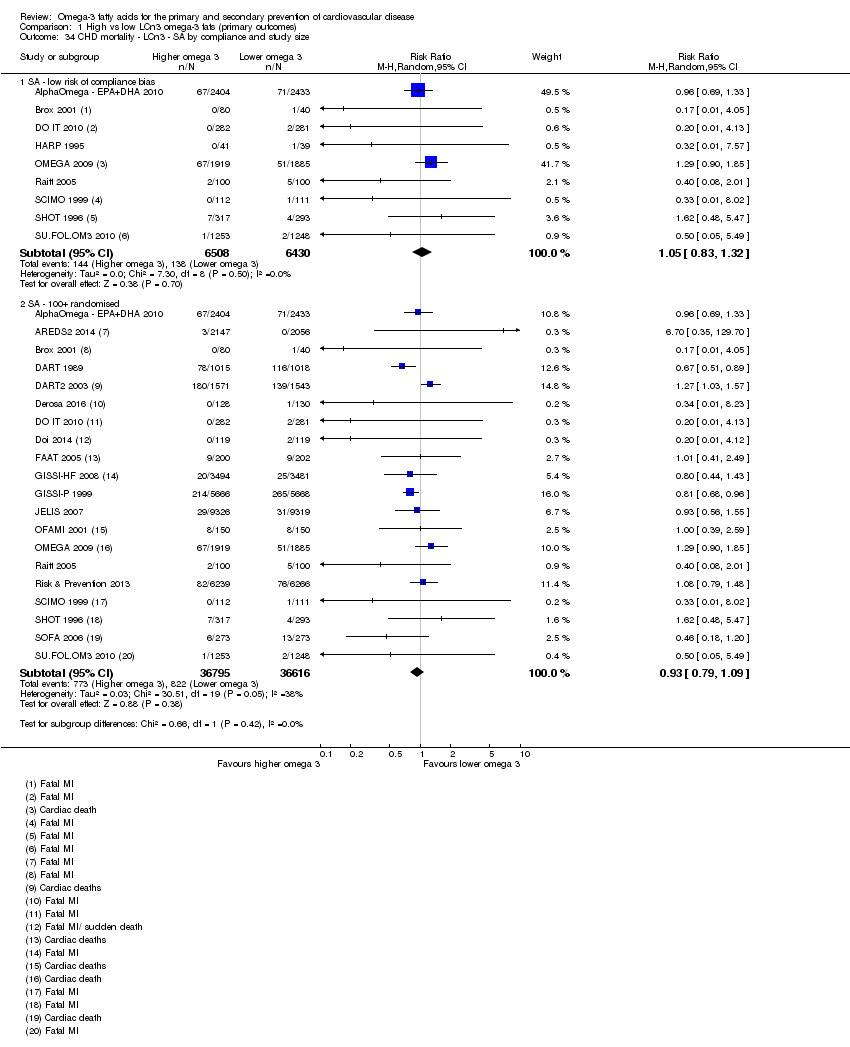
Comparison 1 High vs low LCn3 omega‐3 fats (primary outcomes), Outcome 34 CHD mortality ‐ LCn3 ‐ SA by compliance and study size.
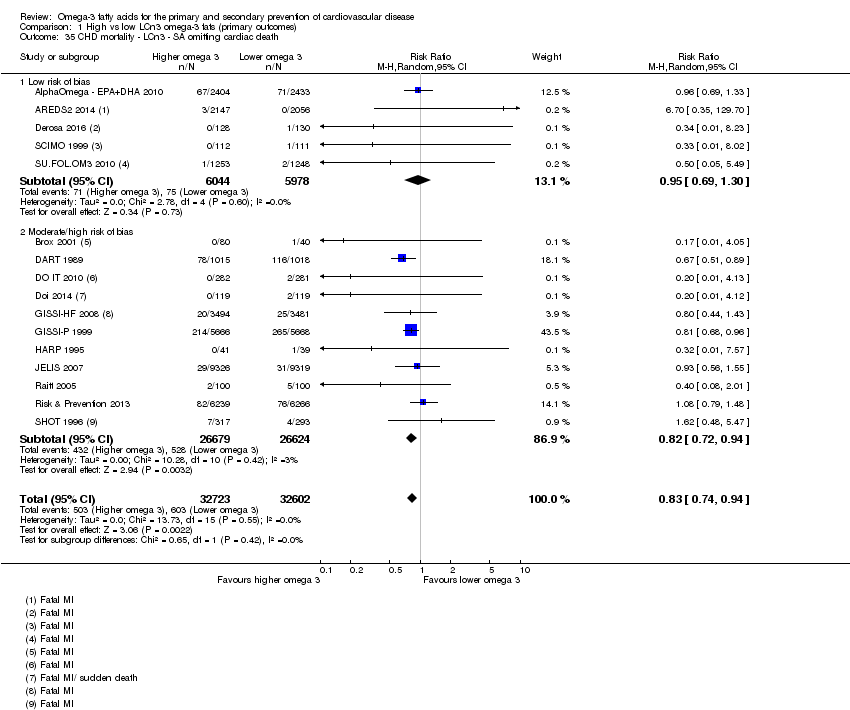
Comparison 1 High vs low LCn3 omega‐3 fats (primary outcomes), Outcome 35 CHD mortality ‐ LCn3 ‐ SA omitting cardiac death.

Comparison 1 High vs low LCn3 omega‐3 fats (primary outcomes), Outcome 36 CHD mortality ‐ LCn3 ‐ subgroup by dose.

Comparison 1 High vs low LCn3 omega‐3 fats (primary outcomes), Outcome 37 CHD mortality ‐ LCn3 ‐ subgroup by replacement.
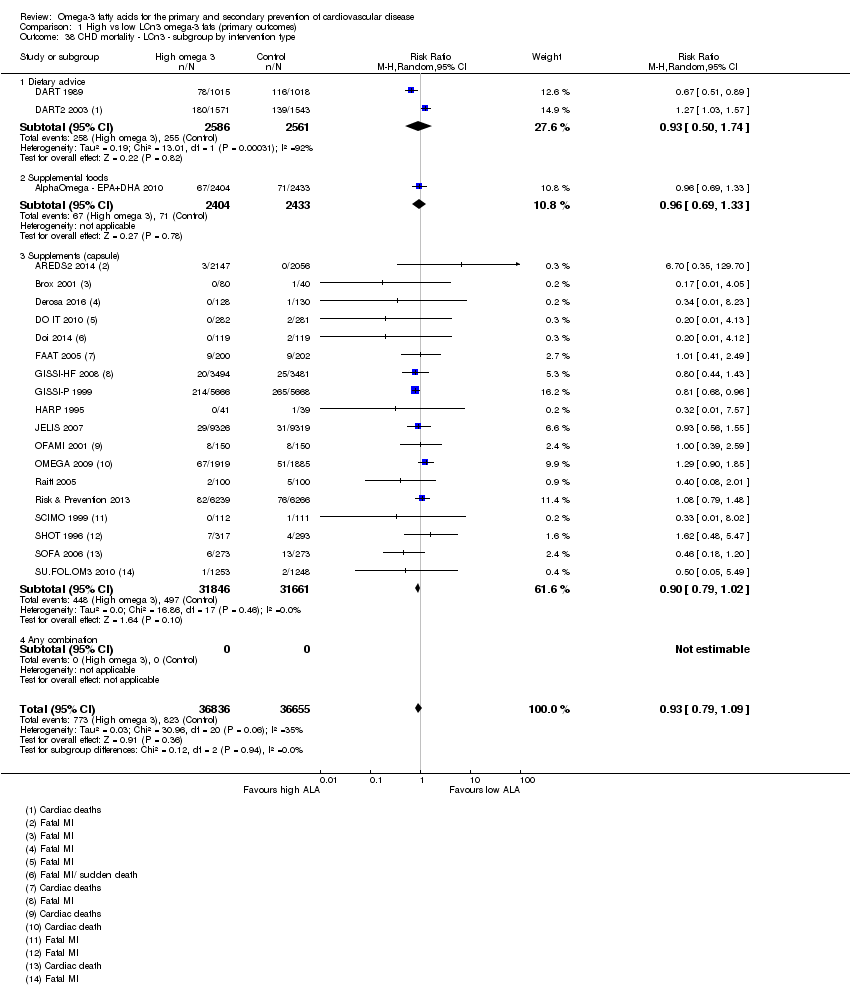
Comparison 1 High vs low LCn3 omega‐3 fats (primary outcomes), Outcome 38 CHD mortality ‐ LCn3 ‐ subgroup by intervention type.

Comparison 1 High vs low LCn3 omega‐3 fats (primary outcomes), Outcome 39 CHD mortality ‐ LCn3 ‐ subgroup by duration.

Comparison 1 High vs low LCn3 omega‐3 fats (primary outcomes), Outcome 40 CHD mortality ‐ LCn3 ‐ subgroup by primary or secondary prevention.
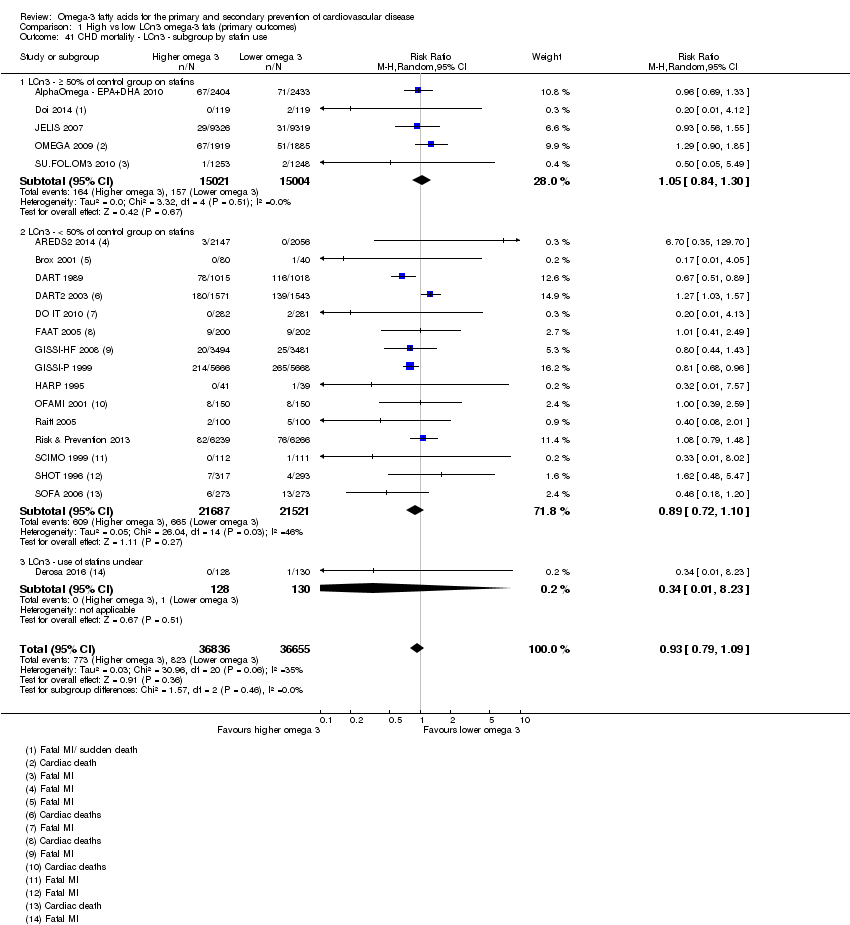
Comparison 1 High vs low LCn3 omega‐3 fats (primary outcomes), Outcome 41 CHD mortality ‐ LCn3 ‐ subgroup by statin use.
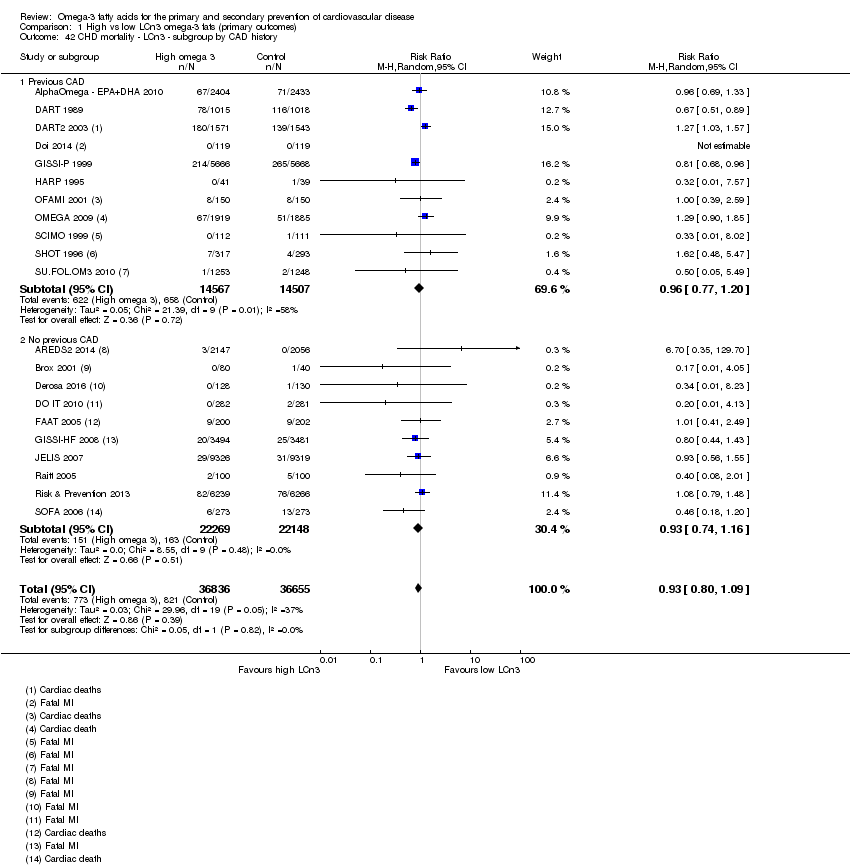
Comparison 1 High vs low LCn3 omega‐3 fats (primary outcomes), Outcome 42 CHD mortality ‐ LCn3 ‐ subgroup by CAD history.
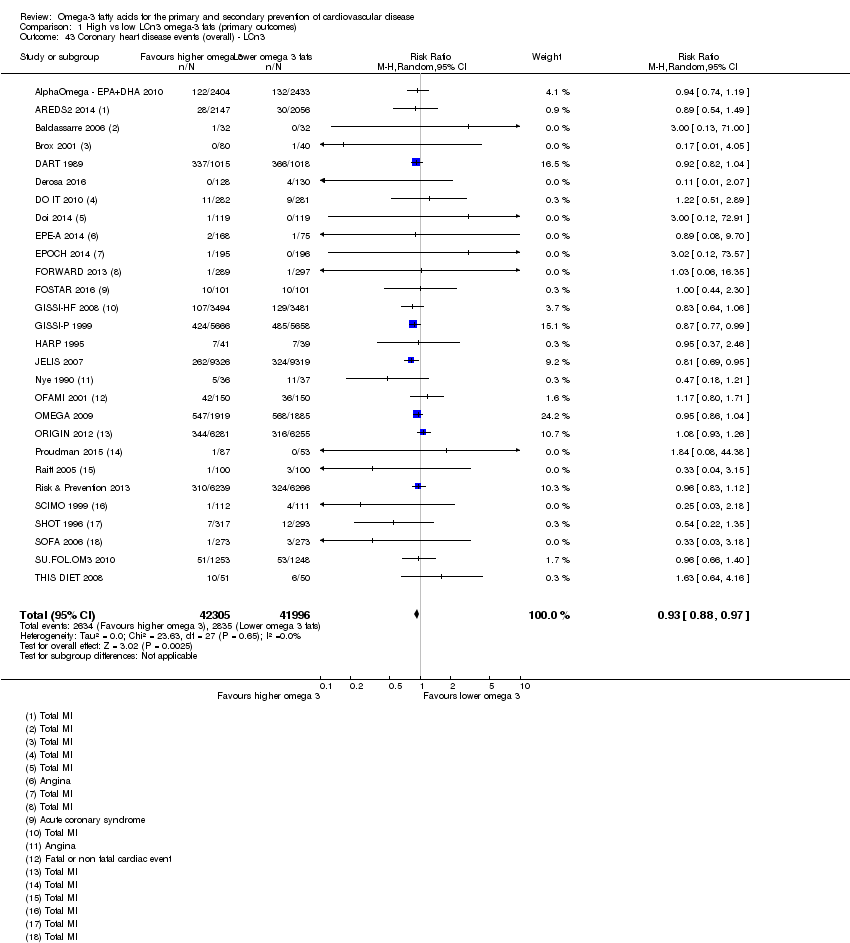
Comparison 1 High vs low LCn3 omega‐3 fats (primary outcomes), Outcome 43 Coronary heart disease events (overall) ‐ LCn3.
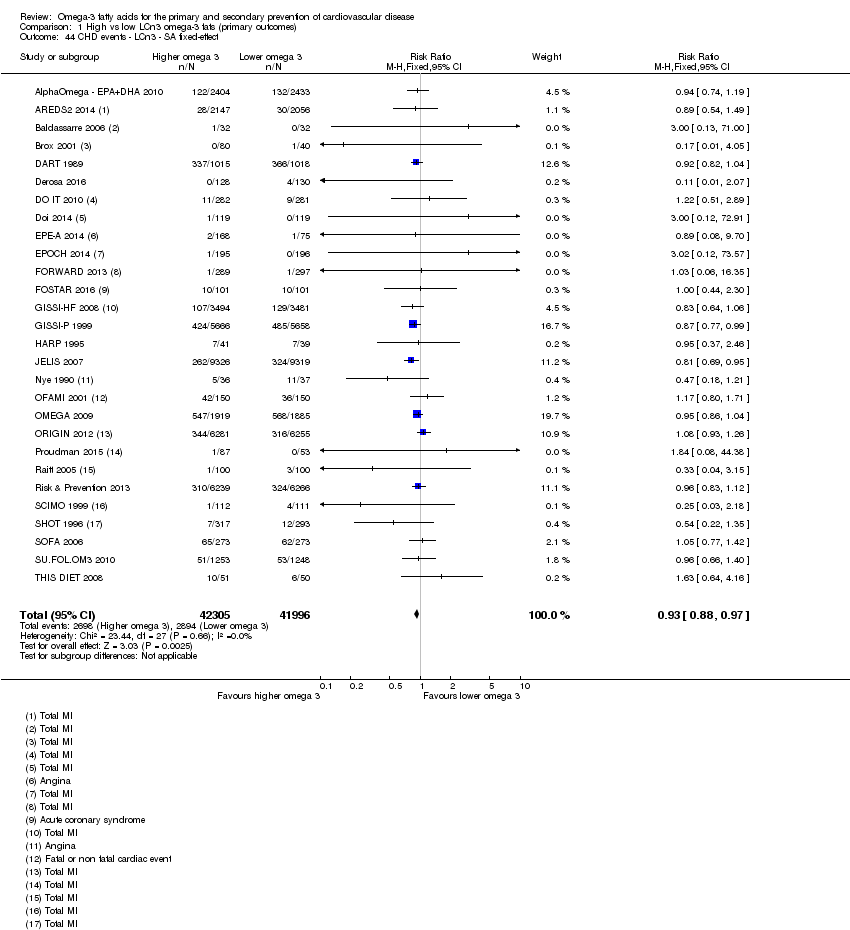
Comparison 1 High vs low LCn3 omega‐3 fats (primary outcomes), Outcome 44 CHD events ‐ LCn3 ‐ SA fixed‐effect.
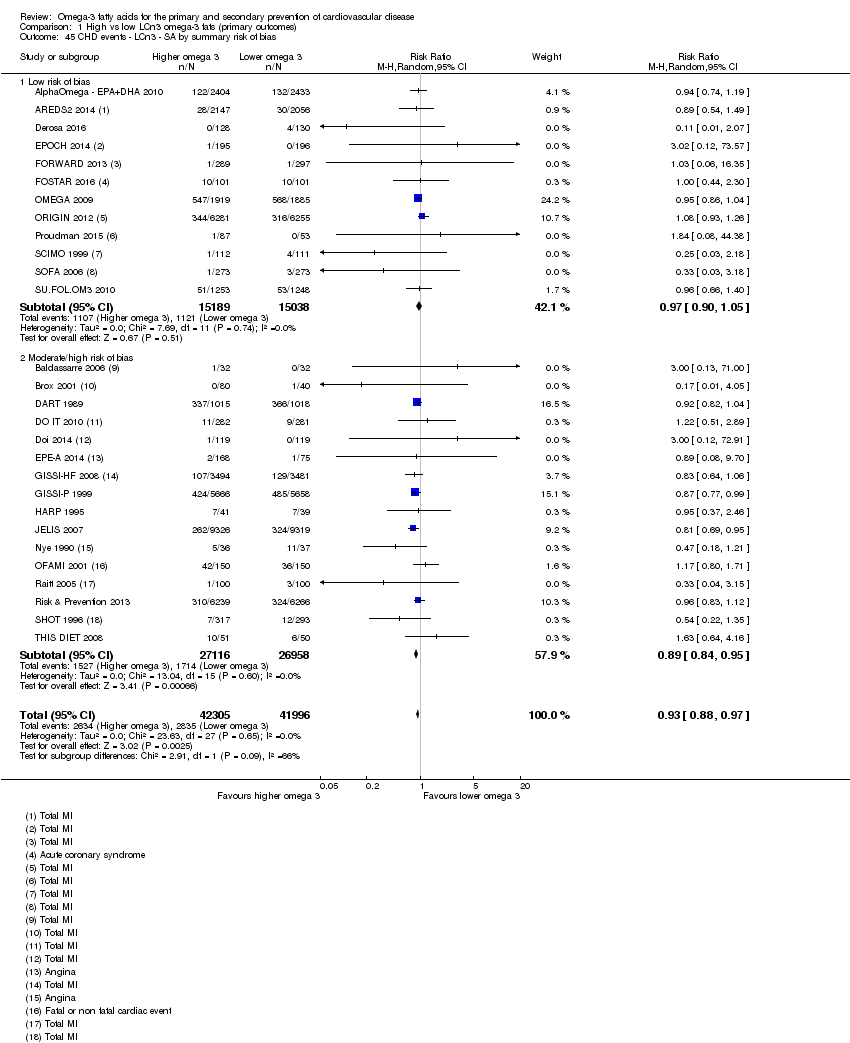
Comparison 1 High vs low LCn3 omega‐3 fats (primary outcomes), Outcome 45 CHD events ‐ LCn3 ‐ SA by summary risk of bias.

Comparison 1 High vs low LCn3 omega‐3 fats (primary outcomes), Outcome 46 CHD events ‐ LCn3 ‐ SA by compliance and study size.

Comparison 1 High vs low LCn3 omega‐3 fats (primary outcomes), Outcome 47 CHD events ‐ LCn3 ‐ subgroup by dose.

Comparison 1 High vs low LCn3 omega‐3 fats (primary outcomes), Outcome 48 CHD events ‐ LCn3 ‐ subgroup by replacement.
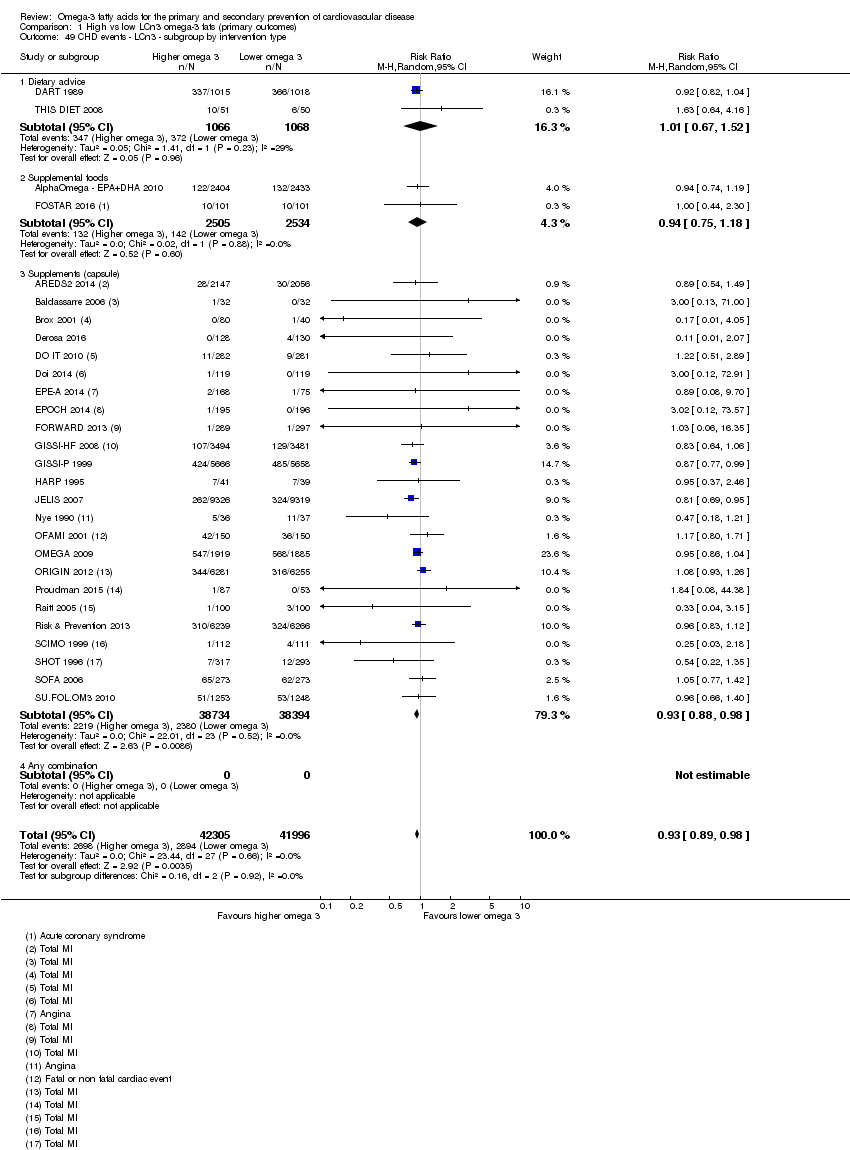
Comparison 1 High vs low LCn3 omega‐3 fats (primary outcomes), Outcome 49 CHD events ‐ LCn3 ‐ subgroup by intervention type.

Comparison 1 High vs low LCn3 omega‐3 fats (primary outcomes), Outcome 50 CHD events ‐ LCn3 ‐ subgroup by duration.

Comparison 1 High vs low LCn3 omega‐3 fats (primary outcomes), Outcome 51 CHD events ‐ LCn3 ‐ subgroup by primary or secondary prevention.

Comparison 1 High vs low LCn3 omega‐3 fats (primary outcomes), Outcome 52 CHD events ‐ LCn3 ‐ subgroup by statin use.

Comparison 1 High vs low LCn3 omega‐3 fats (primary outcomes), Outcome 53 CHD events ‐ LCn3 subgroup by CAD history.

Comparison 1 High vs low LCn3 omega‐3 fats (primary outcomes), Outcome 54 Stroke (overall) ‐ LCn3.
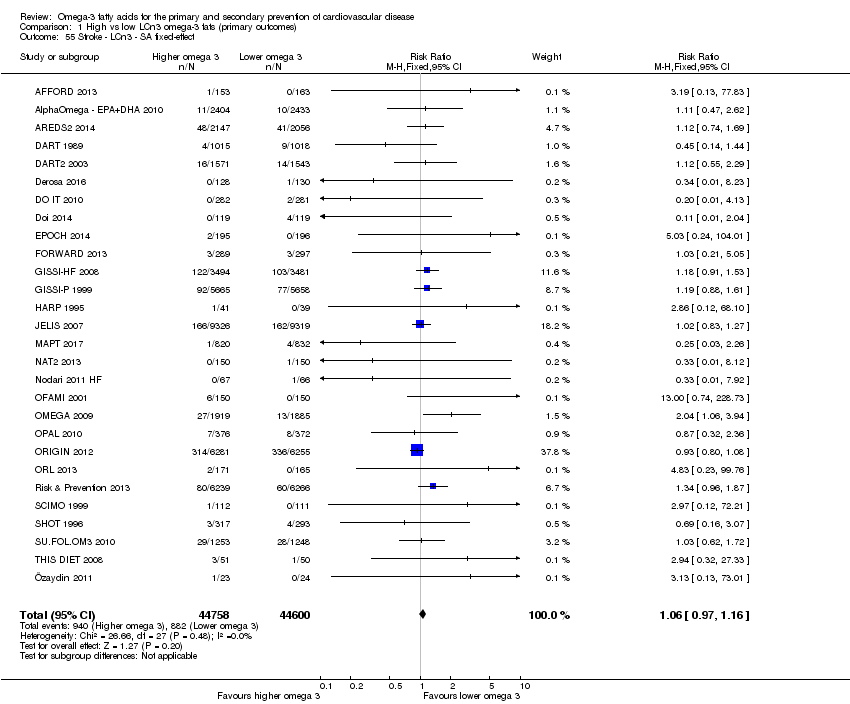
Comparison 1 High vs low LCn3 omega‐3 fats (primary outcomes), Outcome 55 Stroke ‐ LCn3 ‐ SA fixed‐effect.

Comparison 1 High vs low LCn3 omega‐3 fats (primary outcomes), Outcome 56 Stroke ‐ LCn3 ‐ SA by summary risk of bias.

Comparison 1 High vs low LCn3 omega‐3 fats (primary outcomes), Outcome 57 Stroke ‐ LCn3 ‐ SA by compliance and study size.

Comparison 1 High vs low LCn3 omega‐3 fats (primary outcomes), Outcome 58 Stroke ‐ LCn3 ‐ subgroup by stroke type.

Comparison 1 High vs low LCn3 omega‐3 fats (primary outcomes), Outcome 59 Stroke ‐ LCn3 ‐ subgroup by dose.

Comparison 1 High vs low LCn3 omega‐3 fats (primary outcomes), Outcome 60 Stroke ‐ LCn3 ‐ subgroup by replacement.

Comparison 1 High vs low LCn3 omega‐3 fats (primary outcomes), Outcome 61 Stroke ‐ LCn3 ‐ subgroup by intervention type.
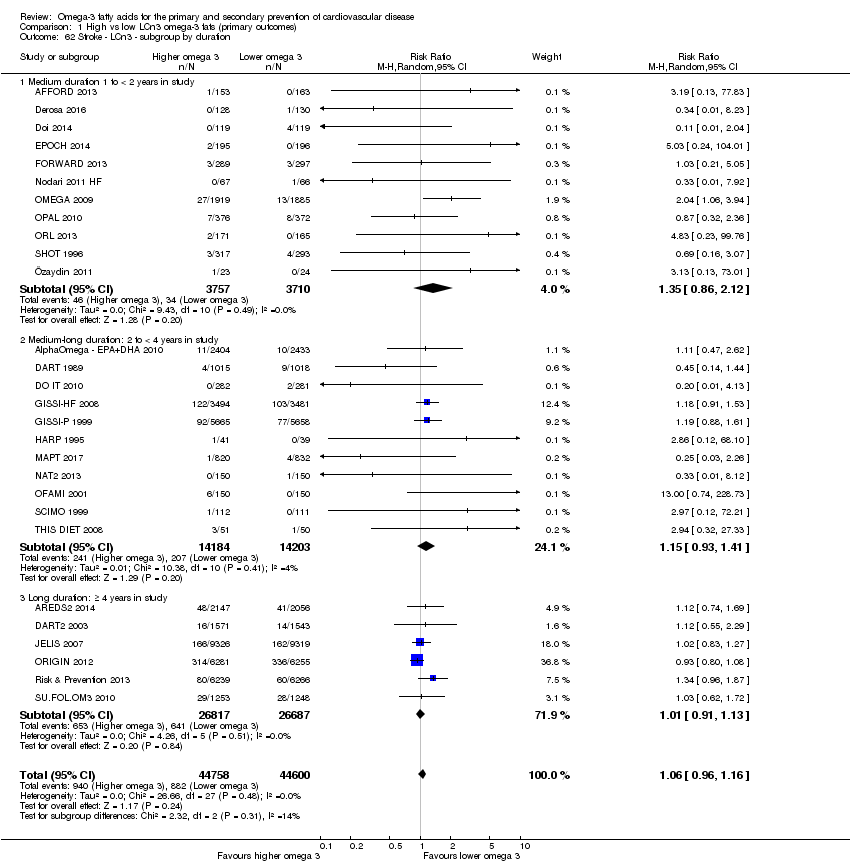
Comparison 1 High vs low LCn3 omega‐3 fats (primary outcomes), Outcome 62 Stroke ‐ LCn3 ‐ subgroup by duration.

Comparison 1 High vs low LCn3 omega‐3 fats (primary outcomes), Outcome 63 Stroke ‐ LCn3 ‐ subgroup by primary or secondary prevention.
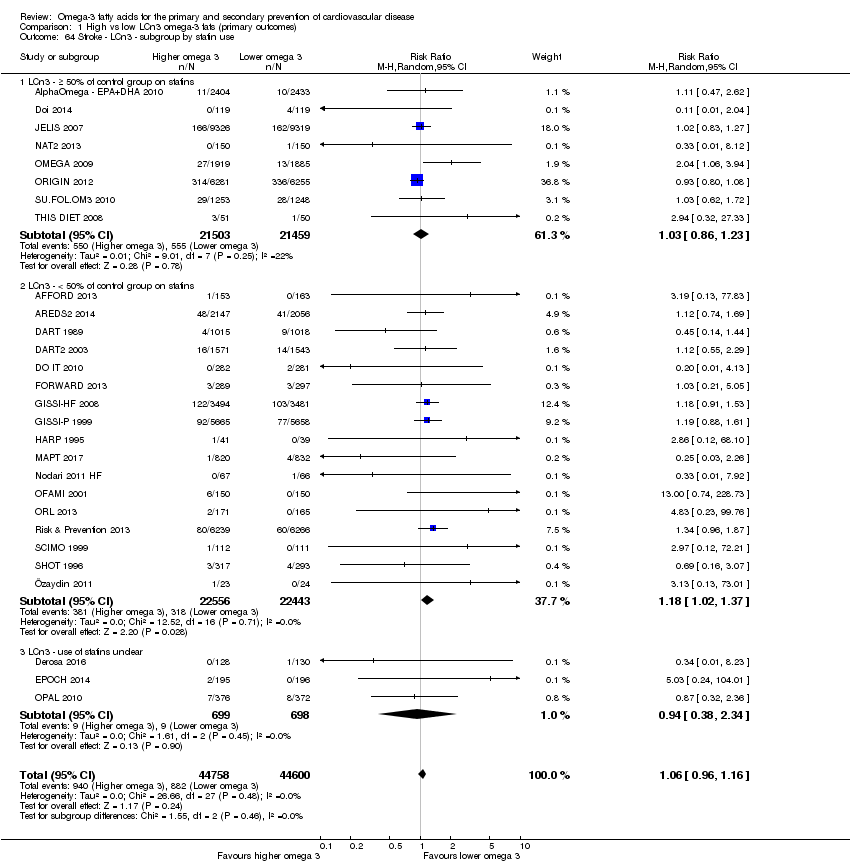
Comparison 1 High vs low LCn3 omega‐3 fats (primary outcomes), Outcome 64 Stroke ‐ LCn3 ‐ subgroup by statin use.

Comparison 1 High vs low LCn3 omega‐3 fats (primary outcomes), Outcome 65 Arrythmia (overall) ‐ LCn3.
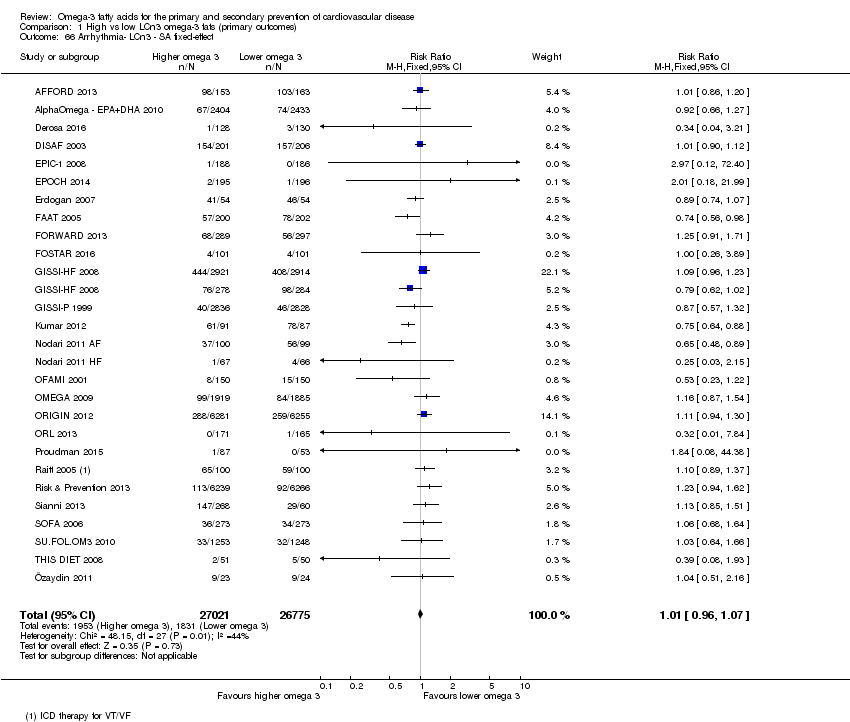
Comparison 1 High vs low LCn3 omega‐3 fats (primary outcomes), Outcome 66 Arrhythmia‐ LCn3 ‐ SA fixed‐effect.
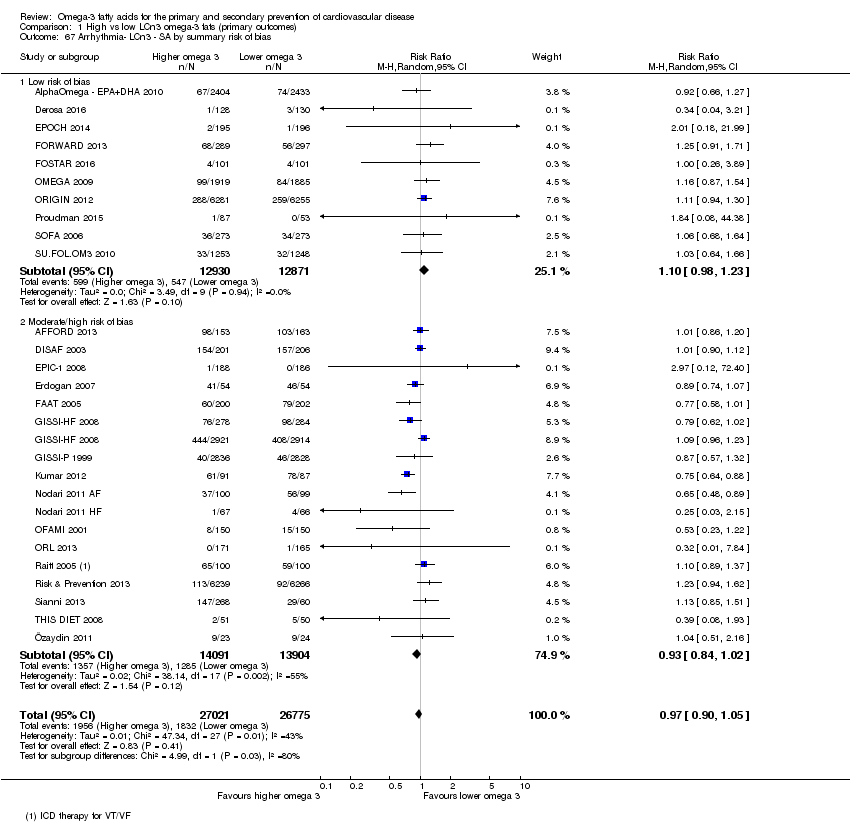
Comparison 1 High vs low LCn3 omega‐3 fats (primary outcomes), Outcome 67 Arrhythmia‐ LCn3 ‐ SA by summary risk of bias.

Comparison 1 High vs low LCn3 omega‐3 fats (primary outcomes), Outcome 68 Arrhythmia‐ LCn3 ‐ SA by compliance and study size.
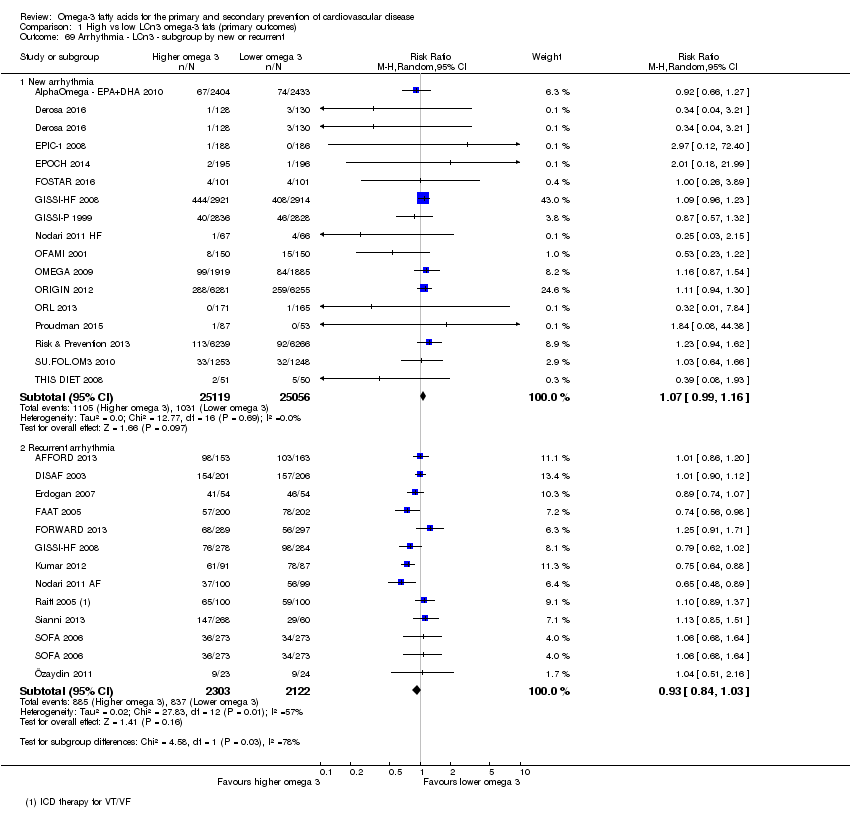
Comparison 1 High vs low LCn3 omega‐3 fats (primary outcomes), Outcome 69 Arrhythmia ‐ LCn3 ‐ subgroup by new or recurrent.

Comparison 1 High vs low LCn3 omega‐3 fats (primary outcomes), Outcome 70 Arrhythmia ‐ LCn3 ‐ subgroup by fatality.

Comparison 1 High vs low LCn3 omega‐3 fats (primary outcomes), Outcome 71 Arrhythmia ‐ LCn3 ‐ subgroup by dose.

Comparison 1 High vs low LCn3 omega‐3 fats (primary outcomes), Outcome 72 Arrhythmia ‐ LCn3 ‐ subgroup by replacement.
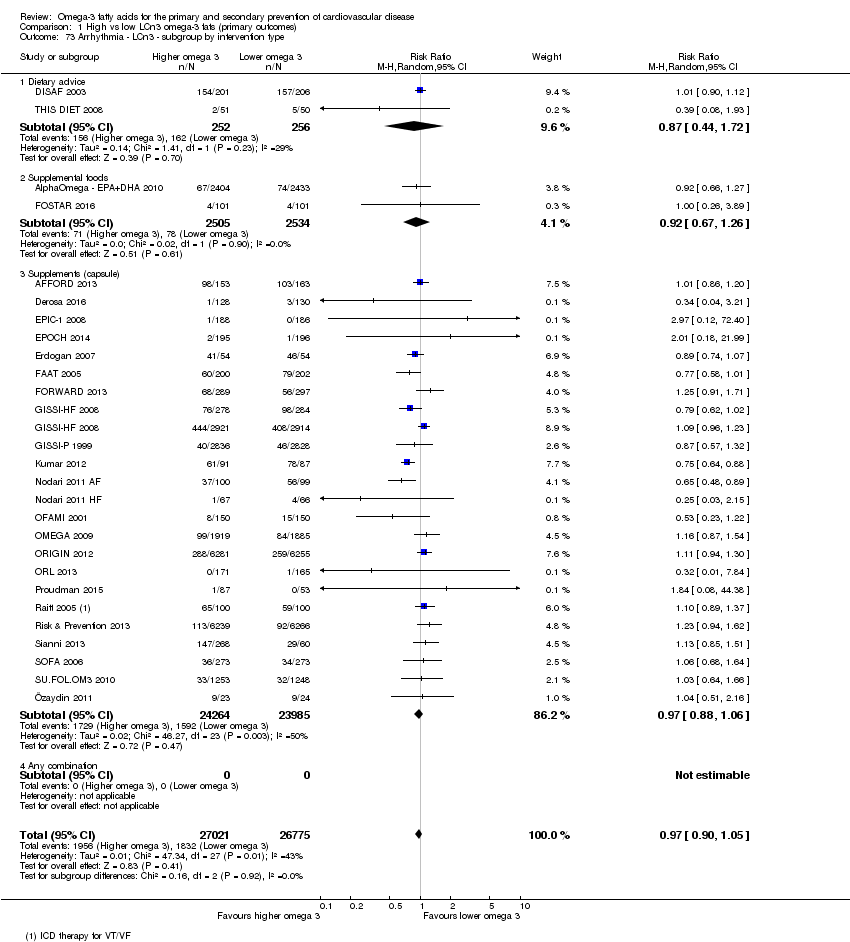
Comparison 1 High vs low LCn3 omega‐3 fats (primary outcomes), Outcome 73 Arrhythmia ‐ LCn3 ‐ subgroup by intervention type.

Comparison 1 High vs low LCn3 omega‐3 fats (primary outcomes), Outcome 74 Arrhythmia ‐ LCn3 ‐ subgroup by duration.

Comparison 1 High vs low LCn3 omega‐3 fats (primary outcomes), Outcome 75 Arrhythmia ‐ LCn3 ‐ subgroup by primary or secondary prevention3.

Comparison 1 High vs low LCn3 omega‐3 fats (primary outcomes), Outcome 76 Arrhythmia ‐ LCn3 ‐ subgroup by statin use.

Comparison 2 High vs low LCn3 omega‐3 fats (secondary outcomes), Outcome 1 MACCEs ‐ LCn3.
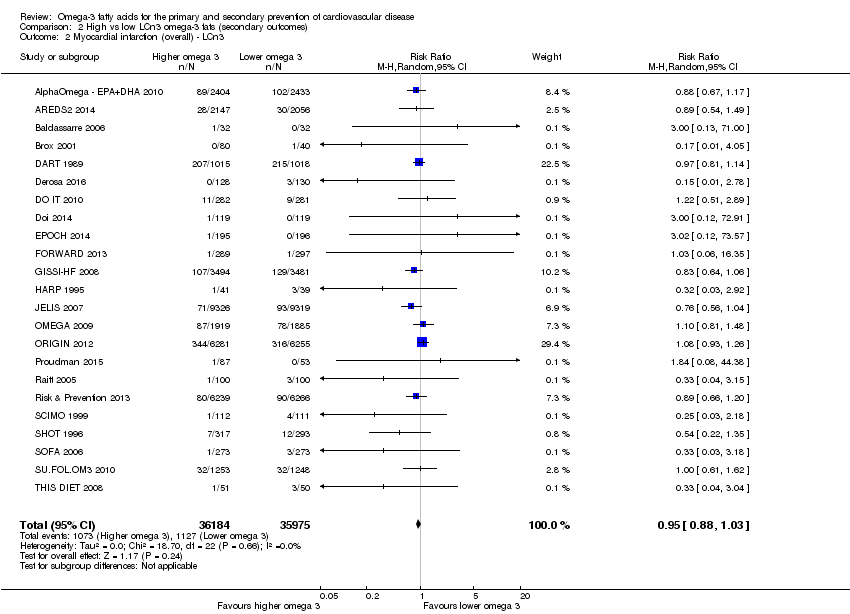
Comparison 2 High vs low LCn3 omega‐3 fats (secondary outcomes), Outcome 2 Myocardial infarction (overall) ‐ LCn3.
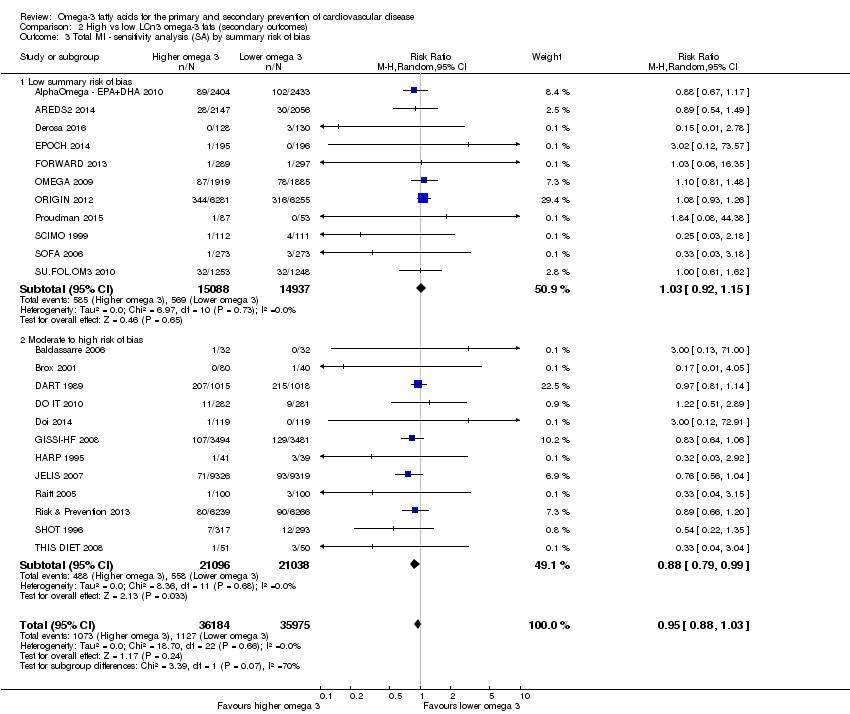
Comparison 2 High vs low LCn3 omega‐3 fats (secondary outcomes), Outcome 3 Total MI ‐ sensitivity analysis (SA) by summary risk of bias.

Comparison 2 High vs low LCn3 omega‐3 fats (secondary outcomes), Outcome 4 Total MI ‐ LCn3 ‐ SA by compliance and study size.
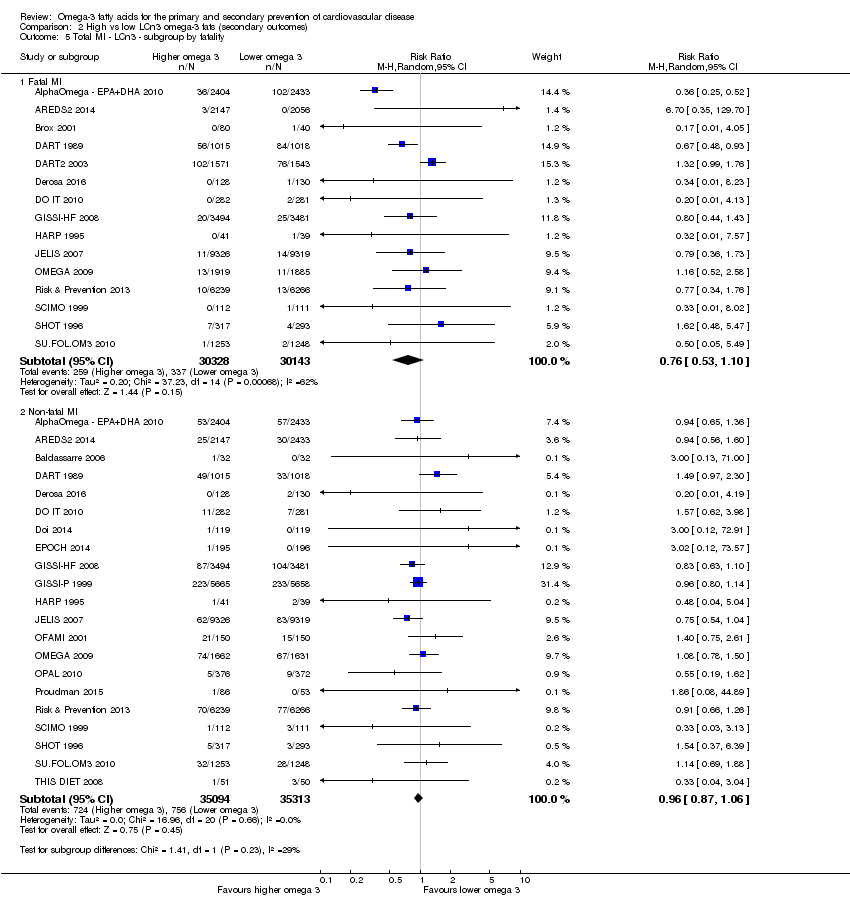
Comparison 2 High vs low LCn3 omega‐3 fats (secondary outcomes), Outcome 5 Total MI ‐ LCn3 ‐ subgroup by fatality.
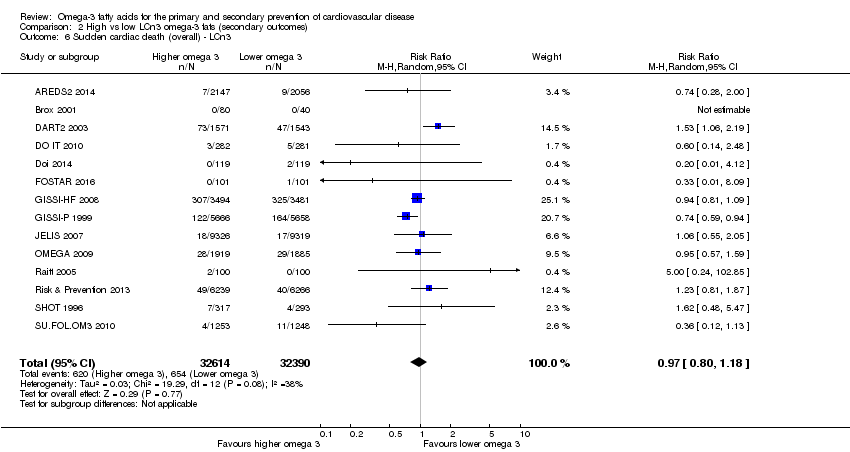
Comparison 2 High vs low LCn3 omega‐3 fats (secondary outcomes), Outcome 6 Sudden cardiac death (overall) ‐ LCn3.

Comparison 2 High vs low LCn3 omega‐3 fats (secondary outcomes), Outcome 7 Angina ‐ LCn3.

Comparison 2 High vs low LCn3 omega‐3 fats (secondary outcomes), Outcome 8 Heart failure ‐ LCn3.
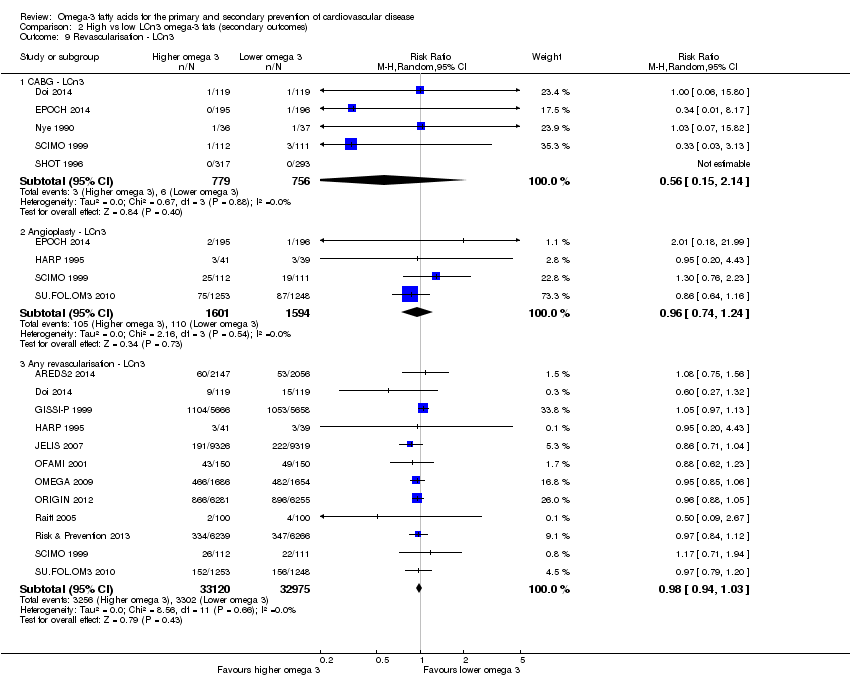
Comparison 2 High vs low LCn3 omega‐3 fats (secondary outcomes), Outcome 9 Revascularisation ‐ LCn3.

Comparison 2 High vs low LCn3 omega‐3 fats (secondary outcomes), Outcome 10 Peripheral arterial disease ‐ LCn3.
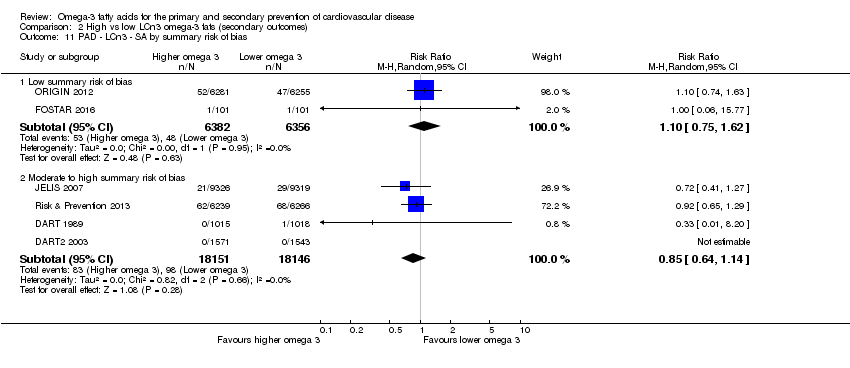
Comparison 2 High vs low LCn3 omega‐3 fats (secondary outcomes), Outcome 11 PAD ‐ LCn3 ‐ SA by summary risk of bias.
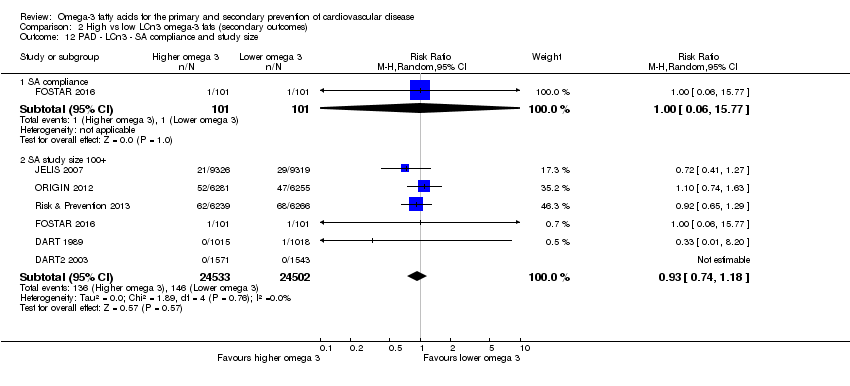
Comparison 2 High vs low LCn3 omega‐3 fats (secondary outcomes), Outcome 12 PAD ‐ LCn3 ‐ SA compliance and study size.
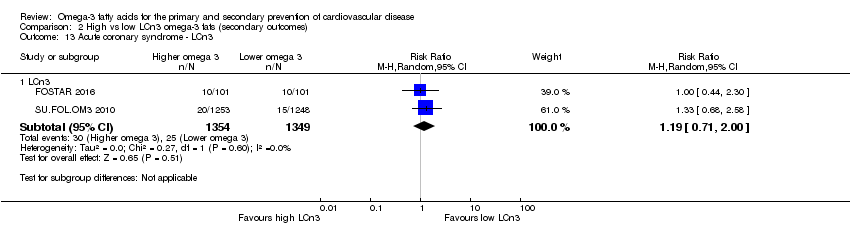
Comparison 2 High vs low LCn3 omega‐3 fats (secondary outcomes), Outcome 13 Acute coronary syndrome ‐ LCn3.
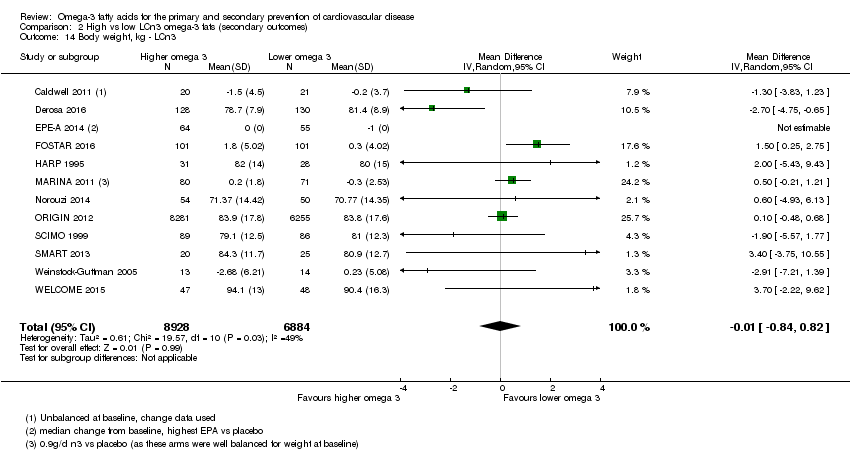
Comparison 2 High vs low LCn3 omega‐3 fats (secondary outcomes), Outcome 14 Body weight, kg ‐ LCn3.
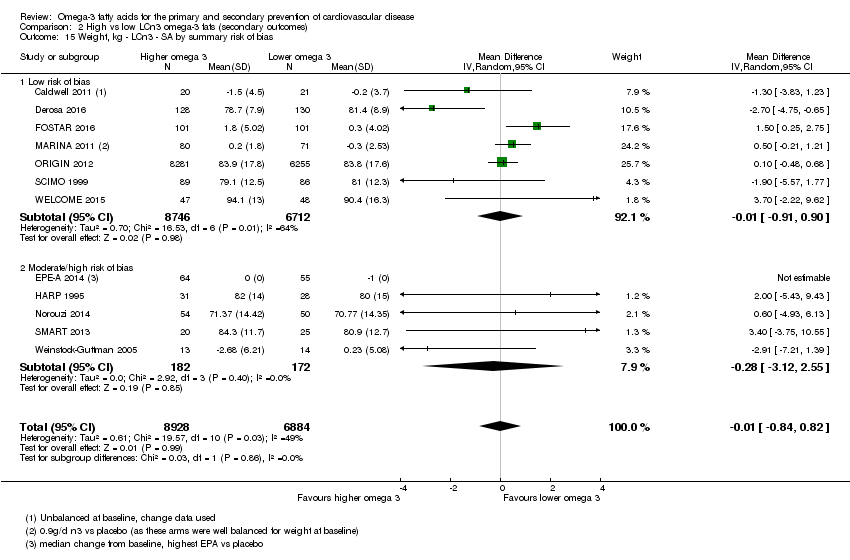
Comparison 2 High vs low LCn3 omega‐3 fats (secondary outcomes), Outcome 15 Weight, kg ‐ LCn3 ‐ SA by summary risk of bias.
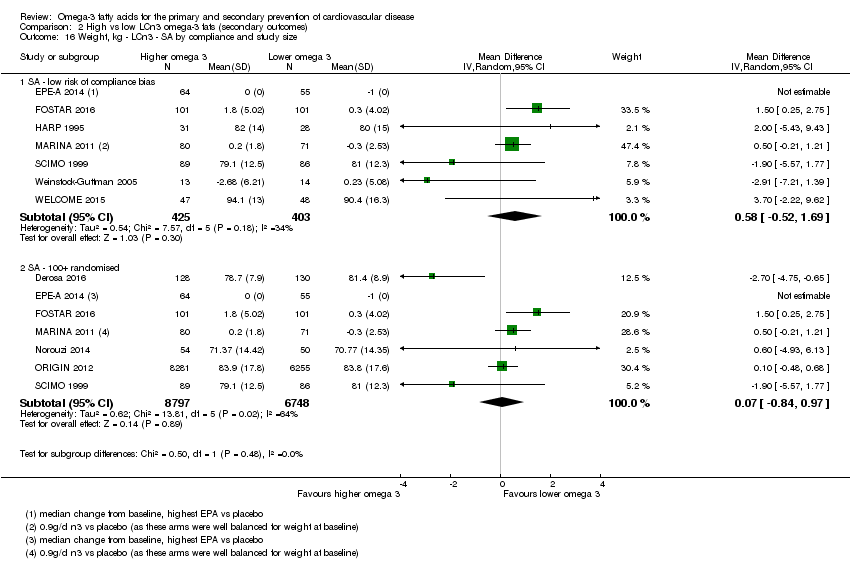
Comparison 2 High vs low LCn3 omega‐3 fats (secondary outcomes), Outcome 16 Weight, kg ‐ LCn3 ‐ SA by compliance and study size.
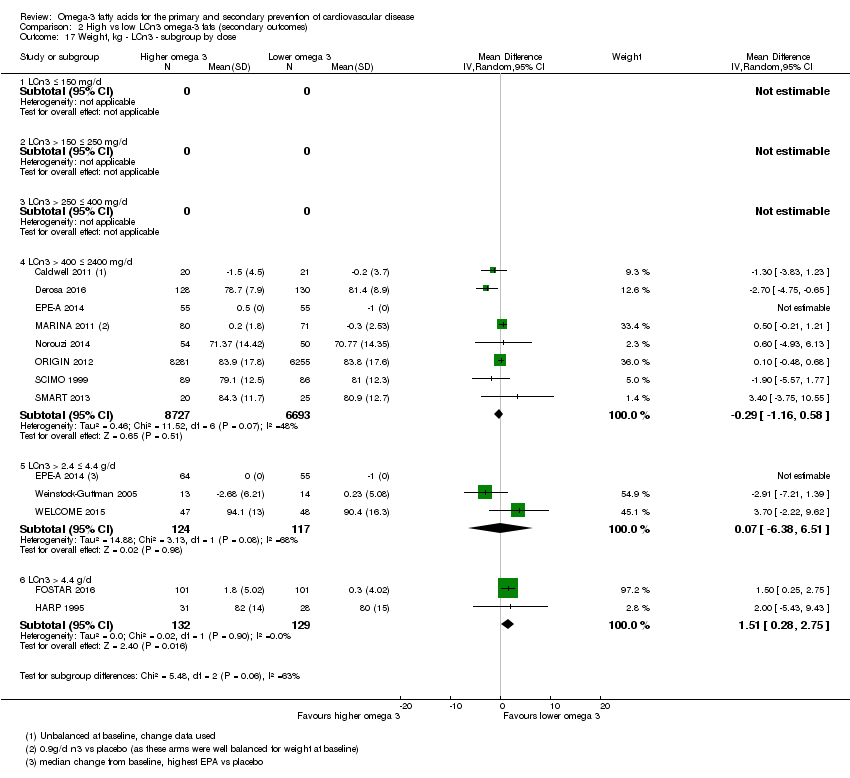
Comparison 2 High vs low LCn3 omega‐3 fats (secondary outcomes), Outcome 17 Weight, kg ‐ LCn3 ‐ subgroup by dose.

Comparison 2 High vs low LCn3 omega‐3 fats (secondary outcomes), Outcome 18 Weight, kg ‐ LCn3 ‐ subgroup by replacement.

Comparison 2 High vs low LCn3 omega‐3 fats (secondary outcomes), Outcome 19 Weight, kg ‐ LCn3 ‐ subgroup by intervention type.

Comparison 2 High vs low LCn3 omega‐3 fats (secondary outcomes), Outcome 20 Weight, kg ‐ LCn3 ‐ subgroup by duration.

Comparison 2 High vs low LCn3 omega‐3 fats (secondary outcomes), Outcome 21 Weight, kg ‐ LCn3 ‐ subgroup by primary or secondary prevention.

Comparison 2 High vs low LCn3 omega‐3 fats (secondary outcomes), Outcome 22 Weight, kg ‐ LCn3 ‐ subgroup by statin use.
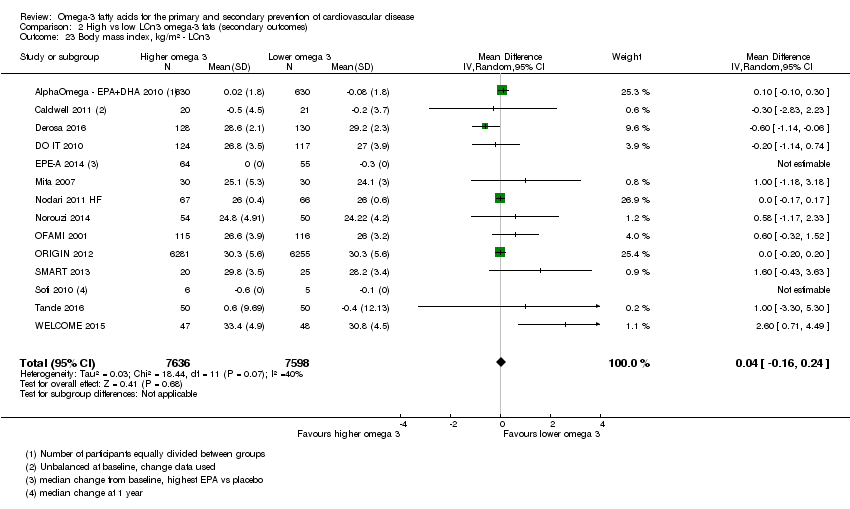
Comparison 2 High vs low LCn3 omega‐3 fats (secondary outcomes), Outcome 23 Body mass index, kg/m² ‐ LCn3.

Comparison 2 High vs low LCn3 omega‐3 fats (secondary outcomes), Outcome 24 BMI, kg/m²‐ LCn3 ‐ SA by summary risk of bias.

Comparison 2 High vs low LCn3 omega‐3 fats (secondary outcomes), Outcome 25 BMI, kg/m²‐ LCn3 ‐ SA by compliance and study size.

Comparison 2 High vs low LCn3 omega‐3 fats (secondary outcomes), Outcome 26 BMI, kg/m² ‐ LCn3 ‐ subgroup by dose.
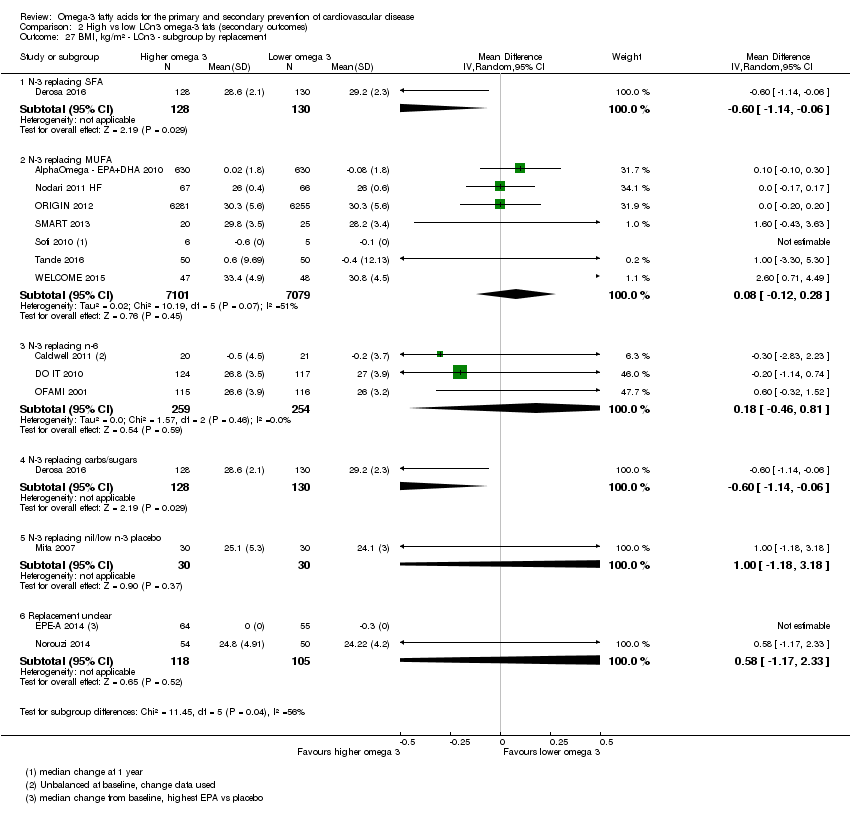
Comparison 2 High vs low LCn3 omega‐3 fats (secondary outcomes), Outcome 27 BMI, kg/m² ‐ LCn3 ‐ subgroup by replacement.
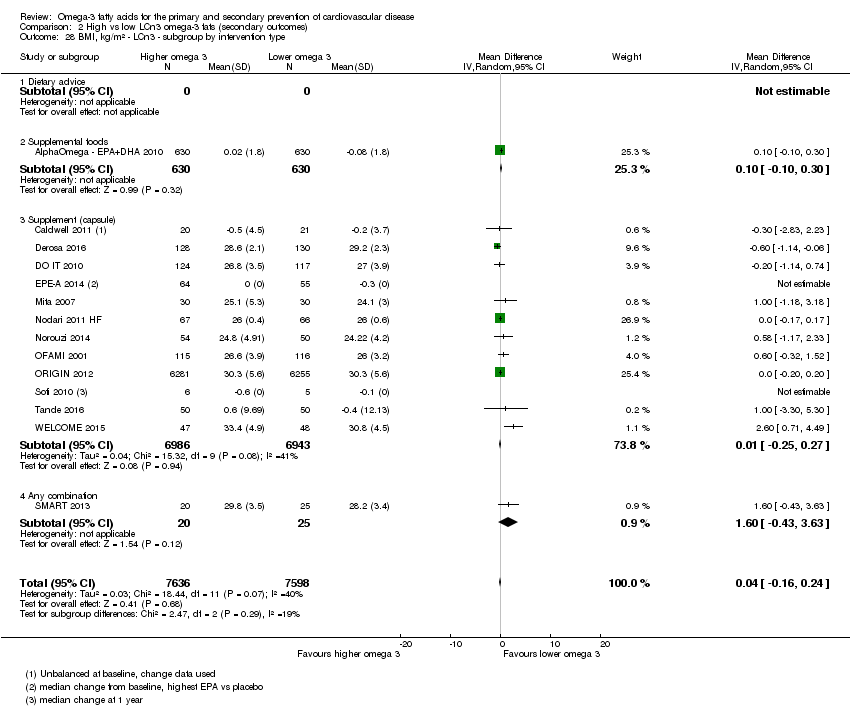
Comparison 2 High vs low LCn3 omega‐3 fats (secondary outcomes), Outcome 28 BMI, kg/m² ‐ LCn3 ‐ subgroup by intervention type.

Comparison 2 High vs low LCn3 omega‐3 fats (secondary outcomes), Outcome 29 BMI, kg/m² ‐ LCn3 ‐ subgroup by duration.
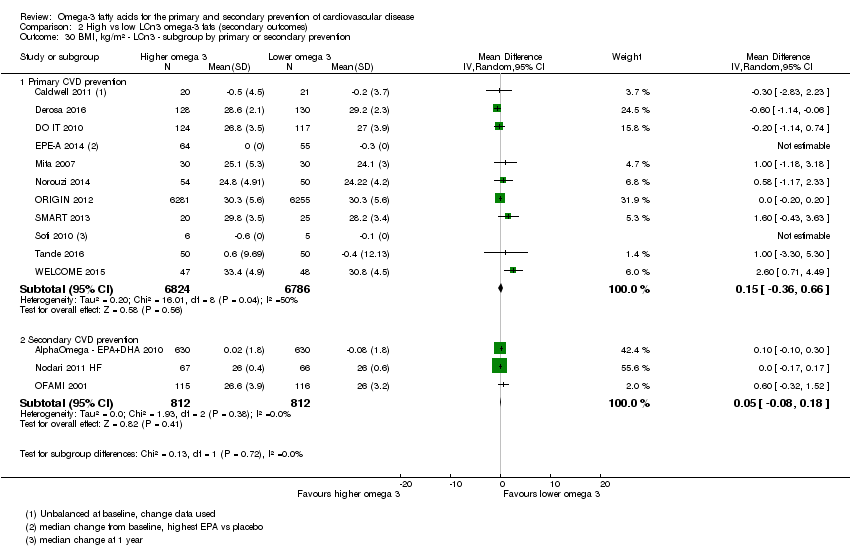
Comparison 2 High vs low LCn3 omega‐3 fats (secondary outcomes), Outcome 30 BMI, kg/m² ‐ LCn3 ‐ subgroup by primary or secondary prevention.

Comparison 2 High vs low LCn3 omega‐3 fats (secondary outcomes), Outcome 31 BMI, kg/m² ‐ LCn3 ‐ subgroup by statin use.

Comparison 2 High vs low LCn3 omega‐3 fats (secondary outcomes), Outcome 32 Other measures of adiposity ‐ LCn3.

Comparison 2 High vs low LCn3 omega‐3 fats (secondary outcomes), Outcome 33 Total cholesterol, serum, mmoL/L ‐ LCn3.

Comparison 2 High vs low LCn3 omega‐3 fats (secondary outcomes), Outcome 34 TC, mmoL/L ‐ LCn3 ‐ SA by summary risk of bias.

Comparison 2 High vs low LCn3 omega‐3 fats (secondary outcomes), Outcome 35 TC, mmoL/L ‐ LCn3 ‐ SA by compliance and study size.

Comparison 2 High vs low LCn3 omega‐3 fats (secondary outcomes), Outcome 36 TC, mmoL/L ‐ LCn3 ‐ subgroup by dose.

Comparison 2 High vs low LCn3 omega‐3 fats (secondary outcomes), Outcome 37 TC, mmoL/L ‐ LCn3 ‐ subgroup by replacement.
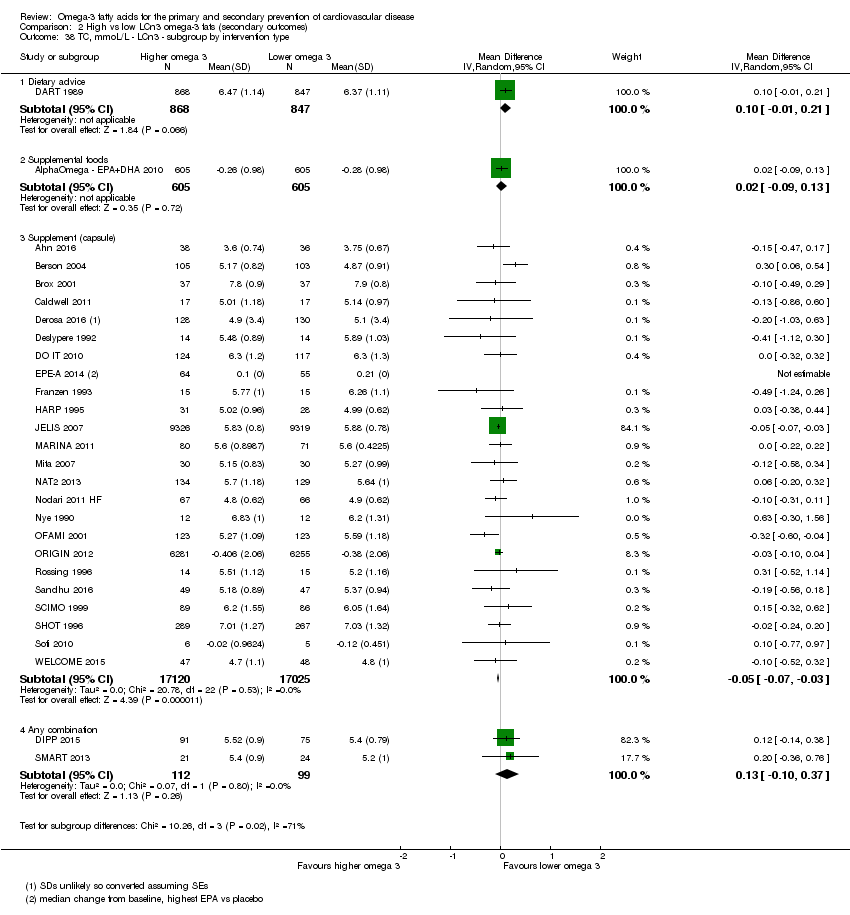
Comparison 2 High vs low LCn3 omega‐3 fats (secondary outcomes), Outcome 38 TC, mmoL/L ‐ LCn3 ‐ subgroup by intervention type.
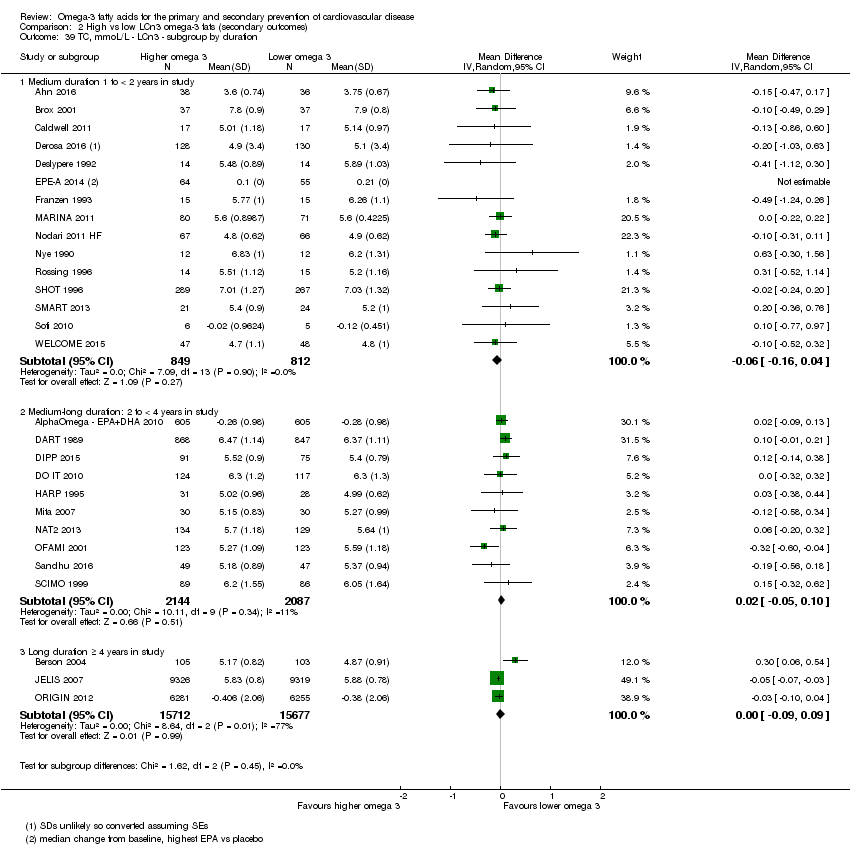
Comparison 2 High vs low LCn3 omega‐3 fats (secondary outcomes), Outcome 39 TC, mmoL/L ‐ LCn3 ‐ subgroup by duration.

Comparison 2 High vs low LCn3 omega‐3 fats (secondary outcomes), Outcome 40 TC, mmoL/L ‐ LCn3 ‐ subgroup by primary or secondary prevention.

Comparison 2 High vs low LCn3 omega‐3 fats (secondary outcomes), Outcome 41 TC, mmoL/L ‐ LCn3 ‐ subgroup by statin use.
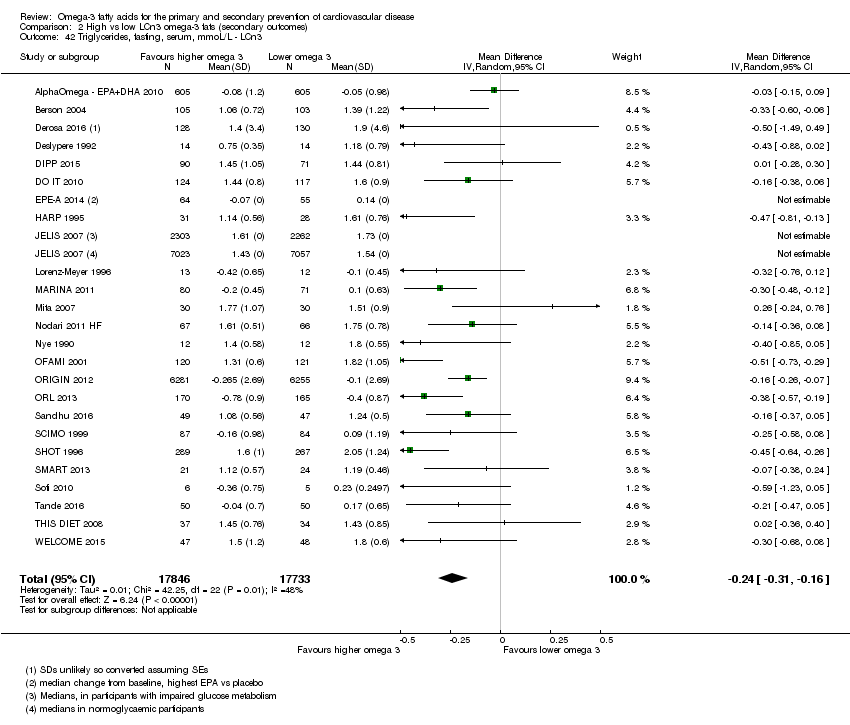
Comparison 2 High vs low LCn3 omega‐3 fats (secondary outcomes), Outcome 42 Triglycerides, fasting, serum, mmoL/L ‐ LCn3.

Comparison 2 High vs low LCn3 omega‐3 fats (secondary outcomes), Outcome 43 TG, fasting, mmoL/L ‐ LCn3 ‐ SA by summary risk of bias.

Comparison 2 High vs low LCn3 omega‐3 fats (secondary outcomes), Outcome 44 TG, fasting, mmoL/L ‐ LCn3 ‐ SA by compliance and study size.
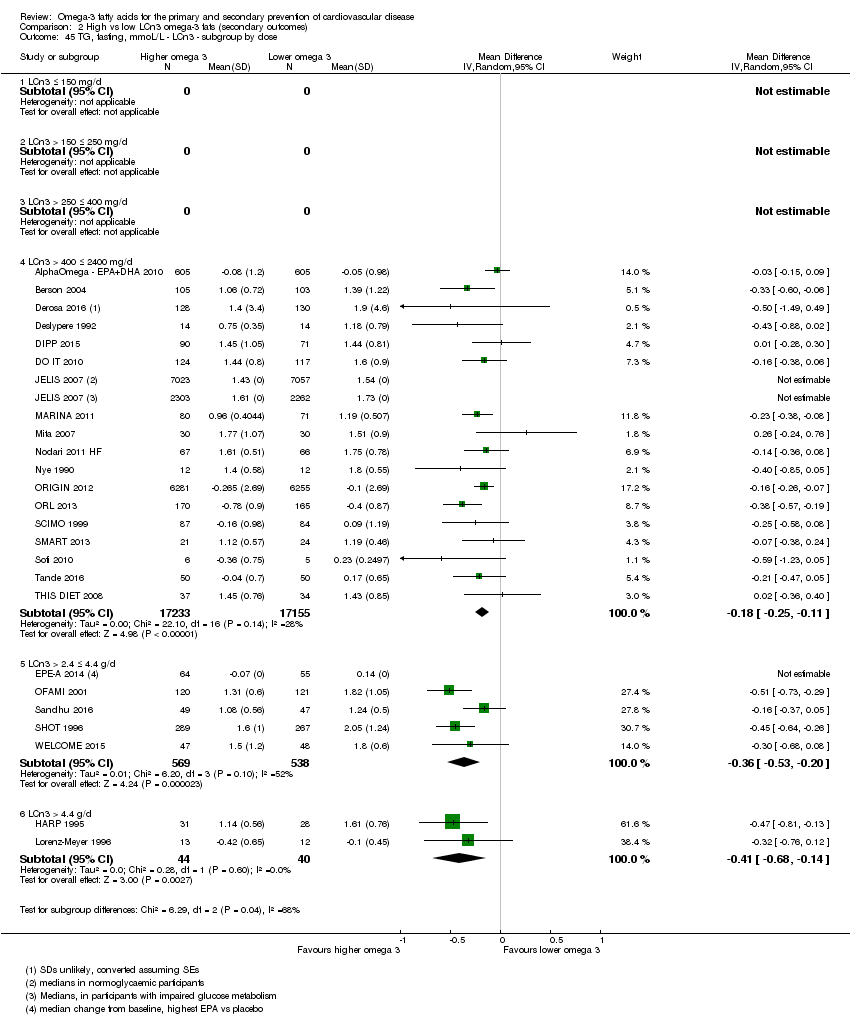
Comparison 2 High vs low LCn3 omega‐3 fats (secondary outcomes), Outcome 45 TG, fasting, mmoL/L ‐ LCn3 ‐ subgroup by dose.

Comparison 2 High vs low LCn3 omega‐3 fats (secondary outcomes), Outcome 46 TG, fasting, mmoL/L ‐ LCn3 ‐ subgroup by replacement.

Comparison 2 High vs low LCn3 omega‐3 fats (secondary outcomes), Outcome 47 TG, fasting, mmoL/L ‐ LCn3 ‐ subgroup by intervention type.

Comparison 2 High vs low LCn3 omega‐3 fats (secondary outcomes), Outcome 48 TG, fasting, mmoL/L ‐ LCn3 ‐ subgroup by duration.

Comparison 2 High vs low LCn3 omega‐3 fats (secondary outcomes), Outcome 49 TG, fasting, mmoL/L ‐ LCn3 ‐ subgroup by primary or secondary prevention.
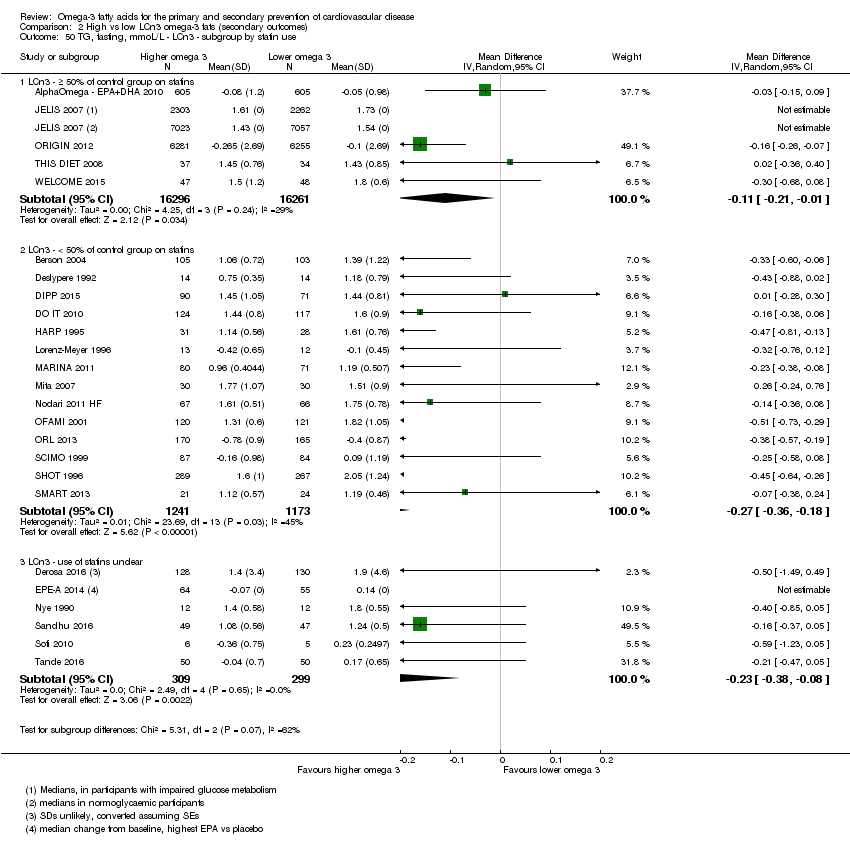
Comparison 2 High vs low LCn3 omega‐3 fats (secondary outcomes), Outcome 50 TG, fasting, mmoL/L ‐ LCn3 ‐ subgroup by statin use.

Comparison 2 High vs low LCn3 omega‐3 fats (secondary outcomes), Outcome 51 High‐density lipoprotein, serum, mmoL/L ‐ LCn3.

Comparison 2 High vs low LCn3 omega‐3 fats (secondary outcomes), Outcome 52 HDL, mmoL/L ‐ LCn3 ‐ SA by summary risk of bias.

Comparison 2 High vs low LCn3 omega‐3 fats (secondary outcomes), Outcome 53 HDL, mmoL/L ‐ LCn3 ‐ SA by compliance and study size.
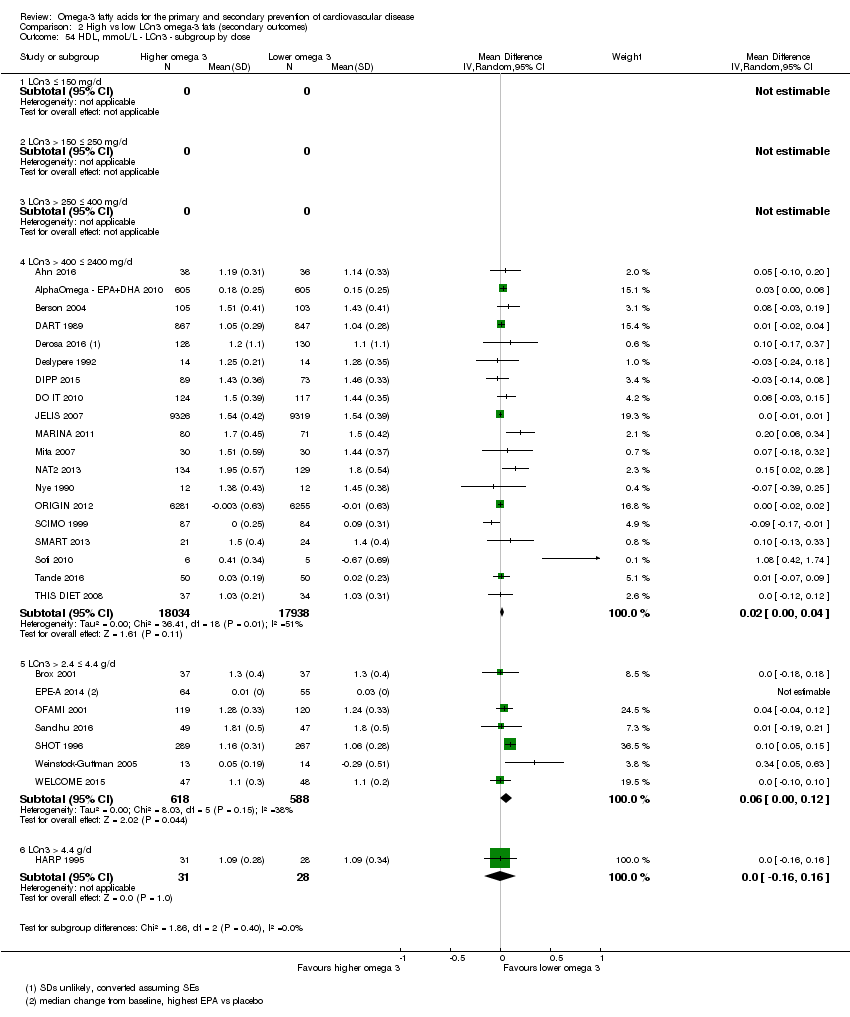
Comparison 2 High vs low LCn3 omega‐3 fats (secondary outcomes), Outcome 54 HDL, mmoL/L ‐ LCn3 ‐ subgroup by dose.

Comparison 2 High vs low LCn3 omega‐3 fats (secondary outcomes), Outcome 55 HDL, mmoL/L ‐ LCn3 ‐ subgroup by replacement.
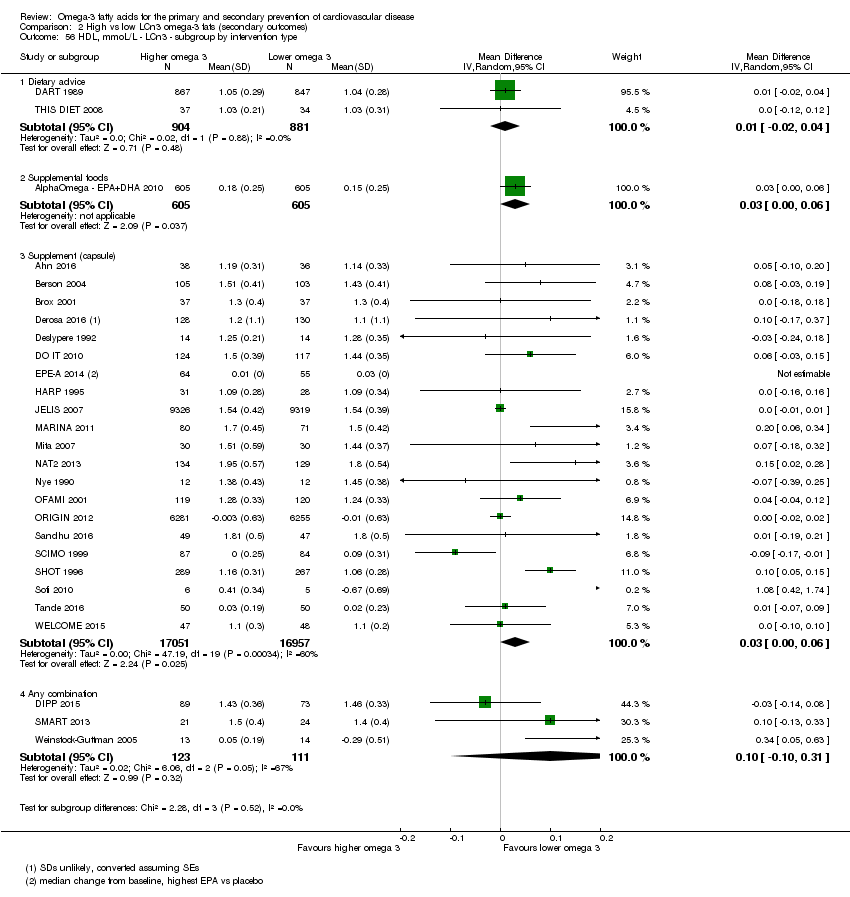
Comparison 2 High vs low LCn3 omega‐3 fats (secondary outcomes), Outcome 56 HDL, mmoL/L ‐ LCn3 ‐ subgroup by intervention type.

Comparison 2 High vs low LCn3 omega‐3 fats (secondary outcomes), Outcome 57 HDL, mmoL/L ‐ LCn3 ‐ subgroup by duration.
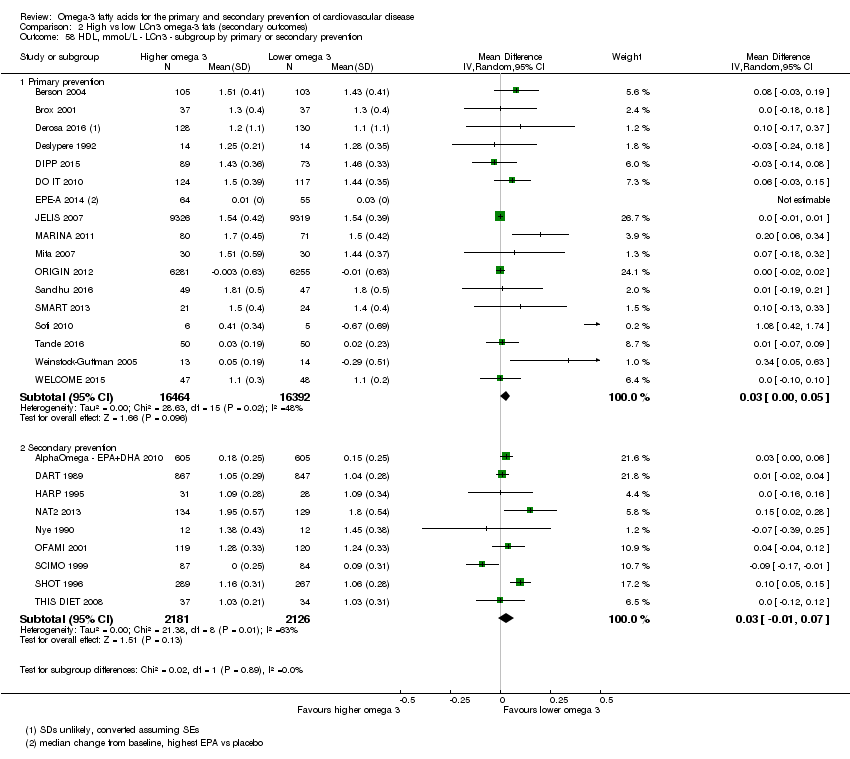
Comparison 2 High vs low LCn3 omega‐3 fats (secondary outcomes), Outcome 58 HDL, mmoL/L ‐ LCn3 ‐ subgroup by primary or secondary prevention.

Comparison 2 High vs low LCn3 omega‐3 fats (secondary outcomes), Outcome 59 HDL, mmoL/L ‐ LCn3 ‐ subgroup by statin use.
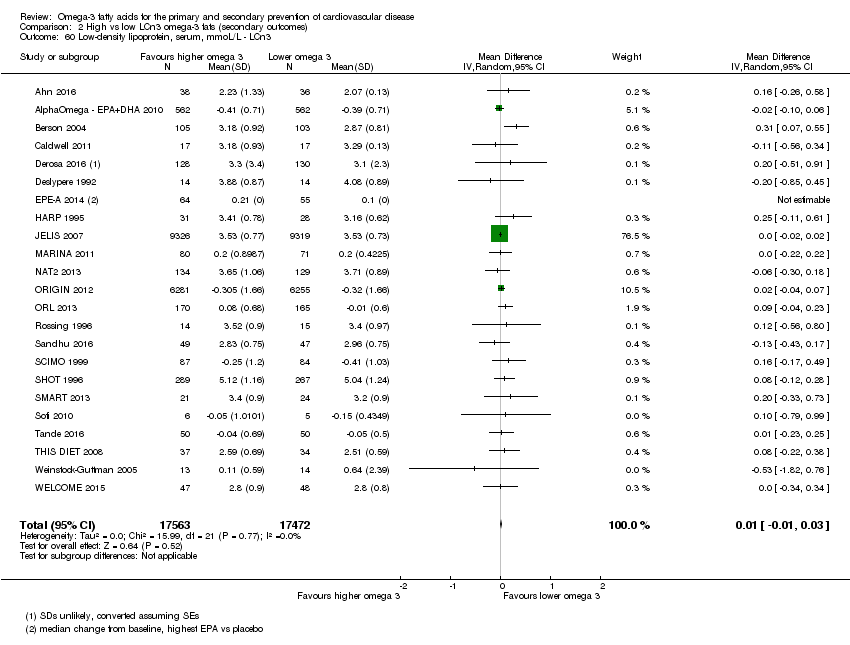
Comparison 2 High vs low LCn3 omega‐3 fats (secondary outcomes), Outcome 60 Low‐density lipoprotein, serum, mmoL/L ‐ LCn3.
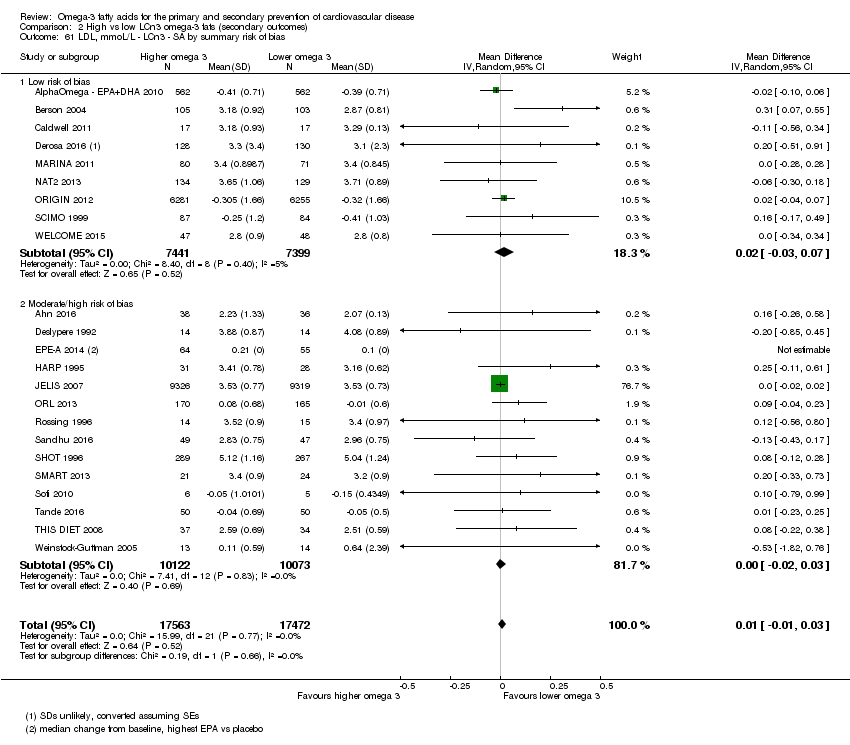
Comparison 2 High vs low LCn3 omega‐3 fats (secondary outcomes), Outcome 61 LDL, mmoL/L ‐ LCn3 ‐ SA by summary risk of bias.
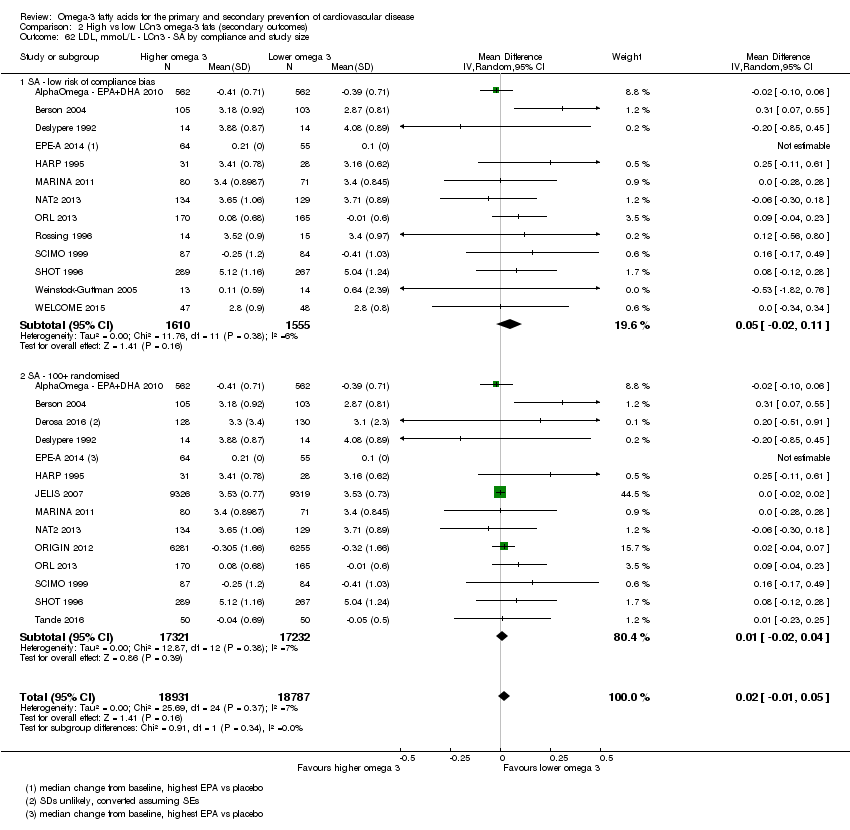
Comparison 2 High vs low LCn3 omega‐3 fats (secondary outcomes), Outcome 62 LDL, mmoL/L ‐ LCn3 ‐ SA by compliance and study size.
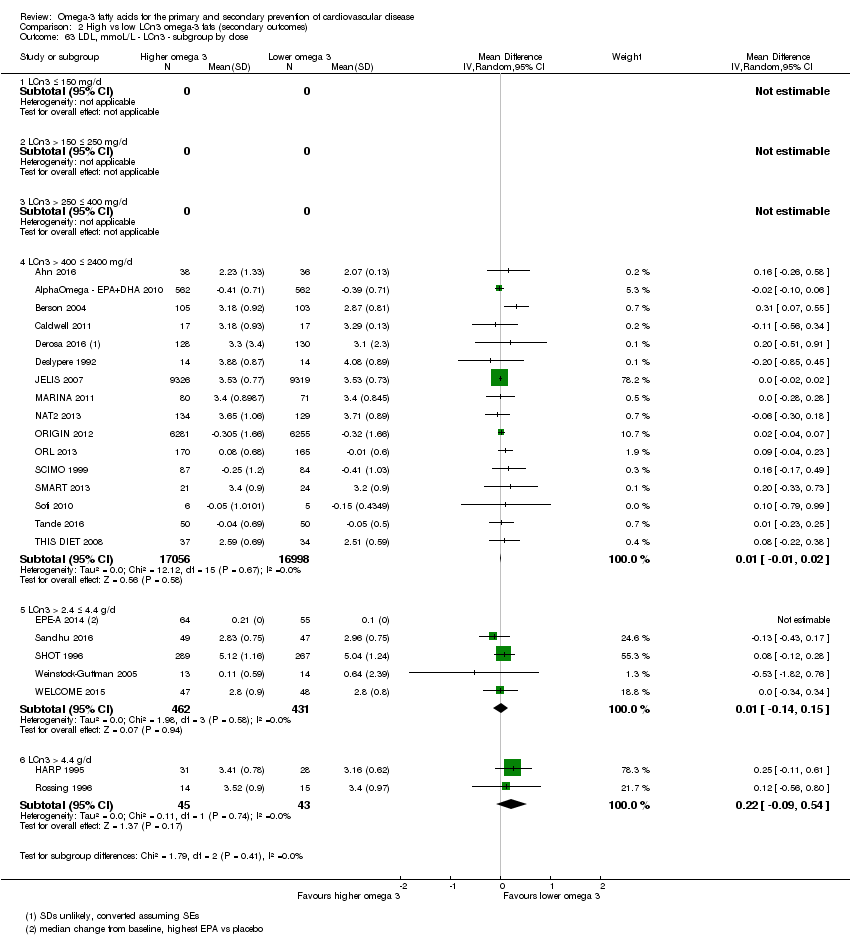
Comparison 2 High vs low LCn3 omega‐3 fats (secondary outcomes), Outcome 63 LDL, mmoL/L ‐ LCn3 ‐ subgroup by dose.
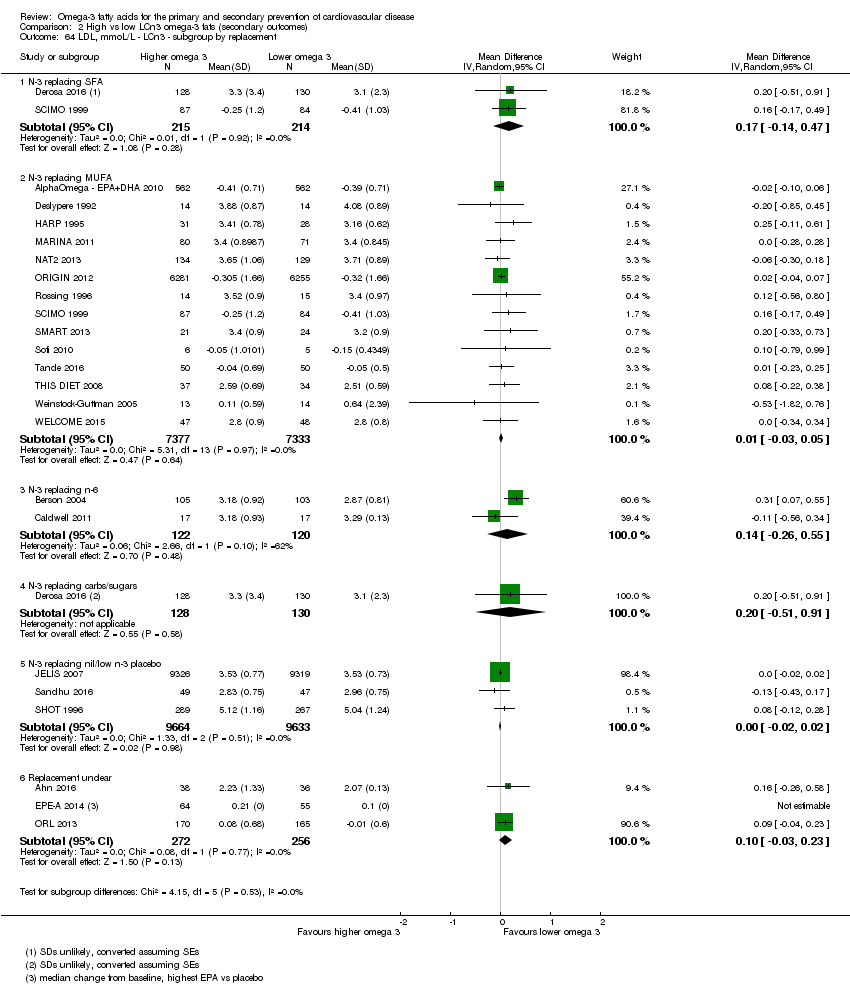
Comparison 2 High vs low LCn3 omega‐3 fats (secondary outcomes), Outcome 64 LDL, mmoL/L ‐ LCn3 ‐ subgroup by replacement.

Comparison 2 High vs low LCn3 omega‐3 fats (secondary outcomes), Outcome 65 LDL, mmoL/L ‐ LCn3 ‐ subgroup by intervention type.

Comparison 2 High vs low LCn3 omega‐3 fats (secondary outcomes), Outcome 66 LDL, mmoL/L ‐ LCn3 ‐ subgroup by duration.
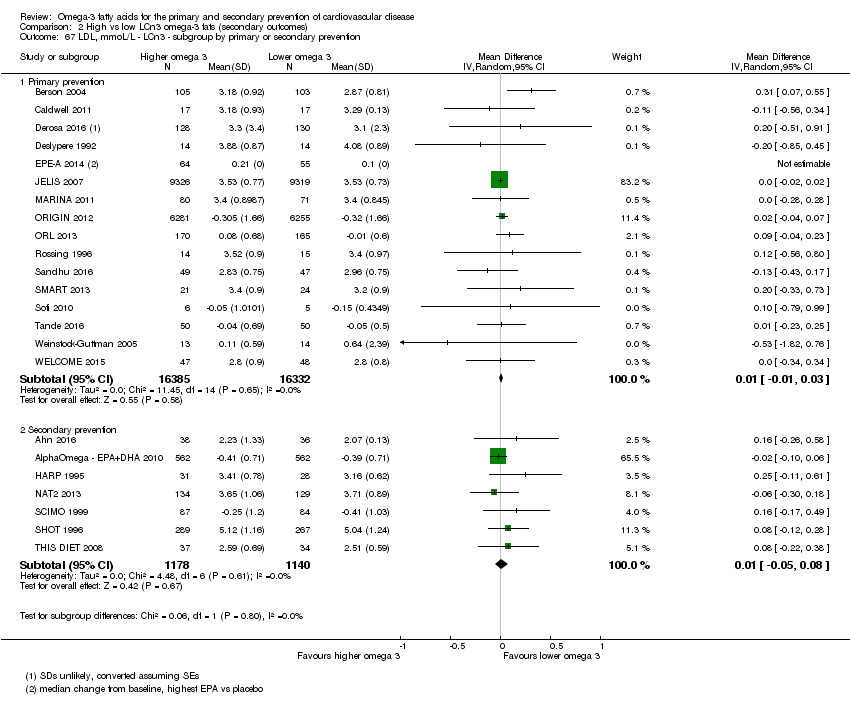
Comparison 2 High vs low LCn3 omega‐3 fats (secondary outcomes), Outcome 67 LDL, mmoL/L ‐ LCn3 ‐ subgroup by primary or secondary prevention.

Comparison 2 High vs low LCn3 omega‐3 fats (secondary outcomes), Outcome 68 LDL, mmoL/L ‐ LCn3 ‐ subgroup by statin use.
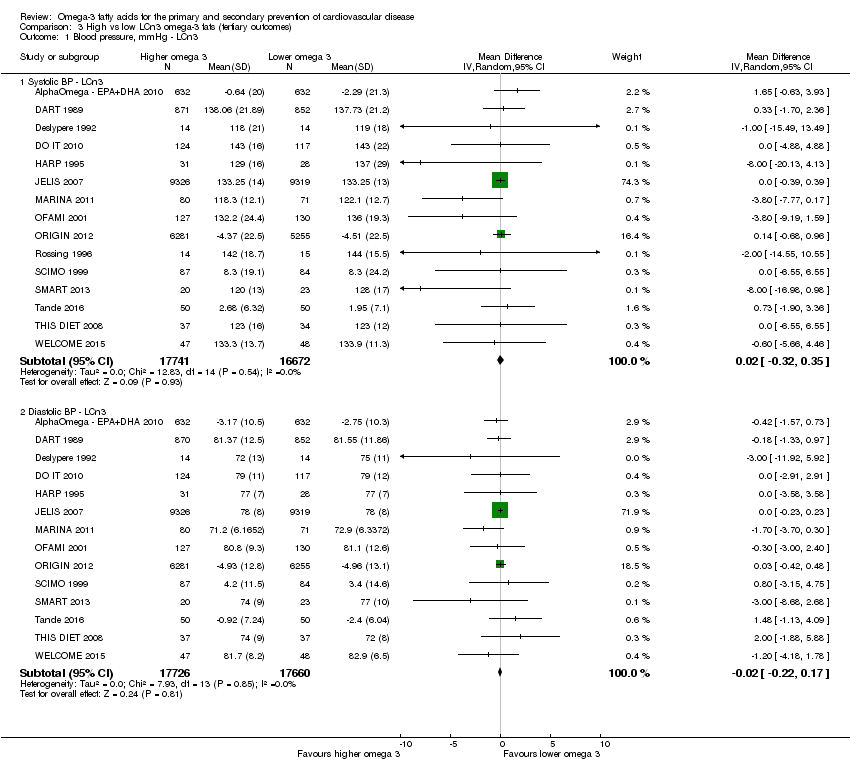
Comparison 3 High vs low LCn3 omega‐3 fats (tertiary outcomes), Outcome 1 Blood pressure, mmHg ‐ LCn3.
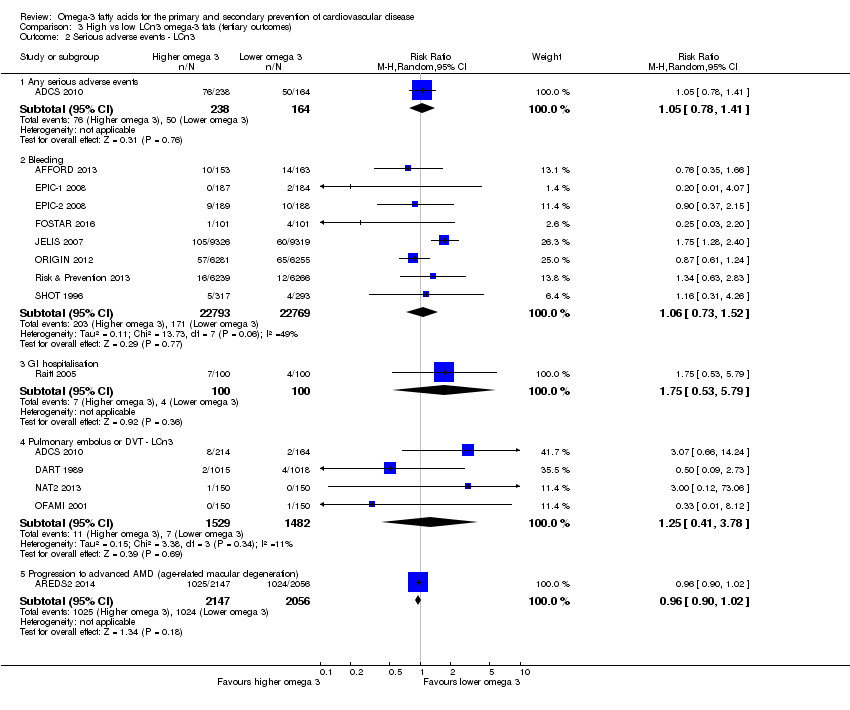
Comparison 3 High vs low LCn3 omega‐3 fats (tertiary outcomes), Outcome 2 Serious adverse events ‐ LCn3.
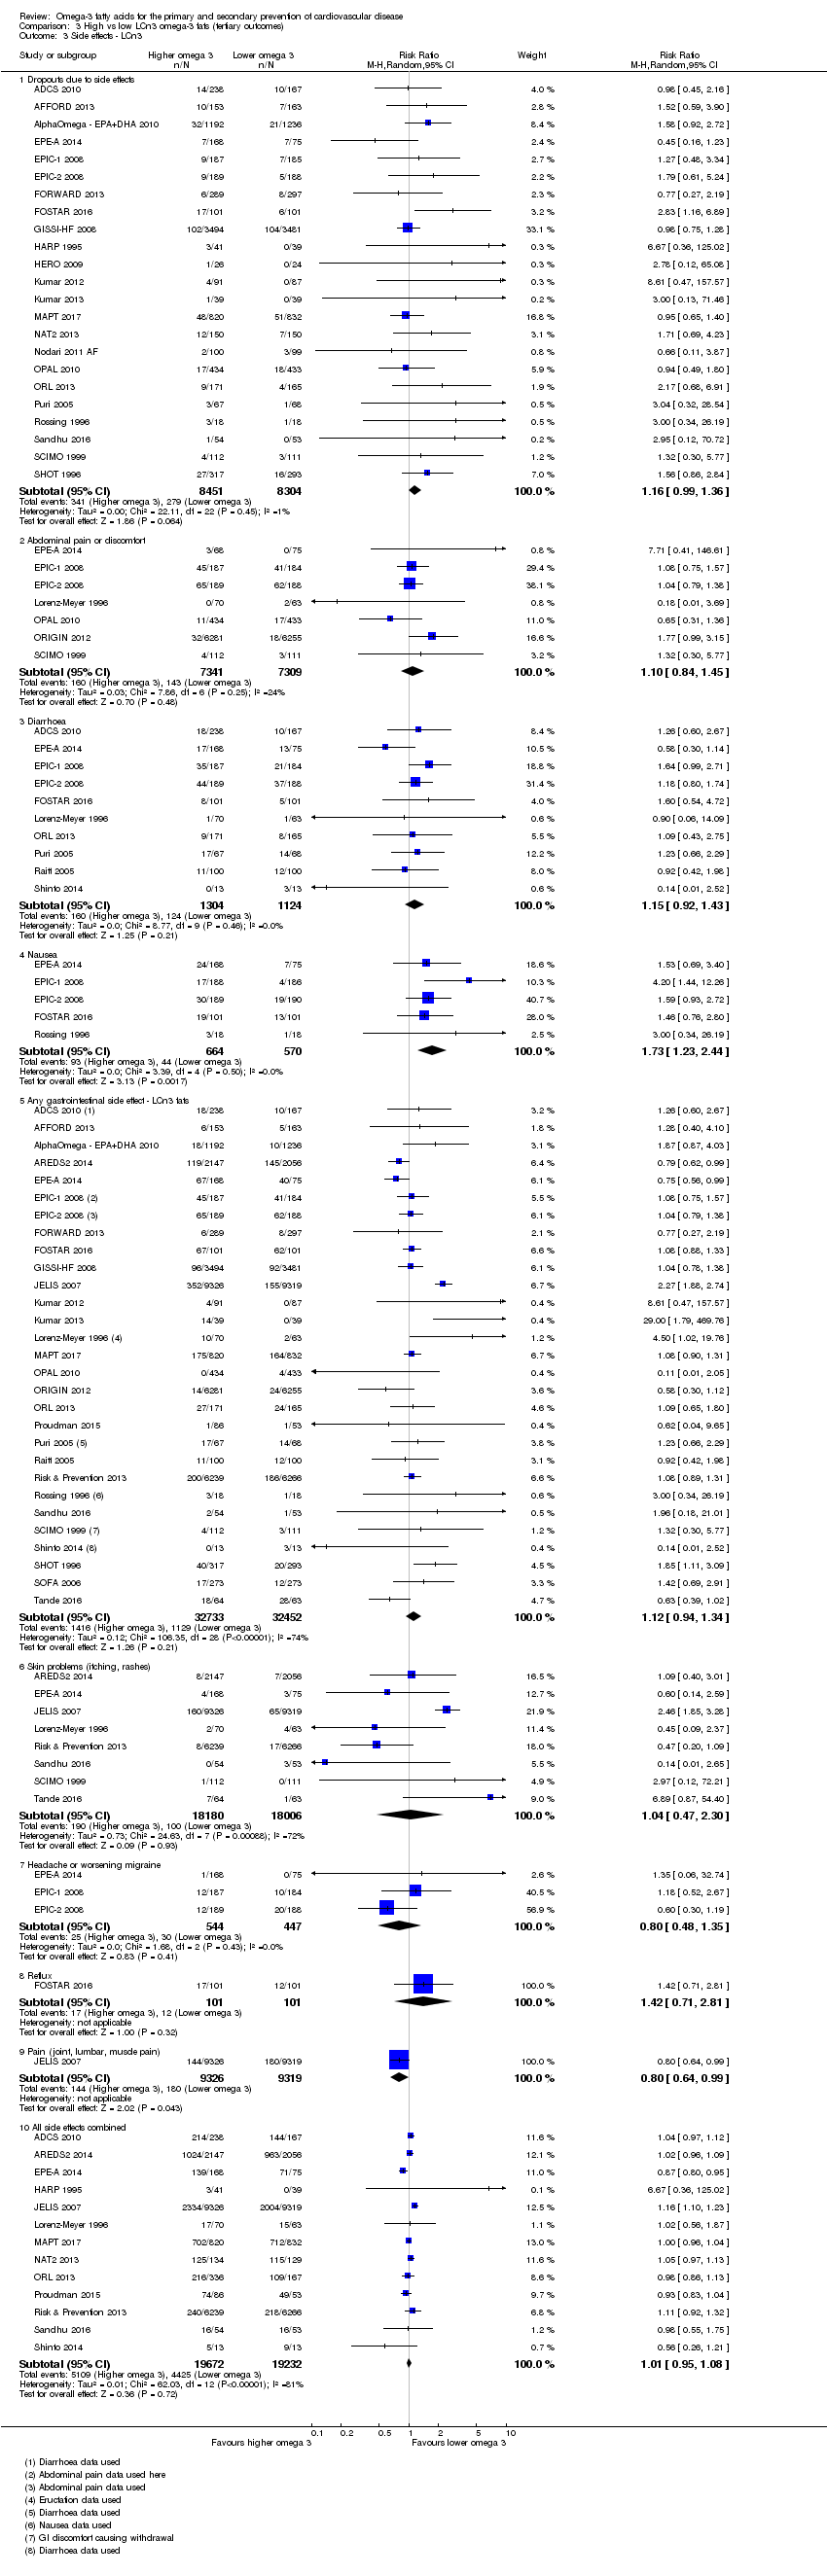
Comparison 3 High vs low LCn3 omega‐3 fats (tertiary outcomes), Outcome 3 Side effects ‐ LCn3.
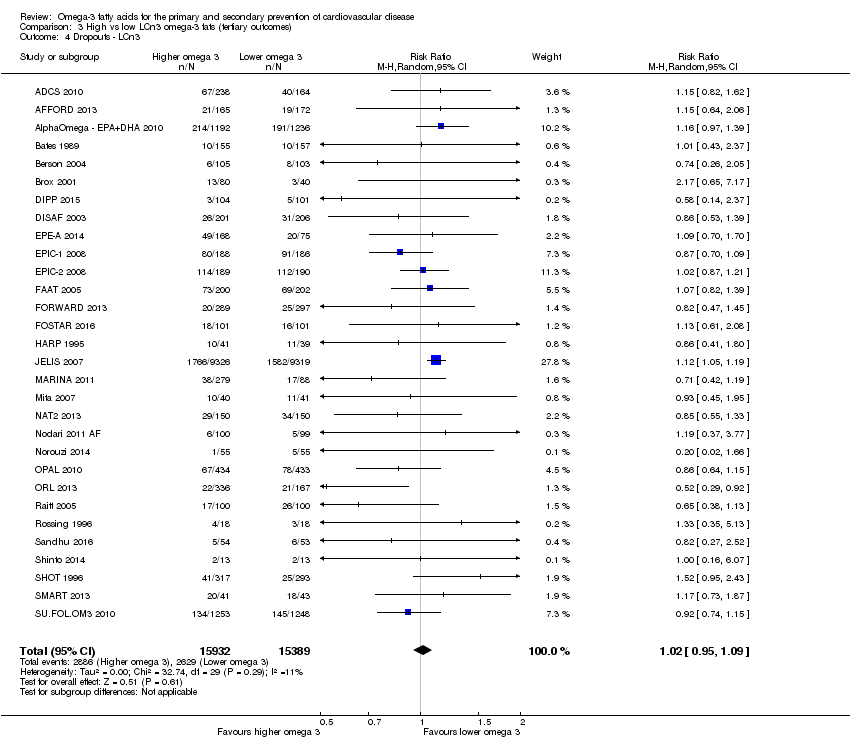
Comparison 3 High vs low LCn3 omega‐3 fats (tertiary outcomes), Outcome 4 Dropouts ‐ LCn3.
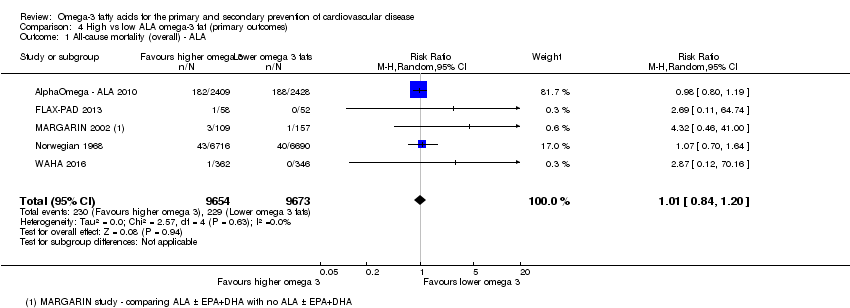
Comparison 4 High vs low ALA omega‐3 fat (primary outcomes), Outcome 1 All‐cause mortality (overall) ‐ ALA.

Comparison 4 High vs low ALA omega‐3 fat (primary outcomes), Outcome 2 All‐cause mortality ‐ ALA ‐ sensitivity analysis (SA) fixed‐effect.
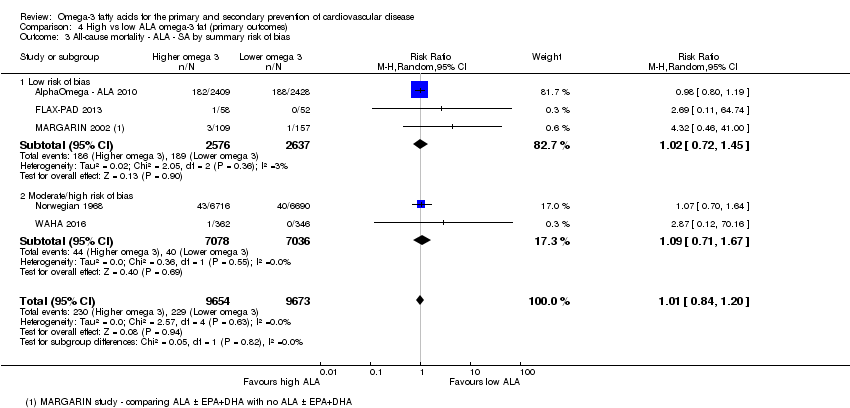
Comparison 4 High vs low ALA omega‐3 fat (primary outcomes), Outcome 3 All‐cause mortality ‐ ALA ‐ SA by summary risk of bias.

Comparison 4 High vs low ALA omega‐3 fat (primary outcomes), Outcome 4 All‐cause mortality ‐ ALA ‐ SA by compliance and study size.
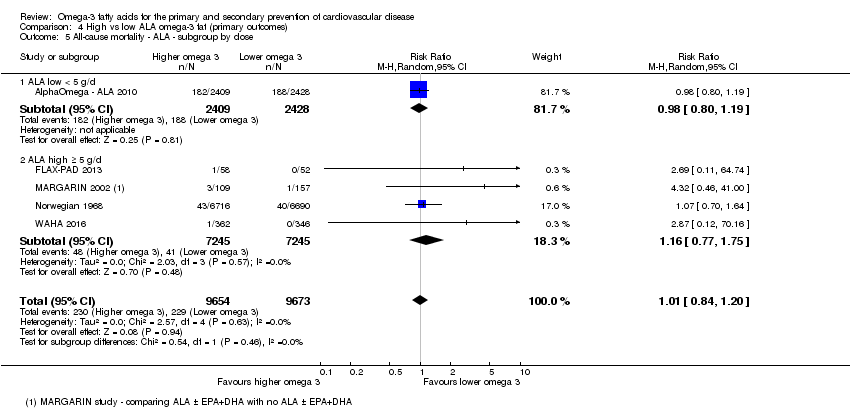
Comparison 4 High vs low ALA omega‐3 fat (primary outcomes), Outcome 5 All‐cause mortality ‐ ALA ‐ subgroup by dose.
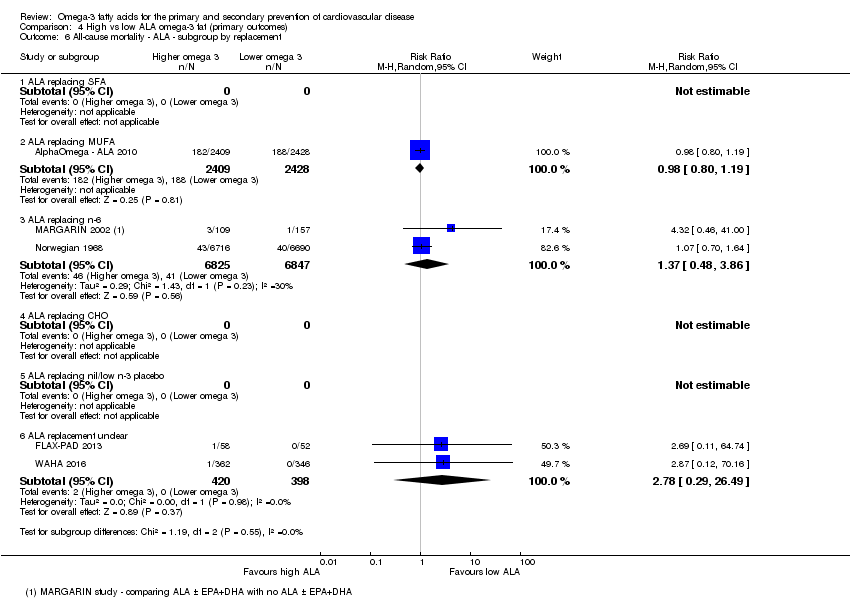
Comparison 4 High vs low ALA omega‐3 fat (primary outcomes), Outcome 6 All‐cause mortality ‐ ALA ‐ subgroup by replacement.

Comparison 4 High vs low ALA omega‐3 fat (primary outcomes), Outcome 7 All cause mortality ‐ ALA ‐ subgroup by intervention type.
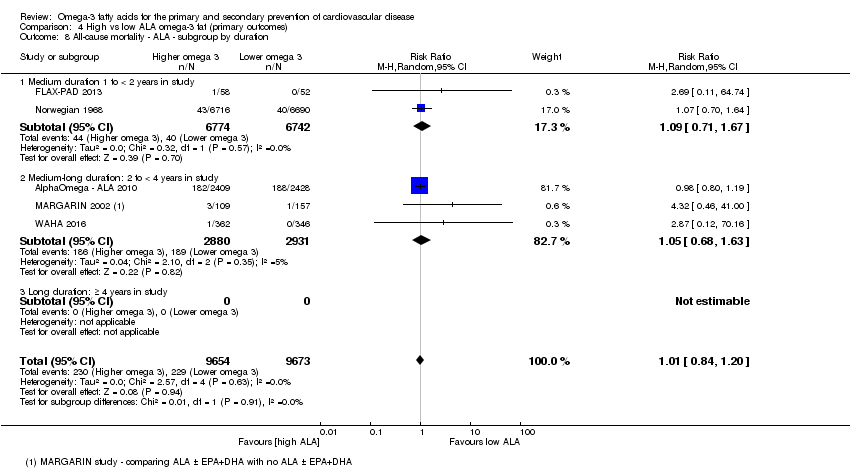
Comparison 4 High vs low ALA omega‐3 fat (primary outcomes), Outcome 8 All‐cause mortality ‐ ALA ‐ subgroup by duration.

Comparison 4 High vs low ALA omega‐3 fat (primary outcomes), Outcome 9 All‐cause mortality ‐ ALA ‐ subgroup by primary or secondary prevention.

Comparison 4 High vs low ALA omega‐3 fat (primary outcomes), Outcome 10 All‐cause mortality ‐ ALA ‐ subgroup by statin use.

Comparison 4 High vs low ALA omega‐3 fat (primary outcomes), Outcome 11 Cardiovascular mortality (overall) ‐ ALA.

Comparison 4 High vs low ALA omega‐3 fat (primary outcomes), Outcome 12 CVD mortality ‐ ALA ‐ SA fixed‐effect.

Comparison 4 High vs low ALA omega‐3 fat (primary outcomes), Outcome 13 CVD mortality ‐ ALA ‐ SA by summary risk of bias.

Comparison 4 High vs low ALA omega‐3 fat (primary outcomes), Outcome 14 CVD mortality ‐ ALA ‐ SA by compliance and study size.

Comparison 4 High vs low ALA omega‐3 fat (primary outcomes), Outcome 15 CVD mortality ‐ ALA ‐ subgroup by dose.
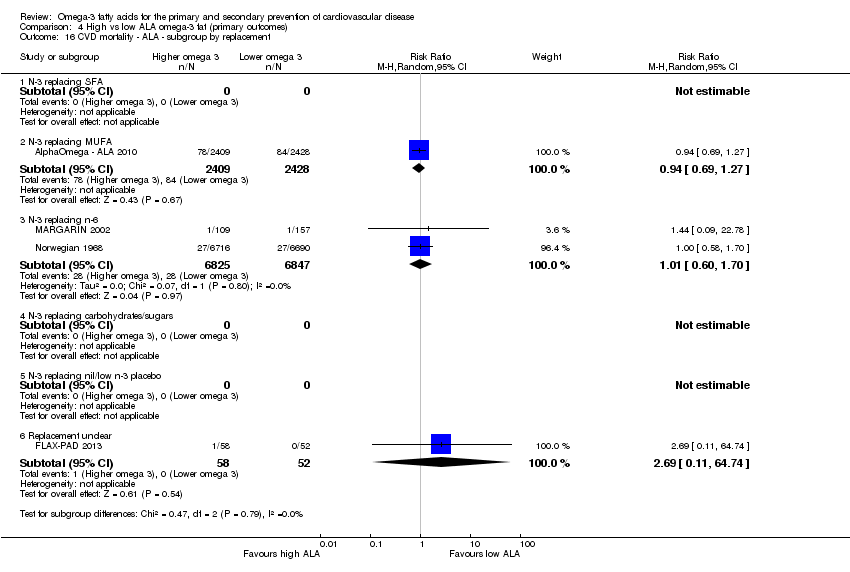
Comparison 4 High vs low ALA omega‐3 fat (primary outcomes), Outcome 16 CVD mortality ‐ ALA ‐ subgroup by replacement.
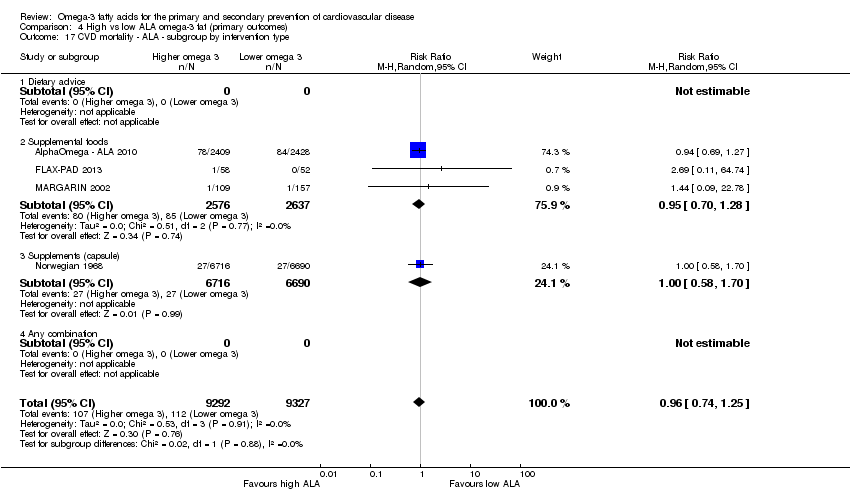
Comparison 4 High vs low ALA omega‐3 fat (primary outcomes), Outcome 17 CVD mortality ‐ ALA ‐ subgroup by intervention type.
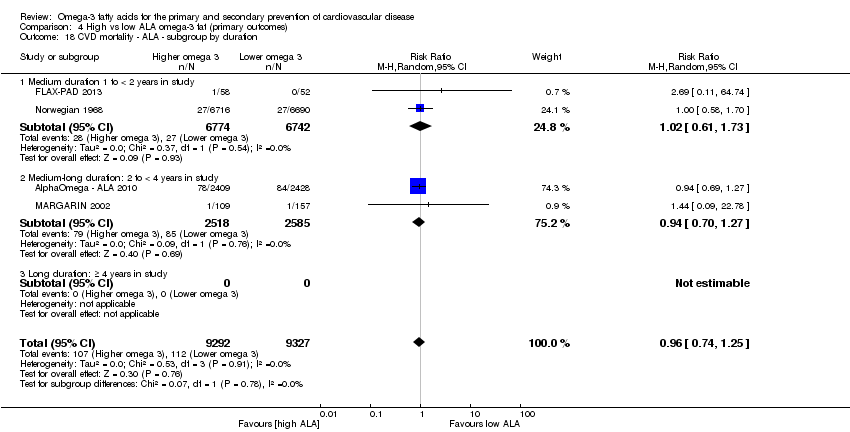
Comparison 4 High vs low ALA omega‐3 fat (primary outcomes), Outcome 18 CVD mortality ‐ ALA ‐ subgroup by duration.
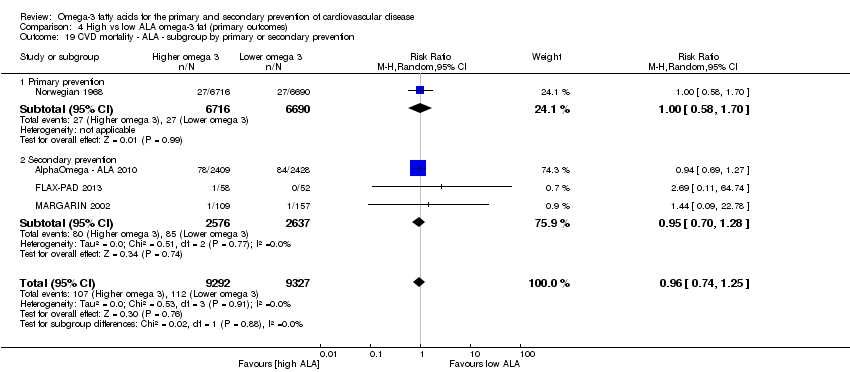
Comparison 4 High vs low ALA omega‐3 fat (primary outcomes), Outcome 19 CVD mortality ‐ ALA ‐ subgroup by primary or secondary prevention.

Comparison 4 High vs low ALA omega‐3 fat (primary outcomes), Outcome 20 CVD mortality ‐ ALA ‐ subgroup by statin uses.
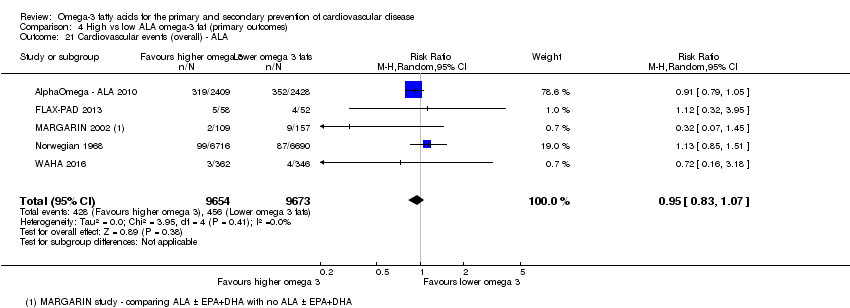
Comparison 4 High vs low ALA omega‐3 fat (primary outcomes), Outcome 21 Cardiovascular events (overall) ‐ ALA.
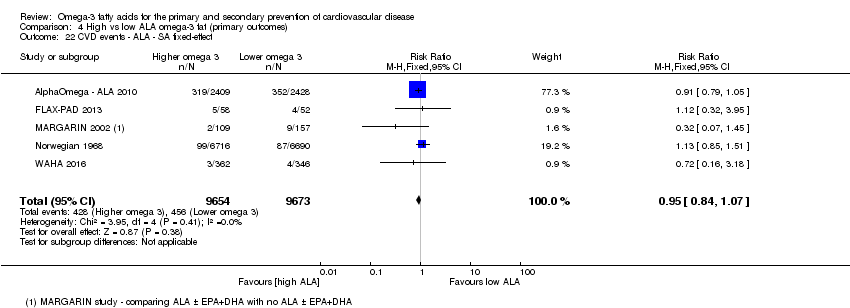
Comparison 4 High vs low ALA omega‐3 fat (primary outcomes), Outcome 22 CVD events ‐ ALA ‐ SA fixed‐effect.
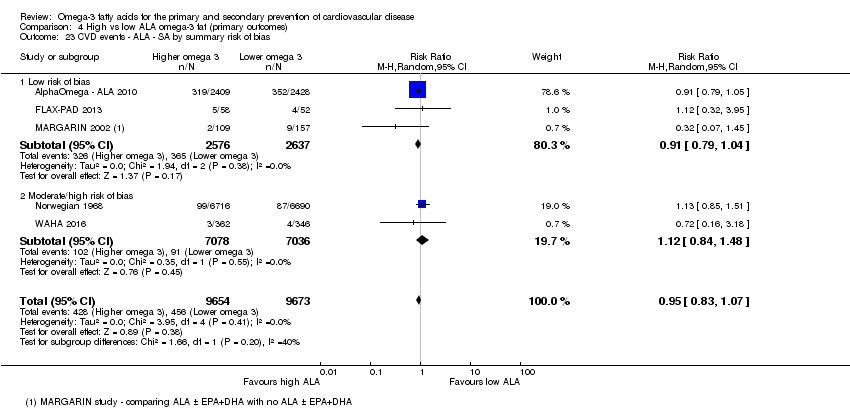
Comparison 4 High vs low ALA omega‐3 fat (primary outcomes), Outcome 23 CVD events ‐ ALA ‐ SA by summary risk of bias.
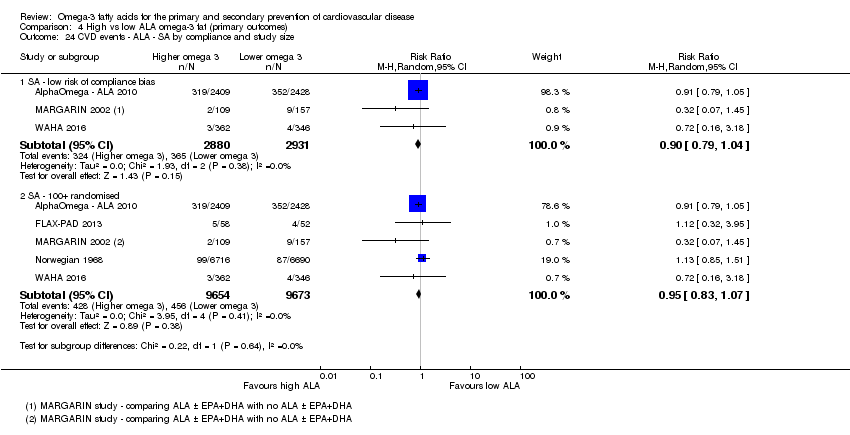
Comparison 4 High vs low ALA omega‐3 fat (primary outcomes), Outcome 24 CVD events ‐ ALA ‐ SA by compliance and study size.

Comparison 4 High vs low ALA omega‐3 fat (primary outcomes), Outcome 25 CVD events ‐ ALA ‐ subgroup by dose.
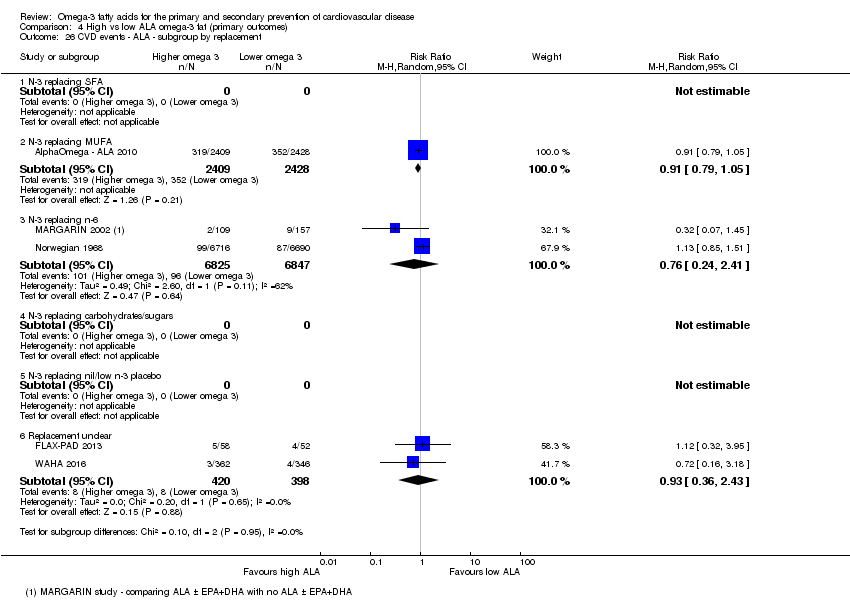
Comparison 4 High vs low ALA omega‐3 fat (primary outcomes), Outcome 26 CVD events ‐ ALA ‐ subgroup by replacement.

Comparison 4 High vs low ALA omega‐3 fat (primary outcomes), Outcome 27 CVD events ‐ ALA ‐ subgroup by intervention type.

Comparison 4 High vs low ALA omega‐3 fat (primary outcomes), Outcome 28 CVD events ‐ ALA ‐ subgroup by duration.
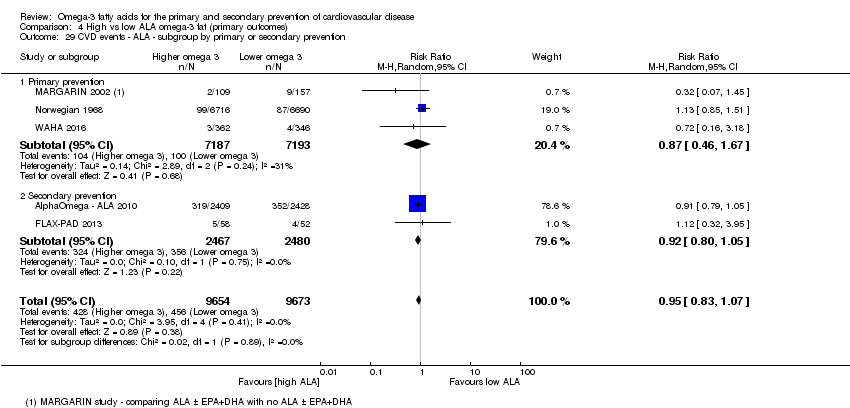
Comparison 4 High vs low ALA omega‐3 fat (primary outcomes), Outcome 29 CVD events ‐ ALA ‐ subgroup by primary or secondary prevention.
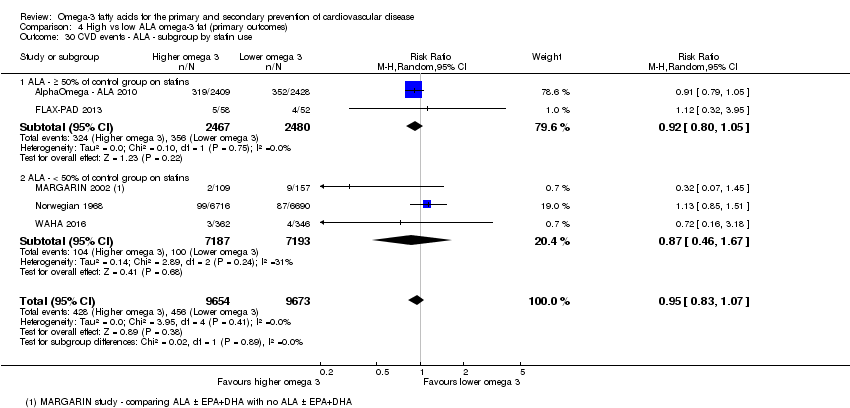
Comparison 4 High vs low ALA omega‐3 fat (primary outcomes), Outcome 30 CVD events ‐ ALA ‐ subgroup by statin use.
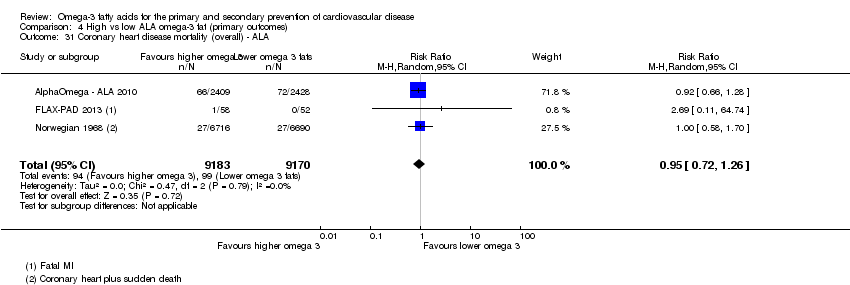
Comparison 4 High vs low ALA omega‐3 fat (primary outcomes), Outcome 31 Coronary heart disease mortality (overall) ‐ ALA.

Comparison 4 High vs low ALA omega‐3 fat (primary outcomes), Outcome 32 CHD mortality ‐ ALA ‐ SA fixed‐effect.

Comparison 4 High vs low ALA omega‐3 fat (primary outcomes), Outcome 33 CHD mortality ‐ ALA ‐ SA by summary risk of bias.

Comparison 4 High vs low ALA omega‐3 fat (primary outcomes), Outcome 34 CHD mortality ‐ ALA ‐ SA by compliance and study size.

Comparison 4 High vs low ALA omega‐3 fat (primary outcomes), Outcome 35 CHD mortality ‐ ALA ‐ subgroup by dose.
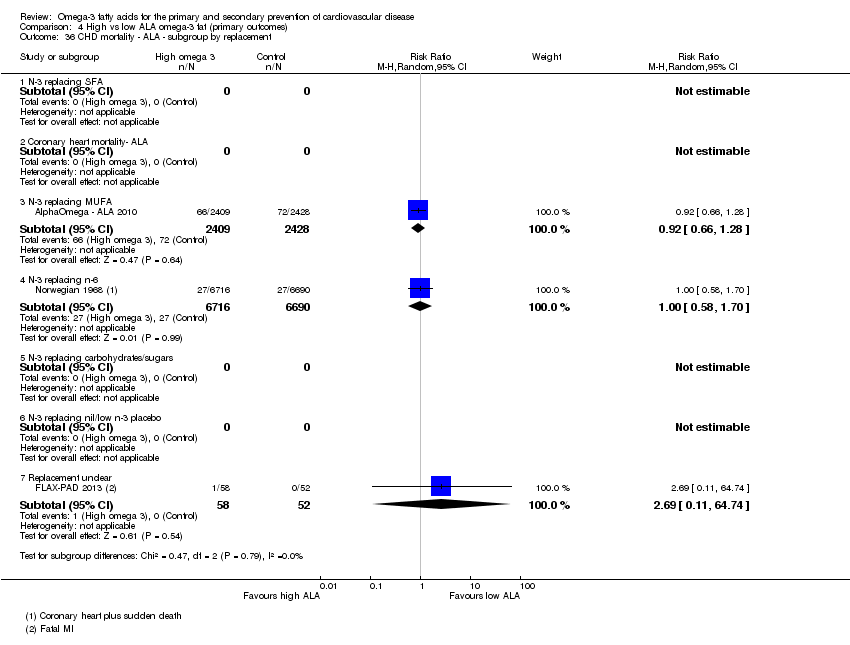
Comparison 4 High vs low ALA omega‐3 fat (primary outcomes), Outcome 36 CHD mortality ‐ ALA ‐ subgroup by replacement.
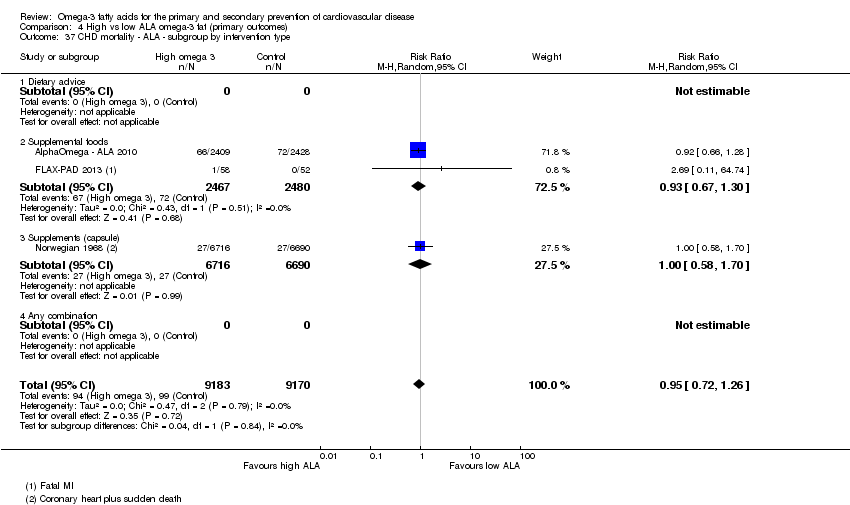
Comparison 4 High vs low ALA omega‐3 fat (primary outcomes), Outcome 37 CHD mortality ‐ ALA ‐ subgroup by intervention type.
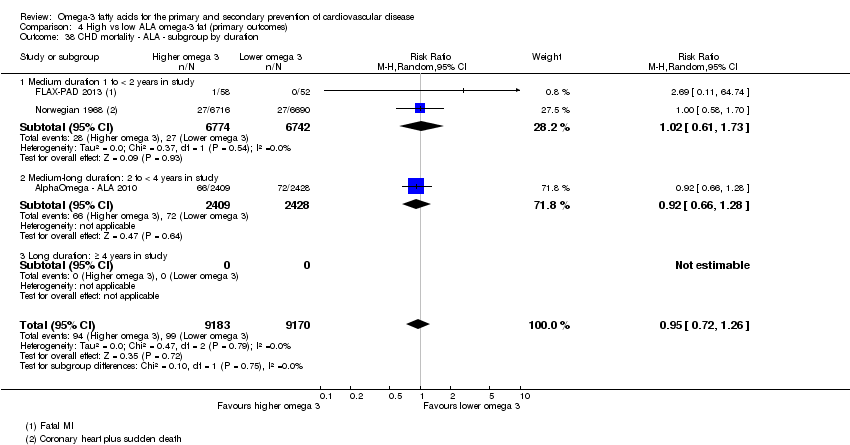
Comparison 4 High vs low ALA omega‐3 fat (primary outcomes), Outcome 38 CHD mortality ‐ ALA ‐ subgroup by duration.
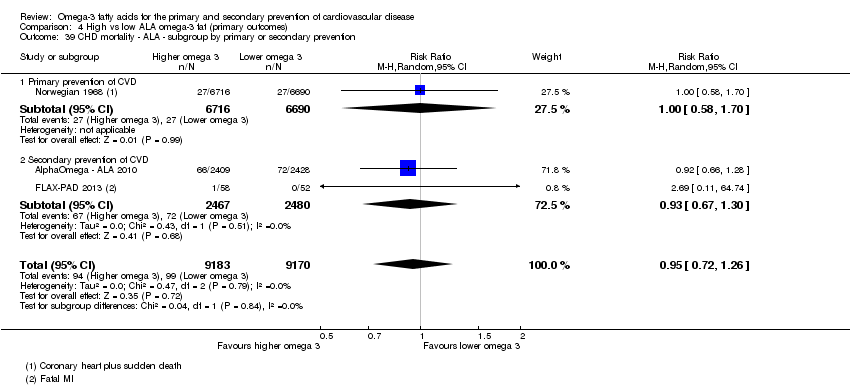
Comparison 4 High vs low ALA omega‐3 fat (primary outcomes), Outcome 39 CHD mortality ‐ ALA ‐ subgroup by primary or secondary prevention.
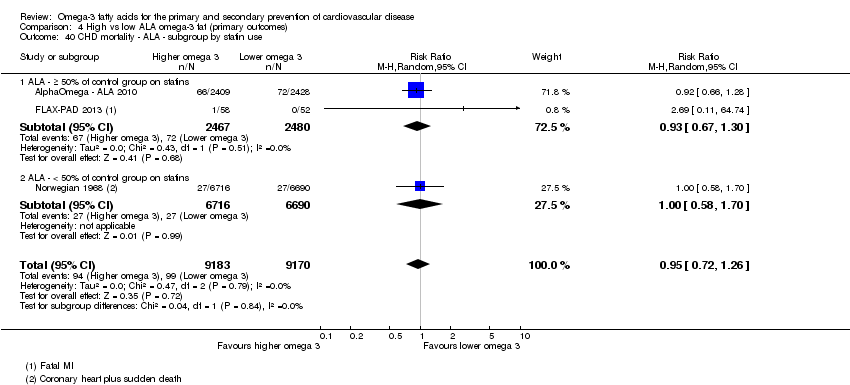
Comparison 4 High vs low ALA omega‐3 fat (primary outcomes), Outcome 40 CHD mortality ‐ ALA ‐ subgroup by statin use.
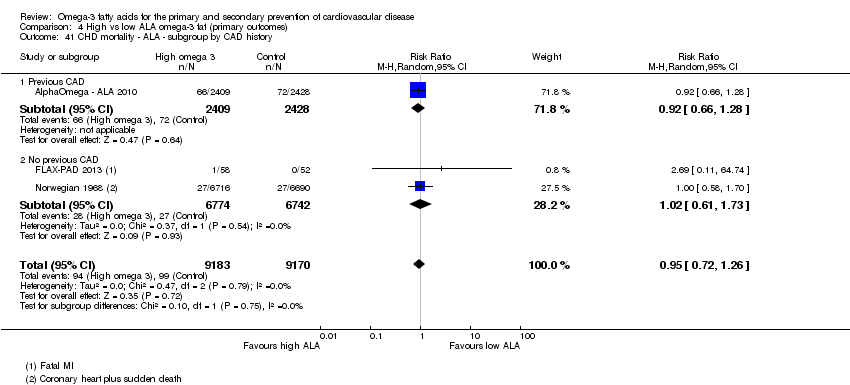
Comparison 4 High vs low ALA omega‐3 fat (primary outcomes), Outcome 41 CHD mortality ‐ ALA ‐ subgroup by CAD history.
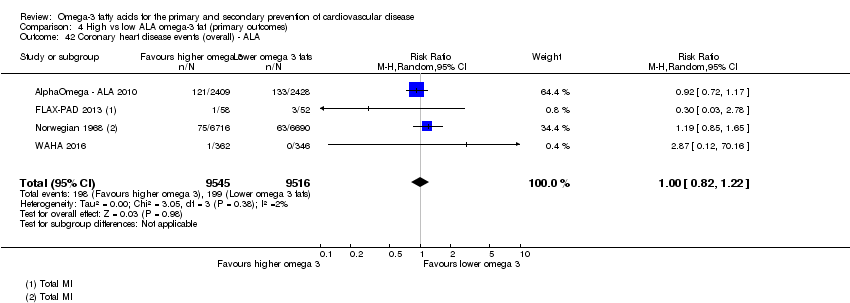
Comparison 4 High vs low ALA omega‐3 fat (primary outcomes), Outcome 42 Coronary heart disease events (overall) ‐ ALA.
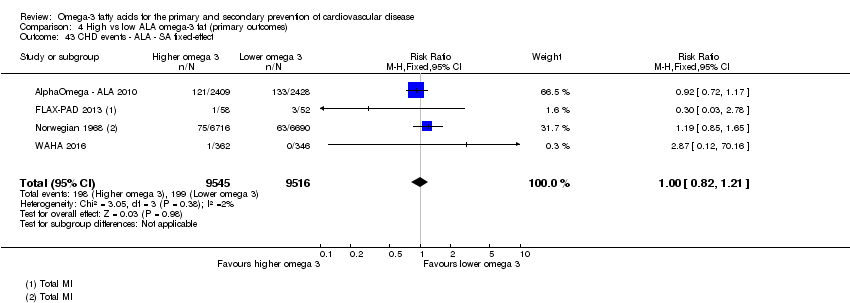
Comparison 4 High vs low ALA omega‐3 fat (primary outcomes), Outcome 43 CHD events ‐ ALA ‐ SA fixed‐effect.

Comparison 4 High vs low ALA omega‐3 fat (primary outcomes), Outcome 44 CHD events ‐ ALA ‐ SA by summary risk of bias.
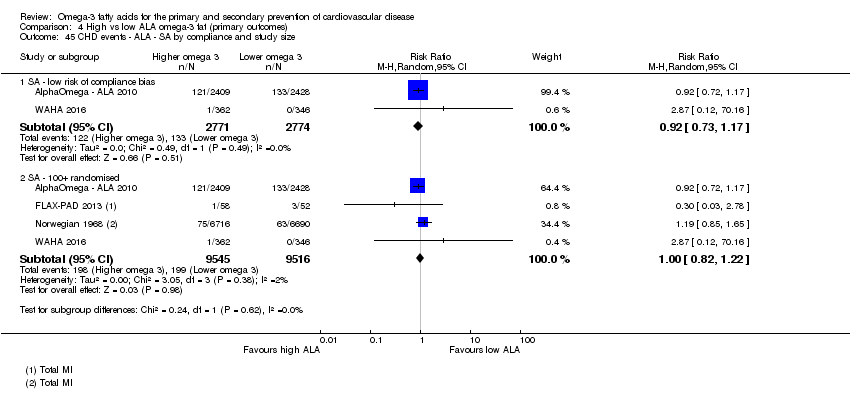
Comparison 4 High vs low ALA omega‐3 fat (primary outcomes), Outcome 45 CHD events ‐ ALA ‐ SA by compliance and study size.

Comparison 4 High vs low ALA omega‐3 fat (primary outcomes), Outcome 46 CHD events ‐ ALA ‐ subgroup by dose.
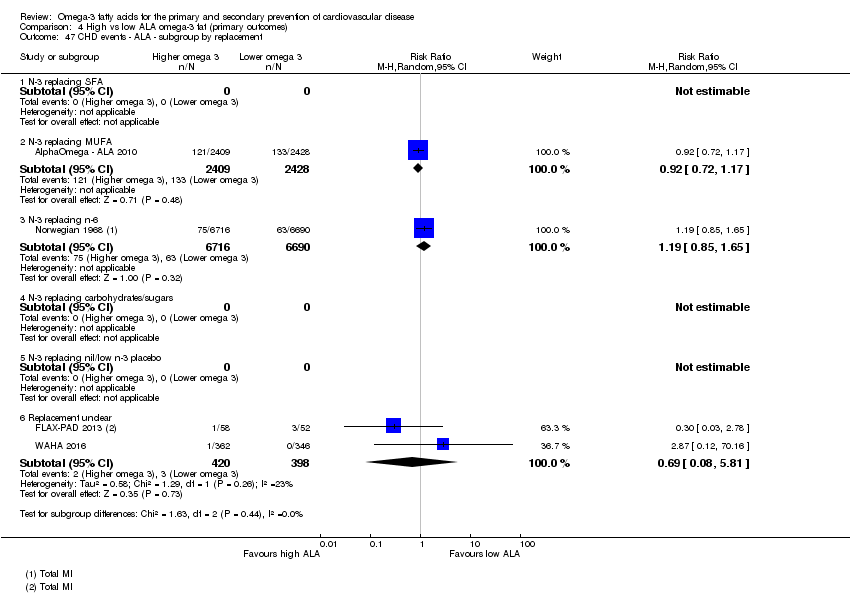
Comparison 4 High vs low ALA omega‐3 fat (primary outcomes), Outcome 47 CHD events ‐ ALA ‐ subgroup by replacement.
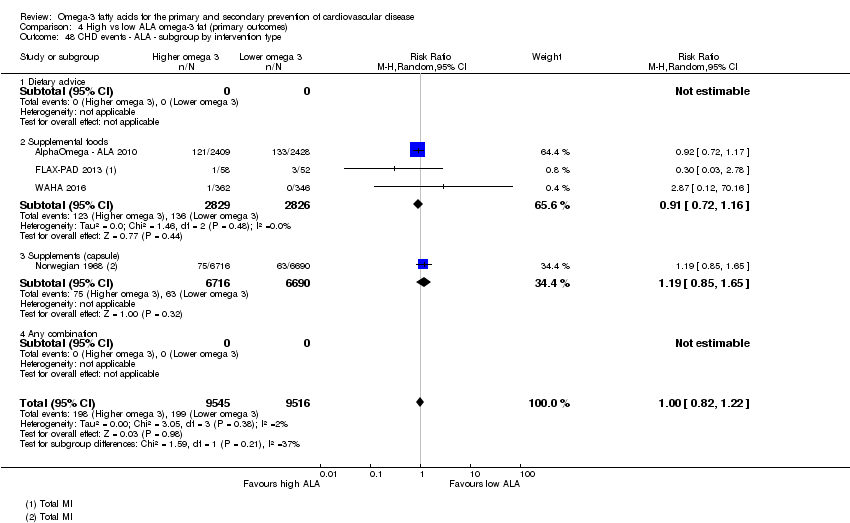
Comparison 4 High vs low ALA omega‐3 fat (primary outcomes), Outcome 48 CHD events ‐ ALA ‐ subgroup by intervention type.
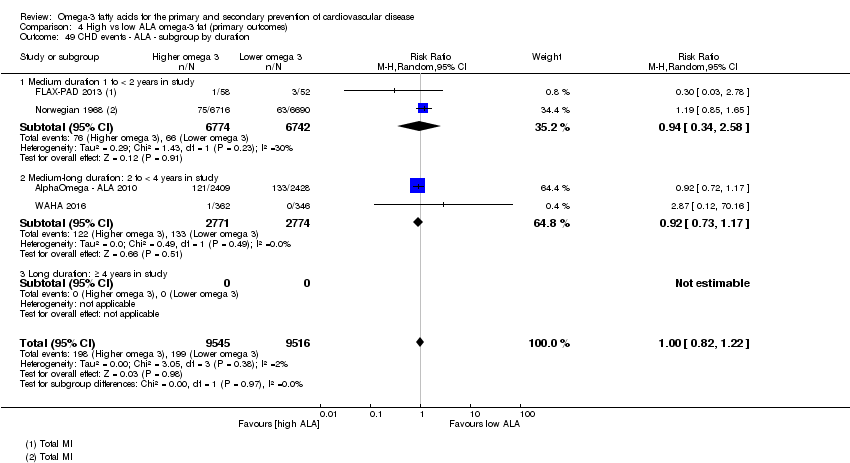
Comparison 4 High vs low ALA omega‐3 fat (primary outcomes), Outcome 49 CHD events ‐ ALA ‐ subgroup by duration.

Comparison 4 High vs low ALA omega‐3 fat (primary outcomes), Outcome 50 CHD events ‐ ALA ‐ subgroup by primary or secondary prevention.

Comparison 4 High vs low ALA omega‐3 fat (primary outcomes), Outcome 51 CHD events ‐ ALA ‐ subgroup by statin use.

Comparison 4 High vs low ALA omega‐3 fat (primary outcomes), Outcome 52 CHD events ‐ ALA ‐ subgroup by CAD history.

Comparison 4 High vs low ALA omega‐3 fat (primary outcomes), Outcome 53 Stroke (overall) ‐ ALA.

Comparison 4 High vs low ALA omega‐3 fat (primary outcomes), Outcome 54 Stroke ‐ ALA ‐ SA fixed‐effect.

Comparison 4 High vs low ALA omega‐3 fat (primary outcomes), Outcome 55 Stroke ‐ ALA ‐ SA by summary risk of bias.
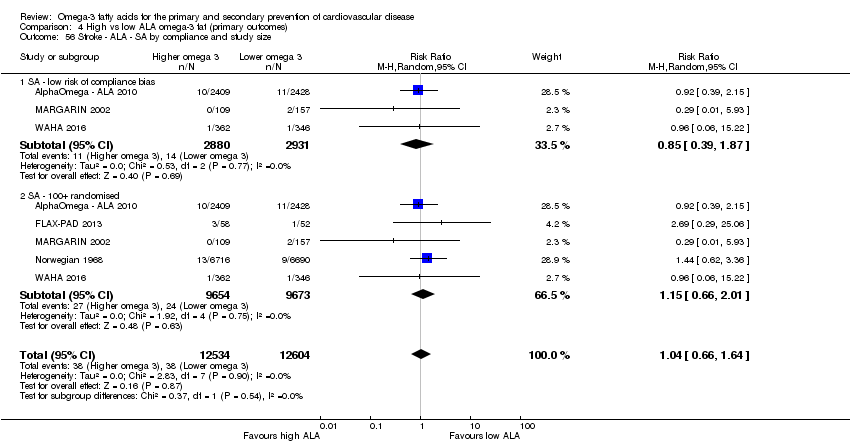
Comparison 4 High vs low ALA omega‐3 fat (primary outcomes), Outcome 56 Stroke ‐ ALA ‐ SA by compliance and study size.

Comparison 4 High vs low ALA omega‐3 fat (primary outcomes), Outcome 57 Stroke ‐ ALA ‐ subgroup by dose.

Comparison 4 High vs low ALA omega‐3 fat (primary outcomes), Outcome 58 Stroke ‐ ALA ‐ subgroup by replacement.
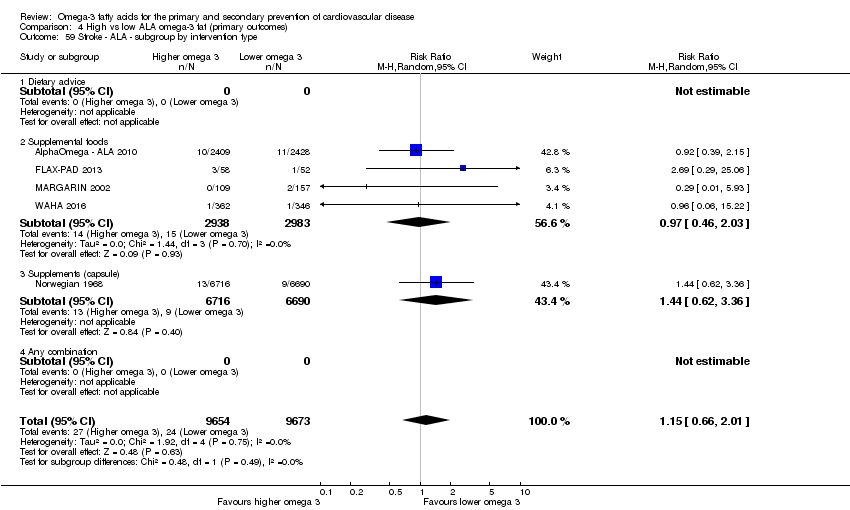
Comparison 4 High vs low ALA omega‐3 fat (primary outcomes), Outcome 59 Stroke ‐ ALA ‐ subgroup by intervention type.

Comparison 4 High vs low ALA omega‐3 fat (primary outcomes), Outcome 60 Stroke ‐ ALA ‐ subgroup by duration.
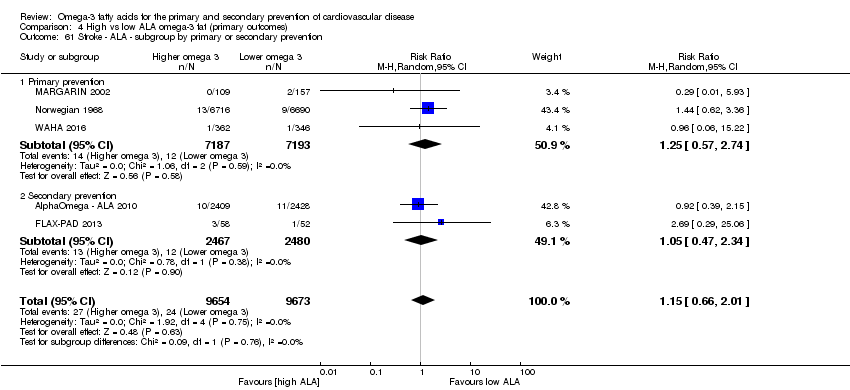
Comparison 4 High vs low ALA omega‐3 fat (primary outcomes), Outcome 61 Stroke ‐ ALA ‐ subgroup by primary or secondary prevention.
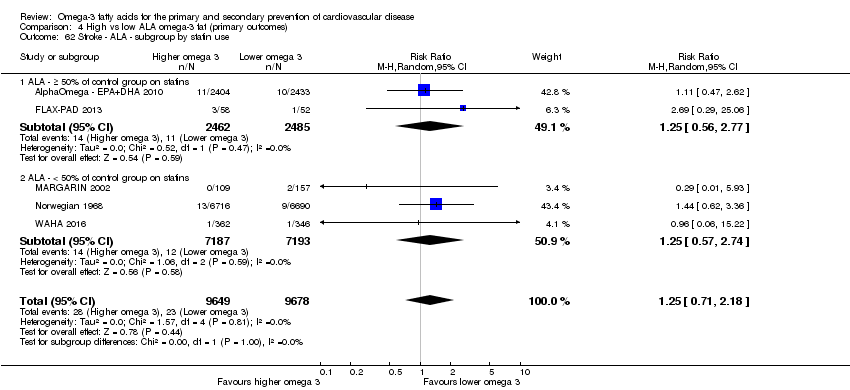
Comparison 4 High vs low ALA omega‐3 fat (primary outcomes), Outcome 62 Stroke ‐ ALA ‐ subgroup by statin use.

Comparison 4 High vs low ALA omega‐3 fat (primary outcomes), Outcome 63 Stroke ‐ ALA ‐ subgroup by stroke type.

Comparison 4 High vs low ALA omega‐3 fat (primary outcomes), Outcome 64 Arrythmia (overall) ‐ ALA.

Comparison 4 High vs low ALA omega‐3 fat (primary outcomes), Outcome 65 Arrhythmia ‐ ALA ‐ SA by summary risk of bias.
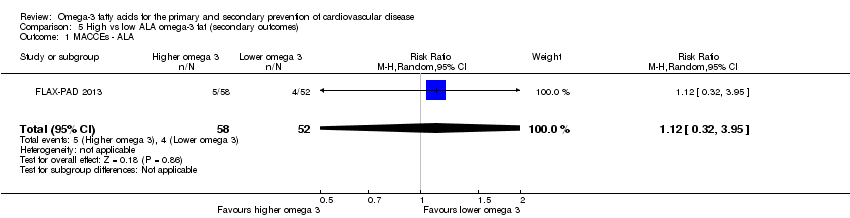
Comparison 5 High vs low ALA omega‐3 fat (secondary outcomes), Outcome 1 MACCEs ‐ ALA.
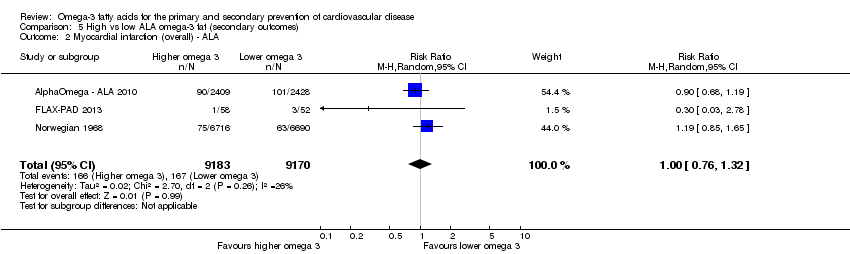
Comparison 5 High vs low ALA omega‐3 fat (secondary outcomes), Outcome 2 Myocardial infarction (overall) ‐ ALA.
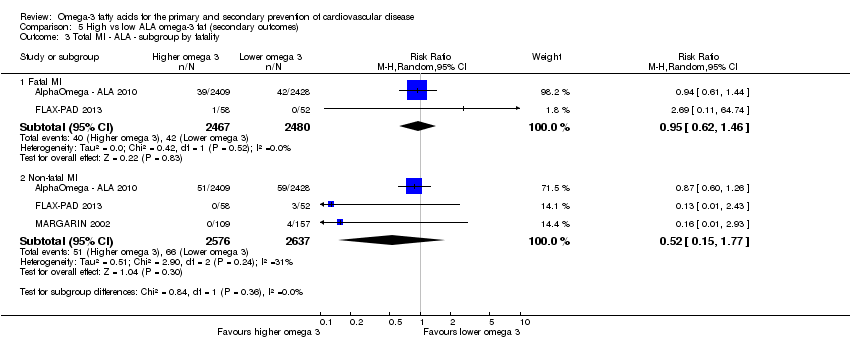
Comparison 5 High vs low ALA omega‐3 fat (secondary outcomes), Outcome 3 Total MI ‐ ALA ‐ subgroup by fatality.

Comparison 5 High vs low ALA omega‐3 fat (secondary outcomes), Outcome 4 Angina ‐ ALA.
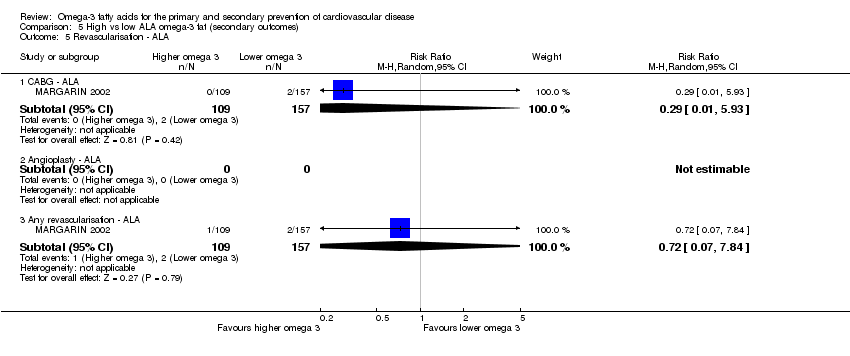
Comparison 5 High vs low ALA omega‐3 fat (secondary outcomes), Outcome 5 Revascularisation ‐ ALA.
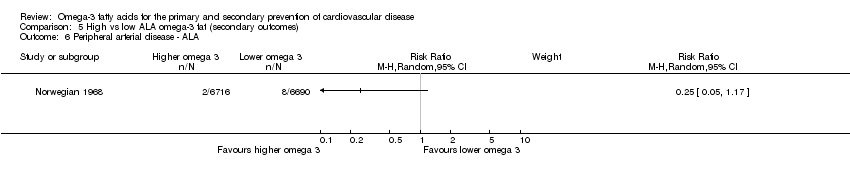
Comparison 5 High vs low ALA omega‐3 fat (secondary outcomes), Outcome 6 Peripheral arterial disease ‐ ALA.

Comparison 5 High vs low ALA omega‐3 fat (secondary outcomes), Outcome 7 Body weight, kg ‐ ALA.

Comparison 5 High vs low ALA omega‐3 fat (secondary outcomes), Outcome 8 Weight, kg ‐ ALA ‐ sensitivity analysis (SA) fixed‐effect.

Comparison 5 High vs low ALA omega‐3 fat (secondary outcomes), Outcome 9 Weight, kg ‐ ALA ‐ SA by summary risk of bias.
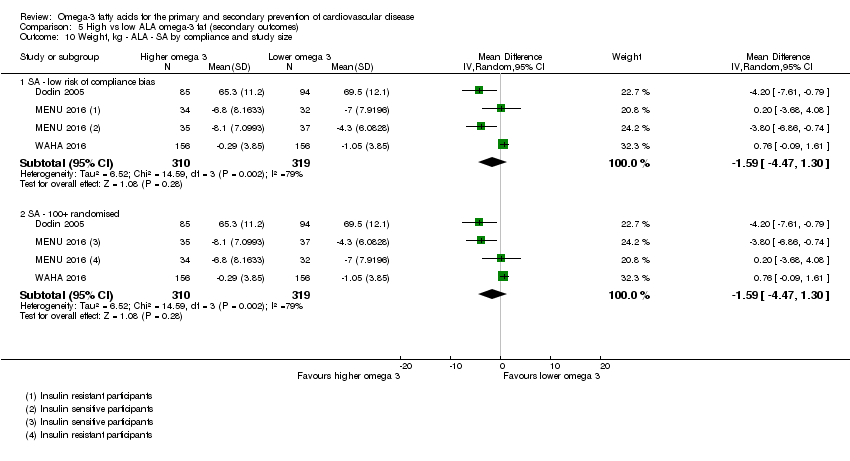
Comparison 5 High vs low ALA omega‐3 fat (secondary outcomes), Outcome 10 Weight, kg ‐ ALA ‐ SA by compliance and study size.

Comparison 5 High vs low ALA omega‐3 fat (secondary outcomes), Outcome 11 Weight, kg ‐ ALA ‐ subgroup by dose.

Comparison 5 High vs low ALA omega‐3 fat (secondary outcomes), Outcome 12 Weight, kg ‐ ALA ‐ subgroup by intervention type.
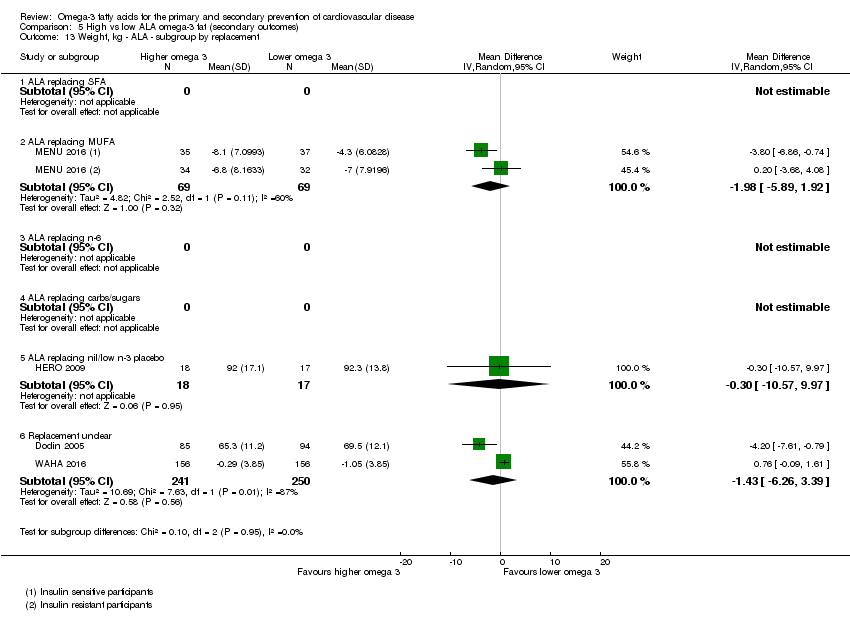
Comparison 5 High vs low ALA omega‐3 fat (secondary outcomes), Outcome 13 Weight, kg ‐ ALA ‐ subgroup by replacement.

Comparison 5 High vs low ALA omega‐3 fat (secondary outcomes), Outcome 14 Weight, kg ‐ ALA ‐ subgroup by duration.

Comparison 5 High vs low ALA omega‐3 fat (secondary outcomes), Outcome 15 Weight, kg ‐ ALA ‐ subgroup by statin use.

Comparison 5 High vs low ALA omega‐3 fat (secondary outcomes), Outcome 16 Weight, kg ‐ ALA ‐ subgroup by primary or secondary prevention.
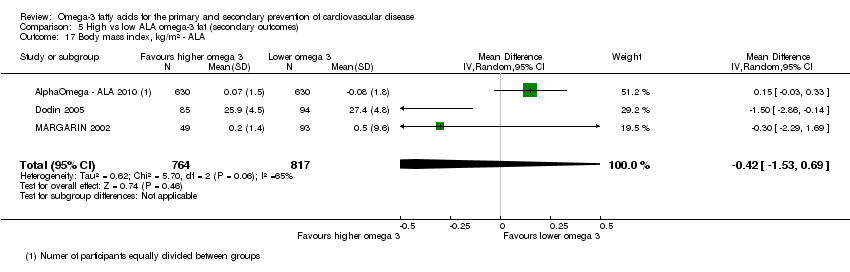
Comparison 5 High vs low ALA omega‐3 fat (secondary outcomes), Outcome 17 Body mass index, kg/m² ‐ ALA.
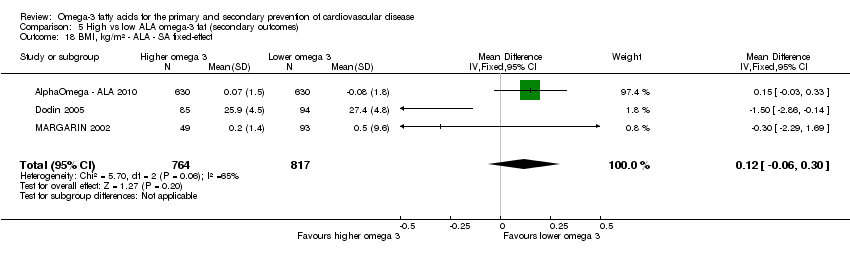
Comparison 5 High vs low ALA omega‐3 fat (secondary outcomes), Outcome 18 BMI, kg/m² ‐ ALA ‐ SA fixed‐effect.
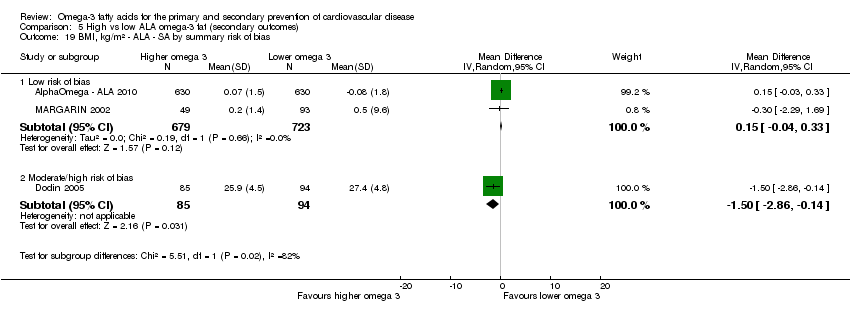
Comparison 5 High vs low ALA omega‐3 fat (secondary outcomes), Outcome 19 BMI, kg/m² ‐ ALA ‐ SA by summary risk of bias.

Comparison 5 High vs low ALA omega‐3 fat (secondary outcomes), Outcome 20 BMI, kg/m² ‐ ALA ‐ SA by compliance and study size.

Comparison 5 High vs low ALA omega‐3 fat (secondary outcomes), Outcome 21 BMI, kg/m² ‐ ALA ‐ subgroup by dose.

Comparison 5 High vs low ALA omega‐3 fat (secondary outcomes), Outcome 22 BMI, kg/m² ‐ ALA ‐ subgroup by intervention type.

Comparison 5 High vs low ALA omega‐3 fat (secondary outcomes), Outcome 23 BMI, kg/m² ‐ ALA ‐ subgroup by replacement.

Comparison 5 High vs low ALA omega‐3 fat (secondary outcomes), Outcome 24 BMI, kg/m² ‐ ALA ‐ subgroup by duration.

Comparison 5 High vs low ALA omega‐3 fat (secondary outcomes), Outcome 25 BMI, kg/m² ‐ ALA ‐ subgroup by statin use.

Comparison 5 High vs low ALA omega‐3 fat (secondary outcomes), Outcome 26 BMI, kg/m² ‐ ALA ‐ subgroup by primary or secondary preventionA.

Comparison 5 High vs low ALA omega‐3 fat (secondary outcomes), Outcome 27 Other measures of adiposity ‐ ALA.
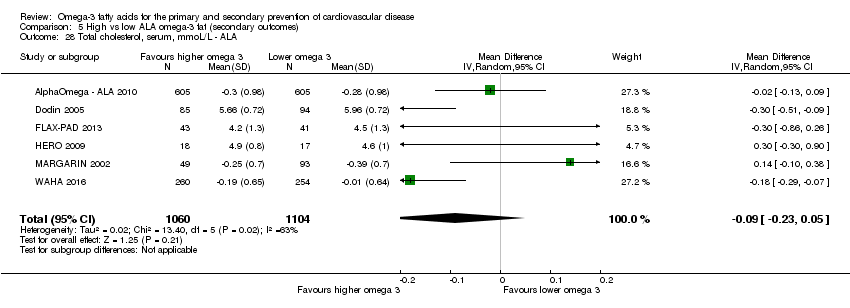
Comparison 5 High vs low ALA omega‐3 fat (secondary outcomes), Outcome 28 Total cholesterol, serum, mmoL/L ‐ ALA.
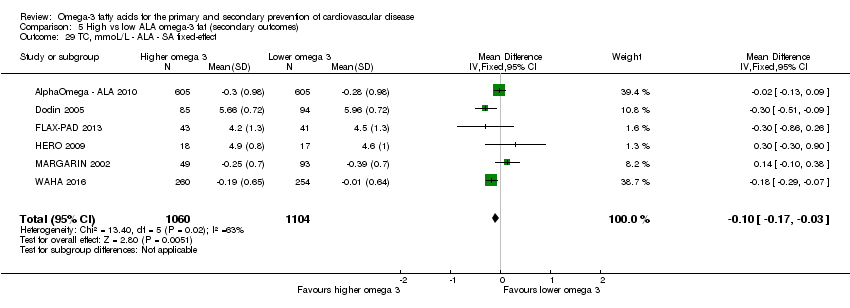
Comparison 5 High vs low ALA omega‐3 fat (secondary outcomes), Outcome 29 TC, mmoL/L ‐ ALA ‐ SA fixed‐effect.
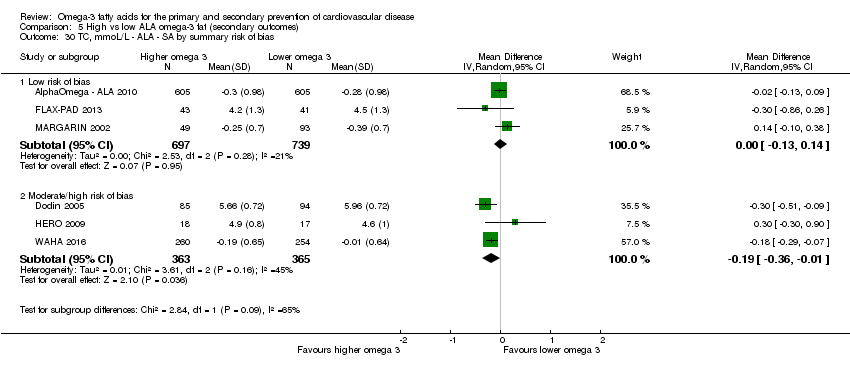
Comparison 5 High vs low ALA omega‐3 fat (secondary outcomes), Outcome 30 TC, mmoL/L ‐ ALA ‐ SA by summary risk of bias.

Comparison 5 High vs low ALA omega‐3 fat (secondary outcomes), Outcome 31 TC, mmoL/L ‐ ALA ‐ SA by compliance and study size.

Comparison 5 High vs low ALA omega‐3 fat (secondary outcomes), Outcome 32 TC, mmoL/L ‐ ALA ‐ subgroup by dose.

Comparison 5 High vs low ALA omega‐3 fat (secondary outcomes), Outcome 33 TC, mmoL/L ‐ ALA ‐ subgroup by intervention type.
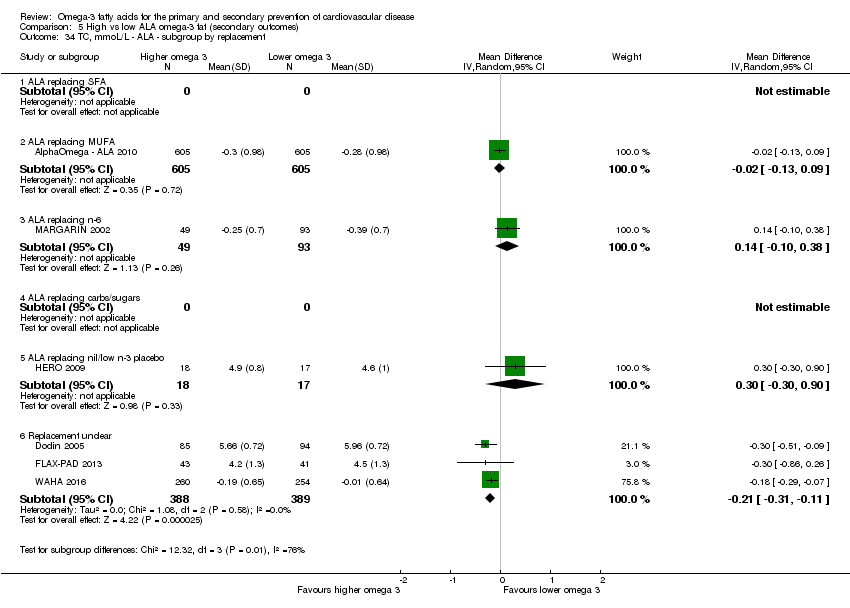
Comparison 5 High vs low ALA omega‐3 fat (secondary outcomes), Outcome 34 TC, mmoL/L ‐ ALA ‐ subgroup by replacement.

Comparison 5 High vs low ALA omega‐3 fat (secondary outcomes), Outcome 35 TC, mmoL/L ‐ ALA ‐ subgroup by duration.

Comparison 5 High vs low ALA omega‐3 fat (secondary outcomes), Outcome 36 TC, mmoL/L ‐ ALA ‐ subgroup by statin use.
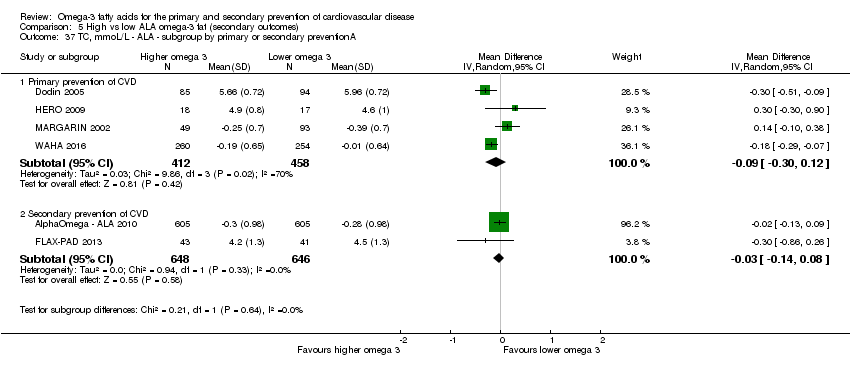
Comparison 5 High vs low ALA omega‐3 fat (secondary outcomes), Outcome 37 TC, mmoL/L ‐ ALA ‐ subgroup by primary or secondary preventionA.
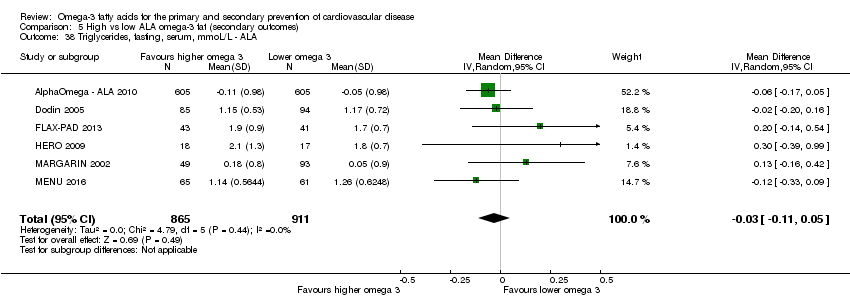
Comparison 5 High vs low ALA omega‐3 fat (secondary outcomes), Outcome 38 Triglycerides, fasting, serum, mmoL/L ‐ ALA.

Comparison 5 High vs low ALA omega‐3 fat (secondary outcomes), Outcome 39 TG, fasting, mmoL/L ‐ ALA ‐ SA fixed‐effect.
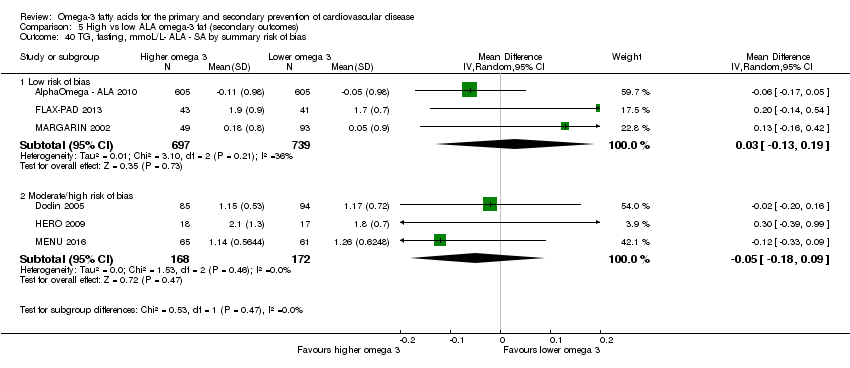
Comparison 5 High vs low ALA omega‐3 fat (secondary outcomes), Outcome 40 TG, fasting, mmoL/L‐ ALA ‐ SA by summary risk of bias.
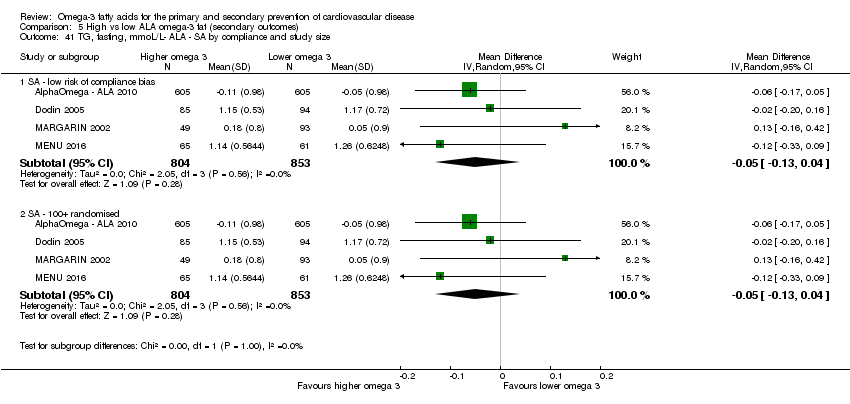
Comparison 5 High vs low ALA omega‐3 fat (secondary outcomes), Outcome 41 TG, fasting, mmoL/L‐ ALA ‐ SA by compliance and study size.

Comparison 5 High vs low ALA omega‐3 fat (secondary outcomes), Outcome 42 TG, fasting, mmoL/L ‐ ALA ‐ subgroup by dose.

Comparison 5 High vs low ALA omega‐3 fat (secondary outcomes), Outcome 43 TG, fasting, mmoL/L‐ ALA ‐ subgroup by intervention type.
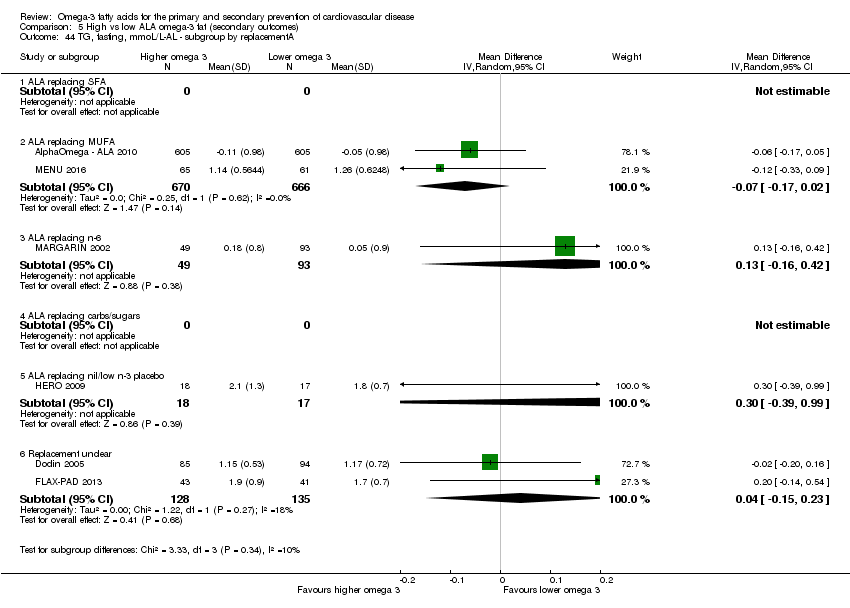
Comparison 5 High vs low ALA omega‐3 fat (secondary outcomes), Outcome 44 TG, fasting, mmoL/L‐AL ‐ subgroup by replacementA.

Comparison 5 High vs low ALA omega‐3 fat (secondary outcomes), Outcome 45 TG, fasting, mmoL/L‐ ALA ‐ subgroup by duration.

Comparison 5 High vs low ALA omega‐3 fat (secondary outcomes), Outcome 46 TG, fasting, mmoL/L ‐ ALA ‐ subgroup by statin use.
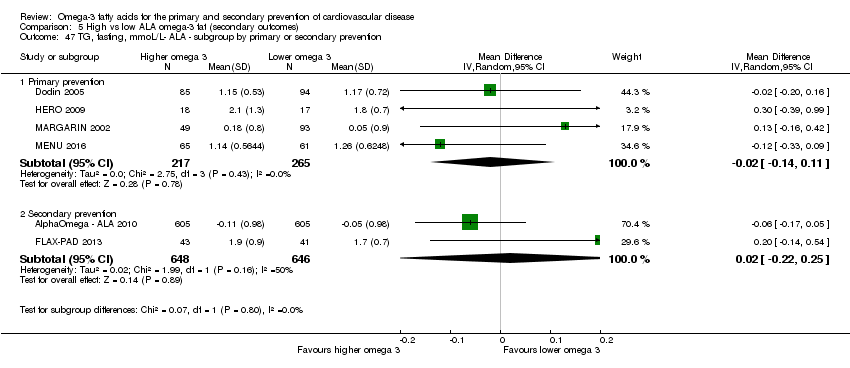
Comparison 5 High vs low ALA omega‐3 fat (secondary outcomes), Outcome 47 TG, fasting, mmoL/L‐ ALA ‐ subgroup by primary or secondary prevention.

Comparison 5 High vs low ALA omega‐3 fat (secondary outcomes), Outcome 48 High‐density lipoprotein, serum, mmoL/L ‐ ALA.
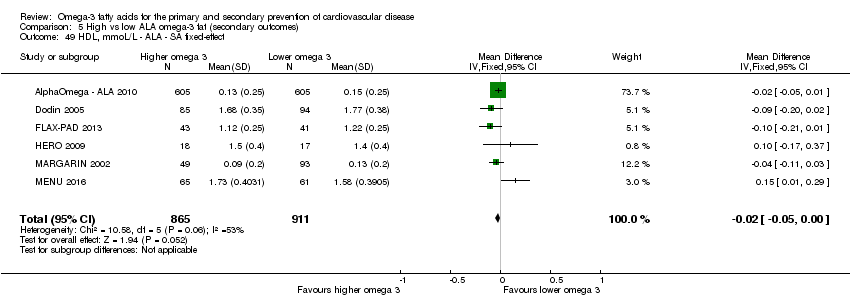
Comparison 5 High vs low ALA omega‐3 fat (secondary outcomes), Outcome 49 HDL, mmoL/L ‐ ALA ‐ SA fixed‐effect.

Comparison 5 High vs low ALA omega‐3 fat (secondary outcomes), Outcome 50 HDL, mmoL/L ‐ ALA ‐ SA by summary risk of bias.

Comparison 5 High vs low ALA omega‐3 fat (secondary outcomes), Outcome 51 HDL, mmoL/L ‐ ALA ‐ SA by compliance and study size.
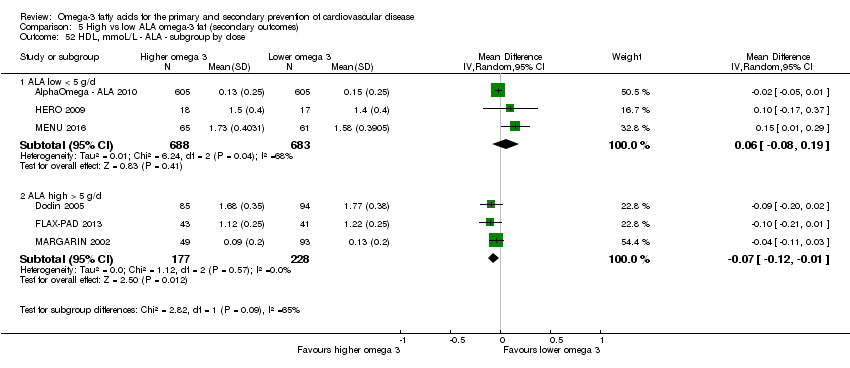
Comparison 5 High vs low ALA omega‐3 fat (secondary outcomes), Outcome 52 HDL, mmoL/L ‐ ALA ‐ subgroup by dose.
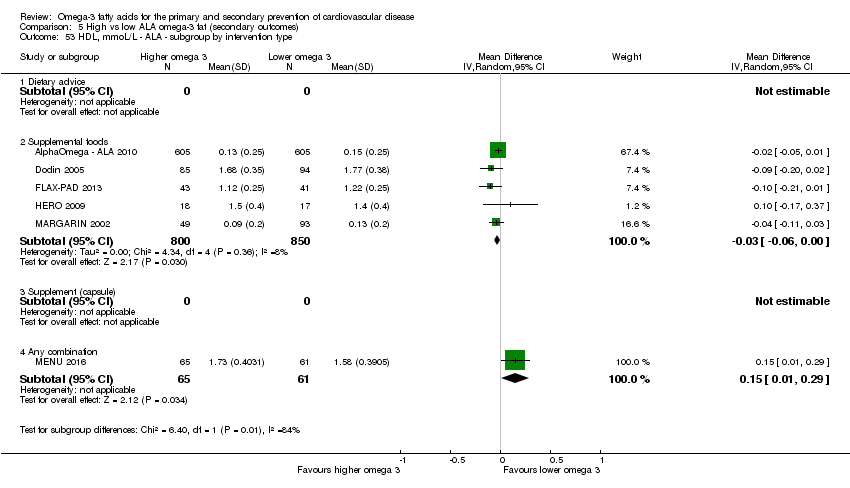
Comparison 5 High vs low ALA omega‐3 fat (secondary outcomes), Outcome 53 HDL, mmoL/L ‐ ALA ‐ subgroup by intervention type.

Comparison 5 High vs low ALA omega‐3 fat (secondary outcomes), Outcome 54 HDL, mmoL/L ‐ ALA ‐ subgroup by replacement.
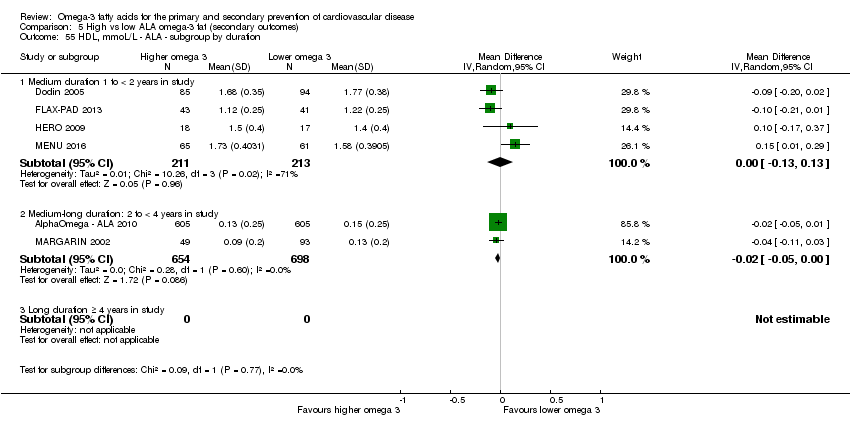
Comparison 5 High vs low ALA omega‐3 fat (secondary outcomes), Outcome 55 HDL, mmoL/L ‐ ALA ‐ subgroup by duration.
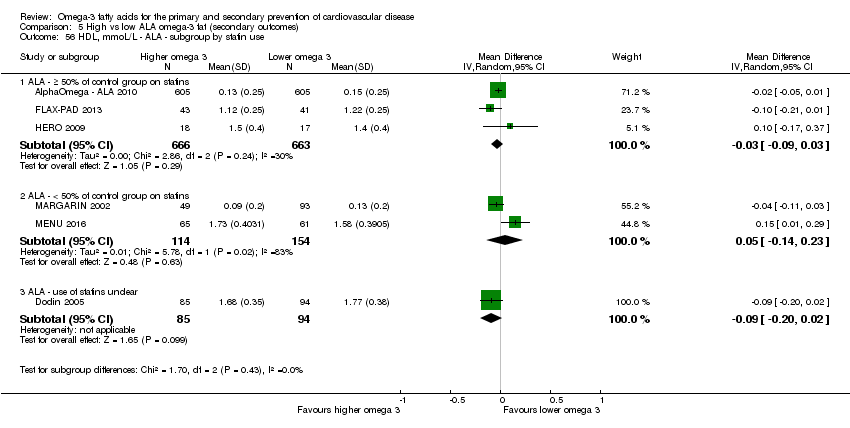
Comparison 5 High vs low ALA omega‐3 fat (secondary outcomes), Outcome 56 HDL, mmoL/L ‐ ALA ‐ subgroup by statin use.
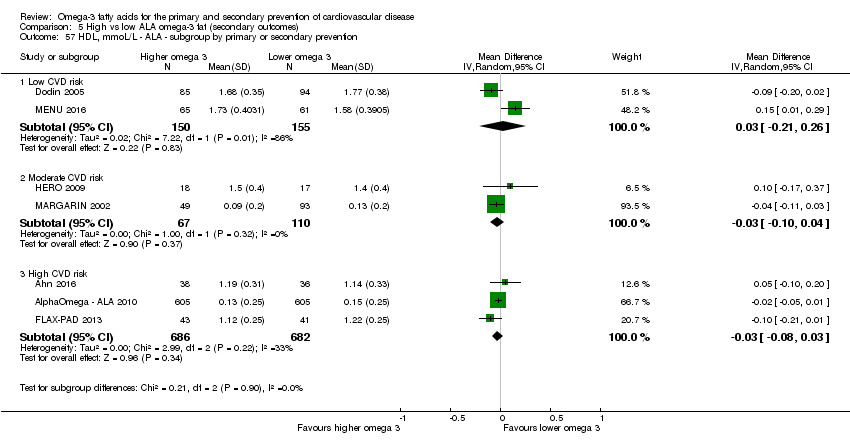
Comparison 5 High vs low ALA omega‐3 fat (secondary outcomes), Outcome 57 HDL, mmoL/L ‐ ALA ‐ subgroup by primary or secondary prevention.

Comparison 5 High vs low ALA omega‐3 fat (secondary outcomes), Outcome 58 Low‐density lipoprotein, serum, mmoL/L ‐ ALA.

Comparison 5 High vs low ALA omega‐3 fat (secondary outcomes), Outcome 59 LDL, mmoL/L ‐ ALA ‐ SA fixed‐effect.
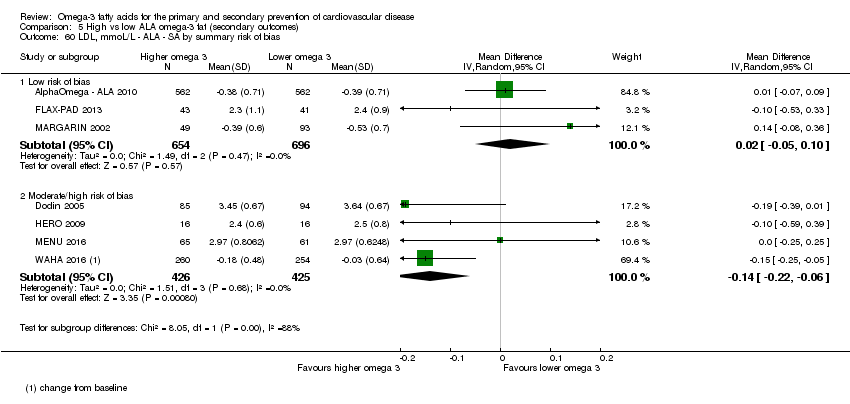
Comparison 5 High vs low ALA omega‐3 fat (secondary outcomes), Outcome 60 LDL, mmoL/L ‐ ALA ‐ SA by summary risk of bias.

Comparison 5 High vs low ALA omega‐3 fat (secondary outcomes), Outcome 61 LDL, mmoL/L ‐ ALA ‐ SA by compliance and study size.

Comparison 5 High vs low ALA omega‐3 fat (secondary outcomes), Outcome 62 LDL, mmoL/L ‐ ALA ‐ subgroup by dose.

Comparison 5 High vs low ALA omega‐3 fat (secondary outcomes), Outcome 63 LDL, mmoL/L ‐ ALA ‐ subgroup by intervention type.
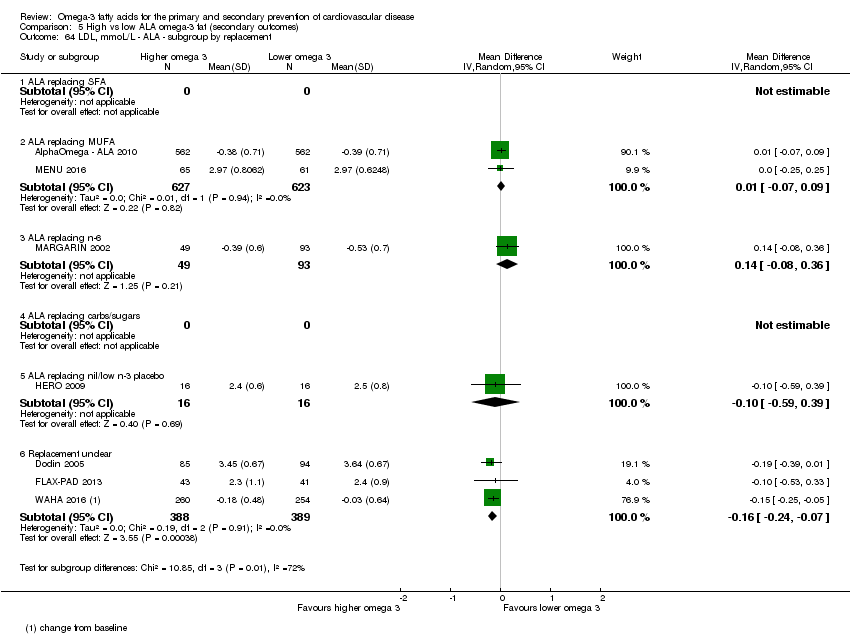
Comparison 5 High vs low ALA omega‐3 fat (secondary outcomes), Outcome 64 LDL, mmoL/L ‐ ALA ‐ subgroup by replacement.

Comparison 5 High vs low ALA omega‐3 fat (secondary outcomes), Outcome 65 LDL, mmoL/L ‐ ALA ‐ subgroup by duration.
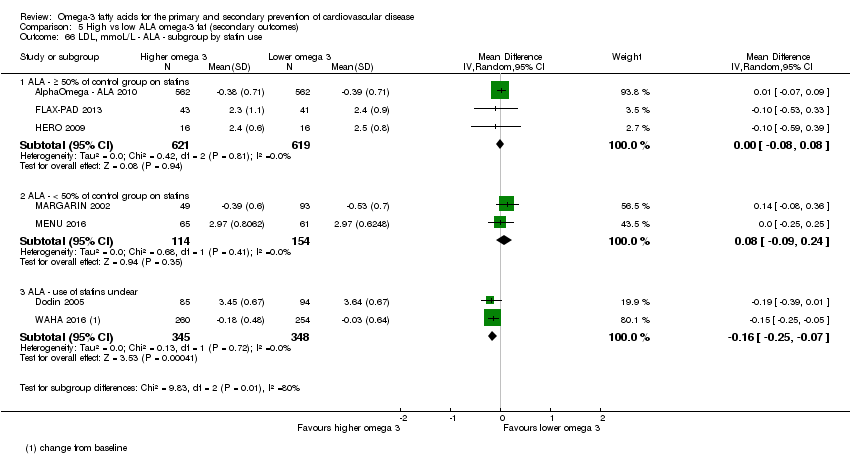
Comparison 5 High vs low ALA omega‐3 fat (secondary outcomes), Outcome 66 LDL, mmoL/L ‐ ALA ‐ subgroup by statin use.

Comparison 5 High vs low ALA omega‐3 fat (secondary outcomes), Outcome 67 LDL, mmoL/L ‐ ALA ‐ subgroup by primary or secondary prevention.
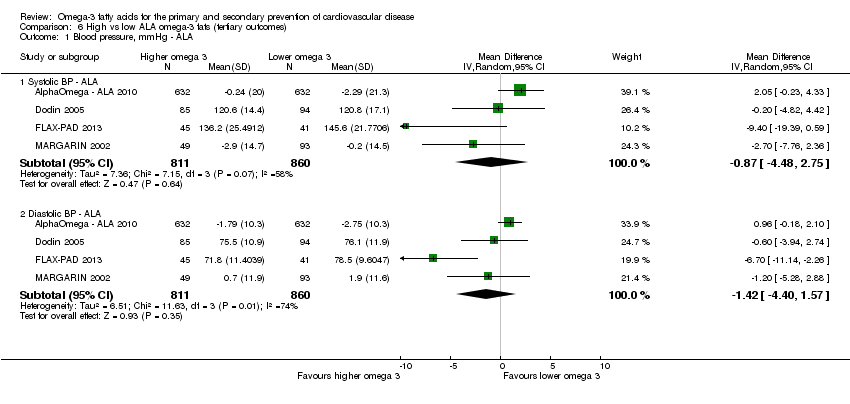
Comparison 6 High vs low ALA omega‐3 fats (tertiary outcomes), Outcome 1 Blood pressure, mmHg ‐ ALA.
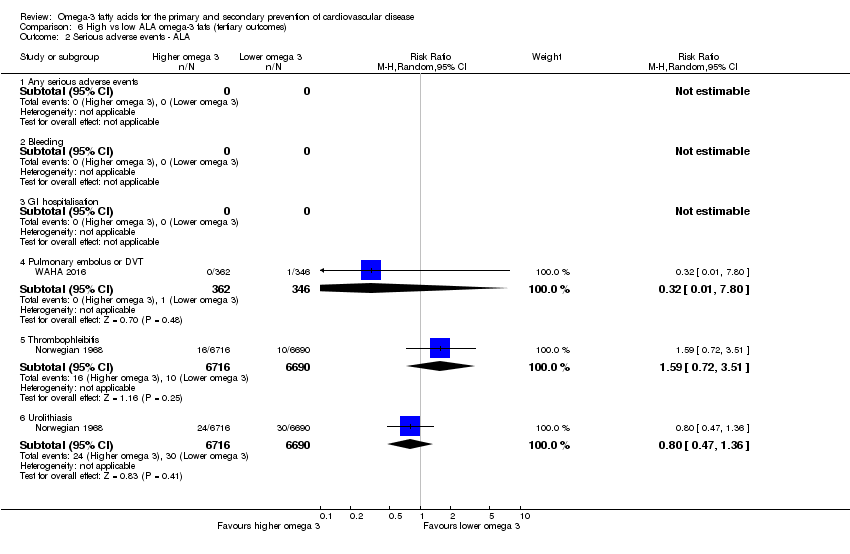
Comparison 6 High vs low ALA omega‐3 fats (tertiary outcomes), Outcome 2 Serious adverse events ‐ ALA.
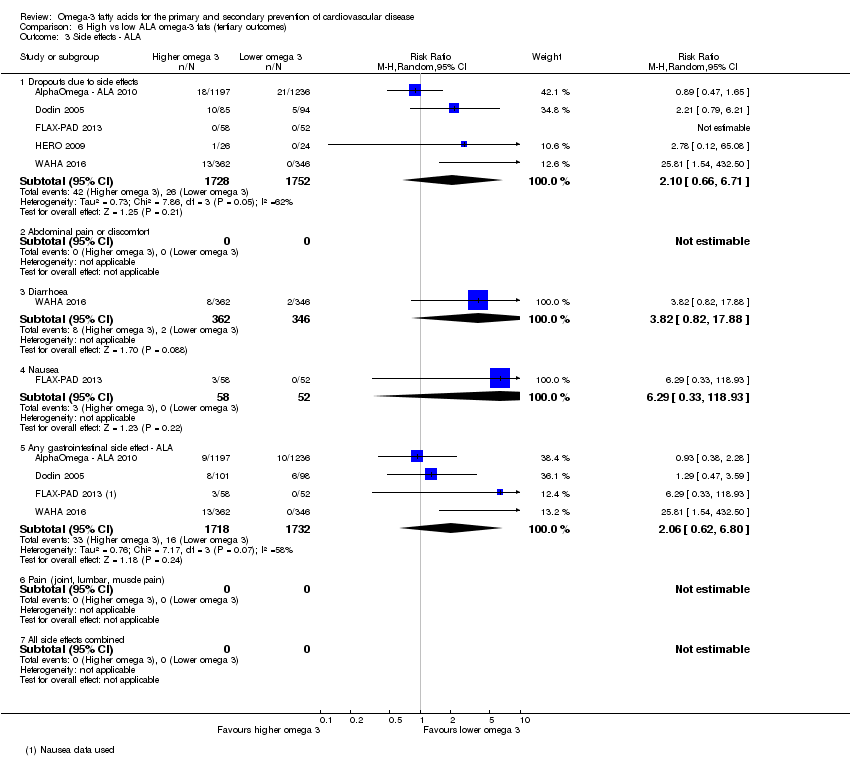
Comparison 6 High vs low ALA omega‐3 fats (tertiary outcomes), Outcome 3 Side effects ‐ ALA.
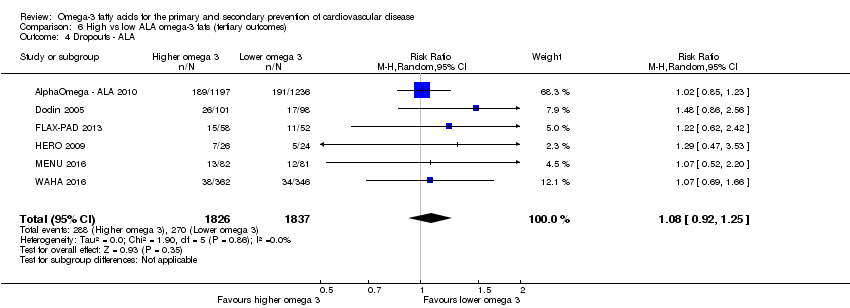
Comparison 6 High vs low ALA omega‐3 fats (tertiary outcomes), Outcome 4 Dropouts ‐ ALA.
| High versus low LCn3 for preventing cardiovascular disease and mortality (primary outcomes) | ||||||
| Patient or population: adults with or without existing CVD The intervention was dietary supplementation, a provided diet or advice on diet. Supplementation may have been in oil or capsule form or as foodstuffs provided, to be consumed by mouth (excluding enteral and parenteral feeds and enemas). The foodstuffs or supplements must have been: oily fish or fish oils as a food, oil, made into a spreading fat or supplementing another food (such as bread or eggs). Refined eicosapentaenoic acid (EPA), docosahexaenoic acid (DHA) or concentrated fish or algal oils, were also accepted. | ||||||
| Outcomes | Anticipated absolute effects* (95% CI) | Relative effect | № of participants | Certainty of the evidence | Comments | |
| Risk with lower LCn3 | Risk with higher LCn3 | |||||
| All‐cause mortality – deaths Duration: range 12 to 72 months | 90 per 1,000 | 88 per 1,000 | RR 0.98 | 92,653 | ⊕⊕⊕⊕ | Meta‐analysis and indications of bias suggest risk reduction of less than 2%. Long‐chain omega‐3 fat intake makes little or no difference to all‐cause mortality. |
| Cardiovascular mortality – cardiovascular deaths Duration: range 12 to 72 months | 69 per 1,000 | 66 per 1,000 | RR 0.95 | 67,772 | ⊕⊕⊕⊝ | Meta‐analysis and indications of bias suggest risk reduction of less than 5%. Long‐chain omega‐3 fat intake probably makes little or no difference to cardiovascular deaths. |
| Cardiovascular events – cardiovascular events Assessed with: number of participants experiencing any cardiovascular event Duration: range 12 to 72 months | 165 per 1,000 | 164 per 1,000 | RR 0.99 | 90,378 | ⊕⊕⊕⊕ | Meta‐analysis and indications of bias suggest risk reduction of less than 1%. Long‐chain omega‐3 fat intake makes little or no difference to risk of cardiovascular events. |
| Coronary heart disease mortality – CHD deaths Duration: range 12 to 72 months | 22 per 1,000 | 21 per 1,000 | RR 0.93 | 73,491 | ⊕⊕⊕⊝ | Meta‐analysis and indications of bias suggest risk reduction of less than 7%. Long‐chain omega‐3 fat intake probably makes little or no difference to coronary heart mortality. |
| Coronary heart disease events – CHD events Duration: range 12 to 72 months | 68 per 1,000 | 63 per 1,000 | RR 0.93 | 84,301 | ⊕⊕⊕⊝ | Meta‐analysis and indications of bias suggest risk reduction of less than 7%. Long‐chain omega‐3 fat intake probably makes little or no difference to risk of coronary heart events. |
| Stroke Assessed with: number of participants experiencing at least one fatal or non‐fatal, ischaemic or haemorrhagic stroke Duration: range 12 to 72 months | 20 per 1,000 | 21 per 1,000 | RR 1.06 | 89,358 | ⊕⊕⊕⊝ | Meta‐analysis and indications of bias suggest increased risk of less than 6%. Long‐chain omega‐3 fat intake probably makes little or no difference to risk of experiencing a stroke. |
| Arrhythmias Assessed with: number of participants experiencing fatal or nonfatal, new or recurrent arrhythmia, including atrial fibrillation, ventricular tachycardia and ventricular fibrillation. Duration: range 12 to 72 months | 68 per 1,000 | 66 per 1,000 | RR 0.97 | 53,796 | ⊕⊕⊕⊝ | Meta‐analysis and indications of bias suggest risk reduction of less than 3%. Long‐chain omega‐3 fat intake probably makes little or no difference to risk of arrhythmia. |
| Harms: bleeding Assessed with: number of participants experiencing bleeding events. Duration: range 12 to 72 months | 8 per 1,000 | 8 per 1,000 | RR 1.06 | 45,562 | ⊕⊝⊝⊝ | The effect of long‐chain omega‐3 fat intake on bleeding is unclear as the evidence is of very low quality. |
| Harms: pulmonary embolus or DVT Assessed with: number of participants experiencing pulmonary embolus or deep vein thrombosis Duration: range 18 to 36 months | 5 per 1,000 | 6 per 1,000 | RR 1.25 | 3,011 | ⊕⊝⊝⊝ | The effect of long‐chain omega‐3 fat intake on pulmonary embolus or DVT is unclear as the evidence is of very low quality. |
| *The risk in the intervention group (and its 95% confidence interval) is based on the assumed risk in the comparison group and the relative effect of the intervention (and its 95% CI). | ||||||
| GRADE Working Group grades of evidence | ||||||
| aAll‐cause mortality, LCn3
bCardiovascular mortality, LCn3
cCardiovascular events, LCn3
dCoronary heart disease mortality, LCn3
eCoronary heart disease events, LCn3
fStroke, LCn3
gArrhythmias, LCn3
hBleeding, LCn3
iPulmonary embolus or DVD, LCn3
| ||||||
| High versus low ALA omega‐3 fats for preventing cardiovascular disease (primary outcomes) | ||||||
| Patient or population: adults with or without existing CVD Setting: participants were living at home for most or all of the duration of their trials. Most studies were carried out in high‐income economies (World Bank 2018), but four trials were carried out in upper‐middle income countries (Argentina, Iran, Turkey and China). No studies took place in low‐ or low‐middle income countries. The intervention was dietary supplementation, a provided diet or advice on diet. Supplementation may have been in oil or capsule form or as foodstuffs provided, to be consumed by mouth (excluding enteral and parenteral feeds and enemas). The foodstuffs or supplements must have been: refined ALA, linseed (flax), canola (rapeseed), perilla, purslane, mustard seed, candlenut, stillingia or walnut as a food, oil, made into a spreading fat or supplementing another food (such as bread or eggs). For ALA sources the product consumed had to have an omega‐3 fat content of at least 10% of the total fat content. | ||||||
| Outcomes | Anticipated absolute effects* (95% CI) | Relative effect | № of participants | Certainty of the evidence | Comments | |
| Risk with lower ALA | Risk with higher ALA | |||||
| All‐cause mortality – deaths Duration: range 12 to 40 months | 25 per 1000 | 25 per 1000 | RR 1.01 | 19327 | ⊕⊕⊕⊝ | Meta‐analysis and sensitivity analyses suggest risk increase of less than 1%. ALA intake probably makes little or no difference to all‐cause mortality. |
| Cardiovascular mortality – cardiovascular deaths Duration: range 12 to 40 months | 12 per 1000 | 12 per 1000 | RR 0.96 | 18619 | ⊕⊕⊕⊝ | Meta‐analysis and sensitivity analyses suggest risk reduction of less than 5%. ALA intake probably makes little or no difference to cardiovascular mortality. |
| Cardiovascular events – cardiovascular events Assessed with: number of participants experiencing any cardiovascular event Duration: range 12 to 40 months | 48 per 1000 | 47 per 1000 | RR 0.95 | 19327 | ⊕⊕⊝⊝ | Meta‐analysis and sensitivity analyses suggest risk reduction of 5% to 10%. ALA intake may reduce the risk of cardiovascular events but by a very small amount (from 4.8 to 4.7%). One thousand people would need to consume more ALA to prevent a single person experiencing a CVD event (NNT=1000). |
| Coronary heart mortality – CHD deaths Duration: range 12 to 40 months | 11 per 1000 | 10 per 1000 | RR 0.95 | 18353 | ⊕⊕⊕⊝ | Meta‐analysis and sensitivity analyses suggest risk reduction of 5% to 8%. ALA intake probably reduces risk of CHD mortality but by a very small amount (from 1.1 to 1.0%). One thousand people would need to consume more ALA to prevent a single person experiencing a CHD death (NNT=1000). |
| Coronary Heart Disease – CHD events Duration: range 12 to 40 months | 22 per 1000 | 22 per 1000 | RR 1.00 | 19061 | ⊕⊕⊝⊝ | Meta‐analysis and sensitivity analyses suggest risk reduction of 0% to 9%. ALA intake may make little or no difference to CHD events. |
| Stroke Assessed with: number of participants experiencing at least one fatal or non‐fatal, ischaemic or haemorrhagic stroke Duration: range 12 to 40 months | 2 per 1000 | 3 per 1000 | RR 1.15 | 19327 | ⊕⊝⊝⊝ | Meta‐analysis and sensitivity analyses suggest risk increase of −15% to 23%. The effect of ALA intake on stroke is unclear as the evidence is of very low quality. |
| Arrhythmias – AF, VT, VF Assessed with: number of participants experiencing fatal or nonfatal, new or recurrent arrhythmia, including atrial fibrillation, ventricular tachycardia and ventricular fibrillation Duration: 1 trial of 40 months | 33 per 1000 | 26 per 1000 | RR 0.79 | 4837 | ⊕⊕⊕⊝ | Meta‐analysis and sensitivity analyses suggest risk reduction of 21%. ALA intake probably reduces the risk of arrhythmias a small amount (from 3.3 to 2.6%). 143 people would need to consume more ALA to prevent a single person experiencing an arrhythmic event (NNT=143). |
| Harms: bleeding Assessed with: number of participants experiencing bleeding events | The effect of ALA intake on bleeding is unclear as no studies reported this outcome. | |||||
| Harms: pulmonary embolus or DVT Assessed with: number of participants experiencing pulmonary embolus or deep vein thrombosis Duration: range 24 months | 3 per 1000 | 1 per 1000 | RR 0.32 | 708 | ⊕⊝⊝⊝ | The effect of ALA intake on pulmonary embolus or DVT is unclear as the evidence is of very low quality. |
| *The risk in the intervention group (and its 95% confidence interval) is based on the assumed risk in the comparison group and the relative effect of the intervention (and its 95% CI). | ||||||
| GRADE Working Group grades of evidence | ||||||
| aAll‐cause mortality, ALA
bCardiovascular mortality, ALA
cCardiovascular events, ALA
dCoronary heart disease mortality, ALA
eCoronary heart disease events, ALA
fStroke, ALA
gArrhythmias, ALA
hPulmonary embolus or DVD, ALA
| ||||||
| High versus low omega‐3 fats for modification of CVD risk factors (adiposity and lipids) | |||||
| Patient or population: adults with or without existing CVD Setting: participants were living at home for most or all of the duration of their trials. Most studies were carried out in high‐income economies (World Bank 2018), but four trials were carried out in upper‐middle income countries. No studies took place in low‐ or low‐middle income countries. Intervention: higher omega‐3 intake (LCn3 or ALA) The intervention was dietary supplementation, a provided diet or advice on diet. Supplementation may have been in oil or capsule form or as foodstuffs provided, to be consumed by mouth (excluding enteral and parenteral feeds and enemas). The foodstuffs or supplements must have been: oily fish; fish oils; linseed (flax), canola (rapeseed), perilla, purslane, mustard seed, candlenut, stillingia or walnut as a food, oil, made into a spreading fat or supplementing another food (such as bread or eggs). For ALA sources the product consumed had to have an omega‐3 fat content of at least 10% of the total fat content. Refined eicosapentaenoic acid (EPA), docosahexaenoic acid (DHA) or alpha‐linolenic acids, or concentrated fish or algal oils, were also accepted. | |||||
| Outcomes All in trials of 12 to 72 months' duration | Anticipated absolute effects* (95% CI) | № of participants | Certainty of the evidence | Comments | |
| Risk with low omega‐3 | Risk with high omega‐3 | ||||
| Measures of adiposity – LCn3 – Weight, kg | Mean body weight was 81.2 kg | MD 0.01 kg lower | 15812 | ⊕⊕⊕⊕ | LCn3 intake makes little or no difference to body weight. |
| Measures of adiposity – LCn3 – BMI, kg/m2 | Mean BMI was 27.3 kg/m2 | MD 0.04 higher | 15234 | ⊕⊕⊕⊕ | LCn3 intake makes little or no difference to BMI. |
| Serum total cholesterol – LCn3 – TC, mmol/L | Mean TC was 5.61 mmol/L | MD 0.01 lower | 37281 | ⊕⊕⊕⊝ | LCn3 intake probably makes little or no difference to serum total cholesterol. |
| Serum triglyceride, fasting – LCn3 – TG, mmol/L | Mean TG was 1.59 mmol/L | MD 0.24 lower | 35534 | ⊕⊕⊕⊕ | Increasing LCn3 intake reduces serum triglyceride. |
| Serum high density lipoprotein – LCn3 – HDL, mmol/L | Mean HDL was 1.32 mmol/L | MD 0.02 higher | 37237 | ⊕⊕⊕⊕ | Increasing LCn3 intake increases serum HDL. |
| Serum low density lipoprotein – LCn3 – LDL, mmol/L | Mean LDL was 3.27 mmol/L | MD 0.01 higher | 35035 | ⊕⊕⊕⊝ | LCn3 intake probably makes little or no difference to serum LDL. |
| Measures of adiposity – ALA – Weight, kg | Mean weight was 80.9 kg | MD 0.17 higher | 664 | ⊕⊝⊝⊝ | The effect of ALA intake on body weight is unclear as the evidence is of very low quality. |
| Measures of adiposity – ALA – BMI, kg/m2 | Mean BMI was 27.4 kg/m2 | MD 0.12 higher | 1581 | ⊕⊕⊝⊝ | ALA intake may make little or no difference to BMI. |
| Serum total cholesterol – ALA – TC, mmol/L | Mean TC was 5.02 mmol/L | MD 0.09 lower | 2164 | ⊕⊕⊝⊝ | ALA intake may make little or no difference to serum total cholesterol (low‐quality/certainty evidence). |
| Serum Triglyceride, fasting – ALA – TG, mmol/L | Mean TG was 1.48 mmol/L | MD 0.03 lower | 1776 | ⊕⊕⊕⊝ | ALA intake probably makes little or no difference to serum triglycerides (moderate‐quality/certainty evidence). |
| Serum high density lipoprotein – ALA – HDL, mmol/L | Mean HDL was 1.49 mmol/L | MD 0.02 lower | 1776 | ⊕⊕⊕⊝ | ALA intake probably reduces serum HDL. |
| Serum low density lipoprotein – ALA – LDL, mmol/L | Mean LDL was 2.88 mmol/L | MD 0.05 lower | 2201 | ⊕⊕⊝⊝ | ALA intake may make little or no difference to serum LDL. |
| *The risk in the intervention group (and its 95% confidence interval) is based on the assumed risk in the comparison group and the relative effect of the intervention (and its 95% CI). | |||||
| GRADE Working Group grades of evidence | |||||
| aMeasures of adiposity, weight, LCn3
bMeasures of adiposity, BMI, LCn3
cLipids, serum total cholesterol, LCn3
dLipids, serum triglycerides, LCn3
eLipids, HDL, LCn3
fLipids, LDL, LCn3
gMeasures of adiposity, weight, ALA
hMeasures of adiposity, BMI, ALA
iLipids, serum total cholesterol, ALA
jLipids, serum triglycerides, ALA
kLipids, HDL, ALA
lLipids, LDL, ALA
| |||||
| Risk of bias element | Criteria for low risk of bias | Criteria for unclear | Criteria for high risk of bias |
| Selection bias: random sequence generation | The study authors needed to have described the method used to generate the allocation sequence in sufficient detail to allow an assessment of whether it should produce comparable groups. For example "the randomisation sequence was computer generated". We allowed that a good method of randomisation was strongly implied if the authors discussed stratification and/or blocking. Therefore, if the authors were not explicit about their randomisation method but did describe stratification or blocking we assessed this as corresponding to low risk. | The study authors have not described their method in sufficient detail for the assessment of whether it would produce comparable groups. For example, the authors state "the trial was randomised" and provide no further information. | The randomisation method was assessed as not truly random, and may not produce comparable groups. |
| Selection bias: allocation concealment | The study authors needed to have described the method used to conceal allocation sequence in sufficient detail to determine whether the allocations could have been foreseen in advance of, or during, enrolment. Good methods included putting allocation codes in opaque sealed envelopes (ideally prepared by someone outside the treatment or assessment teams and sequentially numbered), using a telephone allocation system after the participants had consented to participate or providing a random number that links to a specific set of capsules prepared and distributed centrally or by an arms‐length pharmacist. | The authors gave insufficient detail as to method. | The allocation was known in advance of participants consenting to take part in the study. |
| Performance bias: blinding of participants and personnel | The study authors needed to have described all measures used, if any, to blind study participants and personnel from knowledge of which intervention a participant received. Ideally, they should also have provided information relating to whether the intended blinding was effective. For example, the authors could say "both the intervention and placebo capsules looked and tasted the same." However, if the study authors did not provide information on whether the blinding was effective, but sufficient detail was given on a good method of blinding, then it was assumed that the blinding was effective and the risk of bias was low. | Insufficient methodological details were provided e.g. "the study was blinded." | The study was unblinded or where blinding was broken, e.g. "the capsules were visually identical but the participants reported a strong fishy flavour in the intervention group only." |
| Detection bias: blinding of outcome assessment | Study authors needed to have described measures used, if any, to blind outcome assessors from knowledge of which intervention a participant received. Ideally, they should also have provided information relating to whether the intended blinding was effective. For example, the authors could say "the outcome assessors had no knowledge of the group allocation, and both the intervention and placebo capsules looked and tasted the same so the self‐assessment scales were also blinded." However if the study authors did not provide information on whether the blinding was effective, but sufficient detail was given on a good method of blinding of the assessors, then it was assumed that the blinding was effective and the risk of bias is low. All biochemical assessment (lipids, glucose, CRP, insulin, PSA, etc.) were considered at low risk of detection bias if outcome assessor blinding or double blinding was stated. | Insufficient methodological details were provided e.g. "the study was blinded." | The study was unblinded or blinding was broken, e.g. for a self‐assessment measure "the capsules were visually identical but the participants reported a strong fishy flavour in the intervention group only." Because the level of blinding could vary by outcome assessment of risk of bias was based on blinding of the review's primary outcome(s). Where primary outcomes had different assessments we opted for the higher risk of bias but noted that that risk of bias was lower for other outcomes. |
| Attrition bias: incomplete outcome data | The study authors needed to describe the completeness of outcome data for each main outcome, including attrition and exclusions from the analysis. They needed to report the number of attrition/exclusions, the numbers in each group at each time point, reasons for attrition/exclusion and any re‐inclusions in analyses. Ideally, they would report how they imputed any missing data e.g. last observation carried forward. There needed to be a reasonable balance of attrition/exclusions between study arms and ≤ 20% of the sample should be lost over a year. | The authors didn't state reasons for attrition/exclusion, or were unclear about the numbers lost to attrition/exclusion in each study arm. | The authors demonstrated a substantial difference in the rates of attrition/exclusions between the study arms and/or > 20% of the baseline sample was lost over a year (> 10% over 6 months). |
| Reporting bias: selective outcome reporting | The study authors needed to have published their trial protocol or trials registry entry before the end of the study's recruitment period i.e. prospectively. They needed to have reported on all of the primary and secondary outcomes listed in the protocol/registry entry. Reporting additional secondary outcomes in the results paper(s), although not ideal, was deemed to still be low risk. | No trial protocol or trials registry entry was found, it was registered retrospectively, or the dates of registration and participant recruitment were unclear. | The study authors did not report at least one primary or secondary outcome listed in the protocol/registry entry or the results paper(s) reported a primary outcome that was not listed at all in the protocol or not listed as a primary outcome in the protocol. |
| Other sources of bias: attention bias | The study authors needed to have reported that participants in all study arms received the same amount of attention and time from researchers and clinical teams. For example, "All participants attended the clinic for a baseline assessment which took 2 hours. They were then followed with monthly telephone calls, and finally attended for a 6 month assessment at the clinic which took 1 hour." If the study only differed by the content of the capsules, and the assessment schedule was not stated to differ between the two arms, it was assumed to be at low risk. | The authors did not state the attention each arm received. | Participants in different arms received different amounts of attention. For example "the intervention group only attended for additional assessments at months 2, 4, and 6" or "the rates of relapse differed substantially between the groups which led to differing amounts of treatment time and attention," or "the intervention group received a 40 minute dietary education session." |
| Other sources of bias: limited compliance | The study authors needed to have reported on the level of compliance in all arms in sufficient detail to determine whether the study results were robust. We followed a flow chart to make this determination. A statistically significant difference between the intervention and control groups in a body measure of at least 50% of the text fatty acids. Where no body measures were reported then estimated compliance needed to be greater than 64% (proportion complying multiplied by compliance threshold). | Compliance not reported or not in a way that could be interpreted. | Measures of compliance were reported but fell below the appropriate thresholds. |
| Other sources of bias: other | In the absence of any additional issues this item was coded "low risk of bias" | — | If fraud concerns had been raised and the paper had been withdrawn, or the author had been found guilty of fraud by a legal or medical entity the paper was excluded from the review. However if fraud concerns were raised, but the journal had not withdrawn the paper, and the author had not been formally sanctioned; then the study was included in the review, but concerns were raised here, and the risk of bias for this item was high. |
| CRP: C‐reactive protein; PSA: prostate specific antigen. | |||
| Variable assessed | P value |
| LCn3 dose | 0.61 |
| ALA dose | 0.91 |
| Omega‐6 dose | 0.81 |
| Total PUFA dose | 0.82 |
| Duration, months | 0.68 |
| Primary or secondary CVD prevention | 0.88 |
| Food or capsule | 0.54 |
| Risk of bias | 0.94 |
| Food or capsule + LCn3 dose + duration | 0.70 0.96 0.69 |
| ALA: alpha‐linolenic acid; CVD: cardiovascular disease; LCn3: long‐chain omega‐3 fatty acids; PUFA: poly‐unsaturated fatty acids. aRandom‐effects meta‐regression exploring effects of LCn3 dose, ALA dose, omega‐6 dose, total PUFA dose, study duration, primary or secondary prevention, food or capsule intervention, and summary risk of bias (low or moderate to high) on cardiovascular mortality. We ran the meta‐regression using all included trials that reported this outcome in this review, and its sister reviews (update of Hooper 2018, and Abdelhamid 2018). For each variable the P value presented represents probability that the relationship was due to chance (as we had limited power we assumed a true relationship when P < 0.10). Meta‐regression was of each variable singly, plus a multivariate meta‐regression of the 3 single variables with lowest P values. See methods for further information. | |
| Variable assessed | P value |
| LCn3 dose | 0.91 |
| ALA dose | 0.70 |
| omega‐6 dose | 0.34 |
| Total PUFA dose | 0.34 |
| Duration, months | 0.62 |
| Primary or secondary CVD prevention | 0.78 |
| Food or capsule | 0.83 |
| Risk of bias | 0.24 |
| Risk of bias + PUFA dose + Omega‐6 dose | 0.25 0.87 0.83 |
| ALA: alpha‐linolenic acid; CVD: cardiovascular disease; LCn3: long‐chain omega‐3 fatty acids; PUFA: poly‐unsaturated fatty acids. aRandom‐effects meta‐regression exploring effects of LCn3 dose, ALA dose, omega‐6 dose, total PUFA dose, study duration, primary or secondary prevention, food or capsule intervention, and summary risk of bias (low or moderate to high) on cardiovascular events. We ran the meta‐regression using all included trials that reported this outcome in this review, and its sister reviews (update of Hooper 2018, and Abdelhamid 2018). For each variable the P value presented represents probability that the relationship was due to chance (as we had limited power we assumed a true relationship when P < 0.10). Meta‐regression was of each variable singly, plus a multivariate meta‐regression of the 3 single variables with lowest P values. See methods for further information. | |
| Variable assessed | P value |
| LCn3 dose | 0.94 |
| ALA dose | 0.93 |
| Omega‐6 dose | 0.66 |
| Total PUFA dose | 0.64 |
| Duration, months | 0.41 |
| Primary or secondary CVD prevention | 0.63 |
| Food or capsule | 0.78 |
| Risk of bias | 0.89 |
| Duration + Primary or secondary prevention + PUFA dose | 0.73 0.90 0.76 |
| ALA: alpha‐linolenic acid; CVD: cardiovascular disease; LCn3: long‐chain omega‐3 fatty acids; PUFA: poly‐unsaturated fatty acids. aRandom‐effects meta‐regression exploring effects of LCn3 dose, ALA dose, omega‐6 dose, total PUFA dose, study duration, primary or secondary prevention, food or capsule intervention, and summary risk of bias (low or moderate to high) on CHD mortality. We ran the meta‐regression using all included trials that reported this outcome in this review, and its sister reviews (update of Hooper 2018, and Abdelhamid 2018). For each variable the P value presented represents probability that the relationship was due to chance (as we had limited power we assumed a true relationship when P < 0.10). Meta‐regression was of each variable singly, plus a multivariate meta‐regression of the 3 single variables with lowest P values. See methods for further information. | |
| Variable assessed | P value |
| LCn3 dose | 0.68 |
| ALA dose | 0.23 |
| Omega‐6 dose | 0.84 |
| Total PUFA dose | 0.79 |
| Duration, months | 0.87 |
| Primary or secondary CVD prevention | 0.42 |
| Food or capsule | 0.91 |
| Risk of bias | 0.98 |
| ALA dose + Prim or sec prev + LCn3 dose | 0.32 0.46 0.86 |
| ALA: alpha‐linolenic acid; CVD: cardiovascular disease; LCn3: long‐chain omega‐3 fatty acids; PUFA: poly‐unsaturated fatty acids. aRandom‐effects meta‐regression exploring effects of LCn3 dose, ALA dose, omega‐6 dose, total PUFA dose, study duration, primary or secondary prevention, food or capsule intervention, and summary risk of bias (low or moderate to high) on CHD events. We ran the meta‐regression using all included trials that reported this outcome in this review, and its sister reviews (update of Hooper 2018, and Abdelhamid 2018). For each variable the P value presented represents probability that the relationship was due to chance (as we had limited power we assumed a true relationship when P < 0.10). Meta‐regression was of each variable singly, plus a multivariate meta‐regression of the 3 single variables with lowest P values. See methods for further information. | |
| Variable assessed | P value | Coefficient sign where P < 0.10 |
| LCn3 dose | 0.42 | — |
| ALA dose | 0.81 | — |
| Omega‐6 dose | 0.19 | — |
| Total PUFA dose | 0.21 | — |
| Duration, months | 0.012 | Negative (greater effect with shorter duration) |
| Primary or secondary CVD prevention | 0.04 | Positive (greater effect with secondary prevention) |
| Food or capsule | 0.21 | — |
| Risk of bias | 0.25 | — |
| Duration + primary or secondary prevention + omega‐6 | 0.21 0.67 0.38 | — |
| ALA: alpha‐linolenic acid; CVD: cardiovascular disease; LCn3: long‐chain omega‐3 fatty acids; PUFA: poly‐unsaturated fatty acids. aRandom‐effects meta‐regression exploring effects of LCn3 dose, ALA dose, omega‐6 dose, total PUFA dose, study duration, primary or secondary prevention, food or capsule intervention, and summary risk of bias (low or moderate to high) on stroke. We ran the meta‐regression using all included trials that reported this outcome in this review, and its sister reviews (update of Hooper 2018, and Abdelhamid 2018). For each variable the P value presented represents probability that the relationship was due to chance (as we had limited power we assumed a true relationship when P < 0.10). Meta‐regression was of each variable singly, plus a multivariate meta‐regression of the 3 single variables with lowest P values. See methods for further information. | ||
| Variable assessed | P value | Coefficient sign where P < 0.10 |
| LCn3 dose | 0.06 | Negative (greater effect at lower dose) |
| ALA dose | 0.67 | — |
| Omega‐6 dose | 0.59 | — |
| Total PUFA dose | 0.54 | — |
| Duration, months | 0.16 | — |
| Primary or secondary CVD prevention | 0.07 | Negative (greater effect with primary prevention) |
| Food or capsule | 0.82 | — |
| Risk of bias | 0.51 | — |
| LCn3 dose + Primary secondary prevention + duration | 0.09 0.12 0.46 | — |
| ALA: alpha‐linolenic acid; CVD: cardiovascular disease; LCn3: long‐chain omega‐3 fatty acids; PUFA: poly‐unsaturated fatty acids. aRandom‐effects meta‐regression exploring effects of LCn3 dose, ALA dose, omega‐6 dose, total PUFA dose, study duration, primary or secondary prevention, food or capsule intervention, and summary risk of bias (low or moderate to high) on arrhythmia. We ran the meta‐regression using all included trials that reported this outcome in this review, and its sister reviews (update of Hooper 2018, and Abdelhamid 2018). For each variable the P value presented represents probability that the relationship was due to chance (as we had limited power we assumed a true relationship when P < 0.10). Meta‐regression was of each variable singly, plus a multivariate meta‐regression of the 3 single variables with lowest P values. See methods for further information. | ||
| This review | ||||||
| Number of people experiencing events | RR (95% CI) | Number of people experiencing events | RR (95% CI) | No of people experiencing events | RR (95% CI) | |
| All‐cause mortality | 8480 | 0.97 (0.92 to 1.03) | — | Not assessed | 8647 | 0.98 (0.93 to 1.03) |
| Cardiovascular deaths | 3799 | 0.92 (0.82 to 1.02) | — | Not assessed | 4763 | 0.95 (0.87 to 1.03) |
| CVD events (MACCEs in Balk 2016) | 8085 | 0.96 (0.91 to 1.02) | 12001 | 0.97 (0.93 to 1.01) | 15614 | 0.99 (0.94 to 1.04) |
| CHD deaths | — | Not pooled | 2695 | 0.93, (0.83 to 1.03) | 1791 | 0.93 (0.79 to 1.09) |
| CHD events | — | Not assessed | 6273 | 0.96, (0.90 to 1.01) | 5865 | 0.93 (0.88 to 0.97) |
| Stroke | 1467 | 0.98 (0.88 to 1.09) | 1713 | 1.03 (0.93 to 1.13) | 1871 | 1.06 (0.96, 1.16) |
| Arrhythmia | — | Not pooled | — | Not assessed | 3788 | 0.97 (0.90 to 1.05) |
| CHD: coronary heart disease; CI: confidence interval; CVD: cardiovascular disease; MACCE: major adverse cerebrovascular or cardiovascular event; RR: risk ratio. aMeta‐analysis of effects of LCn3 in Balk 2016 and Aung 2018 systematic reviews, comparing their findings with our findings for our primary outcomes. | ||||||
| Outcome or subgroup title | No. of studies | No. of participants | Statistical method | Effect size |
| 1 All‐cause mortality (overall) ‐ LCn3 Show forest plot | 39 | 92653 | Risk Ratio (M‐H, Random, 95% CI) | 0.98 [0.93, 1.03] |
| 2 All‐cause mortality ‐ LCn3 ‐ sensitivity analysis (SA) fixed‐effect Show forest plot | 39 | 90244 | Risk Ratio (M‐H, Fixed, 95% CI) | 0.97 [0.93, 1.01] |
| 3 All‐cause mortality ‐ LCn3 ‐ SA by summary risk of bias Show forest plot | 39 | 92653 | Risk Ratio (M‐H, Random, 95% CI) | 0.98 [0.93, 1.03] |
| 3.1 Low risk of bias | 15 | 33146 | Risk Ratio (M‐H, Random, 95% CI) | 1.01 [0.94, 1.08] |
| 3.2 Moderate/high risk of bias | 24 | 59507 | Risk Ratio (M‐H, Random, 95% CI) | 0.94 [0.86, 1.03] |
| 4 All‐cause mortality ‐ LCn3 ‐ SA by compliance and study size Show forest plot | 38 | Risk Ratio (M‐H, Random, 95% CI) | Subtotals only | |
| 4.1 SA ‐ low risk of compliance bias | 18 | 15654 | Risk Ratio (M‐H, Random, 95% CI) | 0.99 [0.86, 1.14] |
| 4.2 SA ‐ 100+ randomised | 35 | 92397 | Risk Ratio (M‐H, Random, 95% CI) | 0.98 [0.93, 1.03] |
| 5 All‐cause mortality ‐ LCn3 ‐ subgroup by dose Show forest plot | 39 | 92653 | Risk Ratio (M‐H, Random, 95% CI) | 0.98 [0.93, 1.03] |
| 5.1 LCn3 ≤150 mg/d | 0 | 0 | Risk Ratio (M‐H, Random, 95% CI) | 0.0 [0.0, 0.0] |
| 5.2 LCn3 > 150 ≤ 250 mg/d | 1 | 407 | Risk Ratio (M‐H, Random, 95% CI) | 0.77 [0.27, 2.18] |
| 5.3 LCn3 > 250 ≤400 mg/d | 1 | 2033 | Risk Ratio (M‐H, Random, 95% CI) | 0.72 [0.56, 0.92] |
| 5.4 LCn3 > 400 ≤ 2400 mg/d | 28 | 87445 | Risk Ratio (M‐H, Random, 95% CI) | 0.99 [0.93, 1.05] |
| 5.5 LCn3 > 2.4 ≤ 4.4 g/d | 7 | 2486 | Risk Ratio (M‐H, Random, 95% CI) | 1.06 [0.67, 1.70] |
| 5.6 LCn3 > 4.4 g/d | 2 | 282 | Risk Ratio (M‐H, Random, 95% CI) | 0.33 [0.03, 3.08] |
| 6 All‐cause mortality ‐ LCn3 ‐ subgroup by replacement Show forest plot | 39 | Risk Ratio (M‐H, Random, 95% CI) | Subtotals only | |
| 6.1 LCn3 replacing SFA | 5 | 3279 | Risk Ratio (M‐H, Random, 95% CI) | 0.72 [0.56, 0.92] |
| 6.2 LCn3 replacing MUFA | 15 | 46176 | Risk Ratio (M‐H, Random, 95% CI) | 0.96 [0.90, 1.02] |
| 6.3 LCn3 replacing N‐6 | 9 | 2806 | Risk Ratio (M‐H, Random, 95% CI) | 0.74 [0.51, 1.09] |
| 6.4 LCn3 replacing CHO | 1 | 281 | Risk Ratio (M‐H, Random, 95% CI) | 0.52 [0.05, 5.65] |
| 6.5 LCn3 replacing nil/low n‐3 placebo | 10 | 39601 | Risk Ratio (M‐H, Random, 95% CI) | 0.99 [0.86, 1.14] |
| 6.6 LCn3 replacement unclear | 3 | 3593 | Risk Ratio (M‐H, Random, 95% CI) | 0.91 [0.46, 1.79] |
| 7 All‐cause mortality ‐ LCn3 ‐ subgroup by intervention type Show forest plot | 39 | 92653 | Risk Ratio (M‐H, Random, 95% CI) | 0.98 [0.93, 1.03] |
| 7.1 Dietary advice | 3 | 5554 | Risk Ratio (M‐H, Random, 95% CI) | 0.90 [0.60, 1.35] |
| 7.2 Supplemental foods | 2 | 5039 | Risk Ratio (M‐H, Random, 95% CI) | 1.02 [0.84, 1.24] |
| 7.3 Supplements (capsule) | 33 | 81855 | Risk Ratio (M‐H, Random, 95% CI) | 0.97 [0.92, 1.01] |
| 7.4 Any combination | 1 | 205 | Risk Ratio (M‐H, Random, 95% CI) | 0.65 [0.11, 3.79] |
| 8 All‐cause mortality ‐ LCn3 ‐ subgroup by duration Show forest plot | 39 | 92653 | Risk Ratio (M‐H, Random, 95% CI) | 0.98 [0.93, 1.03] |
| 8.1 Medium duration 1 to < 2 years in study | 18 | 9737 | Risk Ratio (M‐H, Random, 95% CI) | 1.03 [0.82, 1.30] |
| 8.2 Medium‐long duration: 2 to < 4 years in study | 14 | 29234 | Risk Ratio (M‐H, Random, 95% CI) | 0.91 [0.86, 0.96] |
| 8.3 Long duration: ≥ 4 years in study | 7 | 53682 | Risk Ratio (M‐H, Random, 95% CI) | 1.03 [0.98, 1.09] |
| 9 All‐cause mortality ‐ LCn3 ‐ subgroup by primary or secondary prevention Show forest plot | 39 | 92653 | Risk Ratio (M‐H, Random, 95% CI) | 0.98 [0.93, 1.03] |
| 9.1 Primary CVD prevention | 17 | 41202 | Risk Ratio (M‐H, Random, 95% CI) | 1.01 [0.94, 1.08] |
| 9.2 Secondary CVD prevention | 22 | 51451 | Risk Ratio (M‐H, Random, 95% CI) | 0.95 [0.88, 1.04] |
| 10 All‐cause mortality ‐ LCn3 ‐ subgroup by statin use Show forest plot | 39 | 90244 | Risk Ratio (M‐H, Random, 95% CI) | 0.98 [0.92, 1.03] |
| 10.1 LCn3 ‐ ≥50% of control group on statins | 8 | 40500 | Risk Ratio (M‐H, Random, 95% CI) | 1.02 [0.93, 1.11] |
| 10.2 LCn3 ‐ < 50% of control group on statins | 26 | 46604 | Risk Ratio (M‐H, Random, 95% CI) | 0.95 [0.88, 1.03] |
| 10.3 LCn3 ‐ use of statins unclear | 5 | 3140 | Risk Ratio (M‐H, Random, 95% CI) | 0.97 [0.58, 1.63] |
| 11 Cardiovascular mortality (overall) ‐ LCn3 Show forest plot | 25 | 67772 | Risk Ratio (M‐H, Random, 95% CI) | 0.95 [0.87, 1.03] |
| 12 CVD mortality ‐ LCn3 ‐ SA fixed‐effect Show forest plot | 25 | 67772 | Risk Ratio (M‐H, Fixed, 95% CI) | 0.94 [0.89, 1.00] |
| 13 CVD mortality ‐ LCn3 ‐ SA by summary risk of bias Show forest plot | 25 | 67772 | Risk Ratio (M‐H, Random, 95% CI) | 0.95 [0.87, 1.03] |
| 13.1 Low risk of bias | 9 | 29133 | Risk Ratio (M‐H, Random, 95% CI) | 0.99 [0.90, 1.09] |
| 13.2 Moderate/high risk of bias | 16 | 38639 | Risk Ratio (M‐H, Random, 95% CI) | 0.92 [0.80, 1.05] |
| 14 CVD mortality ‐ LCn3 ‐ SA by compliance and study size Show forest plot | 24 | Risk Ratio (M‐H, Random, 95% CI) | Subtotals only | |
| 14.1 SA ‐ low risk of compliance bias | 12 | 13244 | Risk Ratio (M‐H, Random, 95% CI) | 1.00 [0.82, 1.23] |
| 14.2 SA ‐ 100+ randomised | 21 | 67516 | Risk Ratio (M‐H, Random, 95% CI) | 0.95 [0.87, 1.04] |
| 15 CVD mortality ‐ LCn3 ‐ subgroup by dose Show forest plot | 26 | 67873 | Risk Ratio (M‐H, Random, 95% CI) | 0.95 [0.87, 1.03] |
| 15.1 LCn3 ≤ 150 mg/d | 0 | 0 | Risk Ratio (M‐H, Random, 95% CI) | 0.0 [0.0, 0.0] |
| 15.2 LCn3 > 150 ≤ 250 mg/d | 0 | 0 | Risk Ratio (M‐H, Random, 95% CI) | 0.0 [0.0, 0.0] |
| 15.3 LCn3 > 250 ≤ 400 mg/d | 1 | 2033 | Risk Ratio (M‐H, Random, 95% CI) | 0.70 [0.53, 0.91] |
| 15.4 LCn3 > 400 ≤ 2400 mg/d | 19 | 64126 | Risk Ratio (M‐H, Random, 95% CI) | 0.97 [0.89, 1.06] |
| 15.5 LCn3 > 2.4 ≤ 4.4 g/d | 4 | 1432 | Risk Ratio (M‐H, Random, 95% CI) | 1.01 [0.58, 1.77] |
| 15.6 LCn3 > 4.4 g/d | 2 | 282 | Risk Ratio (M‐H, Random, 95% CI) | 0.33 [0.03, 3.08] |
| 16 CVD mortality ‐ LCn3 ‐ subgroup by replacement Show forest plot | 26 | Risk Ratio (M‐H, Random, 95% CI) | Subtotals only | |
| 16.1 N‐3 replacing SFA | 3 | 2537 | Risk Ratio (M‐H, Random, 95% CI) | 0.69 [0.53, 0.90] |
| 16.2 N‐3 replacing MUFA | 12 | 44242 | Risk Ratio (M‐H, Random, 95% CI) | 0.94 [0.86, 1.04] |
| 16.3 N‐3 replacing N‐6 | 4 | 1435 | Risk Ratio (M‐H, Random, 95% CI) | 0.69 [0.41, 1.19] |
| 16.4 N‐3 replacing carbohydrates/sugars | 1 | 281 | Risk Ratio (M‐H, Random, 95% CI) | 0.69 [0.12, 4.07] |
| 16.5 N‐3 replacing nil/low n‐3 placebo | 8 | 19275 | Risk Ratio (M‐H, Random, 95% CI) | 0.84 [0.73, 0.96] |
| 16.6 Replacement unclear | 2 | 3186 | Risk Ratio (M‐H, Random, 95% CI) | 0.54 [0.05, 5.77] |
| 17 CVD mortality ‐ LCn3 ‐ subgroup by intervention type Show forest plot | 25 | 67772 | Risk Ratio (M‐H, Random, 95% CI) | 0.95 [0.87, 1.03] |
| 17.1 Dietary advice | 2 | 5147 | Risk Ratio (M‐H, Random, 95% CI) | 0.95 [0.52, 1.71] |
| 17.2 Supplemental foods | 2 | 5039 | Risk Ratio (M‐H, Random, 95% CI) | 0.98 [0.72, 1.32] |
| 17.3 Supplements (capsule) | 21 | 57586 | Risk Ratio (M‐H, Random, 95% CI) | 0.94 [0.88, 0.99] |
| 17.4 Any combination | 0 | 0 | Risk Ratio (M‐H, Random, 95% CI) | 0.0 [0.0, 0.0] |
| 18 CVD mortality ‐ LCn3 ‐ subgroup by duration Show forest plot | 25 | 67772 | Risk Ratio (M‐H, Random, 95% CI) | 0.95 [0.87, 1.03] |
| 18.1 Medium duration 1 to < 2 years in study | 10 | 6177 | Risk Ratio (M‐H, Random, 95% CI) | 0.88 [0.57, 1.36] |
| 18.2 Medium‐long duration: 2 to < 4 years in study | 10 | 26736 | Risk Ratio (M‐H, Random, 95% CI) | 0.89 [0.82, 0.95] |
| 18.3 Long duration: ≥ 4 years in study | 5 | 34859 | Risk Ratio (M‐H, Random, 95% CI) | 1.05 [0.93, 1.18] |
| 19 CVD mortality ‐ LCn3 ‐ subgroup by primary or secondary prevention Show forest plot | 25 | 67772 | Risk Ratio (M‐H, Random, 95% CI) | 0.95 [0.87, 1.03] |
| 19.1 Primary prevention | 7 | 17931 | Risk Ratio (M‐H, Random, 95% CI) | 0.98 [0.88, 1.09] |
| 19.2 Secondary prevention | 18 | 49841 | Risk Ratio (M‐H, Random, 95% CI) | 0.94 [0.83, 1.06] |
| 20 CVD mortality ‐ LCn3 ‐ subgroup by statin uses Show forest plot | 25 | 67772 | Risk Ratio (M‐H, Random, 95% CI) | 0.95 [0.87, 1.03] |
| 20.1 LCn3 ‐ ≥ 50% of control group on statins | 6 | 23994 | Risk Ratio (M‐H, Random, 95% CI) | 0.99 [0.90, 1.10] |
| 20.2 LCn3 ‐ < 50% of control group on statins | 17 | 43425 | Risk Ratio (M‐H, Random, 95% CI) | 0.92 [0.82, 1.04] |
| 20.3 LCn3‐ Use of statins unclear | 2 | 353 | Risk Ratio (M‐H, Random, 95% CI) | 0.36 [0.06, 2.30] |
| 21 Cardiovascular events (overall) ‐ LCn3 Show forest plot | 38 | 90378 | Risk Ratio (M‐H, Random, 95% CI) | 0.99 [0.94, 1.04] |
| 22 CVD events ‐ LCn3 ‐ SA fixed‐effect Show forest plot | 38 | 90378 | Risk Ratio (M‐H, Fixed, 95% CI) | 0.98 [0.95, 1.00] |
| 23 CVD events ‐ LCn3 ‐ SA by summary risk of bias Show forest plot | 38 | 90378 | Risk Ratio (M‐H, Random, 95% CI) | 0.99 [0.94, 1.04] |
| 23.1 Low risk of bias | 14 | 31649 | Risk Ratio (M‐H, Random, 95% CI) | 1.00 [0.96, 1.05] |
| 23.2 Moderate/high risk of bias | 24 | 58729 | Risk Ratio (M‐H, Random, 95% CI) | 0.95 [0.87, 1.03] |
| 24 CVD events ‐ LCn3 ‐ SA by compliance and study size Show forest plot | 37 | Risk Ratio (M‐H, Random, 95% CI) | Subtotals only | |
| 24.1 SA ‐ low risk of compliance bias | 16 | 13649 | Risk Ratio (M‐H, Random, 95% CI) | 0.98 [0.84, 1.14] |
| 24.2 SA ‐ 100+ randomised | 33 | 90058 | Risk Ratio (M‐H, Random, 95% CI) | 0.99 [0.94, 1.04] |
| 25 CVD events ‐ LCn3 ‐ subgroup by dose Show forest plot | 38 | 90453 | Risk Ratio (M‐H, Random, 95% CI) | 0.99 [0.94, 1.04] |
| 25.1 LCn3 ≤ 150 mg/d | 0 | 0 | Risk Ratio (M‐H, Random, 95% CI) | 0.0 [0.0, 0.0] |
| 25.2 LCn3 > 150 ≤ 250 mg/d | 0 | 0 | Risk Ratio (M‐H, Random, 95% CI) | 0.0 [0.0, 0.0] |
| 25.3 LCn3 > 250 ≤ 400 mg/d | 1 | 2033 | Risk Ratio (M‐H, Random, 95% CI) | 0.96 [0.88, 1.05] |
| 25.4 LCn3 > 400 ≤ 2400 mg/d | 28 | 85818 | Risk Ratio (M‐H, Random, 95% CI) | 0.99 [0.93, 1.05] |
| 25.5 LCn3 > 2.4 ≤ 4.4 g/d | 7 | 2180 | Risk Ratio (M‐H, Random, 95% CI) | 0.98 [0.75, 1.28] |
| 25.6 LCn3 > 4.4 g/d | 3 | 422 | Risk Ratio (M‐H, Random, 95% CI) | 1.09 [0.65, 1.81] |
| 26 CVD events ‐ LCn3 ‐ subgroup by replacement Show forest plot | 38 | Risk Ratio (M‐H, Random, 95% CI) | Subtotals only | |
| 26.1 N‐3 replacing SFA | 4 | 2888 | Risk Ratio (M‐H, Random, 95% CI) | 0.95 [0.87, 1.04] |
| 26.2 N‐3 replacing MUFA | 16 | 45065 | Risk Ratio (M‐H, Random, 95% CI) | 0.98 [0.94, 1.02] |
| 26.3 N‐3 replacing n‐6 | 6 | 1891 | Risk Ratio (M‐H, Random, 95% CI) | 1.10 [0.90, 1.35] |
| 26.4 N‐3 replacing carbohydrates/sugars | 1 | 258 | Risk Ratio (M‐H, Random, 95% CI) | 0.68 [0.12, 3.98] |
| 26.5 N‐3 replacing nil/low n‐3 placebo | 12 | 39907 | Risk Ratio (M‐H, Random, 95% CI) | 0.95 [0.85, 1.07] |
| 26.6 Replacement unclear | 3 | 3429 | Risk Ratio (M‐H, Random, 95% CI) | 0.58 [0.16, 2.07] |
| 27 CVD events ‐ LCn3 ‐ subgroup by intervention type Show forest plot | 38 | 90378 | Risk Ratio (M‐H, Random, 95% CI) | 0.99 [0.94, 1.04] |
| 27.1 Dietary advice | 3 | 5248 | Risk Ratio (M‐H, Random, 95% CI) | 1.13 [0.86, 1.49] |
| 27.2 Supplemental foods | 2 | 5039 | Risk Ratio (M‐H, Random, 95% CI) | 1.02 [0.89, 1.17] |
| 27.3 Supplements (capsule) | 33 | 80091 | Risk Ratio (M‐H, Random, 95% CI) | 0.97 [0.91, 1.02] |
| 27.4 Any combination | 0 | 0 | Risk Ratio (M‐H, Random, 95% CI) | 0.0 [0.0, 0.0] |
| 28 CVD events ‐ LCn3 ‐ subgroup by duration Show forest plot | 38 | 90378 | Risk Ratio (M‐H, Random, 95% CI) | 0.99 [0.94, 1.04] |
| 28.1 Medium duration 1 to < 2 years in study | 18 | 8107 | Risk Ratio (M‐H, Random, 95% CI) | 0.89 [0.68, 1.16] |
| 28.2 Medium‐long duration: 2 to < 4 years in study | 14 | 28767 | Risk Ratio (M‐H, Random, 95% CI) | 0.97 [0.93, 1.01] |
| 28.3 Long duration: ≥ 4 years in study | 6 | 53504 | Risk Ratio (M‐H, Random, 95% CI) | 0.99 [0.91, 1.08] |
| 29 CVD events ‐ LCn3 ‐ subgroup by primary or secondary prevention Show forest plot | 38 | 90378 | Risk Ratio (M‐H, Random, 95% CI) | 0.99 [0.94, 1.04] |
| 29.1 Primary prevention of CVD | 16 | 39751 | Risk Ratio (M‐H, Random, 95% CI) | 0.97 [0.89, 1.05] |
| 29.2 Secondary prevention | 22 | 50627 | Risk Ratio (M‐H, Random, 95% CI) | 1.00 [0.93, 1.07] |
| 30 CVD events ‐ LCn3 ‐ subgroup by statin use Show forest plot | 38 | 90378 | Risk Ratio (M‐H, Random, 95% CI) | 0.99 [0.94, 1.04] |
| 30.1 LCn3 ‐ ≥ 50% of control group on statins | 8 | 42389 | Risk Ratio (M‐H, Random, 95% CI) | 0.98 [0.89, 1.08] |
| 30.2 LCn3 ‐ < 50% of control group on statins | 24 | 45160 | Risk Ratio (M‐H, Random, 95% CI) | 0.98 [0.91, 1.04] |
| 30.3 LCn3 ‐ use of statins unclear | 6 | 2829 | Risk Ratio (M‐H, Random, 95% CI) | 0.93 [0.53, 1.63] |
| 31 Coronary heart disease mortality (overall) ‐ LCn3 Show forest plot | 21 | 73491 | Risk Ratio (M‐H, Random, 95% CI) | 0.93 [0.79, 1.09] |
| 32 CHD mortality ‐ LCn3 ‐ SA fixed‐effect Show forest plot | 21 | 73491 | Risk Ratio (M‐H, Fixed, 95% CI) | 0.94 [0.85, 1.03] |
| 33 CHD mortality ‐ LCn3 ‐ SA by summary risk of bias Show forest plot | 21 | 73491 | Risk Ratio (M‐H, Random, 95% CI) | 0.93 [0.79, 1.09] |
| 33.1 Low risk of bias | 7 | 16372 | Risk Ratio (M‐H, Random, 95% CI) | 1.00 [0.72, 1.37] |
| 33.2 Moderate/high risk of bias | 14 | 57119 | Risk Ratio (M‐H, Random, 95% CI) | 0.91 [0.75, 1.10] |
| 34 CHD mortality ‐ LCn3 ‐ SA by compliance and study size Show forest plot | 21 | Risk Ratio (M‐H, Random, 95% CI) | Subtotals only | |
| 34.1 SA ‐ low risk of compliance bias | 9 | 12938 | Risk Ratio (M‐H, Random, 95% CI) | 1.05 [0.83, 1.32] |
| 34.2 SA ‐ 100+ randomised | 20 | 73411 | Risk Ratio (M‐H, Random, 95% CI) | 0.93 [0.79, 1.09] |
| 35 CHD mortality ‐ LCn3 ‐ SA omitting cardiac death Show forest plot | 16 | 65325 | Risk Ratio (M‐H, Random, 95% CI) | 0.83 [0.74, 0.94] |
| 35.1 Low risk of bias | 5 | 12022 | Risk Ratio (M‐H, Random, 95% CI) | 0.95 [0.69, 1.30] |
| 35.2 Moderate/high risk of bias | 11 | 53303 | Risk Ratio (M‐H, Random, 95% CI) | 0.82 [0.72, 0.94] |
| 36 CHD mortality ‐ LCn3 ‐ subgroup by dose Show forest plot | 21 | 73491 | Risk Ratio (M‐H, Random, 95% CI) | 0.93 [0.79, 1.09] |
| 36.1 LCn3 ≤ 150 mg/d | 0 | 0 | Risk Ratio (M‐H, Random, 95% CI) | 0.0 [0.0, 0.0] |
| 36.2 LCn3 > 150 ≤ 250 mg/d | 0 | 0 | Risk Ratio (M‐H, Random, 95% CI) | 0.0 [0.0, 0.0] |
| 36.3 LCn3 > 250 ≤ 400 mg/d | 2 | 5147 | Risk Ratio (M‐H, Random, 95% CI) | 0.93 [0.50, 1.74] |
| 36.4 LCn3 > 400 ≤ 2400 mg/d | 15 | 67442 | Risk Ratio (M‐H, Random, 95% CI) | 0.92 [0.80, 1.07] |
| 36.5 LCn3 > 2.4 ≤ 4.4 g/d | 3 | 822 | Risk Ratio (M‐H, Random, 95% CI) | 0.93 [0.49, 1.78] |
| 36.6 LCn3 > 4.4 g/d | 1 | 80 | Risk Ratio (M‐H, Random, 95% CI) | 0.32 [0.01, 7.57] |
| 37 CHD mortality ‐ LCn3 ‐ subgroup by replacement Show forest plot | 21 | Risk Ratio (M‐H, Random, 95% CI) | Subtotals only | |
| 37.1 N‐3 replacing SFA | 3 | 2514 | Risk Ratio (M‐H, Random, 95% CI) | 0.67 [0.51, 0.88] |
| 37.2 N‐3 replacing MUFA | 10 | 31605 | Risk Ratio (M‐H, Random, 95% CI) | 0.89 [0.72, 1.10] |
| 37.3 N‐3 replacing n‐6 | 3 | 1409 | Risk Ratio (M‐H, Random, 95% CI) | 0.64 [0.33, 1.24] |
| 37.4 N‐3 replacing carbohydrates/sugars | 1 | 258 | Risk Ratio (M‐H, Random, 95% CI) | 0.34 [0.01, 8.23] |
| 37.5 N‐3 replacing nil/low n‐3 placebo | 7 | 37651 | Risk Ratio (M‐H, Random, 95% CI) | 0.83 [0.70, 0.97] |
| 37.6 Replacement unclear | 1 | 3114 | Risk Ratio (M‐H, Random, 95% CI) | 1.27 [1.03, 1.57] |
| 38 CHD mortality ‐ LCn3 ‐ subgroup by intervention type Show forest plot | 21 | 73491 | Risk Ratio (M‐H, Random, 95% CI) | 0.93 [0.79, 1.09] |
| 38.1 Dietary advice | 2 | 5147 | Risk Ratio (M‐H, Random, 95% CI) | 0.93 [0.50, 1.74] |
| 38.2 Supplemental foods | 1 | 4837 | Risk Ratio (M‐H, Random, 95% CI) | 0.96 [0.69, 1.33] |
| 38.3 Supplements (capsule) | 18 | 63507 | Risk Ratio (M‐H, Random, 95% CI) | 0.90 [0.79, 1.02] |
| 38.4 Any combination | 0 | 0 | Risk Ratio (M‐H, Random, 95% CI) | 0.0 [0.0, 0.0] |
| 39 CHD mortality ‐ LCn3 ‐ subgroup by duration Show forest plot | 21 | 73491 | Risk Ratio (M‐H, Random, 95% CI) | 0.93 [0.79, 1.09] |
| 39.1 Medium duration 1 to < 2 years in study | 7 | 5978 | Risk Ratio (M‐H, Random, 95% CI) | 0.96 [0.62, 1.50] |
| 39.2 Medium‐long duration: 2 to < 4 years in study | 9 | 26545 | Risk Ratio (M‐H, Random, 95% CI) | 0.79 [0.69, 0.90] |
| 39.3 Long duration: ≥ 4 years in study | 5 | 40968 | Risk Ratio (M‐H, Random, 95% CI) | 1.18 [1.00, 1.39] |
| 40 CHD mortality ‐ LCn3 ‐ subgroup by primary or secondary prevention Show forest plot | 21 | 73491 | Risk Ratio (M‐H, Random, 95% CI) | 0.93 [0.79, 1.09] |
| 40.1 Primary prevention of CVD | 5 | 23789 | Risk Ratio (M‐H, Random, 95% CI) | 0.86 [0.46, 1.61] |
| 40.2 Secondary prevention of CVD | 16 | 49702 | Risk Ratio (M‐H, Random, 95% CI) | 0.93 [0.79, 1.11] |
| 41 CHD mortality ‐ LCn3 ‐ subgroup by statin use Show forest plot | 21 | 73491 | Risk Ratio (M‐H, Random, 95% CI) | 0.93 [0.79, 1.09] |
| 41.1 LCn3 ‐ ≥ 50% of control group on statins | 5 | 30025 | Risk Ratio (M‐H, Random, 95% CI) | 1.05 [0.84, 1.30] |
| 41.2 LCn3 ‐ < 50% of control group on statins | 15 | 43208 | Risk Ratio (M‐H, Random, 95% CI) | 0.89 [0.72, 1.10] |
| 41.3 LCn3 ‐ use of statins unclear | 1 | 258 | Risk Ratio (M‐H, Random, 95% CI) | 0.34 [0.01, 8.23] |
| 42 CHD mortality ‐ LCn3 ‐ subgroup by CAD history Show forest plot | 21 | 73491 | Risk Ratio (M‐H, Random, 95% CI) | 0.93 [0.80, 1.09] |
| 42.1 Previous CAD | 11 | 29074 | Risk Ratio (M‐H, Random, 95% CI) | 0.96 [0.77, 1.20] |
| 42.2 No previous CAD | 10 | 44417 | Risk Ratio (M‐H, Random, 95% CI) | 0.93 [0.74, 1.16] |
| 43 Coronary heart disease events (overall) ‐ LCn3 Show forest plot | 28 | 84301 | Risk Ratio (M‐H, Random, 95% CI) | 0.93 [0.88, 0.97] |
| 44 CHD events ‐ LCn3 ‐ SA fixed‐effect Show forest plot | 28 | 84301 | Risk Ratio (M‐H, Fixed, 95% CI) | 0.93 [0.88, 0.97] |
| 45 CHD events ‐ LCn3 ‐ SA by summary risk of bias Show forest plot | 28 | 84301 | Risk Ratio (M‐H, Random, 95% CI) | 0.93 [0.88, 0.97] |
| 45.1 Low risk of bias | 12 | 30227 | Risk Ratio (M‐H, Random, 95% CI) | 0.97 [0.90, 1.05] |
| 45.2 Moderate/high risk of bias | 16 | 54074 | Risk Ratio (M‐H, Random, 95% CI) | 0.89 [0.84, 0.95] |
| 46 CHD events ‐ LCn3 ‐ SA by compliance and study size Show forest plot | 27 | Risk Ratio (M‐H, Random, 95% CI) | Subtotals only | |
| 46.1 SA ‐ low risk of compliance bias | 12 | 13447 | Risk Ratio (M‐H, Random, 95% CI) | 0.94 [0.86, 1.02] |
| 46.2 SA ‐ 100+ randomised | 25 | 84084 | Risk Ratio (M‐H, Random, 95% CI) | 0.93 [0.88, 0.98] |
| 47 CHD events ‐ LCn3 ‐ subgroup by dose Show forest plot | 28 | 84376 | Risk Ratio (M‐H, Random, 95% CI) | 0.93 [0.89, 0.98] |
| 47.1 LCn3 ≤ 150 mg/d | 0 | 0 | Risk Ratio (M‐H, Random, 95% CI) | 0.0 [0.0, 0.0] |
| 47.2 LCn3 > 150 ≤ 250 mg/d | 0 | 0 | Risk Ratio (M‐H, Random, 95% CI) | 0.0 [0.0, 0.0] |
| 47.3 LCn3 > 250 ≤ 400 mg/d | 1 | 2033 | Risk Ratio (M‐H, Random, 95% CI) | 0.92 [0.82, 1.04] |
| 47.4 LCn3 > 400 ≤ 2400 mg/d | 21 | 80730 | Risk Ratio (M‐H, Random, 95% CI) | 0.93 [0.88, 0.98] |
| 47.5 LCn3 > 2.4 ≤ 4.4 g/d | 4 | 1191 | Risk Ratio (M‐H, Random, 95% CI) | 0.90 [0.53, 1.53] |
| 47.6 LCn3 > 4.4 g/d | 3 | 422 | Risk Ratio (M‐H, Random, 95% CI) | 1.00 [0.54, 1.85] |
| 48 CHD events ‐ LCn3 ‐ subgroup by replacement Show forest plot | 28 | Risk Ratio (M‐H, Random, 95% CI) | Subtotals only | |
| 48.1 N‐3 replacing SFA | 3 | 2514 | Risk Ratio (M‐H, Random, 95% CI) | 0.53 [0.16, 1.75] |
| 48.2 N‐3 replacing MUFA | 15 | 44954 | Risk Ratio (M‐H, Random, 95% CI) | 0.96 [0.90, 1.01] |
| 48.3 N‐3 replacing n‐6 | 4 | 1549 | Risk Ratio (M‐H, Random, 95% CI) | 1.10 [0.88, 1.39] |
| 48.4 N‐3 replacing carbohydrates/sugars | 1 | 258 | Risk Ratio (M‐H, Random, 95% CI) | 0.11 [0.01, 2.07] |
| 48.5 N‐3 replacing nil/low n‐3 placebo | 8 | 37843 | Risk Ratio (M‐H, Random, 95% CI) | 0.85 [0.78, 0.94] |
| 48.6 Replacement unclear | 1 | 243 | Risk Ratio (M‐H, Random, 95% CI) | 0.89 [0.08, 9.70] |
| 49 CHD events ‐ LCn3 ‐ subgroup by intervention type Show forest plot | 28 | 84301 | Risk Ratio (M‐H, Random, 95% CI) | 0.93 [0.89, 0.98] |
| 49.1 Dietary advice | 2 | 2134 | Risk Ratio (M‐H, Random, 95% CI) | 1.01 [0.67, 1.52] |
| 49.2 Supplemental foods | 2 | 5039 | Risk Ratio (M‐H, Random, 95% CI) | 0.94 [0.75, 1.18] |
| 49.3 Supplements (capsule) | 24 | 77128 | Risk Ratio (M‐H, Random, 95% CI) | 0.93 [0.88, 0.98] |
| 49.4 Any combination | 0 | 0 | Risk Ratio (M‐H, Random, 95% CI) | 0.0 [0.0, 0.0] |
| 50 CHD events ‐ LCn3 ‐ subgroup by duration Show forest plot | 28 | 84301 | Risk Ratio (M‐H, Random, 95% CI) | 0.93 [0.89, 0.98] |
| 50.1 Medium duration 1 to < 2 years in study | 11 | 7009 | Risk Ratio (M‐H, Random, 95% CI) | 0.94 [0.86, 1.03] |
| 50.2 Medium‐long duration: 2 to < 4 years in study | 12 | 26902 | Risk Ratio (M‐H, Random, 95% CI) | 0.91 [0.84, 0.98] |
| 50.3 Long duration: ≥ 4 years in study | 5 | 50390 | Risk Ratio (M‐H, Random, 95% CI) | 0.95 [0.83, 1.07] |
| 51 CHD events ‐ LCn3 ‐ subgroup by primary or secondary prevention Show forest plot | 28 | 84301 | Risk Ratio (M‐H, Random, 95% CI) | 0.93 [0.89, 0.98] |
| 51.1 Primary prevention of CVD | 11 | 37365 | Risk Ratio (M‐H, Random, 95% CI) | 0.94 [0.81, 1.10] |
| 51.2 Secondary prevention of CVD | 17 | 46936 | Risk Ratio (M‐H, Random, 95% CI) | 0.93 [0.88, 0.98] |
| 52 CHD events ‐ LCn3 ‐ subgroup by statin use Show forest plot | 28 | 84301 | Risk Ratio (M‐H, Random, 95% CI) | 0.93 [0.89, 0.98] |
| 52.1 LCn3 ‐ ≥ 50% of control group on statins | 8 | 42735 | Risk Ratio (M‐H, Random, 95% CI) | 0.94 [0.85, 1.05] |
| 52.2 LCn3 ‐ < 50% of control group on statins | 17 | 40674 | Risk Ratio (M‐H, Random, 95% CI) | 0.92 [0.86, 0.98] |
| 52.3 LCn3 ‐ use of statins unclear | 3 | 892 | Risk Ratio (M‐H, Random, 95% CI) | 0.65 [0.11, 3.83] |
| 53 CHD events ‐ LCn3 subgroup by CAD history Show forest plot | 28 | 84301 | Risk Ratio (M‐H, Random, 95% CI) | 0.93 [0.88, 0.97] |
| 53.1 Previous CAD | 12 | 26124 | Risk Ratio (M‐H, Random, 95% CI) | 0.92 [0.87, 0.98] |
| 53.2 No previous CAD | 16 | 58177 | Risk Ratio (M‐H, Random, 95% CI) | 0.94 [0.86, 1.01] |
| 54 Stroke (overall) ‐ LCn3 Show forest plot | 28 | 89358 | Risk Ratio (M‐H, Random, 95% CI) | 1.06 [0.96, 1.16] |
| 55 Stroke ‐ LCn3 ‐ SA fixed‐effect Show forest plot | 28 | 89358 | Risk Ratio (M‐H, Fixed, 95% CI) | 1.06 [0.97, 1.16] |
| 56 Stroke ‐ LCn3 ‐ SA by summary risk of bias Show forest plot | 28 | 89358 | Risk Ratio (M‐H, Random, 95% CI) | 1.06 [0.96, 1.16] |
| 56.1 Low risk of bias | 12 | 32039 | Risk Ratio (M‐H, Random, 95% CI) | 0.98 [0.86, 1.12] |
| 56.2 Moderate/high risk of bias | 16 | 57319 | Risk Ratio (M‐H, Random, 95% CI) | 1.13 [1.00, 1.29] |
| 57 Stroke ‐ LCn3 ‐ SA by compliance and study size Show forest plot | 27 | Risk Ratio (M‐H, Random, 95% CI) | Subtotals only | |
| 57.1 SA ‐ low risk of compliance bias | 12 | 14451 | Risk Ratio (M‐H, Random, 95% CI) | 1.19 [0.86, 1.65] |
| 57.2 SA ‐ 100+ randomised | 26 | 89231 | Risk Ratio (M‐H, Random, 95% CI) | 1.07 [0.97, 1.18] |
| 58 Stroke ‐ LCn3 ‐ subgroup by stroke type Show forest plot | 13 | Risk Ratio (M‐H, Random, 95% CI) | Subtotals only | |
| 58.1 Ischaemic stroke ‐ LCn3 | 8 | 35040 | Risk Ratio (M‐H, Random, 95% CI) | 1.09 [0.89, 1.33] |
| 58.2 Haemorrhagic stroke ‐ LCn3 | 8 | 36645 | Risk Ratio (M‐H, Random, 95% CI) | 1.20 [0.85, 1.69] |
| 58.3 Transient ischaemic attack (TIA) | 5 | 5032 | Risk Ratio (M‐H, Random, 95% CI) | 0.74 [0.39, 1.39] |
| 59 Stroke ‐ LCn3 ‐ subgroup by dose Show forest plot | 28 | Risk Ratio (M‐H, Random, 95% CI) | Subtotals only | |
| 59.1 LCn3 ≤ 150 mg/d | 0 | 0 | Risk Ratio (M‐H, Random, 95% CI) | 0.0 [0.0, 0.0] |
| 59.2 LCn3 > 150 ≤ 250 mg/d | 0 | 0 | Risk Ratio (M‐H, Random, 95% CI) | 0.0 [0.0, 0.0] |
| 59.3 LCn3 > 250 ≤ 400 mg/d | 1 | 2033 | Risk Ratio (M‐H, Random, 95% CI) | 0.45 [0.14, 1.44] |
| 59.4 LCn3 > 400 ≤ 2400 mg/d | 24 | 86335 | Risk Ratio (M‐H, Random, 95% CI) | 1.06 [0.97, 1.16] |
| 59.5 LCn3 > 2.4 ≤ 4.4 g/d | 1 | 610 | Risk Ratio (M‐H, Random, 95% CI) | 0.69 [0.16, 3.07] |
| 59.6 LCn3 > 4.4 g/d | 2 | 380 | Risk Ratio (M‐H, Random, 95% CI) | 6.58 [0.78, 55.16] |
| 60 Stroke ‐ LCn3 ‐ subgroup by replacement Show forest plot | 28 | Risk Ratio (M‐H, Random, 95% CI) | Subtotals only | |
| 60.1 N‐3 replacing SFA | 3 | 2514 | Risk Ratio (M‐H, Random, 95% CI) | 0.53 [0.19, 1.50] |
| 60.2 N‐3 replacing MUFA | 14 | 45252 | Risk Ratio (M‐H, Random, 95% CI) | 1.11 [0.94, 1.31] |
| 60.3 N‐3 replacing n‐6 | 3 | 1179 | Risk Ratio (M‐H, Random, 95% CI) | 2.08 [0.18, 24.31] |
| 60.4 N‐3 replacing carbohydrates/sugars | 1 | 258 | Risk Ratio (M‐H, Random, 95% CI) | 0.34 [0.01, 8.23] |
| 60.5 N‐3 replacing nil/low n‐3 placebo | 9 | 39555 | Risk Ratio (M‐H, Random, 95% CI) | 1.07 [0.92, 1.24] |
| 60.6 Replacement unclear | 1 | 3114 | Risk Ratio (M‐H, Random, 95% CI) | 1.12 [0.55, 2.29] |
| 61 Stroke ‐ LCn3 ‐ subgroup by intervention type Show forest plot | 28 | 89358 | Risk Ratio (M‐H, Random, 95% CI) | 1.06 [0.96, 1.16] |
| 61.1 Dietary advice | 3 | 5248 | Risk Ratio (M‐H, Random, 95% CI) | 0.93 [0.42, 2.05] |
| 61.2 Supplemental foods | 1 | 4837 | Risk Ratio (M‐H, Random, 95% CI) | 1.11 [0.47, 2.62] |
| 61.3 Supplements (capsule) | 24 | 79273 | Risk Ratio (M‐H, Random, 95% CI) | 1.07 [0.97, 1.18] |
| 61.4 Any combination | 0 | 0 | Risk Ratio (M‐H, Random, 95% CI) | 0.0 [0.0, 0.0] |
| 62 Stroke ‐ LCn3 ‐ subgroup by duration Show forest plot | 28 | 89358 | Risk Ratio (M‐H, Random, 95% CI) | 1.06 [0.96, 1.16] |
| 62.1 Medium duration 1 to < 2 years in study | 11 | 7467 | Risk Ratio (M‐H, Random, 95% CI) | 1.35 [0.86, 2.12] |
| 62.2 Medium‐long duration: 2 to < 4 years in study | 11 | 28387 | Risk Ratio (M‐H, Random, 95% CI) | 1.15 [0.93, 1.41] |
| 62.3 Long duration: ≥ 4 years in study | 6 | 53504 | Risk Ratio (M‐H, Random, 95% CI) | 1.01 [0.91, 1.13] |
| 63 Stroke ‐ LCn3 ‐ subgroup by primary or secondary prevention Show forest plot | 28 | 89358 | Risk Ratio (M‐H, Random, 95% CI) | 1.06 [0.96, 1.16] |
| 63.1 Primary prevention of CVD | 9 | 39332 | Risk Ratio (M‐H, Random, 95% CI) | 0.97 [0.86, 1.09] |
| 63.2 Secondary prevention of CVD | 19 | 50026 | Risk Ratio (M‐H, Random, 95% CI) | 1.21 [1.05, 1.40] |
| 64 Stroke ‐ LCn3 ‐ subgroup by statin use Show forest plot | 28 | 89358 | Risk Ratio (M‐H, Random, 95% CI) | 1.06 [0.96, 1.16] |
| 64.1 LCn3 ‐ ≥ 50% of control group on statins | 8 | 42962 | Risk Ratio (M‐H, Random, 95% CI) | 1.03 [0.86, 1.23] |
| 64.2 LCn3 ‐ < 50% of control group on statins | 17 | 44999 | Risk Ratio (M‐H, Random, 95% CI) | 1.18 [1.02, 1.37] |
| 64.3 LCn3 ‐ use of statins unclear | 3 | 1397 | Risk Ratio (M‐H, Random, 95% CI) | 0.94 [0.38, 2.34] |
| 65 Arrythmia (overall) ‐ LCn3 Show forest plot | 27 | 53796 | Risk Ratio (M‐H, Random, 95% CI) | 0.97 [0.90, 1.05] |
| 66 Arrhythmia‐ LCn3 ‐ SA fixed‐effect Show forest plot | 27 | 53796 | Risk Ratio (M‐H, Fixed, 95% CI) | 1.01 [0.96, 1.07] |
| 67 Arrhythmia‐ LCn3 ‐ SA by summary risk of bias Show forest plot | 27 | 53796 | Risk Ratio (M‐H, Random, 95% CI) | 0.97 [0.90, 1.05] |
| 67.1 Low risk of bias | 10 | 25801 | Risk Ratio (M‐H, Random, 95% CI) | 1.10 [0.98, 1.23] |
| 67.2 Moderate/high risk of bias | 17 | 27995 | Risk Ratio (M‐H, Random, 95% CI) | 0.93 [0.84, 1.02] |
| 68 Arrhythmia‐ LCn3 ‐ SA by compliance and study size Show forest plot | 26 | Risk Ratio (M‐H, Random, 95% CI) | Subtotals only | |
| 68.1 SA ‐ low risk of compliance bias | 10 | 12914 | Risk Ratio (M‐H, Random, 95% CI) | 0.97 [0.86, 1.09] |
| 68.2 SA ‐ 100+ randomised | 26 | 53749 | Risk Ratio (M‐H, Random, 95% CI) | 0.97 [0.89, 1.05] |
| 69 Arrhythmia ‐ LCn3 ‐ subgroup by new or recurrent Show forest plot | 27 | Risk Ratio (M‐H, Random, 95% CI) | Subtotals only | |
| 69.1 New arrhythmia | 16 | 50175 | Risk Ratio (M‐H, Random, 95% CI) | 1.07 [0.99, 1.16] |
| 69.2 Recurrent arrhythmia | 12 | 4425 | Risk Ratio (M‐H, Random, 95% CI) | 0.93 [0.84, 1.03] |
| 70 Arrhythmia ‐ LCn3 ‐ subgroup by fatality Show forest plot | 17 | Risk Ratio (M‐H, Random, 95% CI) | Subtotals only | |
| 70.1 Fatal arrhythmias ‐ LCn3 | 2 | 12938 | Risk Ratio (M‐H, Random, 95% CI) | 1.11 [0.95, 1.31] |
| 70.2 Non‐fatal arrhythmias ‐ LCn3 | 8 | 2079 | Risk Ratio (M‐H, Random, 95% CI) | 0.74 [0.57, 0.96] |
| 70.3 Fatal and non‐fatal arrhythmias combined ‐ LCn3 | 10 | 36007 | Risk Ratio (M‐H, Random, 95% CI) | 1.06 [0.97, 1.17] |
| 71 Arrhythmia ‐ LCn3 ‐ subgroup by dose Show forest plot | 27 | 53796 | Risk Ratio (M‐H, Random, 95% CI) | 0.97 [0.89, 1.04] |
| 71.1 LCn3 ≤ 150 mg/d | 0 | 0 | Risk Ratio (M‐H, Random, 95% CI) | 0.0 [0.0, 0.0] |
| 71.2 LCn3 > 150 ≤ 250 mg/d | 1 | 407 | Risk Ratio (M‐H, Random, 95% CI) | 1.01 [0.90, 1.12] |
| 71.3 LCn3 > 250 ≤ 400 mg/d | 0 | 0 | Risk Ratio (M‐H, Random, 95% CI) | 0.0 [0.0, 0.0] |
| 71.4 LCn3 > 400 ≤ 2400 mg/d | 19 | 51535 | Risk Ratio (M‐H, Random, 95% CI) | 0.98 [0.88, 1.08] |
| 71.5 LCn3 > 2.4 ≤ 4.4 g/d | 3 | 1076 | Risk Ratio (M‐H, Random, 95% CI) | 0.72 [0.55, 0.94] |
| 71.6 LCn3 > 4.4 g/d | 2 | 342 | Risk Ratio (M‐H, Random, 95% CI) | 1.10 [0.32, 3.83] |
| 71.7 Unclear LCn3 dose | 2 | 436 | Risk Ratio (M‐H, Random, 95% CI) | 0.99 [0.76, 1.28] |
| 72 Arrhythmia ‐ LCn3 ‐ subgroup by replacement Show forest plot | 27 | Risk Ratio (M‐H, Random, 95% CI) | Subtotals only | |
| 72.1 N‐3 replacing SFA | 2 | 632 | Risk Ratio (M‐H, Random, 95% CI) | 0.74 [0.10, 5.67] |
| 72.2 N‐3 replacing MUFA | 12 | 42246 | Risk Ratio (M‐H, Random, 95% CI) | 0.99 [0.88, 1.11] |
| 72.3 N‐3 replacing n‐6 | 4 | 1302 | Risk Ratio (M‐H, Random, 95% CI) | 1.00 [0.86, 1.16] |
| 72.4 N‐3 replacing carbohydrates/sugars | 1 | 258 | Risk Ratio (M‐H, Random, 95% CI) | 0.34 [0.04, 3.21] |
| 72.5 N‐3 replacing nil/low n‐3 placebo | 6 | 8983 | Risk Ratio (M‐H, Random, 95% CI) | 0.80 [0.69, 0.91] |
| 72.6 Replacement unclear | 4 | 1179 | Risk Ratio (M‐H, Random, 95% CI) | 0.99 [0.91, 1.08] |
| 73 Arrhythmia ‐ LCn3 ‐ subgroup by intervention type Show forest plot | 27 | 53796 | Risk Ratio (M‐H, Random, 95% CI) | 0.97 [0.90, 1.05] |
| 73.1 Dietary advice | 2 | 508 | Risk Ratio (M‐H, Random, 95% CI) | 0.87 [0.44, 1.72] |
| 73.2 Supplemental foods | 2 | 5039 | Risk Ratio (M‐H, Random, 95% CI) | 0.92 [0.67, 1.26] |
| 73.3 Supplements (capsule) | 23 | 48249 | Risk Ratio (M‐H, Random, 95% CI) | 0.97 [0.88, 1.06] |
| 73.4 Any combination | 0 | 0 | Risk Ratio (M‐H, Random, 95% CI) | 0.0 [0.0, 0.0] |
| 74 Arrhythmia ‐ LCn3 ‐ subgroup by duration Show forest plot | 27 | 53796 | Risk Ratio (M‐H, Random, 95% CI) | 0.97 [0.89, 1.04] |
| 74.1 Medium duration 1 to < 2 years in study | 17 | 8553 | Risk Ratio (M‐H, Random, 95% CI) | 0.93 [0.84, 1.04] |
| 74.2 Medium‐long duration: 2 to < 4 years in study | 7 | 17701 | Risk Ratio (M‐H, Random, 95% CI) | 0.96 [0.84, 1.10] |
| 74.3 Long duration: ≥ 4 years in study | 3 | 27542 | Risk Ratio (M‐H, Random, 95% CI) | 1.13 [0.99, 1.29] |
| 75 Arrhythmia ‐ LCn3 ‐ subgroup by primary or secondary prevention3 Show forest plot | 27 | Risk Ratio (M‐H, Random, 95% CI) | Subtotals only | |
| 75.1 Primary prevention | 8 | 14565 | Risk Ratio (M‐H, Random, 95% CI) | 1.11 [0.97, 1.28] |
| 75.2 Secondary prevention | 19 | 39231 | Risk Ratio (M‐H, Random, 95% CI) | 0.95 [0.86, 1.03] |
| 76 Arrhythmia ‐ LCn3 ‐ subgroup by statin use Show forest plot | 27 | Risk Ratio (M‐H, Random, 95% CI) | Subtotals only | |
| 76.1 LCn3 ‐ ≥ 50% of control group on statins | 5 | 23779 | Risk Ratio (M‐H, Random, 95% CI) | 1.07 [0.95, 1.22] |
| 76.2 LCn3 ‐ < 50% of control group on statins | 18 | 28932 | Risk Ratio (M‐H, Random, 95% CI) | 0.94 [0.85, 1.04] |
| 76.3 LCn3 ‐ use of statins unclear | 4 | 1085 | Risk Ratio (M‐H, Random, 95% CI) | 0.97 [0.80, 1.18] |
| Outcome or subgroup title | No. of studies | No. of participants | Statistical method | Effect size |
| 1 MACCEs ‐ LCn3 Show forest plot | 5 | 34730 | Risk Ratio (M‐H, Random, 95% CI) | 1.03 [0.97, 1.09] |
| 2 Myocardial infarction (overall) ‐ LCn3 Show forest plot | 23 | 72159 | Risk Ratio (M‐H, Random, 95% CI) | 0.95 [0.88, 1.03] |
| 3 Total MI ‐ sensitivity analysis (SA) by summary risk of bias Show forest plot | 23 | 72159 | Risk Ratio (M‐H, Random, 95% CI) | 0.95 [0.88, 1.03] |
| 3.1 Low summary risk of bias | 11 | 30025 | Risk Ratio (M‐H, Random, 95% CI) | 1.03 [0.92, 1.15] |
| 3.2 Moderate to high risk of bias | 12 | 42134 | Risk Ratio (M‐H, Random, 95% CI) | 0.88 [0.79, 0.99] |
| 4 Total MI ‐ LCn3 ‐ SA by compliance and study size Show forest plot | 23 | Risk Ratio (M‐H, Random, 95% CI) | Subtotals only | |
| 4.1 SA ‐ low risk of compliance bias | 10 | 13002 | Risk Ratio (M‐H, Random, 95% CI) | 0.94 [0.79, 1.13] |
| 4.2 SA ‐ 100+ randomised | 21 | 72015 | Risk Ratio (M‐H, Random, 95% CI) | 0.95 [0.88, 1.03] |
| 5 Total MI ‐ LCn3 ‐ subgroup by fatality Show forest plot | 23 | Risk Ratio (M‐H, Random, 95% CI) | Subtotals only | |
| 5.1 Fatal MI | 15 | 60471 | Risk Ratio (M‐H, Random, 95% CI) | 0.76 [0.53, 1.10] |
| 5.2 Non‐fatal MI | 21 | 70407 | Risk Ratio (M‐H, Random, 95% CI) | 0.96 [0.87, 1.06] |
| 6 Sudden cardiac death (overall) ‐ LCn3 Show forest plot | 14 | 65004 | Risk Ratio (M‐H, Random, 95% CI) | 0.97 [0.80, 1.18] |
| 7 Angina ‐ LCn3 Show forest plot | 11 | 39907 | Risk Ratio (M‐H, Random, 95% CI) | 0.99 [0.91, 1.06] |
| 8 Heart failure ‐ LCn3 Show forest plot | 15 | 49644 | Risk Ratio (M‐H, Random, 95% CI) | 0.93 [0.85, 1.03] |
| 8.1 Low summary risk of bias | 6 | 24176 | Risk Ratio (M‐H, Random, 95% CI) | 0.97 [0.89, 1.06] |
| 8.2 Moderate to high risk of bias | 9 | 25468 | Risk Ratio (M‐H, Random, 95% CI) | 0.78 [0.57, 1.08] |
| 9 Revascularisation ‐ LCn3 Show forest plot | 15 | Risk Ratio (M‐H, Random, 95% CI) | Subtotals only | |
| 9.1 CABG ‐ LCn3 | 5 | 1535 | Risk Ratio (M‐H, Random, 95% CI) | 0.56 [0.15, 2.14] |
| 9.2 Angioplasty ‐ LCn3 | 4 | 3195 | Risk Ratio (M‐H, Random, 95% CI) | 0.96 [0.74, 1.24] |
| 9.3 Any revascularisation ‐ LCn3 | 12 | 66095 | Risk Ratio (M‐H, Random, 95% CI) | 0.98 [0.94, 1.03] |
| 10 Peripheral arterial disease ‐ LCn3 Show forest plot | 6 | 49035 | Risk Ratio (M‐H, Random, 95% CI) | 0.93 [0.74, 1.18] |
| 11 PAD ‐ LCn3 ‐ SA by summary risk of bias Show forest plot | 6 | Risk Ratio (M‐H, Random, 95% CI) | Subtotals only | |
| 11.1 Low summary risk of bias | 2 | 12738 | Risk Ratio (M‐H, Random, 95% CI) | 1.10 [0.75, 1.62] |
| 11.2 Moderate to high summary risk of bias | 4 | 36297 | Risk Ratio (M‐H, Random, 95% CI) | 0.85 [0.64, 1.14] |
| 12 PAD ‐ LCn3 ‐ SA compliance and study size Show forest plot | 6 | Risk Ratio (M‐H, Random, 95% CI) | Subtotals only | |
| 12.1 SA compliance | 1 | 202 | Risk Ratio (M‐H, Random, 95% CI) | 1.0 [0.06, 15.77] |
| 12.2 SA study size 100+ | 6 | 49035 | Risk Ratio (M‐H, Random, 95% CI) | 0.93 [0.74, 1.18] |
| 13 Acute coronary syndrome ‐ LCn3 Show forest plot | 2 | Risk Ratio (M‐H, Random, 95% CI) | Subtotals only | |
| 13.1 LCn3 | 2 | 2703 | Risk Ratio (M‐H, Random, 95% CI) | 1.19 [0.71, 2.00] |
| 14 Body weight, kg ‐ LCn3 Show forest plot | 12 | 15812 | Mean Difference (IV, Random, 95% CI) | ‐0.01 [‐0.84, 0.82] |
| 15 Weight, kg ‐ LCn3 ‐ SA by summary risk of bias Show forest plot | 12 | 15812 | Mean Difference (IV, Random, 95% CI) | ‐0.01 [‐0.84, 0.82] |
| 15.1 Low risk of bias | 7 | 15458 | Mean Difference (IV, Random, 95% CI) | ‐0.01 [‐0.91, 0.90] |
| 15.2 Moderate/high risk of bias | 5 | 354 | Mean Difference (IV, Random, 95% CI) | ‐0.28 [‐3.12, 2.55] |
| 16 Weight, kg ‐ LCn3 ‐ SA by compliance and study size Show forest plot | 10 | Mean Difference (IV, Random, 95% CI) | Subtotals only | |
| 16.1 SA ‐ low risk of compliance bias | 7 | 828 | Mean Difference (IV, Random, 95% CI) | 0.58 [‐0.52, 1.69] |
| 16.2 SA ‐ 100+ randomised | 7 | 15545 | Mean Difference (IV, Random, 95% CI) | 0.07 [‐0.84, 0.97] |
| 17 Weight, kg ‐ LCn3 ‐ subgroup by dose Show forest plot | 12 | Mean Difference (IV, Random, 95% CI) | Subtotals only | |
| 17.1 LCn3 ≤ 150 mg/d | 0 | 0 | Mean Difference (IV, Random, 95% CI) | 0.0 [0.0, 0.0] |
| 17.2 LCn3 > 150 ≤ 250 mg/d | 0 | 0 | Mean Difference (IV, Random, 95% CI) | 0.0 [0.0, 0.0] |
| 17.3 LCn3 > 250 ≤ 400 mg/d | 0 | 0 | Mean Difference (IV, Random, 95% CI) | 0.0 [0.0, 0.0] |
| 17.4 LCn3 > 400 ≤ 2400 mg/d | 8 | 15420 | Mean Difference (IV, Random, 95% CI) | ‐0.29 [‐1.16, 0.58] |
| 17.5 LCn3 > 2.4 ≤ 4.4 g/d | 3 | 241 | Mean Difference (IV, Random, 95% CI) | 0.07 [‐6.38, 6.51] |
| 17.6 LCn3 > 4.4 g/d | 2 | 261 | Mean Difference (IV, Random, 95% CI) | 1.51 [0.28, 2.75] |
| 18 Weight, kg ‐ LCn3 ‐ subgroup by replacement Show forest plot | 12 | Mean Difference (IV, Random, 95% CI) | Subtotals only | |
| 18.1 N‐3 replacing SFA | 2 | 433 | Mean Difference (IV, Random, 95% CI) | ‐2.51 [‐4.30, ‐0.72] |
| 18.2 N‐3 replacing MUFA | 7 | 15088 | Mean Difference (IV, Random, 95% CI) | 0.23 [‐0.28, 0.75] |
| 18.3 N‐3 replacing n‐6 | 1 | 41 | Mean Difference (IV, Random, 95% CI) | ‐1.3 [‐3.83, 1.23] |
| 18.4 N‐3 replacing carbs/sugars | 1 | 258 | Mean Difference (IV, Random, 95% CI) | ‐2.70 [‐4.75, ‐0.65] |
| 18.5 N‐3 replacing nil/low n‐3 placebo | 1 | 202 | Mean Difference (IV, Random, 95% CI) | 1.5 [0.25, 2.75] |
| 18.6 Replacement unclear | 2 | 223 | Mean Difference (IV, Random, 95% CI) | 0.60 [‐4.93, 6.13] |
| 19 Weight, kg ‐ LCn3 ‐ subgroup by intervention type Show forest plot | 12 | 15812 | Mean Difference (IV, Random, 95% CI) | ‐0.01 [‐0.84, 0.82] |
| 19.1 Dietary advice | 0 | 0 | Mean Difference (IV, Random, 95% CI) | 0.0 [0.0, 0.0] |
| 19.2 Supplemental foods | 1 | 202 | Mean Difference (IV, Random, 95% CI) | 1.5 [0.25, 2.75] |
| 19.3 Supplement (capsule) | 9 | 15538 | Mean Difference (IV, Random, 95% CI) | ‐0.23 [‐1.08, 0.63] |
| 19.4 Any combination | 2 | 72 | Mean Difference (IV, Random, 95% CI) | ‐0.43 [‐6.47, 5.61] |
| 20 Weight, kg ‐ LCn3 ‐ subgroup by duration Show forest plot | 12 | Mean Difference (IV, Random, 95% CI) | Subtotals only | |
| 20.1 Medium duration 1 to < 2 years in study | 8 | 840 | Mean Difference (IV, Random, 95% CI) | ‐0.54 [‐2.21, 1.12] |
| 20.2 Medium‐long duration: 2 to < 4 years in study | 3 | 436 | Mean Difference (IV, Random, 95% CI) | 0.67 [‐1.58, 2.91] |
| 20.3 Long duration ≥ 4 years in study | 1 | 14536 | Mean Difference (IV, Random, 95% CI) | 0.10 [‐0.48, 0.68] |
| 21 Weight, kg ‐ LCn3 ‐ subgroup by primary or secondary prevention Show forest plot | 12 | Mean Difference (IV, Random, 95% CI) | Subtotals only | |
| 21.1 Primary CVD prevention | 10 | 15578 | Mean Difference (IV, Random, 95% CI) | 0.05 [‐0.83, 0.92] |
| 21.2 Secondary CVD prevention | 2 | 234 | Mean Difference (IV, Random, 95% CI) | ‐1.13 [‐4.43, 2.16] |
| 22 Weight, kg ‐ LCn3 ‐ subgroup by statin use Show forest plot | 12 | Mean Difference (IV, Random, 95% CI) | Subtotals only | |
| 22.1 LCn3 ‐ ≥ 50% of control group on statins | 2 | 14631 | Mean Difference (IV, Random, 95% CI) | 0.64 [‐1.88, 3.17] |
| 22.2 LCn3 ‐ < 50% of control group on statins | 5 | 614 | Mean Difference (IV, Random, 95% CI) | 0.47 [‐0.66, 1.60] |
| 22.3 LCn3 ‐ use of statins unclear | 5 | 567 | Mean Difference (IV, Random, 95% CI) | ‐1.51 [‐3.30, 0.27] |
| 23 Body mass index, kg/m² ‐ LCn3 Show forest plot | 14 | 15234 | Mean Difference (IV, Random, 95% CI) | 0.04 [‐0.16, 0.24] |
| 24 BMI, kg/m²‐ LCn3 ‐ SA by summary risk of bias Show forest plot | 14 | 15234 | Mean Difference (IV, Random, 95% CI) | 0.04 [‐0.16, 0.24] |
| 24.1 Low risk of bias | 5 | 14190 | Mean Difference (IV, Random, 95% CI) | ‐0.01 [‐0.36, 0.33] |
| 24.2 Moderate/high risk of bias | 9 | 1044 | Mean Difference (IV, Random, 95% CI) | 0.04 [‐0.13, 0.20] |
| 25 BMI, kg/m²‐ LCn3 ‐ SA by compliance and study size Show forest plot | 10 | Mean Difference (IV, Random, 95% CI) | Subtotals only | |
| 25.1 SA ‐ low risk of compliance bias | 5 | 1848 | Mean Difference (IV, Random, 95% CI) | 0.09 [‐0.21, 0.38] |
| 25.2 SA ‐ 100+ randomised | 9 | 14982 | Mean Difference (IV, Random, 95% CI) | 0.01 [‐0.12, 0.14] |
| 26 BMI, kg/m² ‐ LCn3 ‐ subgroup by dose Show forest plot | 14 | Mean Difference (IV, Random, 95% CI) | Subtotals only | |
| 26.1 LCn3 > 150 ≤ 250 mg/d | 0 | 0 | Mean Difference (IV, Random, 95% CI) | 0.0 [0.0, 0.0] |
| 26.2 LCn3 ≤ 150 mg/d | 0 | 0 | Mean Difference (IV, Random, 95% CI) | 0.0 [0.0, 0.0] |
| 26.3 LCn3 > 250 ≤ 400 mg/d | 0 | 0 | Mean Difference (IV, Random, 95% CI) | 0.0 [0.0, 0.0] |
| 26.4 LCn3 > 400 ≤ 2400 mg/d | 11 | 14789 | Mean Difference (IV, Random, 95% CI) | 0.01 [‐0.11, 0.13] |
| 26.5 LCn3 > 2.4 ≤ 4.4 g/d | 3 | 445 | Mean Difference (IV, Random, 95% CI) | 1.42 [‐0.51, 3.35] |
| 26.6 LCn3 > 4.4 g/d | 0 | 0 | Mean Difference (IV, Random, 95% CI) | 0.0 [0.0, 0.0] |
| 27 BMI, kg/m² ‐ LCn3 ‐ subgroup by replacement Show forest plot | 14 | Mean Difference (IV, Random, 95% CI) | Subtotals only | |
| 27.1 N‐3 replacing SFA | 1 | 258 | Mean Difference (IV, Random, 95% CI) | ‐0.60 [‐1.14, ‐0.06] |
| 27.2 N‐3 replacing MUFA | 7 | 14180 | Mean Difference (IV, Random, 95% CI) | 0.08 [‐0.12, 0.28] |
| 27.3 N‐3 replacing n‐6 | 3 | 513 | Mean Difference (IV, Random, 95% CI) | 0.18 [‐0.46, 0.81] |
| 27.4 N‐3 replacing carbs/sugars | 1 | 258 | Mean Difference (IV, Random, 95% CI) | ‐0.60 [‐1.14, ‐0.06] |
| 27.5 N‐3 replacing nil/low n‐3 placebo | 1 | 60 | Mean Difference (IV, Random, 95% CI) | 1.0 [‐1.18, 3.18] |
| 27.6 Replacement unclear | 2 | 223 | Mean Difference (IV, Random, 95% CI) | 0.58 [‐1.17, 2.33] |
| 28 BMI, kg/m² ‐ LCn3 ‐ subgroup by intervention type Show forest plot | 14 | 15234 | Mean Difference (IV, Random, 95% CI) | 0.04 [‐0.16, 0.24] |
| 28.1 Dietary advice | 0 | 0 | Mean Difference (IV, Random, 95% CI) | 0.0 [0.0, 0.0] |
| 28.2 Supplemental foods | 1 | 1260 | Mean Difference (IV, Random, 95% CI) | 0.1 [‐0.10, 0.30] |
| 28.3 Supplement (capsule) | 12 | 13929 | Mean Difference (IV, Random, 95% CI) | 0.01 [‐0.25, 0.27] |
| 28.4 Any combination | 1 | 45 | Mean Difference (IV, Random, 95% CI) | 1.60 [‐0.43, 3.63] |
| 29 BMI, kg/m² ‐ LCn3 ‐ subgroup by duration Show forest plot | 14 | Mean Difference (IV, Random, 95% CI) | Subtotals only | |
| 29.1 Medium duration 1 to < 2 years in study | 9 | 906 | Mean Difference (IV, Random, 95% CI) | 0.24 [‐0.40, 0.88] |
| 29.2 Medium‐long duration: 2 to < 4 years in study | 4 | 1792 | Mean Difference (IV, Random, 95% CI) | 0.12 [‐0.07, 0.31] |
| 29.3 Long duration ≥ 4 years in study | 1 | 12536 | Mean Difference (IV, Random, 95% CI) | 0.0 [‐0.20, 0.20] |
| 30 BMI, kg/m² ‐ LCn3 ‐ subgroup by primary or secondary prevention Show forest plot | 14 | Mean Difference (IV, Random, 95% CI) | Subtotals only | |
| 30.1 Primary CVD prevention | 11 | 13610 | Mean Difference (IV, Random, 95% CI) | 0.15 [‐0.36, 0.66] |
| 30.2 Secondary CVD prevention | 3 | 1624 | Mean Difference (IV, Random, 95% CI) | 0.05 [‐0.08, 0.18] |
| 31 BMI, kg/m² ‐ LCn3 ‐ subgroup by statin use Show forest plot | 14 | Mean Difference (IV, Random, 95% CI) | Subtotals only | |
| 31.1 LCn3 ‐ ≥ 50% of control group on statins | 3 | 13891 | Mean Difference (IV, Random, 95% CI) | 0.13 [‐0.22, 0.48] |
| 31.2 LCn3 ‐ < 50% of control group on statins | 4 | 665 | Mean Difference (IV, Random, 95% CI) | 0.02 [‐0.15, 0.19] |
| 31.3 LCn3 ‐ use of statins unclear | 7 | 678 | Mean Difference (IV, Random, 95% CI) | 0.06 [‐0.86, 0.97] |
| 32 Other measures of adiposity ‐ LCn3 Show forest plot | 6 | Mean Difference (IV, Random, 95% CI) | Subtotals only | |
| 32.1 Percentage body fat | 2 | 127 | Mean Difference (IV, Random, 95% CI) | 0.85 [‐6.87, 8.57] |
| 32.2 Percentage visceral fat | 1 | 95 | Mean Difference (IV, Random, 95% CI) | ‐1.80 [‐15.03, 11.43] |
| 32.3 Waist circumference, cm | 3 | 676 | Mean Difference (IV, Random, 95% CI) | 0.66 [‐0.09, 1.42] |
| 32.4 Waist‐hip ratio | 1 | 100 | Mean Difference (IV, Random, 95% CI) | 0.0 [‐0.01, 0.01] |
| 32.5 Abdominal circumference, cm | 1 | 256 | Mean Difference (IV, Random, 95% CI) | ‐0.70 [‐8.78, 7.38] |
| 32.6 Hip circumference, cm | 1 | 258 | Mean Difference (IV, Random, 95% CI) | ‐2.40 [‐9.80, 5.00] |
| 33 Total cholesterol, serum, mmoL/L ‐ LCn3 Show forest plot | 28 | 37281 | Mean Difference (IV, Random, 95% CI) | ‐0.01 [‐0.05, 0.04] |
| 34 TC, mmoL/L ‐ LCn3 ‐ SA by summary risk of bias Show forest plot | 28 | 37281 | Mean Difference (IV, Random, 95% CI) | ‐0.01 [‐0.05, 0.03] |
| 34.1 Low risk of bias | 9 | 14930 | Mean Difference (IV, Random, 95% CI) | 0.01 [‐0.05, 0.06] |
| 34.2 Moderate/high risk of bias | 19 | 22351 | Mean Difference (IV, Random, 95% CI) | ‐0.03 [‐0.09, 0.03] |
| 35 TC, mmoL/L ‐ LCn3 ‐ SA by compliance and study size Show forest plot | 20 | Mean Difference (IV, Random, 95% CI) | Subtotals only | |
| 35.1 SA ‐ low risk of compliance bias | 14 | 3341 | Mean Difference (IV, Random, 95% CI) | 0.02 [‐0.05, 0.09] |
| 35.2 SA ‐ 100+ randomised | 15 | 36622 | Mean Difference (IV, Random, 95% CI) | 0.00 [‐0.05, 0.06] |
| 36 TC, mmoL/L ‐ LCn3 ‐ subgroup by dose Show forest plot | 28 | Mean Difference (IV, Random, 95% CI) | Subtotals only | |
| 36.1 LCn3 ≤ 150 mg/d | 0 | 0 | Mean Difference (IV, Random, 95% CI) | 0.0 [0.0, 0.0] |
| 36.2 LCn3 > 150 ≤ 250 mg/d | 0 | 0 | Mean Difference (IV, Random, 95% CI) | 0.0 [0.0, 0.0] |
| 36.3 LCn3 > 250 ≤ 400 mg/d | 1 | 1715 | Mean Difference (IV, Random, 95% CI) | 0.10 [‐0.01, 0.21] |
| 36.4 LCn3 > 400 ≤ 2400 mg/d | 18 | 34262 | Mean Difference (IV, Random, 95% CI) | ‐0.03 [‐0.06, 0.00] |
| 36.5 LCn3 > 2.4 ≤ 4.4 g/d | 7 | 1216 | Mean Difference (IV, Random, 95% CI) | ‐0.14 [‐0.28, ‐0.01] |
| 36.6 LCn3 > 4.4 g/d | 2 | 88 | Mean Difference (IV, Random, 95% CI) | 0.08 [‐0.28, 0.45] |
| 37 TC, mmoL/L ‐ LCn3 ‐ subgroup by replacement Show forest plot | 28 | Mean Difference (IV, Random, 95% CI) | Subtotals only | |
| 37.1 N‐3 replacing SFA | 3 | 2148 | Mean Difference (IV, Random, 95% CI) | 0.10 [‐0.01, 0.20] |
| 37.2 N‐3 replacing MUFA | 15 | 16504 | Mean Difference (IV, Random, 95% CI) | 0.01 [‐0.04, 0.06] |
| 37.3 N‐3 replacing n‐6 | 5 | 895 | Mean Difference (IV, Random, 95% CI) | 0.02 [‐0.22, 0.26] |
| 37.4 N‐3 replacing carbs/sugars | 1 | 258 | Mean Difference (IV, Random, 95% CI) | ‐0.20 [‐1.03, 0.63] |
| 37.5 N‐3 replacing nil/low n‐3 placebo | 5 | 19431 | Mean Difference (IV, Random, 95% CI) | ‐0.05 [‐0.07, ‐0.03] |
| 37.6 Replacement unclear | 2 | 193 | Mean Difference (IV, Random, 95% CI) | ‐0.15 [‐0.47, 0.17] |
| 38 TC, mmoL/L ‐ LCn3 ‐ subgroup by intervention type Show forest plot | 28 | Mean Difference (IV, Random, 95% CI) | Subtotals only | |
| 38.1 Dietary advice | 1 | 1715 | Mean Difference (IV, Random, 95% CI) | 0.10 [‐0.01, 0.21] |
| 38.2 Supplemental foods | 1 | 1210 | Mean Difference (IV, Random, 95% CI) | 0.02 [‐0.09, 0.13] |
| 38.3 Supplement (capsule) | 24 | 34145 | Mean Difference (IV, Random, 95% CI) | ‐0.05 [‐0.07, ‐0.03] |
| 38.4 Any combination | 2 | 211 | Mean Difference (IV, Random, 95% CI) | 0.13 [‐0.10, 0.37] |
| 39 TC, mmoL/L ‐ LCn3 ‐ subgroup by duration Show forest plot | 28 | Mean Difference (IV, Random, 95% CI) | Subtotals only | |
| 39.1 Medium duration 1 to < 2 years in study | 15 | 1661 | Mean Difference (IV, Random, 95% CI) | ‐0.06 [‐0.16, 0.04] |
| 39.2 Medium‐long duration: 2 to < 4 years in study | 10 | 4231 | Mean Difference (IV, Random, 95% CI) | 0.02 [‐0.05, 0.10] |
| 39.3 Long duration ≥ 4 years in study | 3 | 31389 | Mean Difference (IV, Random, 95% CI) | 0.00 [‐0.09, 0.09] |
| 40 TC, mmoL/L ‐ LCn3 ‐ subgroup by primary or secondary prevention Show forest plot | 28 | Mean Difference (IV, Random, 95% CI) | Subtotals only | |
| 40.1 Primary prevention | 17 | 32796 | Mean Difference (IV, Random, 95% CI) | ‐0.04 [‐0.07, ‐0.02] |
| 40.2 Secondary prevention | 11 | 4485 | Mean Difference (IV, Random, 95% CI) | ‐0.01 [‐0.09, 0.08] |
| 41 TC, mmoL/L ‐ LCn3 ‐ subgroup by statin use Show forest plot | 28 | Mean Difference (IV, Random, 95% CI) | Subtotals only | |
| 41.1 LCn3 ‐ ≥ 50% of control group on statins | 6 | 32823 | Mean Difference (IV, Random, 95% CI) | ‐0.05 [‐0.07, ‐0.02] |
| 41.2 LCn3 ‐ < 50% of control group on statins | 15 | 3871 | Mean Difference (IV, Random, 95% CI) | 0.01 [‐0.08, 0.10] |
| 41.3 LCn3 ‐ use of statins unclear | 7 | 587 | Mean Difference (IV, Random, 95% CI) | ‐0.03 [‐0.27, 0.22] |
| 42 Triglycerides, fasting, serum, mmoL/L ‐ LCn3 Show forest plot | 25 | 35579 | Mean Difference (IV, Random, 95% CI) | ‐0.24 [‐0.31, ‐0.16] |
| 43 TG, fasting, mmoL/L ‐ LCn3 ‐ SA by summary risk of bias Show forest plot | 25 | 35579 | Mean Difference (IV, Random, 95% CI) | ‐0.23 [‐0.30, ‐0.16] |
| 43.1 Low risk of bias | 8 | 14654 | Mean Difference (IV, Random, 95% CI) | ‐0.17 [‐0.25, ‐0.09] |
| 43.2 Moderate/high risk of bias | 17 | 20925 | Mean Difference (IV, Random, 95% CI) | ‐0.25 [‐0.35, ‐0.15] |
| 44 TG, fasting, mmoL/L ‐ LCn3 ‐ SA by compliance and study size Show forest plot | 19 | Mean Difference (IV, Random, 95% CI) | Subtotals only | |
| 44.1 SA ‐ low risk of compliance bias | 12 | 3306 | Mean Difference (IV, Random, 95% CI) | ‐0.26 [‐0.36, ‐0.16] |
| 44.2 SA ‐ 100+ randomised | 18 | 35197 | Mean Difference (IV, Random, 95% CI) | ‐0.24 [‐0.32, ‐0.16] |
| 45 TG, fasting, mmoL/L ‐ LCn3 ‐ subgroup by dose Show forest plot | 25 | Mean Difference (IV, Random, 95% CI) | Subtotals only | |
| 45.1 LCn3 ≤ 150 mg/d | 0 | 0 | Mean Difference (IV, Random, 95% CI) | 0.0 [0.0, 0.0] |
| 45.2 LCn3 > 150 ≤ 250 mg/d | 0 | 0 | Mean Difference (IV, Random, 95% CI) | 0.0 [0.0, 0.0] |
| 45.3 LCn3 > 250 ≤ 400 mg/d | 0 | 0 | Mean Difference (IV, Random, 95% CI) | 0.0 [0.0, 0.0] |
| 45.4 LCn3 > 400 ≤ 2400 mg/d | 18 | 34388 | Mean Difference (IV, Random, 95% CI) | ‐0.18 [‐0.25, ‐0.11] |
| 45.5 LCn3 > 2.4 ≤ 4.4 g/d | 5 | 1107 | Mean Difference (IV, Random, 95% CI) | ‐0.36 [‐0.53, ‐0.20] |
| 45.6 LCn3 > 4.4 g/d | 2 | 84 | Mean Difference (IV, Random, 95% CI) | ‐0.41 [‐0.68, ‐0.14] |
| 46 TG, fasting, mmoL/L ‐ LCn3 ‐ subgroup by replacement Show forest plot | 25 | Mean Difference (IV, Random, 95% CI) | Subtotals only | |
| 46.1 N‐3 replacing SFA | 2 | 429 | Mean Difference (IV, Random, 95% CI) | ‐0.27 [‐0.59, 0.04] |
| 46.2 N‐3 replacing MUFA | 13 | 14634 | Mean Difference (IV, Random, 95% CI) | ‐0.18 [‐0.25, ‐0.10] |
| 46.3 N‐3 replacing n‐6 | 5 | 876 | Mean Difference (IV, Random, 95% CI) | ‐0.27 [‐0.45, ‐0.08] |
| 46.4 N‐3 replacing carbs/sugars | 1 | 258 | Mean Difference (IV, Random, 95% CI) | ‐0.5 [‐1.49, 0.49] |
| 46.5 N‐3 replacing nil/low n‐3 placebo | 4 | 19357 | Mean Difference (IV, Random, 95% CI) | ‐0.18 [‐0.51, 0.14] |
| 46.6 Replacement unclear | 2 | 454 | Mean Difference (IV, Random, 95% CI) | ‐0.38 [‐0.57, ‐0.19] |
| 47 TG, fasting, mmoL/L ‐ LCn3 ‐ subgroup by intervention type Show forest plot | 25 | Mean Difference (IV, Random, 95% CI) | Subtotals only | |
| 47.1 Dietary advice | 1 | 71 | Mean Difference (IV, Random, 95% CI) | 0.02 [‐0.36, 0.40] |
| 47.2 Supplemental foods | 1 | 1210 | Mean Difference (IV, Random, 95% CI) | ‐0.03 [‐0.15, 0.09] |
| 47.3 Supplement (capsule) | 22 | 34137 | Mean Difference (IV, Random, 95% CI) | ‐0.19 [‐0.38, ‐0.00] |
| 47.4 Any combination | 1 | 161 | Mean Difference (IV, Random, 95% CI) | 0.01 [‐0.28, 0.30] |
| 48 TG, fasting, mmoL/L ‐ LCn3 ‐ subgroup by duration Show forest plot | 25 | Mean Difference (IV, Random, 95% CI) | Subtotals only | |
| 48.1 Medium duration 1 to < 2 years in study | 13 | 1880 | Mean Difference (IV, Random, 95% CI) | ‐0.27 [‐0.36, ‐0.19] |
| 48.2 Medium‐long duration: 2 to < 4 years in study | 9 | 2310 | Mean Difference (IV, Random, 95% CI) | ‐0.16 [‐0.31, ‐0.02] |
| 48.3 Long duration ≥ 4 years in study | 3 | 31389 | Mean Difference (IV, Random, 95% CI) | ‐0.20 [‐0.32, ‐0.07] |
| 49 TG, fasting, mmoL/L ‐ LCn3 ‐ subgroup by primary or secondary prevention Show forest plot | 25 | Mean Difference (IV, Random, 95% CI) | Subtotals only | |
| 49.1 Primary prevention | 17 | 33114 | Mean Difference (IV, Random, 95% CI) | ‐0.20 [‐0.26, ‐0.14] |
| 49.2 Secondary prevention | 8 | 2465 | Mean Difference (IV, Random, 95% CI) | ‐0.27 [‐0.44, ‐0.10] |
| 50 TG, fasting, mmoL/L ‐ LCn3 ‐ subgroup by statin use Show forest plot | 25 | Mean Difference (IV, Random, 95% CI) | Subtotals only | |
| 50.1 LCn3 ‐ ≥ 50% of control group on statins | 5 | 32557 | Mean Difference (IV, Random, 95% CI) | ‐0.11 [‐0.21, ‐0.01] |
| 50.2 LCn3 ‐ < 50% of control group on statins | 14 | 2414 | Mean Difference (IV, Random, 95% CI) | ‐0.27 [‐0.36, ‐0.18] |
| 50.3 LCn3 ‐ use of statins unclear | 6 | 608 | Mean Difference (IV, Random, 95% CI) | ‐0.23 [‐0.38, ‐0.08] |
| 51 High‐density lipoprotein, serum, mmoL/L ‐ LCn3 Show forest plot | 27 | 37237 | Mean Difference (IV, Random, 95% CI) | 0.02 [0.00, 0.04] |
| 52 HDL, mmoL/L ‐ LCn3 ‐ SA by summary risk of bias Show forest plot | 27 | 37237 | Mean Difference (IV, Random, 95% CI) | 0.03 [0.01, 0.05] |
| 52.1 Low risk of bias | 8 | 14892 | Mean Difference (IV, Random, 95% CI) | 0.03 [‐0.01, 0.07] |
| 52.2 Moderate/high risk of bias | 19 | 22345 | Mean Difference (IV, Random, 95% CI) | 0.03 [0.00, 0.06] |
| 53 HDL, mmoL/L ‐ LCn3 ‐ SA by compliance and study size Show forest plot | 20 | Mean Difference (IV, Random, 95% CI) | Subtotals only | |
| 53.1 SA ‐ low risk of compliance bias | 13 | 3202 | Mean Difference (IV, Random, 95% CI) | 0.05 [0.01, 0.10] |
| 53.2 SA ‐ 100+ randomised | 15 | 36573 | Mean Difference (IV, Random, 95% CI) | 0.03 [0.00, 0.05] |
| 54 HDL, mmoL/L ‐ LCn3 ‐ subgroup by dose Show forest plot | 27 | Mean Difference (IV, Random, 95% CI) | Subtotals only | |
| 54.1 LCn3 ≤ 150 mg/d | 0 | 0 | Mean Difference (IV, Random, 95% CI) | 0.0 [0.0, 0.0] |
| 54.2 LCn3 > 150 ≤ 250 mg/d | 0 | 0 | Mean Difference (IV, Random, 95% CI) | 0.0 [0.0, 0.0] |
| 54.3 LCn3 > 250 ≤ 400 mg/d | 0 | 0 | Mean Difference (IV, Random, 95% CI) | 0.0 [0.0, 0.0] |
| 54.4 LCn3 > 400 ≤ 2400 mg/d | 19 | 35972 | Mean Difference (IV, Random, 95% CI) | 0.02 [‐0.00, 0.04] |
| 54.5 LCn3 > 2.4 ≤ 4.4 g/d | 7 | 1206 | Mean Difference (IV, Random, 95% CI) | 0.06 [0.00, 0.12] |
| 54.6 LCn3 > 4.4 g/d | 1 | 59 | Mean Difference (IV, Random, 95% CI) | 0.0 [‐0.16, 0.16] |
| 55 HDL, mmoL/L ‐ LCn3 ‐ subgroup by replacement Show forest plot | 27 | Mean Difference (IV, Random, 95% CI) | Subtotals only | |
| 55.1 N‐3 replacing SFA | 3 | 2143 | Mean Difference (IV, Random, 95% CI) | ‐0.02 [‐0.10, 0.07] |
| 55.2 N‐3 replacing MUFA | 15 | 16505 | Mean Difference (IV, Random, 95% CI) | 0.02 [‐0.01, 0.06] |
| 55.3 N‐3 replacing n‐6 | 4 | 850 | Mean Difference (IV, Random, 95% CI) | 0.04 [‐0.01, 0.09] |
| 55.4 N‐3 replacing carbs/sugars | 1 | 258 | Mean Difference (IV, Random, 95% CI) | 0.10 [‐0.17, 0.37] |
| 55.5 N‐3 replacing nil/low n‐3 placebo | 5 | 19431 | Mean Difference (IV, Random, 95% CI) | 0.04 [‐0.03, 0.11] |
| 55.6 Replacement unclear | 2 | 193 | Mean Difference (IV, Random, 95% CI) | 0.05 [‐0.10, 0.20] |
| 56 HDL, mmoL/L ‐ LCn3 ‐ subgroup by intervention type Show forest plot | 27 | Mean Difference (IV, Random, 95% CI) | Subtotals only | |
| 56.1 Dietary advice | 2 | 1785 | Mean Difference (IV, Random, 95% CI) | 0.01 [‐0.02, 0.04] |
| 56.2 Supplemental foods | 1 | 1210 | Mean Difference (IV, Random, 95% CI) | 0.03 [0.00, 0.06] |
| 56.3 Supplement (capsule) | 21 | 34008 | Mean Difference (IV, Random, 95% CI) | 0.03 [0.00, 0.06] |
| 56.4 Any combination | 3 | 234 | Mean Difference (IV, Random, 95% CI) | 0.10 [‐0.10, 0.31] |
| 57 HDL, mmoL/L ‐ LCn3 ‐ subgroup by duration Show forest plot | 27 | Mean Difference (IV, Random, 95% CI) | Subtotals only | |
| 57.1 Medium duration 1 to < 2 years in study | 13 | 1562 | Mean Difference (IV, Random, 95% CI) | 0.08 [0.01, 0.14] |
| 57.2 Medium‐long duration: 2 to < 4 years in study | 11 | 4286 | Mean Difference (IV, Random, 95% CI) | 0.02 [‐0.01, 0.04] |
| 57.3 Long duration ≥ 4 years in study | 3 | 31389 | Mean Difference (IV, Random, 95% CI) | 0.00 [‐0.01, 0.01] |
| 58 HDL, mmoL/L ‐ LCn3 ‐ subgroup by primary or secondary prevention Show forest plot | 26 | Mean Difference (IV, Random, 95% CI) | Subtotals only | |
| 58.1 Primary prevention | 17 | 32856 | Mean Difference (IV, Random, 95% CI) | 0.03 [‐0.00, 0.05] |
| 58.2 Secondary prevention | 9 | 4307 | Mean Difference (IV, Random, 95% CI) | 0.03 [‐0.01, 0.07] |
| 59 HDL, mmoL/L ‐ LCn3 ‐ subgroup by statin use Show forest plot | 27 | Mean Difference (IV, Random, 95% CI) | Subtotals only | |
| 59.1 LCn3 ‐ ≥ 50% of control group on statins | 7 | 32894 | Mean Difference (IV, Random, 95% CI) | 0.01 [‐0.01, 0.03] |
| 59.2 LCn3 ‐ < 50% of control group on statins | 13 | 3690 | Mean Difference (IV, Random, 95% CI) | 0.04 [‐0.00, 0.08] |
| 59.3 LCn3 ‐ use of statins unclear | 7 | 653 | Mean Difference (IV, Random, 95% CI) | 0.07 [‐0.07, 0.21] |
| 60 Low‐density lipoprotein, serum, mmoL/L ‐ LCn3 Show forest plot | 23 | 35035 | Mean Difference (IV, Random, 95% CI) | 0.01 [‐0.01, 0.03] |
| 61 LDL, mmoL/L ‐ LCn3 ‐ SA by summary risk of bias Show forest plot | 23 | 35035 | Mean Difference (IV, Random, 95% CI) | 0.01 [‐0.01, 0.03] |
| 61.1 Low risk of bias | 9 | 14840 | Mean Difference (IV, Random, 95% CI) | 0.02 [‐0.03, 0.07] |
| 61.2 Moderate/high risk of bias | 14 | 20195 | Mean Difference (IV, Random, 95% CI) | 0.00 [‐0.02, 0.03] |
| 62 LDL, mmoL/L ‐ LCn3 ‐ SA by compliance and study size Show forest plot | 17 | 37718 | Mean Difference (IV, Random, 95% CI) | 0.02 [‐0.01, 0.05] |
| 62.1 SA ‐ low risk of compliance bias | 13 | 3165 | Mean Difference (IV, Random, 95% CI) | 0.05 [‐0.02, 0.11] |
| 62.2 SA ‐ 100+ randomised | 14 | 34553 | Mean Difference (IV, Random, 95% CI) | 0.01 [‐0.02, 0.04] |
| 63 LDL, mmoL/L ‐ LCn3 ‐ subgroup by dose Show forest plot | 23 | Mean Difference (IV, Random, 95% CI) | Subtotals only | |
| 63.1 LCn3 ≤ 150 mg/d | 0 | 0 | Mean Difference (IV, Random, 95% CI) | 0.0 [0.0, 0.0] |
| 63.2 LCn3 > 150 ≤ 250 mg/d | 0 | 0 | Mean Difference (IV, Random, 95% CI) | 0.0 [0.0, 0.0] |
| 63.3 LCn3 > 250 ≤ 400 mg/d | 0 | 0 | Mean Difference (IV, Random, 95% CI) | 0.0 [0.0, 0.0] |
| 63.4 LCn3 > 400 ≤ 2400 mg/d | 16 | 34054 | Mean Difference (IV, Random, 95% CI) | 0.01 [‐0.01, 0.02] |
| 63.5 LCn3 > 2.4 ≤ 4.4 g/d | 5 | 893 | Mean Difference (IV, Random, 95% CI) | 0.01 [‐0.14, 0.15] |
| 63.6 LCn3 > 4.4 g/d | 2 | 88 | Mean Difference (IV, Random, 95% CI) | 0.22 [‐0.09, 0.54] |
| 64 LDL, mmoL/L ‐ LCn3 ‐ subgroup by replacement Show forest plot | 23 | Mean Difference (IV, Random, 95% CI) | Subtotals only | |
| 64.1 N‐3 replacing SFA | 2 | 429 | Mean Difference (IV, Random, 95% CI) | 0.17 [‐0.14, 0.47] |
| 64.2 N‐3 replacing MUFA | 14 | 14710 | Mean Difference (IV, Random, 95% CI) | 0.01 [‐0.03, 0.05] |
| 64.3 N‐3 replacing n‐6 | 2 | 242 | Mean Difference (IV, Random, 95% CI) | 0.14 [‐0.26, 0.55] |
| 64.4 N‐3 replacing carbs/sugars | 1 | 258 | Mean Difference (IV, Random, 95% CI) | 0.20 [‐0.51, 0.91] |
| 64.5 N‐3 replacing nil/low n‐3 placebo | 3 | 19297 | Mean Difference (IV, Random, 95% CI) | 0.00 [‐0.02, 0.02] |
| 64.6 Replacement unclear | 3 | 528 | Mean Difference (IV, Random, 95% CI) | 0.10 [‐0.03, 0.23] |
| 65 LDL, mmoL/L ‐ LCn3 ‐ subgroup by intervention type Show forest plot | 23 | Mean Difference (IV, Random, 95% CI) | Subtotals only | |
| 65.1 Dietary advice | 1 | 71 | Mean Difference (IV, Random, 95% CI) | 0.08 [‐0.22, 0.38] |
| 65.2 Supplemental foods | 1 | 1124 | Mean Difference (IV, Random, 95% CI) | ‐0.02 [‐0.10, 0.06] |
| 65.3 Supplement (capsule) | 19 | 33768 | Mean Difference (IV, Random, 95% CI) | 0.01 [‐0.01, 0.03] |
| 65.4 Any combination | 2 | 72 | Mean Difference (IV, Random, 95% CI) | 0.08 [‐0.44, 0.61] |
| 66 LDL, mmoL/L ‐ LCn3 ‐ subgroup by duration Show forest plot | 23 | Mean Difference (IV, Random, 95% CI) | Subtotals only | |
| 66.1 Medium duration 1 to < 2 years in study | 14 | 1862 | Mean Difference (IV, Random, 95% CI) | 0.06 [‐0.03, 0.14] |
| 66.2 Medium‐long duration: 2 to < 4 years in study | 6 | 1784 | Mean Difference (IV, Random, 95% CI) | ‐0.01 [‐0.08, 0.06] |
| 66.3 Long duration ≥ 4 years in study | 3 | 31389 | Mean Difference (IV, Random, 95% CI) | 0.03 [‐0.04, 0.10] |
| 67 LDL, mmoL/L ‐ LCn3 ‐ subgroup by primary or secondary prevention Show forest plot | 23 | Mean Difference (IV, Random, 95% CI) | Subtotals only | |
| 67.1 Primary prevention | 16 | 32717 | Mean Difference (IV, Random, 95% CI) | 0.01 [‐0.01, 0.03] |
| 67.2 Secondary prevention | 7 | 2318 | Mean Difference (IV, Random, 95% CI) | 0.01 [‐0.05, 0.08] |
| 68 LDL, mmoL/L ‐ LCn3 ‐ subgroup by statin use Show forest plot | 23 | Mean Difference (IV, Random, 95% CI) | Subtotals only | |
| 68.1 LCn3 ‐ ≥ 50% of control group on statins | 7 | 32808 | Mean Difference (IV, Random, 95% CI) | 0.00 [‐0.02, 0.02] |
| 68.2 LCn3 ‐ < 50% of control group on statins | 9 | 1564 | Mean Difference (IV, Random, 95% CI) | 0.12 [0.03, 0.21] |
| 68.3 LCn3 ‐ use of statins unclear | 7 | 663 | Mean Difference (IV, Random, 95% CI) | ‐0.01 [‐0.17, 0.14] |
| Outcome or subgroup title | No. of studies | No. of participants | Statistical method | Effect size |
| 1 Blood pressure, mmHg ‐ LCn3 Show forest plot | 15 | Mean Difference (IV, Random, 95% CI) | Subtotals only | |
| 1.1 Systolic BP ‐ LCn3 | 15 | 34413 | Mean Difference (IV, Random, 95% CI) | 0.02 [‐0.32, 0.35] |
| 1.2 Diastolic BP ‐ LCn3 | 14 | 35386 | Mean Difference (IV, Random, 95% CI) | ‐0.02 [‐0.22, 0.17] |
| 2 Serious adverse events ‐ LCn3 Show forest plot | 14 | Risk Ratio (M‐H, Random, 95% CI) | Subtotals only | |
| 2.1 Any serious adverse events | 1 | 402 | Risk Ratio (M‐H, Random, 95% CI) | 1.05 [0.78, 1.41] |
| 2.2 Bleeding | 8 | 45562 | Risk Ratio (M‐H, Random, 95% CI) | 1.06 [0.73, 1.52] |
| 2.3 GI hospitalisation | 1 | 200 | Risk Ratio (M‐H, Random, 95% CI) | 1.75 [0.53, 5.79] |
| 2.4 Pulmonary embolus or DVT ‐ LCn3 | 4 | 3011 | Risk Ratio (M‐H, Random, 95% CI) | 1.25 [0.41, 3.78] |
| 2.5 Progression to advanced AMD (age‐related macular degeneration) | 1 | 4203 | Risk Ratio (M‐H, Random, 95% CI) | 0.96 [0.90, 1.02] |
| 3 Side effects ‐ LCn3 Show forest plot | 33 | Risk Ratio (M‐H, Random, 95% CI) | Subtotals only | |
| 3.1 Dropouts due to side effects | 23 | 16755 | Risk Ratio (M‐H, Random, 95% CI) | 1.16 [0.99, 1.36] |
| 3.2 Abdominal pain or discomfort | 7 | 14650 | Risk Ratio (M‐H, Random, 95% CI) | 1.10 [0.84, 1.45] |
| 3.3 Diarrhoea | 10 | 2428 | Risk Ratio (M‐H, Random, 95% CI) | 1.15 [0.92, 1.43] |
| 3.4 Nausea | 5 | 1234 | Risk Ratio (M‐H, Random, 95% CI) | 1.73 [1.23, 2.44] |
| 3.5 Any gastrointestinal side effect ‐ LCn3 fats | 29 | 65185 | Risk Ratio (M‐H, Random, 95% CI) | 1.12 [0.94, 1.34] |
| 3.6 Skin problems (itching, rashes) | 8 | 36186 | Risk Ratio (M‐H, Random, 95% CI) | 1.04 [0.47, 2.30] |
| 3.7 Headache or worsening migraine | 3 | 991 | Risk Ratio (M‐H, Random, 95% CI) | 0.80 [0.48, 1.35] |
| 3.8 Reflux | 1 | 202 | Risk Ratio (M‐H, Random, 95% CI) | 1.42 [0.71, 2.81] |
| 3.9 Pain (joint, lumbar, muscle pain) | 1 | 18645 | Risk Ratio (M‐H, Random, 95% CI) | 0.80 [0.64, 0.99] |
| 3.10 All side effects combined | 13 | 38904 | Risk Ratio (M‐H, Random, 95% CI) | 1.01 [0.95, 1.08] |
| 4 Dropouts ‐ LCn3 Show forest plot | 30 | 31321 | Risk Ratio (M‐H, Random, 95% CI) | 1.02 [0.95, 1.09] |
| Outcome or subgroup title | No. of studies | No. of participants | Statistical method | Effect size |
| 1 All‐cause mortality (overall) ‐ ALA Show forest plot | 5 | 19327 | Risk Ratio (M‐H, Random, 95% CI) | 1.01 [0.84, 1.20] |
| 2 All‐cause mortality ‐ ALA ‐ sensitivity analysis (SA) fixed‐effect Show forest plot | 5 | 16923 | Risk Ratio (M‐H, Fixed, 95% CI) | 1.06 [0.84, 1.34] |
| 3 All‐cause mortality ‐ ALA ‐ SA by summary risk of bias Show forest plot | 5 | 19327 | Risk Ratio (M‐H, Random, 95% CI) | 1.01 [0.84, 1.20] |
| 3.1 Low risk of bias | 3 | 5213 | Risk Ratio (M‐H, Random, 95% CI) | 1.02 [0.72, 1.45] |
| 3.2 Moderate/high risk of bias | 2 | 14114 | Risk Ratio (M‐H, Random, 95% CI) | 1.09 [0.71, 1.67] |
| 4 All‐cause mortality ‐ ALA ‐ SA by compliance and study size Show forest plot | 5 | Risk Ratio (M‐H, Random, 95% CI) | Subtotals only | |
| 4.1 SA ‐ low risk of compliance bias | 3 | 5811 | Risk Ratio (M‐H, Random, 95% CI) | 1.05 [0.68, 1.63] |
| 4.2 SA ‐ 100+ randomised | 5 | 19327 | Risk Ratio (M‐H, Random, 95% CI) | 1.01 [0.84, 1.20] |
| 5 All‐cause mortality ‐ ALA ‐ subgroup by dose Show forest plot | 5 | 19327 | Risk Ratio (M‐H, Random, 95% CI) | 1.01 [0.84, 1.20] |
| 5.1 ALA low < 5 g/d | 1 | 4837 | Risk Ratio (M‐H, Random, 95% CI) | 0.98 [0.80, 1.19] |
| 5.2 ALA high ≥ 5 g/d | 4 | 14490 | Risk Ratio (M‐H, Random, 95% CI) | 1.16 [0.77, 1.75] |
| 6 All‐cause mortality ‐ ALA ‐ subgroup by replacement Show forest plot | 5 | Risk Ratio (M‐H, Random, 95% CI) | Subtotals only | |
| 6.1 ALA replacing SFA | 0 | 0 | Risk Ratio (M‐H, Random, 95% CI) | 0.0 [0.0, 0.0] |
| 6.2 ALA replacing MUFA | 1 | 4837 | Risk Ratio (M‐H, Random, 95% CI) | 0.98 [0.80, 1.19] |
| 6.3 ALA replacing n‐6 | 2 | 13672 | Risk Ratio (M‐H, Random, 95% CI) | 1.37 [0.48, 3.86] |
| 6.4 ALA replacing CHO | 0 | 0 | Risk Ratio (M‐H, Random, 95% CI) | 0.0 [0.0, 0.0] |
| 6.5 ALA replacing nil/low n‐3 placebo | 0 | 0 | Risk Ratio (M‐H, Random, 95% CI) | 0.0 [0.0, 0.0] |
| 6.6 ALA replacement unclear | 2 | 818 | Risk Ratio (M‐H, Random, 95% CI) | 2.78 [0.29, 26.49] |
| 7 All cause mortality ‐ ALA ‐ subgroup by intervention type Show forest plot | 5 | 19327 | Risk Ratio (M‐H, Random, 95% CI) | 1.01 [0.84, 1.20] |
| 7.1 Dietary advice | 0 | 0 | Risk Ratio (M‐H, Random, 95% CI) | 0.0 [0.0, 0.0] |
| 7.2 Supplemental foods | 4 | 5921 | Risk Ratio (M‐H, Random, 95% CI) | 0.99 [0.82, 1.21] |
| 7.3 Supplements (capsule) | 1 | 13406 | Risk Ratio (M‐H, Random, 95% CI) | 1.07 [0.70, 1.64] |
| 7.4 Any combination | 0 | 0 | Risk Ratio (M‐H, Random, 95% CI) | 0.0 [0.0, 0.0] |
| 8 All‐cause mortality ‐ ALA ‐ subgroup by duration Show forest plot | 5 | 19327 | Risk Ratio (M‐H, Random, 95% CI) | 1.01 [0.84, 1.20] |
| 8.1 Medium duration 1 to < 2 years in study | 2 | 13516 | Risk Ratio (M‐H, Random, 95% CI) | 1.09 [0.71, 1.67] |
| 8.2 Medium‐long duration: 2 to < 4 years in study | 3 | 5811 | Risk Ratio (M‐H, Random, 95% CI) | 1.05 [0.68, 1.63] |
| 8.3 Long duration: ≥ 4 years in study | 0 | 0 | Risk Ratio (M‐H, Random, 95% CI) | 0.0 [0.0, 0.0] |
| 9 All‐cause mortality ‐ ALA ‐ subgroup by primary or secondary prevention Show forest plot | 5 | 19327 | Risk Ratio (M‐H, Random, 95% CI) | 1.01 [0.84, 1.20] |
| 9.1 Primary CVD prevention | 3 | 14380 | Risk Ratio (M‐H, Random, 95% CI) | 1.14 [0.75, 1.74] |
| 9.2 Secondary CVD prevention | 2 | 4947 | Risk Ratio (M‐H, Random, 95% CI) | 0.98 [0.81, 1.19] |
| 10 All‐cause mortality ‐ ALA ‐ subgroup by statin use Show forest plot | 5 | 16923 | Risk Ratio (M‐H, Random, 95% CI) | 1.05 [0.84, 1.33] |
| 10.1 ALA ‐ ≥ 50% of control group on statins | 2 | 2543 | Risk Ratio (M‐H, Random, 95% CI) | 1.02 [0.77, 1.34] |
| 10.2 ALA ‐ < 50% of control group on statins | 3 | 14380 | Risk Ratio (M‐H, Random, 95% CI) | 1.14 [0.75, 1.74] |
| 11 Cardiovascular mortality (overall) ‐ ALA Show forest plot | 4 | 18619 | Risk Ratio (M‐H, Random, 95% CI) | 0.96 [0.74, 1.25] |
| 12 CVD mortality ‐ ALA ‐ SA fixed‐effect Show forest plot | 4 | 18619 | Risk Ratio (M‐H, Fixed, 95% CI) | 0.96 [0.74, 1.25] |
| 13 CVD mortality ‐ ALA ‐ SA by summary risk of bias Show forest plot | 4 | 18619 | Risk Ratio (M‐H, Random, 95% CI) | 0.96 [0.74, 1.25] |
| 13.1 Low risk of bias | 3 | 5213 | Risk Ratio (M‐H, Random, 95% CI) | 0.95 [0.70, 1.28] |
| 13.2 Moderate/high risk of bias | 1 | 13406 | Risk Ratio (M‐H, Random, 95% CI) | 1.00 [0.58, 1.70] |
| 14 CVD mortality ‐ ALA ‐ SA by compliance and study size Show forest plot | 4 | 23722 | Risk Ratio (M‐H, Random, 95% CI) | 0.95 [0.78, 1.16] |
| 14.1 SA ‐ low risk of compliance bias | 2 | 5103 | Risk Ratio (M‐H, Random, 95% CI) | 0.94 [0.70, 1.27] |
| 14.2 SA ‐ 100+ randomised | 4 | 18619 | Risk Ratio (M‐H, Random, 95% CI) | 0.96 [0.74, 1.25] |
| 15 CVD mortality ‐ ALA ‐ subgroup by dose Show forest plot | 4 | 18619 | Risk Ratio (M‐H, Random, 95% CI) | 0.96 [0.74, 1.25] |
| 15.1 ALA low < 5 g/d | 1 | 4837 | Risk Ratio (M‐H, Random, 95% CI) | 0.94 [0.69, 1.27] |
| 15.2 ALA high ≥ 5 g/d | 3 | 13782 | Risk Ratio (M‐H, Random, 95% CI) | 1.04 [0.62, 1.73] |
| 16 CVD mortality ‐ ALA ‐ subgroup by replacement Show forest plot | 4 | Risk Ratio (M‐H, Random, 95% CI) | Subtotals only | |
| 16.1 N‐3 replacing SFA | 0 | 0 | Risk Ratio (M‐H, Random, 95% CI) | 0.0 [0.0, 0.0] |
| 16.2 N‐3 replacing MUFA | 1 | 4837 | Risk Ratio (M‐H, Random, 95% CI) | 0.94 [0.69, 1.27] |
| 16.3 N‐3 replacing n‐6 | 2 | 13672 | Risk Ratio (M‐H, Random, 95% CI) | 1.01 [0.60, 1.70] |
| 16.4 N‐3 replacing carbohydrates/sugars | 0 | 0 | Risk Ratio (M‐H, Random, 95% CI) | 0.0 [0.0, 0.0] |
| 16.5 N‐3 replacing nil/low n‐3 placebo | 0 | 0 | Risk Ratio (M‐H, Random, 95% CI) | 0.0 [0.0, 0.0] |
| 16.6 Replacement unclear | 1 | 110 | Risk Ratio (M‐H, Random, 95% CI) | 2.69 [0.11, 64.74] |
| 17 CVD mortality ‐ ALA ‐ subgroup by intervention type Show forest plot | 4 | 18619 | Risk Ratio (M‐H, Random, 95% CI) | 0.96 [0.74, 1.25] |
| 17.1 Dietary advice | 0 | 0 | Risk Ratio (M‐H, Random, 95% CI) | 0.0 [0.0, 0.0] |
| 17.2 Supplemental foods | 3 | 5213 | Risk Ratio (M‐H, Random, 95% CI) | 0.95 [0.70, 1.28] |
| 17.3 Supplements (capsule) | 1 | 13406 | Risk Ratio (M‐H, Random, 95% CI) | 1.00 [0.58, 1.70] |
| 17.4 Any combination | 0 | 0 | Risk Ratio (M‐H, Random, 95% CI) | 0.0 [0.0, 0.0] |
| 18 CVD mortality ‐ ALA ‐ subgroup by duration Show forest plot | 4 | 18619 | Risk Ratio (M‐H, Random, 95% CI) | 0.96 [0.74, 1.25] |
| 18.1 Medium duration 1 to < 2 years in study | 2 | 13516 | Risk Ratio (M‐H, Random, 95% CI) | 1.02 [0.61, 1.73] |
| 18.2 Medium‐long duration: 2 to < 4 years in study | 2 | 5103 | Risk Ratio (M‐H, Random, 95% CI) | 0.94 [0.70, 1.27] |
| 18.3 Long duration: ≥ 4 years in study | 0 | 0 | Risk Ratio (M‐H, Random, 95% CI) | 0.0 [0.0, 0.0] |
| 19 CVD mortality ‐ ALA ‐ subgroup by primary or secondary prevention Show forest plot | 4 | 18619 | Risk Ratio (M‐H, Random, 95% CI) | 0.96 [0.74, 1.25] |
| 19.1 Primary prevention | 1 | 13406 | Risk Ratio (M‐H, Random, 95% CI) | 1.00 [0.58, 1.70] |
| 19.2 Secondary prevention | 3 | 5213 | Risk Ratio (M‐H, Random, 95% CI) | 0.95 [0.70, 1.28] |
| 20 CVD mortality ‐ ALA ‐ subgroup by statin uses Show forest plot | 4 | 18619 | Risk Ratio (M‐H, Random, 95% CI) | 0.96 [0.74, 1.25] |
| 20.1 ALA ‐ ≥ 50% of control group on statins | 2 | 4947 | Risk Ratio (M‐H, Random, 95% CI) | 0.94 [0.70, 1.28] |
| 20.2 ALA ‐ < 50% of control group on statins | 2 | 13672 | Risk Ratio (M‐H, Random, 95% CI) | 1.01 [0.60, 1.70] |
| 21 Cardiovascular events (overall) ‐ ALA Show forest plot | 5 | 19327 | Risk Ratio (M‐H, Random, 95% CI) | 0.95 [0.83, 1.07] |
| 22 CVD events ‐ ALA ‐ SA fixed‐effect Show forest plot | 5 | 19327 | Risk Ratio (M‐H, Fixed, 95% CI) | 0.95 [0.84, 1.07] |
| 23 CVD events ‐ ALA ‐ SA by summary risk of bias Show forest plot | 5 | 19327 | Risk Ratio (M‐H, Random, 95% CI) | 0.95 [0.83, 1.07] |
| 23.1 Low risk of bias | 3 | 5213 | Risk Ratio (M‐H, Random, 95% CI) | 0.91 [0.79, 1.04] |
| 23.2 Moderate/high risk of bias | 2 | 14114 | Risk Ratio (M‐H, Random, 95% CI) | 1.12 [0.84, 1.48] |
| 24 CVD events ‐ ALA ‐ SA by compliance and study size Show forest plot | 5 | Risk Ratio (M‐H, Random, 95% CI) | Subtotals only | |
| 24.1 SA ‐ low risk of compliance bias | 3 | 5811 | Risk Ratio (M‐H, Random, 95% CI) | 0.90 [0.79, 1.04] |
| 24.2 SA ‐ 100+ randomised | 5 | 19327 | Risk Ratio (M‐H, Random, 95% CI) | 0.95 [0.83, 1.07] |
| 25 CVD events ‐ ALA ‐ subgroup by dose Show forest plot | 5 | 19327 | Risk Ratio (M‐H, Random, 95% CI) | 0.95 [0.83, 1.07] |
| 25.1 ALA low < 5 g/d | 1 | 4837 | Risk Ratio (M‐H, Random, 95% CI) | 0.91 [0.79, 1.05] |
| 25.2 ALA high ≥ 5 g/d | 4 | 14490 | Risk Ratio (M‐H, Random, 95% CI) | 1.07 [0.82, 1.40] |
| 26 CVD events ‐ ALA ‐ subgroup by replacement Show forest plot | 5 | Risk Ratio (M‐H, Random, 95% CI) | Subtotals only | |
| 26.1 N‐3 replacing SFA | 0 | 0 | Risk Ratio (M‐H, Random, 95% CI) | 0.0 [0.0, 0.0] |
| 26.2 N‐3 replacing MUFA | 1 | 4837 | Risk Ratio (M‐H, Random, 95% CI) | 0.91 [0.79, 1.05] |
| 26.3 N‐3 replacing n‐6 | 2 | 13672 | Risk Ratio (M‐H, Random, 95% CI) | 0.76 [0.24, 2.41] |
| 26.4 N‐3 replacing carbohydrates/sugars | 0 | 0 | Risk Ratio (M‐H, Random, 95% CI) | 0.0 [0.0, 0.0] |
| 26.5 N‐3 replacing nil/low n‐3 placebo | 0 | 0 | Risk Ratio (M‐H, Random, 95% CI) | 0.0 [0.0, 0.0] |
| 26.6 Replacement unclear | 2 | 818 | Risk Ratio (M‐H, Random, 95% CI) | 0.93 [0.36, 2.43] |
| 27 CVD events ‐ ALA ‐ subgroup by intervention type Show forest plot | 6 | 19526 | Risk Ratio (M‐H, Random, 95% CI) | 0.95 [0.83, 1.07] |
| 27.1 Dietary advice | 0 | 0 | Risk Ratio (M‐H, Random, 95% CI) | 0.0 [0.0, 0.0] |
| 27.2 Supplemental foods | 5 | 6120 | Risk Ratio (M‐H, Random, 95% CI) | 0.91 [0.79, 1.04] |
| 27.3 Supplements (capsule) | 1 | 13406 | Risk Ratio (M‐H, Random, 95% CI) | 1.13 [0.85, 1.51] |
| 27.4 Any combination | 0 | 0 | Risk Ratio (M‐H, Random, 95% CI) | 0.0 [0.0, 0.0] |
| 28 CVD events ‐ ALA ‐ subgroup by duration Show forest plot | 5 | 19327 | Risk Ratio (M‐H, Random, 95% CI) | 0.95 [0.83, 1.07] |
| 28.1 Medium duration 1 to < 2 years in study | 2 | 13516 | Risk Ratio (M‐H, Random, 95% CI) | 1.13 [0.86, 1.50] |
| 28.2 Medium‐long duration: 2 to < 4 years in study | 3 | 5811 | Risk Ratio (M‐H, Random, 95% CI) | 0.90 [0.79, 1.04] |
| 28.3 Long duration: ≥ 4 years in study | 0 | 0 | Risk Ratio (M‐H, Random, 95% CI) | 0.0 [0.0, 0.0] |
| 29 CVD events ‐ ALA ‐ subgroup by primary or secondary prevention Show forest plot | 5 | 19327 | Risk Ratio (M‐H, Random, 95% CI) | 0.95 [0.83, 1.07] |
| 29.1 Primary prevention | 3 | 14380 | Risk Ratio (M‐H, Random, 95% CI) | 0.87 [0.46, 1.67] |
| 29.2 Secondary prevention | 2 | 4947 | Risk Ratio (M‐H, Random, 95% CI) | 0.92 [0.80, 1.05] |
| 30 CVD events ‐ ALA ‐ subgroup by statin use Show forest plot | 5 | 19327 | Risk Ratio (M‐H, Random, 95% CI) | 0.95 [0.83, 1.07] |
| 30.1 ALA ‐ ≥ 50% of control group on statins | 2 | 4947 | Risk Ratio (M‐H, Random, 95% CI) | 0.92 [0.80, 1.05] |
| 30.2 ALA ‐ < 50% of control group on statins | 3 | 14380 | Risk Ratio (M‐H, Random, 95% CI) | 0.87 [0.46, 1.67] |
| 31 Coronary heart disease mortality (overall) ‐ ALA Show forest plot | 3 | 18353 | Risk Ratio (M‐H, Random, 95% CI) | 0.95 [0.72, 1.26] |
| 32 CHD mortality ‐ ALA ‐ SA fixed‐effect Show forest plot | 3 | 18353 | Risk Ratio (M‐H, Fixed, 95% CI) | 0.95 [0.72, 1.26] |
| 33 CHD mortality ‐ ALA ‐ SA by summary risk of bias Show forest plot | 3 | 18353 | Risk Ratio (M‐H, Random, 95% CI) | 0.95 [0.72, 1.26] |
| 33.1 Low risk of bias | 2 | 4947 | Risk Ratio (M‐H, Random, 95% CI) | 0.93 [0.67, 1.30] |
| 33.2 Moderate/high risk of bias | 1 | 13406 | Risk Ratio (M‐H, Random, 95% CI) | 1.00 [0.58, 1.70] |
| 34 CHD mortality ‐ ALA ‐ SA by compliance and study size Show forest plot | 3 | Risk Ratio (M‐H, Random, 95% CI) | Subtotals only | |
| 34.1 SA ‐ low risk of compliance bias | 1 | 4837 | Risk Ratio (M‐H, Random, 95% CI) | 0.92 [0.66, 1.28] |
| 34.2 SA ‐ 100+ randomised | 3 | 18353 | Risk Ratio (M‐H, Random, 95% CI) | 0.95 [0.72, 1.26] |
| 35 CHD mortality ‐ ALA ‐ subgroup by dose Show forest plot | 3 | 18353 | Risk Ratio (M‐H, Random, 95% CI) | 0.95 [0.72, 1.26] |
| 35.1 ALA low < 5 g/d | 1 | 4837 | Risk Ratio (M‐H, Random, 95% CI) | 0.92 [0.66, 1.28] |
| 35.2 ALA high ≥ 5 g/d | 2 | 13516 | Risk Ratio (M‐H, Random, 95% CI) | 1.02 [0.61, 1.73] |
| 36 CHD mortality ‐ ALA ‐ subgroup by replacement Show forest plot | 3 | Risk Ratio (M‐H, Random, 95% CI) | Subtotals only | |
| 36.1 N‐3 replacing SFA | 0 | 0 | Risk Ratio (M‐H, Random, 95% CI) | 0.0 [0.0, 0.0] |
| 36.2 Coronary heart mortality‐ ALA | 0 | 0 | Risk Ratio (M‐H, Random, 95% CI) | 0.0 [0.0, 0.0] |
| 36.3 N‐3 replacing MUFA | 1 | 4837 | Risk Ratio (M‐H, Random, 95% CI) | 0.92 [0.66, 1.28] |
| 36.4 N‐3 replacing n‐6 | 1 | 13406 | Risk Ratio (M‐H, Random, 95% CI) | 1.00 [0.58, 1.70] |
| 36.5 N‐3 replacing carbohydrates/sugars | 0 | 0 | Risk Ratio (M‐H, Random, 95% CI) | 0.0 [0.0, 0.0] |
| 36.6 N‐3 replacing nil/low n‐3 placebo | 0 | 0 | Risk Ratio (M‐H, Random, 95% CI) | 0.0 [0.0, 0.0] |
| 36.7 Replacement unclear | 1 | 110 | Risk Ratio (M‐H, Random, 95% CI) | 2.69 [0.11, 64.74] |
| 37 CHD mortality ‐ ALA ‐ subgroup by intervention type Show forest plot | 3 | 18353 | Risk Ratio (M‐H, Random, 95% CI) | 0.95 [0.72, 1.26] |
| 37.1 Dietary advice | 0 | 0 | Risk Ratio (M‐H, Random, 95% CI) | 0.0 [0.0, 0.0] |
| 37.2 Supplemental foods | 2 | 4947 | Risk Ratio (M‐H, Random, 95% CI) | 0.93 [0.67, 1.30] |
| 37.3 Supplements (capsule) | 1 | 13406 | Risk Ratio (M‐H, Random, 95% CI) | 1.00 [0.58, 1.70] |
| 37.4 Any combination | 0 | 0 | Risk Ratio (M‐H, Random, 95% CI) | 0.0 [0.0, 0.0] |
| 38 CHD mortality ‐ ALA ‐ subgroup by duration Show forest plot | 3 | 18353 | Risk Ratio (M‐H, Random, 95% CI) | 0.95 [0.72, 1.26] |
| 38.1 Medium duration 1 to < 2 years in study | 2 | 13516 | Risk Ratio (M‐H, Random, 95% CI) | 1.02 [0.61, 1.73] |
| 38.2 Medium‐long duration: 2 to < 4 years in study | 1 | 4837 | Risk Ratio (M‐H, Random, 95% CI) | 0.92 [0.66, 1.28] |
| 38.3 Long duration: ≥ 4 years in study | 0 | 0 | Risk Ratio (M‐H, Random, 95% CI) | 0.0 [0.0, 0.0] |
| 39 CHD mortality ‐ ALA ‐ subgroup by primary or secondary prevention Show forest plot | 3 | 18353 | Risk Ratio (M‐H, Random, 95% CI) | 0.95 [0.72, 1.26] |
| 39.1 Primary prevention of CVD | 1 | 13406 | Risk Ratio (M‐H, Random, 95% CI) | 1.00 [0.58, 1.70] |
| 39.2 Secondary prevention of CVD | 2 | 4947 | Risk Ratio (M‐H, Random, 95% CI) | 0.93 [0.67, 1.30] |
| 40 CHD mortality ‐ ALA ‐ subgroup by statin use Show forest plot | 3 | 18353 | Risk Ratio (M‐H, Random, 95% CI) | 0.95 [0.72, 1.26] |
| 40.1 ALA ‐ ≥ 50% of control group on statins | 2 | 4947 | Risk Ratio (M‐H, Random, 95% CI) | 0.93 [0.67, 1.30] |
| 40.2 ALA ‐ < 50% of control group on statins | 1 | 13406 | Risk Ratio (M‐H, Random, 95% CI) | 1.00 [0.58, 1.70] |
| 41 CHD mortality ‐ ALA ‐ subgroup by CAD history Show forest plot | 3 | 18353 | Risk Ratio (M‐H, Random, 95% CI) | 0.95 [0.72, 1.26] |
| 41.1 Previous CAD | 1 | 4837 | Risk Ratio (M‐H, Random, 95% CI) | 0.92 [0.66, 1.28] |
| 41.2 No previous CAD | 2 | 13516 | Risk Ratio (M‐H, Random, 95% CI) | 1.02 [0.61, 1.73] |
| 42 Coronary heart disease events (overall) ‐ ALA Show forest plot | 4 | 19061 | Risk Ratio (M‐H, Random, 95% CI) | 1.00 [0.82, 1.22] |
| 43 CHD events ‐ ALA ‐ SA fixed‐effect Show forest plot | 4 | 19061 | Risk Ratio (M‐H, Fixed, 95% CI) | 1.00 [0.82, 1.21] |
| 44 CHD events ‐ ALA ‐ SA by summary risk of bias Show forest plot | 4 | 19061 | Risk Ratio (M‐H, Random, 95% CI) | 1.00 [0.82, 1.22] |
| 44.1 Low risk of bias | 2 | 4947 | Risk Ratio (M‐H, Random, 95% CI) | 0.91 [0.71, 1.15] |
| 44.2 Moderate/high risk of bias | 2 | 14114 | Risk Ratio (M‐H, Random, 95% CI) | 1.20 [0.86, 1.67] |
| 45 CHD events ‐ ALA ‐ SA by compliance and study size Show forest plot | 4 | Risk Ratio (M‐H, Random, 95% CI) | Subtotals only | |
| 45.1 SA ‐ low risk of compliance bias | 2 | 5545 | Risk Ratio (M‐H, Random, 95% CI) | 0.92 [0.73, 1.17] |
| 45.2 SA ‐ 100+ randomised | 4 | 19061 | Risk Ratio (M‐H, Random, 95% CI) | 1.00 [0.82, 1.22] |
| 46 CHD events ‐ ALA ‐ subgroup by dose Show forest plot | 4 | 19061 | Risk Ratio (M‐H, Random, 95% CI) | 1.00 [0.82, 1.22] |
| 46.1 ALA low < 5 g/d | 1 | 4837 | Risk Ratio (M‐H, Random, 95% CI) | 0.92 [0.72, 1.17] |
| 46.2 ALA high ≥ 5 g/d | 3 | 14224 | Risk Ratio (M‐H, Random, 95% CI) | 1.16 [0.84, 1.61] |
| 47 CHD events ‐ ALA ‐ subgroup by replacement Show forest plot | 4 | Risk Ratio (M‐H, Random, 95% CI) | Subtotals only | |
| 47.1 N‐3 replacing SFA | 0 | 0 | Risk Ratio (M‐H, Random, 95% CI) | 0.0 [0.0, 0.0] |
| 47.2 N‐3 replacing MUFA | 1 | 4837 | Risk Ratio (M‐H, Random, 95% CI) | 0.92 [0.72, 1.17] |
| 47.3 N‐3 replacing n‐6 | 1 | 13406 | Risk Ratio (M‐H, Random, 95% CI) | 1.19 [0.85, 1.65] |
| 47.4 N‐3 replacing carbohydrates/sugars | 0 | 0 | Risk Ratio (M‐H, Random, 95% CI) | 0.0 [0.0, 0.0] |
| 47.5 N‐3 replacing nil/low n‐3 placebo | 0 | 0 | Risk Ratio (M‐H, Random, 95% CI) | 0.0 [0.0, 0.0] |
| 47.6 Replacement unclear | 2 | 818 | Risk Ratio (M‐H, Random, 95% CI) | 0.69 [0.08, 5.81] |
| 48 CHD events ‐ ALA ‐ subgroup by intervention type Show forest plot | 4 | 19061 | Risk Ratio (M‐H, Random, 95% CI) | 1.00 [0.82, 1.22] |
| 48.1 Dietary advice | 0 | 0 | Risk Ratio (M‐H, Random, 95% CI) | 0.0 [0.0, 0.0] |
| 48.2 Supplemental foods | 3 | 5655 | Risk Ratio (M‐H, Random, 95% CI) | 0.91 [0.72, 1.16] |
| 48.3 Supplements (capsule) | 1 | 13406 | Risk Ratio (M‐H, Random, 95% CI) | 1.19 [0.85, 1.65] |
| 48.4 Any combination | 0 | 0 | Risk Ratio (M‐H, Random, 95% CI) | 0.0 [0.0, 0.0] |
| 49 CHD events ‐ ALA ‐ subgroup by duration Show forest plot | 4 | 19061 | Risk Ratio (M‐H, Random, 95% CI) | 1.00 [0.82, 1.22] |
| 49.1 Medium duration 1 to < 2 years in study | 2 | 13516 | Risk Ratio (M‐H, Random, 95% CI) | 0.94 [0.34, 2.58] |
| 49.2 Medium‐long duration: 2 to < 4 years in study | 2 | 5545 | Risk Ratio (M‐H, Random, 95% CI) | 0.92 [0.73, 1.17] |
| 49.3 Long duration: ≥ 4 years in study | 0 | 0 | Risk Ratio (M‐H, Random, 95% CI) | 0.0 [0.0, 0.0] |
| 50 CHD events ‐ ALA ‐ subgroup by primary or secondary prevention Show forest plot | 4 | 19061 | Risk Ratio (M‐H, Random, 95% CI) | 1.00 [0.82, 1.22] |
| 50.1 Primary prevention | 2 | 14114 | Risk Ratio (M‐H, Random, 95% CI) | 1.20 [0.86, 1.67] |
| 50.2 Secondary prevention | 2 | 4947 | Risk Ratio (M‐H, Random, 95% CI) | 0.91 [0.71, 1.15] |
| 51 CHD events ‐ ALA ‐ subgroup by statin use Show forest plot | 4 | 19061 | Risk Ratio (M‐H, Random, 95% CI) | 1.00 [0.82, 1.22] |
| 51.1 ALA ‐ ≥ 50% of control group on statins | 2 | 4947 | Risk Ratio (M‐H, Random, 95% CI) | 0.91 [0.71, 1.15] |
| 51.2 ALA ‐ < 50% of control group on statins | 2 | 14114 | Risk Ratio (M‐H, Random, 95% CI) | 1.20 [0.86, 1.67] |
| 52 CHD events ‐ ALA ‐ subgroup by CAD history Show forest plot | 4 | 19061 | Risk Ratio (M‐H, Random, 95% CI) | 1.00 [0.82, 1.22] |
| 52.1 Previous CAD | 1 | 4837 | Risk Ratio (M‐H, Random, 95% CI) | 0.92 [0.72, 1.17] |
| 52.2 No previous CAD | 3 | 14224 | Risk Ratio (M‐H, Random, 95% CI) | 1.16 [0.84, 1.61] |
| 53 Stroke (overall) ‐ ALA Show forest plot | 5 | 19327 | Risk Ratio (M‐H, Random, 95% CI) | 1.15 [0.66, 2.01] |
| 54 Stroke ‐ ALA ‐ SA fixed‐effect Show forest plot | 5 | 19327 | Risk Ratio (M‐H, Fixed, 95% CI) | 1.23 [0.71, 2.13] |
| 55 Stroke ‐ ALA ‐ SA by summary risk of bias Show forest plot | 5 | 19327 | Risk Ratio (M‐H, Random, 95% CI) | 1.15 [0.66, 2.01] |
| 55.1 Low risk of bias | 3 | 5213 | Risk Ratio (M‐H, Random, 95% CI) | 0.97 [0.45, 2.09] |
| 55.2 Moderate/high risk of bias | 2 | 14114 | Risk Ratio (M‐H, Random, 95% CI) | 1.39 [0.62, 3.13] |
| 56 Stroke ‐ ALA ‐ SA by compliance and study size Show forest plot | 5 | 25138 | Risk Ratio (M‐H, Random, 95% CI) | 1.04 [0.66, 1.64] |
| 56.1 SA ‐ low risk of compliance bias | 3 | 5811 | Risk Ratio (M‐H, Random, 95% CI) | 0.85 [0.39, 1.87] |
| 56.2 SA ‐ 100+ randomised | 5 | 19327 | Risk Ratio (M‐H, Random, 95% CI) | 1.15 [0.66, 2.01] |
| 57 Stroke ‐ ALA ‐ subgroup by dose Show forest plot | 5 | Risk Ratio (M‐H, Random, 95% CI) | Subtotals only | |
| 57.1 ALA low < 5 g/d | 1 | 4837 | Risk Ratio (M‐H, Random, 95% CI) | 0.92 [0.39, 2.15] |
| 57.2 ALA high ≥ 5 g/d | 4 | 14490 | Risk Ratio (M‐H, Random, 95% CI) | 1.36 [0.65, 2.85] |
| 58 Stroke ‐ ALA ‐ subgroup by replacement Show forest plot | 5 | Risk Ratio (M‐H, Random, 95% CI) | Subtotals only | |
| 58.1 N‐3 replacing SFA | 0 | 0 | Risk Ratio (M‐H, Random, 95% CI) | 0.0 [0.0, 0.0] |
| 58.2 N‐3 replacing MUFA | 1 | 4837 | Risk Ratio (M‐H, Random, 95% CI) | 0.92 [0.39, 2.15] |
| 58.3 N‐3 replacing n‐6 | 2 | 13672 | Risk Ratio (M‐H, Random, 95% CI) | 1.26 [0.53, 3.01] |
| 58.4 N‐3 replacing carbohydrates/sugars | 0 | 0 | Risk Ratio (M‐H, Random, 95% CI) | 0.0 [0.0, 0.0] |
| 58.5 N‐3 replacing nil/low n‐3 placebo | 0 | 0 | Risk Ratio (M‐H, Random, 95% CI) | 0.0 [0.0, 0.0] |
| 58.6 Replacement unclear | 2 | 818 | Risk Ratio (M‐H, Random, 95% CI) | 1.79 [0.31, 10.17] |
| 59 Stroke ‐ ALA ‐ subgroup by intervention type Show forest plot | 5 | 19327 | Risk Ratio (M‐H, Random, 95% CI) | 1.15 [0.66, 2.01] |
| 59.1 Dietary advice | 0 | 0 | Risk Ratio (M‐H, Random, 95% CI) | 0.0 [0.0, 0.0] |
| 59.2 Supplemental foods | 4 | 5921 | Risk Ratio (M‐H, Random, 95% CI) | 0.97 [0.46, 2.03] |
| 59.3 Supplements (capsule) | 1 | 13406 | Risk Ratio (M‐H, Random, 95% CI) | 1.44 [0.62, 3.36] |
| 59.4 Any combination | 0 | 0 | Risk Ratio (M‐H, Random, 95% CI) | 0.0 [0.0, 0.0] |
| 60 Stroke ‐ ALA ‐ subgroup by duration Show forest plot | 5 | 19327 | Risk Ratio (M‐H, Random, 95% CI) | 1.15 [0.66, 2.01] |
| 60.1 Medium duration 1 to < 2 years in study | 2 | 13516 | Risk Ratio (M‐H, Random, 95% CI) | 1.56 [0.70, 3.44] |
| 60.2 Medium‐long duration: 2 to < 4 years in study | 3 | 5811 | Risk Ratio (M‐H, Random, 95% CI) | 0.85 [0.39, 1.87] |
| 60.3 Long duration: ≥ 4 years in study | 0 | 0 | Risk Ratio (M‐H, Random, 95% CI) | 0.0 [0.0, 0.0] |
| 61 Stroke ‐ ALA ‐ subgroup by primary or secondary prevention Show forest plot | 5 | 19327 | Risk Ratio (M‐H, Random, 95% CI) | 1.15 [0.66, 2.01] |
| 61.1 Primary prevention | 3 | 14380 | Risk Ratio (M‐H, Random, 95% CI) | 1.25 [0.57, 2.74] |
| 61.2 Secondary prevention | 2 | 4947 | Risk Ratio (M‐H, Random, 95% CI) | 1.05 [0.47, 2.34] |
| 62 Stroke ‐ ALA ‐ subgroup by statin use Show forest plot | 5 | 19327 | Risk Ratio (M‐H, Random, 95% CI) | 1.25 [0.71, 2.18] |
| 62.1 ALA ‐ ≥ 50% of control group on statins | 2 | 4947 | Risk Ratio (M‐H, Random, 95% CI) | 1.25 [0.56, 2.77] |
| 62.2 ALA ‐ < 50% of control group on statins | 3 | 14380 | Risk Ratio (M‐H, Random, 95% CI) | 1.25 [0.57, 2.74] |
| 63 Stroke ‐ ALA ‐ subgroup by stroke type Show forest plot | 3 | 13782 | Risk Ratio (M‐H, Random, 95% CI) | 1.40 [0.65, 3.01] |
| 63.1 Ischaemic stroke ‐ ALA | 3 | 13782 | Risk Ratio (M‐H, Random, 95% CI) | 1.40 [0.65, 3.01] |
| 63.2 Haemorrhagic stroke ‐ ALA | 0 | 0 | Risk Ratio (M‐H, Random, 95% CI) | 0.0 [0.0, 0.0] |
| 64 Arrythmia (overall) ‐ ALA Show forest plot | 1 | 4837 | Risk Ratio (M‐H, Random, 95% CI) | 0.79 [0.57, 1.10] |
| 64.1 ALA ‐ new arrhythmias | 1 | 4837 | Risk Ratio (M‐H, Random, 95% CI) | 0.79 [0.57, 1.10] |
| 64.2 ALA ‐ recurrent arrhythmias | 0 | 0 | Risk Ratio (M‐H, Random, 95% CI) | 0.0 [0.0, 0.0] |
| 65 Arrhythmia ‐ ALA ‐ SA by summary risk of bias Show forest plot | 1 | 4837 | Risk Ratio (M‐H, Random, 95% CI) | 0.79 [0.57, 1.10] |
| 65.1 Low risk of bias | 1 | 4837 | Risk Ratio (M‐H, Random, 95% CI) | 0.79 [0.57, 1.10] |
| 65.2 Moderate/high risk of bias | 0 | 0 | Risk Ratio (M‐H, Random, 95% CI) | 0.0 [0.0, 0.0] |
| Outcome or subgroup title | No. of studies | No. of participants | Statistical method | Effect size |
| 1 MACCEs ‐ ALA Show forest plot | 1 | 110 | Risk Ratio (M‐H, Random, 95% CI) | 1.12 [0.32, 3.95] |
| 2 Myocardial infarction (overall) ‐ ALA Show forest plot | 3 | 18353 | Risk Ratio (M‐H, Random, 95% CI) | 1.00 [0.76, 1.32] |
| 3 Total MI ‐ ALA ‐ subgroup by fatality Show forest plot | 3 | Risk Ratio (M‐H, Random, 95% CI) | Subtotals only | |
| 3.1 Fatal MI | 2 | 4947 | Risk Ratio (M‐H, Random, 95% CI) | 0.95 [0.62, 1.46] |
| 3.2 Non‐fatal MI | 3 | 5213 | Risk Ratio (M‐H, Random, 95% CI) | 0.52 [0.15, 1.77] |
| 4 Angina ‐ ALA Show forest plot | 2 | 13516 | Risk Ratio (M‐H, Random, 95% CI) | 1.41 [0.75, 2.64] |
| 5 Revascularisation ‐ ALA Show forest plot | 1 | Risk Ratio (M‐H, Random, 95% CI) | Subtotals only | |
| 5.1 CABG ‐ ALA | 1 | 266 | Risk Ratio (M‐H, Random, 95% CI) | 0.29 [0.01, 5.93] |
| 5.2 Angioplasty ‐ ALA | 0 | 0 | Risk Ratio (M‐H, Random, 95% CI) | 0.0 [0.0, 0.0] |
| 5.3 Any revascularisation ‐ ALA | 1 | 266 | Risk Ratio (M‐H, Random, 95% CI) | 0.72 [0.07, 7.84] |
| 6 Peripheral arterial disease ‐ ALA Show forest plot | 1 | Risk Ratio (M‐H, Random, 95% CI) | Subtotals only | |
| 7 Body weight, kg ‐ ALA Show forest plot | 4 | 664 | Mean Difference (IV, Random, 95% CI) | ‐1.49 [‐4.17, 1.18] |
| 8 Weight, kg ‐ ALA ‐ sensitivity analysis (SA) fixed‐effect Show forest plot | 4 | 664 | Mean Difference (IV, Fixed, 95% CI) | 0.17 [‐0.61, 0.96] |
| 9 Weight, kg ‐ ALA ‐ SA by summary risk of bias Show forest plot | 4 | Mean Difference (IV, Random, 95% CI) | Subtotals only | |
| 9.1 Low risk of bias | 0 | 0 | Mean Difference (IV, Random, 95% CI) | 0.0 [0.0, 0.0] |
| 9.2 Moderate/high risk of bias | 4 | 664 | Mean Difference (IV, Random, 95% CI) | ‐1.49 [‐4.17, 1.18] |
| 10 Weight, kg ‐ ALA ‐ SA by compliance and study size Show forest plot | 3 | Mean Difference (IV, Random, 95% CI) | Subtotals only | |
| 10.1 SA ‐ low risk of compliance bias | 3 | 629 | Mean Difference (IV, Random, 95% CI) | ‐1.59 [‐4.47, 1.30] |
| 10.2 SA ‐ 100+ randomised | 3 | 629 | Mean Difference (IV, Random, 95% CI) | ‐1.59 [‐4.47, 1.30] |
| 11 Weight, kg ‐ ALA ‐ subgroup by dose Show forest plot | 4 | Mean Difference (IV, Random, 95% CI) | Subtotals only | |
| 11.1 ALA low < 5 g/d | 3 | 485 | Mean Difference (IV, Random, 95% CI) | ‐0.71 [‐3.31, 1.90] |
| 11.2 ALA high > 5 g/d | 1 | 179 | Mean Difference (IV, Random, 95% CI) | ‐4.20 [‐7.61, ‐0.79] |
| 12 Weight, kg ‐ ALA ‐ subgroup by intervention type Show forest plot | 4 | Mean Difference (IV, Random, 95% CI) | Subtotals only | |
| 12.1 Dietary advice | 0 | 0 | Mean Difference (IV, Random, 95% CI) | 0.0 [0.0, 0.0] |
| 12.2 Supplemental foods | 3 | 526 | Mean Difference (IV, Random, 95% CI) | ‐1.23 [‐5.27, 2.80] |
| 12.3 Supplement (capsule) | 0 | 0 | Mean Difference (IV, Random, 95% CI) | 0.0 [0.0, 0.0] |
| 12.4 Any combination | 1 | 138 | Mean Difference (IV, Random, 95% CI) | ‐1.98 [‐5.89, 1.92] |
| 13 Weight, kg ‐ ALA ‐ subgroup by replacement Show forest plot | 4 | Mean Difference (IV, Random, 95% CI) | Subtotals only | |
| 13.1 ALA replacing SFA | 0 | 0 | Mean Difference (IV, Random, 95% CI) | 0.0 [0.0, 0.0] |
| 13.2 ALA replacing MUFA | 1 | 138 | Mean Difference (IV, Random, 95% CI) | ‐1.98 [‐5.89, 1.92] |
| 13.3 ALA replacing n‐6 | 0 | 0 | Mean Difference (IV, Random, 95% CI) | 0.0 [0.0, 0.0] |
| 13.4 ALA replacing carbs/sugars | 0 | 0 | Mean Difference (IV, Random, 95% CI) | 0.0 [0.0, 0.0] |
| 13.5 ALA replacing nil/low n‐3 placebo | 1 | 35 | Mean Difference (IV, Random, 95% CI) | ‐0.30 [‐10.57, 9.97] |
| 13.6 Replacement unclear | 2 | 491 | Mean Difference (IV, Random, 95% CI) | ‐1.43 [‐6.26, 3.39] |
| 14 Weight, kg ‐ ALA ‐ subgroup by duration Show forest plot | 4 | Mean Difference (IV, Random, 95% CI) | Subtotals only | |
| 14.1 Medium duration 1 to < 2 years in study | 4 | 664 | Mean Difference (IV, Random, 95% CI) | ‐1.49 [‐4.17, 1.18] |
| 14.2 Medium‐long duration: 2 to < 4 years in study | 0 | 0 | Mean Difference (IV, Random, 95% CI) | 0.0 [0.0, 0.0] |
| 14.3 Long duration ≥ 4 years in study | 0 | 0 | Mean Difference (IV, Random, 95% CI) | 0.0 [0.0, 0.0] |
| 15 Weight, kg ‐ ALA ‐ subgroup by statin use Show forest plot | 4 | Mean Difference (IV, Random, 95% CI) | Subtotals only | |
| 15.1 ALA ‐ ≥ 50% of control group on statins | 1 | 35 | Mean Difference (IV, Random, 95% CI) | ‐0.30 [‐10.57, 9.97] |
| 15.2 ALA ‐ < 50% of control group on statins | 1 | 138 | Mean Difference (IV, Random, 95% CI) | ‐1.98 [‐5.89, 1.92] |
| 15.3 ALA ‐ use of statins unclear | 2 | 491 | Mean Difference (IV, Random, 95% CI) | ‐1.43 [‐6.26, 3.39] |
| 16 Weight, kg ‐ ALA ‐ subgroup by primary or secondary prevention Show forest plot | 4 | Mean Difference (IV, Random, 95% CI) | Subtotals only | |
| 16.1 Low CVD risk | 3 | 629 | Mean Difference (IV, Random, 95% CI) | ‐1.59 [‐4.47, 1.30] |
| 16.2 Moderate CVD risk | 1 | 35 | Mean Difference (IV, Random, 95% CI) | ‐0.30 [‐10.57, 9.97] |
| 16.3 High CVD risk | 0 | 0 | Mean Difference (IV, Random, 95% CI) | 0.0 [0.0, 0.0] |
| 17 Body mass index, kg/m² ‐ ALA Show forest plot | 3 | 1581 | Mean Difference (IV, Random, 95% CI) | ‐0.42 [‐1.53, 0.69] |
| 18 BMI, kg/m² ‐ ALA ‐ SA fixed‐effect Show forest plot | 3 | 1581 | Mean Difference (IV, Fixed, 95% CI) | 0.12 [‐0.06, 0.30] |
| 19 BMI, kg/m² ‐ ALA ‐ SA by summary risk of bias Show forest plot | 3 | Mean Difference (IV, Random, 95% CI) | Subtotals only | |
| 19.1 Low risk of bias | 2 | 1402 | Mean Difference (IV, Random, 95% CI) | 0.15 [‐0.04, 0.33] |
| 19.2 Moderate/high risk of bias | 1 | 179 | Mean Difference (IV, Random, 95% CI) | ‐1.5 [‐2.86, ‐0.14] |
| 20 BMI, kg/m² ‐ ALA ‐ SA by compliance and study size Show forest plot | 3 | Mean Difference (IV, Random, 95% CI) | Subtotals only | |
| 20.1 SA ‐ low risk of compliance bias | 3 | 1581 | Mean Difference (IV, Random, 95% CI) | ‐0.42 [‐1.53, 0.69] |
| 20.2 SA ‐ 100+ randomised | 3 | 1581 | Mean Difference (IV, Random, 95% CI) | ‐0.42 [‐1.53, 0.69] |
| 21 BMI, kg/m² ‐ ALA ‐ subgroup by dose Show forest plot | 3 | Mean Difference (IV, Random, 95% CI) | Subtotals only | |
| 21.1 ALA low < 5 g/d | 1 | 1260 | Mean Difference (IV, Random, 95% CI) | 0.15 [‐0.03, 0.33] |
| 21.2 ALA high > 5 g/d | 2 | 321 | Mean Difference (IV, Random, 95% CI) | ‐1.12 [‐2.24, 0.01] |
| 22 BMI, kg/m² ‐ ALA ‐ subgroup by intervention type Show forest plot | 3 | Mean Difference (IV, Random, 95% CI) | Subtotals only | |
| 22.1 Dietary advice | 0 | 0 | Mean Difference (IV, Random, 95% CI) | 0.0 [0.0, 0.0] |
| 22.2 Supplemental foods | 3 | 1581 | Mean Difference (IV, Random, 95% CI) | ‐0.42 [‐1.53, 0.69] |
| 22.3 Supplement (capsule) | 0 | 0 | Mean Difference (IV, Random, 95% CI) | 0.0 [0.0, 0.0] |
| 22.4 Any combination | 0 | 0 | Mean Difference (IV, Random, 95% CI) | 0.0 [0.0, 0.0] |
| 23 BMI, kg/m² ‐ ALA ‐ subgroup by replacement Show forest plot | 3 | 1581 | Mean Difference (IV, Random, 95% CI) | ‐0.42 [‐1.53, 0.69] |
| 23.1 ALA replacing SFA | 0 | 0 | Mean Difference (IV, Random, 95% CI) | 0.0 [0.0, 0.0] |
| 23.2 ALA replacing MUFA | 1 | 1260 | Mean Difference (IV, Random, 95% CI) | 0.15 [‐0.03, 0.33] |
| 23.3 ALA replacing n‐6 | 1 | 142 | Mean Difference (IV, Random, 95% CI) | ‐0.3 [‐2.29, 1.69] |
| 23.4 ALA replacing carbs/sugars | 0 | 0 | Mean Difference (IV, Random, 95% CI) | 0.0 [0.0, 0.0] |
| 23.5 ALA replacing nil/low n‐3 placebo | 0 | 0 | Mean Difference (IV, Random, 95% CI) | 0.0 [0.0, 0.0] |
| 23.6 Replacement unclear | 1 | 179 | Mean Difference (IV, Random, 95% CI) | ‐1.5 [‐2.86, ‐0.14] |
| 24 BMI, kg/m² ‐ ALA ‐ subgroup by duration Show forest plot | 3 | Mean Difference (IV, Random, 95% CI) | Subtotals only | |
| 24.1 Medium duration 1 to < 2 years in study | 1 | 179 | Mean Difference (IV, Random, 95% CI) | ‐1.5 [‐2.86, ‐0.14] |
| 24.2 Medium‐long duration: 2 to < 4 years in study | 2 | 1402 | Mean Difference (IV, Random, 95% CI) | 0.15 [‐0.04, 0.33] |
| 24.3 Long duration ≥ 4 years in study | 0 | 0 | Mean Difference (IV, Random, 95% CI) | 0.0 [0.0, 0.0] |
| 25 BMI, kg/m² ‐ ALA ‐ subgroup by statin use Show forest plot | 3 | Mean Difference (IV, Random, 95% CI) | Subtotals only | |
| 25.1 ALA ‐ ≥ 50% of control group on statins | 1 | 1260 | Mean Difference (IV, Random, 95% CI) | 0.15 [‐0.03, 0.33] |
| 25.2 ALA ‐ < 50% of control group on statins | 1 | 142 | Mean Difference (IV, Random, 95% CI) | ‐0.3 [‐2.29, 1.69] |
| 25.3 ALA ‐ use of statins unclear | 1 | 179 | Mean Difference (IV, Random, 95% CI) | ‐1.5 [‐2.86, ‐0.14] |
| 26 BMI, kg/m² ‐ ALA ‐ subgroup by primary or secondary preventionA Show forest plot | 3 | Mean Difference (IV, Random, 95% CI) | Subtotals only | |
| 26.1 Primary prevention of CVD | 2 | 321 | Mean Difference (IV, Random, 95% CI) | ‐1.12 [‐2.24, 0.01] |
| 26.2 Secondary prevention of CVD | 1 | 1260 | Mean Difference (IV, Random, 95% CI) | 0.15 [‐0.03, 0.33] |
| 27 Other measures of adiposity ‐ ALA Show forest plot | 4 | Mean Difference (IV, Fixed, 95% CI) | Subtotals only | |
| 27.1 Visceral adipose tissue, cm² | 1 | 35 | Mean Difference (IV, Fixed, 95% CI) | 27.0 [‐21.28, 75.28] |
| 27.2 Subcutaneous adipose tissue, cm² | 1 | 35 | Mean Difference (IV, Fixed, 95% CI) | 0.0 [0.0, 0.0] |
| 27.3 Waist circumference, cm | 3 | 629 | Mean Difference (IV, Fixed, 95% CI) | ‐1.59 [‐3.10, ‐0.07] |
| 28 Total cholesterol, serum, mmoL/L ‐ ALA Show forest plot | 6 | 2164 | Mean Difference (IV, Random, 95% CI) | ‐0.09 [‐0.23, 0.05] |
| 29 TC, mmoL/L ‐ ALA ‐ SA fixed‐effect Show forest plot | 6 | 2164 | Mean Difference (IV, Fixed, 95% CI) | ‐0.10 [‐0.17, ‐0.03] |
| 30 TC, mmoL/L ‐ ALA ‐ SA by summary risk of bias Show forest plot | 6 | Mean Difference (IV, Random, 95% CI) | Subtotals only | |
| 30.1 Low risk of bias | 3 | 1436 | Mean Difference (IV, Random, 95% CI) | 0.00 [‐0.13, 0.14] |
| 30.2 Moderate/high risk of bias | 3 | 728 | Mean Difference (IV, Random, 95% CI) | ‐0.19 [‐0.36, ‐0.01] |
| 31 TC, mmoL/L ‐ ALA ‐ SA by compliance and study size Show forest plot | 4 | Mean Difference (IV, Random, 95% CI) | Subtotals only | |
| 31.1 SA ‐ low risk of compliance bias | 4 | 2045 | Mean Difference (IV, Random, 95% CI) | ‐0.10 [‐0.25, 0.05] |
| 31.2 SA ‐ 100+ randomised | 4 | 2045 | Mean Difference (IV, Random, 95% CI) | ‐0.10 [‐0.25, 0.05] |
| 32 TC, mmoL/L ‐ ALA ‐ subgroup by dose Show forest plot | 6 | Mean Difference (IV, Random, 95% CI) | Subtotals only | |
| 32.1 ALA low < 5 g/d | 3 | 1759 | Mean Difference (IV, Random, 95% CI) | ‐0.07 [‐0.24, 0.09] |
| 32.2 ALA high > 5 g/d | 3 | 405 | Mean Difference (IV, Random, 95% CI) | ‐0.13 [‐0.47, 0.21] |
| 33 TC, mmoL/L ‐ ALA ‐ subgroup by intervention type Show forest plot | 6 | Mean Difference (IV, Random, 95% CI) | Subtotals only | |
| 33.1 Dietary advice | 0 | 0 | Mean Difference (IV, Random, 95% CI) | 0.0 [0.0, 0.0] |
| 33.2 Supplemental foods | 6 | 2164 | Mean Difference (IV, Random, 95% CI) | ‐0.09 [‐0.23, 0.05] |
| 33.3 Supplement (capsule) | 0 | 0 | Mean Difference (IV, Random, 95% CI) | 0.0 [0.0, 0.0] |
| 33.4 Any combination | 0 | 0 | Mean Difference (IV, Random, 95% CI) | 0.0 [0.0, 0.0] |
| 34 TC, mmoL/L ‐ ALA ‐ subgroup by replacement Show forest plot | 6 | Mean Difference (IV, Random, 95% CI) | Subtotals only | |
| 34.1 ALA replacing SFA | 0 | 0 | Mean Difference (IV, Random, 95% CI) | 0.0 [0.0, 0.0] |
| 34.2 ALA replacing MUFA | 1 | 1210 | Mean Difference (IV, Random, 95% CI) | ‐0.02 [‐0.13, 0.09] |
| 34.3 ALA replacing n‐6 | 1 | 142 | Mean Difference (IV, Random, 95% CI) | 0.14 [‐0.10, 0.38] |
| 34.4 ALA replacing carbs/sugars | 0 | 0 | Mean Difference (IV, Random, 95% CI) | 0.0 [0.0, 0.0] |
| 34.5 ALA replacing nil/low n‐3 placebo | 1 | 35 | Mean Difference (IV, Random, 95% CI) | 0.30 [‐0.30, 0.90] |
| 34.6 Replacement unclear | 3 | 777 | Mean Difference (IV, Random, 95% CI) | ‐0.21 [‐0.31, ‐0.11] |
| 35 TC, mmoL/L ‐ ALA ‐ subgroup by duration Show forest plot | 6 | Mean Difference (IV, Random, 95% CI) | Subtotals only | |
| 35.1 Medium duration 1 to < 2 years in study | 4 | 812 | Mean Difference (IV, Random, 95% CI) | ‐0.20 [‐0.33, ‐0.07] |
| 35.2 Medium‐long duration: 2 to < 4 years in study | 2 | 1352 | Mean Difference (IV, Random, 95% CI) | 0.02 [‐0.12, 0.16] |
| 35.3 Long duration ≥ 4 years in study | 0 | 0 | Mean Difference (IV, Random, 95% CI) | 0.0 [0.0, 0.0] |
| 36 TC, mmoL/L ‐ ALA ‐ subgroup by statin use Show forest plot | 6 | Mean Difference (IV, Random, 95% CI) | Subtotals only | |
| 36.1 ALA ‐ ≥ 50% of control group on statins | 3 | 1329 | Mean Difference (IV, Random, 95% CI) | ‐0.02 [‐0.15, 0.11] |
| 36.2 ALA ‐ < 50% of control group on statins | 1 | 142 | Mean Difference (IV, Random, 95% CI) | 0.14 [‐0.10, 0.38] |
| 36.3 ALA ‐ use of statins unclear | 2 | 693 | Mean Difference (IV, Random, 95% CI) | ‐0.21 [‐0.30, ‐0.11] |
| 37 TC, mmoL/L ‐ ALA ‐ subgroup by primary or secondary preventionA Show forest plot | 6 | Mean Difference (IV, Random, 95% CI) | Subtotals only | |
| 37.1 Primary prevention of CVD | 4 | 870 | Mean Difference (IV, Random, 95% CI) | ‐0.09 [‐0.30, 0.12] |
| 37.2 Secondary prevention of CVD | 2 | 1294 | Mean Difference (IV, Random, 95% CI) | ‐0.03 [‐0.14, 0.08] |
| 38 Triglycerides, fasting, serum, mmoL/L ‐ ALA Show forest plot | 6 | 1776 | Mean Difference (IV, Random, 95% CI) | ‐0.03 [‐0.11, 0.05] |
| 39 TG, fasting, mmoL/L ‐ ALA ‐ SA fixed‐effect Show forest plot | 6 | 1776 | Mean Difference (IV, Fixed, 95% CI) | ‐0.03 [‐0.11, 0.05] |
| 40 TG, fasting, mmoL/L‐ ALA ‐ SA by summary risk of bias Show forest plot | 6 | Mean Difference (IV, Random, 95% CI) | Subtotals only | |
| 40.1 Low risk of bias | 3 | 1436 | Mean Difference (IV, Random, 95% CI) | 0.03 [‐0.13, 0.19] |
| 40.2 Moderate/high risk of bias | 3 | 340 | Mean Difference (IV, Random, 95% CI) | ‐0.05 [‐0.18, 0.09] |
| 41 TG, fasting, mmoL/L‐ ALA ‐ SA by compliance and study size Show forest plot | 4 | Mean Difference (IV, Random, 95% CI) | Subtotals only | |
| 41.1 SA ‐ low risk of compliance bias | 4 | 1657 | Mean Difference (IV, Random, 95% CI) | ‐0.05 [‐0.13, 0.04] |
| 41.2 SA ‐ 100+ randomised | 4 | 1657 | Mean Difference (IV, Random, 95% CI) | ‐0.05 [‐0.13, 0.04] |
| 42 TG, fasting, mmoL/L ‐ ALA ‐ subgroup by dose Show forest plot | 6 | Mean Difference (IV, Random, 95% CI) | Subtotals only | |
| 42.1 ALA low < 5 g/d | 3 | 1371 | Mean Difference (IV, Random, 95% CI) | ‐0.07 [‐0.16, 0.03] |
| 42.2 ALA high > 5 g/d | 3 | 405 | Mean Difference (IV, Random, 95% CI) | 0.05 [‐0.09, 0.19] |
| 43 TG, fasting, mmoL/L‐ ALA ‐ subgroup by intervention type Show forest plot | 6 | Mean Difference (IV, Random, 95% CI) | Subtotals only | |
| 43.1 Dietary advice | 0 | 0 | Mean Difference (IV, Random, 95% CI) | 0.0 [0.0, 0.0] |
| 43.2 Supplemental foods | 5 | 1650 | Mean Difference (IV, Random, 95% CI) | ‐0.01 [‐0.10, 0.07] |
| 43.3 Supplement (capsule) | 0 | 0 | Mean Difference (IV, Random, 95% CI) | 0.0 [0.0, 0.0] |
| 43.4 Any combination | 1 | 126 | Mean Difference (IV, Random, 95% CI) | ‐0.12 [‐0.33, 0.09] |
| 44 TG, fasting, mmoL/L‐AL ‐ subgroup by replacementA Show forest plot | 6 | Mean Difference (IV, Random, 95% CI) | Subtotals only | |
| 44.1 ALA replacing SFA | 0 | 0 | Mean Difference (IV, Random, 95% CI) | 0.0 [0.0, 0.0] |
| 44.2 ALA replacing MUFA | 2 | 1336 | Mean Difference (IV, Random, 95% CI) | ‐0.07 [‐0.17, 0.02] |
| 44.3 ALA replacing n‐6 | 1 | 142 | Mean Difference (IV, Random, 95% CI) | 0.13 [‐0.16, 0.42] |
| 44.4 ALA replacing carbs/sugars | 0 | 0 | Mean Difference (IV, Random, 95% CI) | 0.0 [0.0, 0.0] |
| 44.5 ALA replacing nil/low n‐3 placebo | 1 | 35 | Mean Difference (IV, Random, 95% CI) | 0.30 [‐0.39, 0.99] |
| 44.6 Replacement unclear | 2 | 263 | Mean Difference (IV, Random, 95% CI) | 0.04 [‐0.15, 0.23] |
| 45 TG, fasting, mmoL/L‐ ALA ‐ subgroup by duration Show forest plot | 6 | Mean Difference (IV, Random, 95% CI) | Subtotals only | |
| 45.1 Medium duration 1 to < 2 years in study | 4 | 424 | Mean Difference (IV, Random, 95% CI) | ‐0.01 [‐0.15, 0.12] |
| 45.2 Medium‐long duration: 2 to < 4 years in study | 2 | 1352 | Mean Difference (IV, Random, 95% CI) | ‐0.01 [‐0.17, 0.15] |
| 45.3 Long duration ≥ 4 years in study | 0 | 0 | Mean Difference (IV, Random, 95% CI) | 0.0 [0.0, 0.0] |
| 46 TG, fasting, mmoL/L ‐ ALA ‐ subgroup by statin use Show forest plot | 6 | Mean Difference (IV, Random, 95% CI) | Subtotals only | |
| 46.1 ALA ‐ ≥ 50% of control group on statins | 3 | 1329 | Mean Difference (IV, Random, 95% CI) | 0.03 [‐0.17, 0.23] |
| 46.2 ALA ‐ < 50% of control group on statins | 2 | 268 | Mean Difference (IV, Random, 95% CI) | ‐0.02 [‐0.26, 0.23] |
| 46.3 ALA ‐ use of statins unclear | 1 | 179 | Mean Difference (IV, Random, 95% CI) | ‐0.02 [‐0.20, 0.16] |
| 47 TG, fasting, mmoL/L‐ ALA ‐ subgroup by primary or secondary prevention Show forest plot | 6 | Mean Difference (IV, Random, 95% CI) | Subtotals only | |
| 47.1 Primary prevention | 4 | 482 | Mean Difference (IV, Random, 95% CI) | ‐0.02 [‐0.14, 0.11] |
| 47.2 Secondary prevention | 2 | 1294 | Mean Difference (IV, Random, 95% CI) | 0.02 [‐0.22, 0.25] |
| 48 High‐density lipoprotein, serum, mmoL/L ‐ ALA Show forest plot | 6 | 1776 | Mean Difference (IV, Random, 95% CI) | ‐0.02 [‐0.08, 0.03] |
| 49 HDL, mmoL/L ‐ ALA ‐ SA fixed‐effect Show forest plot | 6 | 1776 | Mean Difference (IV, Fixed, 95% CI) | ‐0.02 [‐0.05, 0.00] |
| 50 HDL, mmoL/L ‐ ALA ‐ SA by summary risk of bias Show forest plot | 6 | Mean Difference (IV, Random, 95% CI) | Subtotals only | |
| 50.1 Low risk of bias | 3 | 1436 | Mean Difference (IV, Random, 95% CI) | ‐0.03 [‐0.06, 0.00] |
| 50.2 Moderate/high risk of bias | 3 | 340 | Mean Difference (IV, Random, 95% CI) | 0.04 [‐0.14, 0.22] |
| 51 HDL, mmoL/L ‐ ALA ‐ SA by compliance and study size Show forest plot | 4 | Mean Difference (IV, Random, 95% CI) | Subtotals only | |
| 51.1 SA ‐ low risk of compliance bias | 4 | 1657 | Mean Difference (IV, Random, 95% CI) | ‐0.02 [‐0.08, 0.04] |
| 51.2 SA ‐ 100+ randomised | 4 | 1657 | Mean Difference (IV, Random, 95% CI) | ‐0.02 [‐0.08, 0.04] |
| 52 HDL, mmoL/L ‐ ALA ‐ subgroup by dose Show forest plot | 6 | Mean Difference (IV, Random, 95% CI) | Subtotals only | |
| 52.1 ALA low < 5 g/d | 3 | 1371 | Mean Difference (IV, Random, 95% CI) | 0.06 [‐0.08, 0.19] |
| 52.2 ALA high > 5 g/d | 3 | 405 | Mean Difference (IV, Random, 95% CI) | ‐0.07 [‐0.12, ‐0.01] |
| 53 HDL, mmoL/L ‐ ALA ‐ subgroup by intervention type Show forest plot | 6 | Mean Difference (IV, Random, 95% CI) | Subtotals only | |
| 53.1 Dietary advice | 0 | 0 | Mean Difference (IV, Random, 95% CI) | 0.0 [0.0, 0.0] |
| 53.2 Supplemental foods | 5 | 1650 | Mean Difference (IV, Random, 95% CI) | ‐0.03 [‐0.06, ‐0.00] |
| 53.3 Supplement (capsule) | 0 | 0 | Mean Difference (IV, Random, 95% CI) | 0.0 [0.0, 0.0] |
| 53.4 Any combination | 1 | 126 | Mean Difference (IV, Random, 95% CI) | 0.15 [0.01, 0.29] |
| 54 HDL, mmoL/L ‐ ALA ‐ subgroup by replacement Show forest plot | 6 | Mean Difference (IV, Random, 95% CI) | Subtotals only | |
| 54.1 ALA replacing SFA | 0 | 0 | Mean Difference (IV, Random, 95% CI) | 0.0 [0.0, 0.0] |
| 54.2 ALA replacing MUFA | 2 | 1336 | Mean Difference (IV, Random, 95% CI) | 0.05 [‐0.11, 0.22] |
| 54.3 ALA replacing n‐6 | 1 | 142 | Mean Difference (IV, Random, 95% CI) | ‐0.04 [‐0.11, 0.03] |
| 54.4 ALA replacing carbs/sugars | 0 | 0 | Mean Difference (IV, Random, 95% CI) | 0.0 [0.0, 0.0] |
| 54.5 ALA replacing nil/low n‐3 placebo | 1 | 35 | Mean Difference (IV, Random, 95% CI) | 0.10 [‐0.17, 0.37] |
| 54.6 Replacement unclear | 2 | 263 | Mean Difference (IV, Random, 95% CI) | ‐0.09 [‐0.17, ‐0.02] |
| 55 HDL, mmoL/L ‐ ALA ‐ subgroup by duration Show forest plot | 6 | Mean Difference (IV, Random, 95% CI) | Subtotals only | |
| 55.1 Medium duration 1 to < 2 years in study | 4 | 424 | Mean Difference (IV, Random, 95% CI) | ‐0.00 [‐0.13, 0.13] |
| 55.2 Medium‐long duration: 2 to < 4 years in study | 2 | 1352 | Mean Difference (IV, Random, 95% CI) | ‐0.02 [‐0.05, 0.00] |
| 55.3 Long duration ≥ 4 years in study | 0 | 0 | Mean Difference (IV, Random, 95% CI) | 0.0 [0.0, 0.0] |
| 56 HDL, mmoL/L ‐ ALA ‐ subgroup by statin use Show forest plot | 6 | Mean Difference (IV, Random, 95% CI) | Subtotals only | |
| 56.1 ALA ‐ ≥ 50% of control group on statins | 3 | 1329 | Mean Difference (IV, Random, 95% CI) | ‐0.03 [‐0.09, 0.03] |
| 56.2 ALA ‐ < 50% of control group on statins | 2 | 268 | Mean Difference (IV, Random, 95% CI) | 0.05 [‐0.14, 0.23] |
| 56.3 ALA ‐ use of statins unclear | 1 | 179 | Mean Difference (IV, Random, 95% CI) | ‐0.09 [‐0.20, 0.02] |
| 57 HDL, mmoL/L ‐ ALA ‐ subgroup by primary or secondary prevention Show forest plot | 7 | Mean Difference (IV, Random, 95% CI) | Subtotals only | |
| 57.1 Low CVD risk | 2 | 305 | Mean Difference (IV, Random, 95% CI) | 0.03 [‐0.21, 0.26] |
| 57.2 Moderate CVD risk | 2 | 177 | Mean Difference (IV, Random, 95% CI) | ‐0.03 [‐0.10, 0.04] |
| 57.3 High CVD risk | 3 | 1368 | Mean Difference (IV, Random, 95% CI) | ‐0.03 [‐0.08, 0.03] |
| 58 Low‐density lipoprotein, serum, mmoL/L ‐ ALA Show forest plot | 7 | 2201 | Mean Difference (IV, Random, 95% CI) | ‐0.05 [‐0.15, 0.04] |
| 59 LDL, mmoL/L ‐ ALA ‐ SA fixed‐effect Show forest plot | 7 | 2201 | Mean Difference (IV, Fixed, 95% CI) | ‐0.05 [‐0.11, 0.00] |
| 60 LDL, mmoL/L ‐ ALA ‐ SA by summary risk of bias Show forest plot | 7 | Mean Difference (IV, Random, 95% CI) | Subtotals only | |
| 60.1 Low risk of bias | 3 | 1350 | Mean Difference (IV, Random, 95% CI) | 0.02 [‐0.05, 0.10] |
| 60.2 Moderate/high risk of bias | 4 | 851 | Mean Difference (IV, Random, 95% CI) | ‐0.14 [‐0.22, ‐0.06] |
| 61 LDL, mmoL/L ‐ ALA ‐ SA by compliance and study size Show forest plot | 5 | Mean Difference (IV, Random, 95% CI) | Subtotals only | |
| 61.1 SA ‐ low risk of compliance bias | 5 | 2085 | Mean Difference (IV, Random, 95% CI) | ‐0.05 [‐0.16, 0.06] |
| 61.2 SA ‐ 100+ randomised | 5 | 2085 | Mean Difference (IV, Random, 95% CI) | ‐0.05 [‐0.16, 0.06] |
| 62 LDL, mmoL/L ‐ ALA ‐ subgroup by dose Show forest plot | 7 | Mean Difference (IV, Random, 95% CI) | Subtotals only | |
| 62.1 ALA low < 5 g/d | 4 | 1796 | Mean Difference (IV, Random, 95% CI) | ‐0.06 [‐0.17, 0.05] |
| 62.2 ALA high > 5 g/d | 3 | 405 | Mean Difference (IV, Random, 95% CI) | ‐0.04 [‐0.28, 0.19] |
| 63 LDL, mmoL/L ‐ ALA ‐ subgroup by intervention type Show forest plot | 7 | Mean Difference (IV, Random, 95% CI) | Subtotals only | |
| 63.1 Dietary advice | 0 | 0 | Mean Difference (IV, Random, 95% CI) | 0.0 [0.0, 0.0] |
| 63.2 Supplemental foods | 6 | 2075 | Mean Difference (IV, Random, 95% CI) | ‐0.06 [‐0.17, 0.05] |
| 63.3 Supplement (capsule) | 0 | 0 | Mean Difference (IV, Random, 95% CI) | 0.0 [0.0, 0.0] |
| 63.4 Any combination | 1 | 126 | Mean Difference (IV, Random, 95% CI) | 0.0 [‐0.25, 0.25] |
| 64 LDL, mmoL/L ‐ ALA ‐ subgroup by replacement Show forest plot | 7 | Mean Difference (IV, Random, 95% CI) | Subtotals only | |
| 64.1 ALA replacing SFA | 0 | 0 | Mean Difference (IV, Random, 95% CI) | 0.0 [0.0, 0.0] |
| 64.2 ALA replacing MUFA | 2 | 1250 | Mean Difference (IV, Random, 95% CI) | 0.01 [‐0.07, 0.09] |
| 64.3 ALA replacing n‐6 | 1 | 142 | Mean Difference (IV, Random, 95% CI) | 0.14 [‐0.08, 0.36] |
| 64.4 ALA replacing carbs/sugars | 0 | 0 | Mean Difference (IV, Random, 95% CI) | 0.0 [0.0, 0.0] |
| 64.5 ALA replacing nil/low n‐3 placebo | 1 | 32 | Mean Difference (IV, Random, 95% CI) | ‐0.10 [‐0.59, 0.39] |
| 64.6 Replacement unclear | 3 | 777 | Mean Difference (IV, Random, 95% CI) | ‐0.16 [‐0.24, ‐0.07] |
| 65 LDL, mmoL/L ‐ ALA ‐ subgroup by duration Show forest plot | 7 | Mean Difference (IV, Random, 95% CI) | Subtotals only | |
| 65.1 Medium duration 1 to < 2 years in study | 5 | 935 | Mean Difference (IV, Random, 95% CI) | ‐0.14 [‐0.22, ‐0.06] |
| 65.2 Medium‐long duration: 2 to < 4 years in study | 2 | 1266 | Mean Difference (IV, Random, 95% CI) | 0.03 [‐0.06, 0.13] |
| 65.3 Long duration ≥ 4 years in study | 0 | 0 | Mean Difference (IV, Random, 95% CI) | 0.0 [0.0, 0.0] |
| 66 LDL, mmoL/L ‐ ALA ‐ subgroup by statin use Show forest plot | 7 | Mean Difference (IV, Random, 95% CI) | Subtotals only | |
| 66.1 ALA ‐ ≥ 50% of control group on statins | 3 | 1240 | Mean Difference (IV, Random, 95% CI) | 0.00 [‐0.08, 0.08] |
| 66.2 ALA ‐ < 50% of control group on statins | 2 | 268 | Mean Difference (IV, Random, 95% CI) | 0.08 [‐0.09, 0.24] |
| 66.3 ALA ‐ use of statins unclear | 2 | 693 | Mean Difference (IV, Random, 95% CI) | ‐0.16 [‐0.25, ‐0.07] |
| 67 LDL, mmoL/L ‐ ALA ‐ subgroup by primary or secondary prevention Show forest plot | 7 | Mean Difference (IV, Random, 95% CI) | Subtotals only | |
| 67.1 Primary prevention of CVD | 5 | 993 | Mean Difference (IV, Random, 95% CI) | ‐0.08 [‐0.20, 0.05] |
| 67.2 Secondary prevention of CVD | 2 | 1208 | Mean Difference (IV, Random, 95% CI) | 0.01 [‐0.08, 0.09] |
| Outcome or subgroup title | No. of studies | No. of participants | Statistical method | Effect size |
| 1 Blood pressure, mmHg ‐ ALA Show forest plot | 4 | Mean Difference (IV, Random, 95% CI) | Subtotals only | |
| 1.1 Systolic BP ‐ ALA | 4 | 1671 | Mean Difference (IV, Random, 95% CI) | ‐0.87 [‐4.48, 2.75] |
| 1.2 Diastolic BP ‐ ALA | 4 | 1671 | Mean Difference (IV, Random, 95% CI) | ‐1.42 [‐4.40, 1.57] |
| 2 Serious adverse events ‐ ALA Show forest plot | 2 | Risk Ratio (M‐H, Random, 95% CI) | Subtotals only | |
| 2.1 Any serious adverse events | 0 | 0 | Risk Ratio (M‐H, Random, 95% CI) | 0.0 [0.0, 0.0] |
| 2.2 Bleeding | 0 | 0 | Risk Ratio (M‐H, Random, 95% CI) | 0.0 [0.0, 0.0] |
| 2.3 GI hospitalisation | 0 | 0 | Risk Ratio (M‐H, Random, 95% CI) | 0.0 [0.0, 0.0] |
| 2.4 Pulmonary embolus or DVT | 1 | 708 | Risk Ratio (M‐H, Random, 95% CI) | 0.32 [0.01, 7.80] |
| 2.5 Thrombophleibitis | 1 | 13406 | Risk Ratio (M‐H, Random, 95% CI) | 1.59 [0.72, 3.51] |
| 2.6 Urolithiasis | 1 | 13406 | Risk Ratio (M‐H, Random, 95% CI) | 0.80 [0.47, 1.36] |
| 3 Side effects ‐ ALA Show forest plot | 5 | Risk Ratio (M‐H, Random, 95% CI) | Subtotals only | |
| 3.1 Dropouts due to side effects | 5 | 3480 | Risk Ratio (M‐H, Random, 95% CI) | 2.10 [0.66, 6.71] |
| 3.2 Abdominal pain or discomfort | 0 | 0 | Risk Ratio (M‐H, Random, 95% CI) | 0.0 [0.0, 0.0] |
| 3.3 Diarrhoea | 1 | 708 | Risk Ratio (M‐H, Random, 95% CI) | 3.82 [0.82, 17.88] |
| 3.4 Nausea | 1 | 110 | Risk Ratio (M‐H, Random, 95% CI) | 6.29 [0.33, 118.93] |
| 3.5 Any gastrointestinal side effect ‐ ALA | 4 | 3450 | Risk Ratio (M‐H, Random, 95% CI) | 2.06 [0.62, 6.80] |
| 3.6 Pain (joint, lumbar, muscle pain) | 0 | 0 | Risk Ratio (M‐H, Random, 95% CI) | 0.0 [0.0, 0.0] |
| 3.7 All side effects combined | 0 | 0 | Risk Ratio (M‐H, Random, 95% CI) | 0.0 [0.0, 0.0] |
| 4 Dropouts ‐ ALA Show forest plot | 6 | 3663 | Risk Ratio (M‐H, Random, 95% CI) | 1.08 [0.92, 1.25] |