Medicinske sestre kao zamjena za liječnike u primarnoj zdravstvenoj zaštiti
Referencias
References to studies included in this review
References to studies excluded from this review
References to studies awaiting assessment
Additional references
References to other published versions of this review
Characteristics of studies
Characteristics of included studies [ordered by study ID]
| Methods | Randomised trial | |
| Participants | 13,707 patients (total group); mean age in intervention group 41.5 (25.2), in control group 44.7 (25.0); 40% male in intervention group, 41% male in control group 42 practices at 4 centres | |
| Interventions | Intervention: nurse‐led computer‐supported telephone triage Control: GP‐led telephone triage Detailed description of the intervention: Compared 3 groups delivering telephone triage: GP‐led triage, nurse‐led computer‐based triage, and usual care triage
Supervision, oversight: unknown | |
| Outcomes | Patient outcomes:
Process of care measures:
Resource utilisation: Costs: costs over 28 days with regard to primary outcome contacts | |
| Notes | Country: UK Study period: 25 months Nurse role: nurse in charge of computer‐supported telephone triage for patients requesting a same‐day appointment Nurse title: nurse (nurse practitioners and practice nurses) Nurse educational background: EQF level unknown Nurse years of experience: unknown Nurse additional training: training in the use of Odyssey Patient Access and in telephone consultation skills. Following this was a pretrial period of 1 month, during which nurses were expected to practise using the decision support in their daily work; towards the end of this period, their use of the system was assessed | |
| Risk of bias | ||
| Bias | Authors' judgement | Support for judgement |
| Random sequence generation (selection bias) | Unclear risk | The sequence process included a random component. "Participating practices were randomly assigned (1:1:1), via a computer‐generated randomisation sequence, to GP triage, nurse triage with computer decision support, or usual care. The randomisation sequence [was] minimized for research centre, deprivation (deprived [below average Index of Multiple Deprivation 2010, based on practice postcode] or not‐deprived [average or above]) and list size (small [< 3500 patients], medium [3500–8000 patients], or large [> 8000 patients]) of the trial team". However, 10 of the 15 practices allocated to NP triage withdrew. "To maintain balance between groups, any practices that withdrew after randomisation were replaced with a waiting‐list practice that was from the same location, and of similar size and deprivation when possible. Because of the small numbers of waiting‐list practices, replacements were purposively allocated according to minimisation criteria". |
| Allocation concealment (selection bias) | Low risk | Patients and investigators enrolling patients could not foresee assignment. "A stochastic element within the minimisation algorithm maintained concealment. Allocation was done by a statistician independent form". "Allocations were concealed from practices until after they had agreed to participate; this concealment also applied to practices replacing practices that had withdrawn from the study for whatever reason". |
| Baseline characteristics | Low risk | Characteristics of patients were similar in both groups. |
| Baseline outcome measurement | Low risk | Baseline primary outcome measurement was not relevant. Baseline secondary outcome health status was not measured, and differences in baseline health status could bias the outcome ‘health status’. |
| Blinding of participants and personnel (performance bias) | Unclear risk | Practitioners and patients were not blinded. It is unclear whether the outcome was influenced by lack of blinding of patients and care providers. "Patients, clinicians, and researchers were not masked to allocation, but practice assignment was concealed from the trial statistician". |
| Blinding of outcome assessment (detection bias) | Unclear risk | Researchers were not blinded; however, the trial statistician was blinded. "Patients, clinicians, and researchers were not masked to allocation, but practice assignment was concealed from the trial statistician". |
| Incomplete outcome data (attrition bias) | Low risk | Follow‐up of patients < 80%; however per‐protocol and intention‐to‐treat analyses showed similar results. "Findings from our per‐protocol analysis showed intensification of the noted effects of both GP triage and nurse triage (data not shown)". |
| Selective reporting (reporting bias) | Low risk | Protocol was available. Predefined outcomes measurements were reported. |
| Contamination | Low risk | Not likely, because allocation was by practice |
| Bias due to lack of power | Low risk | "7046 patients per group would need to be recruited from 42 practices". In the GP triage, 6781 patients were eligible for intervention (6697 + 84). This is a relatively small difference with the calculated power. Trial authors commented: "The trial was fully powered and we exceeded our recruitment target in gaining access to the primary outcome data, partly because of a process of obtaining initial verbal consent to participate". |
| Methods | Randomised trial | |
| Participants | 868 patients (total group), all ages, 34% male | |
| Interventions | Intervention: families allocated to nurse‐led primary care Detailed description of the intervention: Compared 2 groups providing family care:
Supervision, oversight: The family practice nurse was delegated the responsibility of choosing between three possible courses of action: providing specific treatment; providing reassurance alone, without specific treatment; or referring the patient to the associated family doctor, to another clinician, or to an appropriate service agency. | |
| Outcomes | Patient outcomes:
| |
| Notes | Country: Canada Study period: 12 months Nurse role: first contact and ongoing primary care Nurse title: practice nurse Nurse educational background: EQF level unknown Nurse years of experience: The nurse already worked for 4 years in the family practice. Nurse additional training: The nurse attended a special 9‐month education programme for family practice nurses including skills such as decision‐making, clinical judgement, social history taking, physical examinations, and the ability to distinguish between abnormal and normal patient symptoms and signs. | |
| Risk of bias | ||
| Bias | Authors' judgement | Support for judgement |
| Random sequence generation (selection bias) | Unclear risk | No clear method of randomisation was reported. |
| Allocation concealment (selection bias) | Unclear risk | No information |
| Baseline characteristics | Low risk | Baseline characteristics were reported and were similar for both groups. "The groups are highly similar and none of the observed differences are statistically significant". |
| Baseline outcome measurement | Low risk | Baseline outcomes were reported and were similar for both groups. |
| Blinding of participants and personnel (performance bias) | Unclear risk | Families/patients and care providers were not blinded. It is unclear whether the outcome was influenced by lack of blinding of patients and care providers. |
| Blinding of outcome assessment (detection bias) | Unclear risk | No information |
| Incomplete outcome data (attrition bias) | High risk | Follow‐up of patients < 80% ("65.5%") |
| Selective reporting (reporting bias) | Unclear risk | The protocol was not available. |
| Contamination | Unclear risk | No information |
| Bias due to lack of power | Unclear risk | No power calculation performed |
| Methods | Randomised trial | |
| Participants | 175 patients (total group), mean age 48.4 years (control), 50.2 years (intervention); 49% male (in total) 1 nurse and unknown number of doctors | |
| Interventions | Intervention: patient care after gastric endoscopy allocated to nurse Control: patient care after gastric endoscopy allocated to doctor Detailed description of the intervention: Compared 2 groups providing follow‐up for patients with dyspepsia after direct access gastroscopy.
Patients included were those with mild gastroesophageal reflux disease (GORD – non‐erosive or grade A and B oesophagitis, hiatus hernia), those with non‐ulcer dyspepsia (NUD) (mild and moderate gastritis or duodenitis), and those with normal findings. After gastroscopy, endoscopists maintained their routine practice in giving verbal and written advice to patients and documented treatment recommendations to GPs in a formal report. Clinical management was structured, based on national and local guidelines, with reference to each patient's predominant symptoms. Patients were given counselling and lifestyle advice, supplemented with relevant locally devised leaflets (i.e. reflux, non‐ulcer dyspepsia, weight control), and an individualised treatment plan was agreed upon. Further investigation such as the urea breath test, motility studies, and barium meal were initiated, if required, as per routine clinical practice. To ensure practice consistency and reproducibility, 'history taking' and 'lifestyle advice' proformas were devised and used. Supervision, oversight: Studied interventional patients were seen in the nurse‐led clinic within secondary care, without direct supervision from any consultant gastroenterologists. However, cases could be discussed with a doctor, if deemed necessary. | |
| Outcomes | Patient outcomes: Gladys, health status short form (SF‐12) | |
| Notes | Country: UK Study period: 6 months Nurse role: ongoing care (follow‐up) after gastroendoscopy Nurse title: gastrointestinal nurse practitioner Nurse educational background: EQF level 8 Nurse years of experience: The nurse had been qualified as a State Registered Nurse for 20 years and specialised in gastro nursing for 4 years and 2 months. Nurse additional training: Clinic consultation skill was developed with the help of a named GI consultant. Initially, the nurse sat in that clinic (2 months) as an observer. The next stage was to see patients who had been filtered by the consultant from that clinic on that day. The nurses’ consulting room was next to the GI consultants’ room to effect direct supervision, as each patient case was presented to the GI and treatment identified (6 months). Finally, a nurse‐led clinic was established and was formally running alongside the GI clinics, with pre‐identified patients advanced from all GI consultants. Some 18 months later, the nurse was authorised to discuss selective cases with the patient’s named consultant, if required. Three monthly reviews were performed initially; this was reduced to yearly and was incorporated in the annual appraisal. | |
| Risk of bias | ||
| Bias | Authors' judgement | Support for judgement |
| Random sequence generation (selection bias) | Low risk | The sequence process included a random component. "Patients eligible for entry after endoscopy were randomised into intervention (GNP) and control (GP) groups, with a password protected, computer generated random number table”. |
| Allocation concealment (selection bias) | Low risk | Participants and investigators enrolling participants could not foresee assignment. |
| Baseline characteristics | Low risk | Baseline characteristics were reported and were similar for both groups. "The baseline Gladys scores (high scores equal higher burden of disease and symptoms) were similar (10.0 vs 9.9) but the SF12 scores (672.0 vs 627.7) were higher (high scores equal better health) in the GP group (see Table 1). The cost of UHD used, 6 months prior to the investigation, was lower in the GP group (£52.4 vs £59.5)". But, "The two groups were compared by the change from baseline to month 6 in the key outcome variables – Gladys score, SF12 and overall UHDs cost, adjusted for baseline values by including the baseline levels of the outcome in the ANOVA as a covariate; p < 0.05 was taken as being significant". |
| Baseline outcome measurement | Low risk | Baseline outcome measurements were reported and adjusted analyses performed. |
| Blinding of participants and personnel (performance bias) | Unclear risk | No information |
| Blinding of outcome assessment (detection bias) | Low risk | Blinding of assessment was performed. "A researcher blinded to the patients' study status and diagnosis interviewed all participants by telephone, at a prearranged time suitable to the patient, six months after randomisation". |
| Incomplete outcome data (attrition bias) | Low risk | Follow‐up of patients > 80% "199 unselected patients were approached and 196 (98.5%) were recruited. One hundred and seventy five (89.3%) patients were eligible after investigation. Of the 21 ineligible patients, 16 did not meet the criteria (Barrett's oesophagus: 6, oesophagitis grade C: 2, oesophageal stricture: 1, peptic ulcer disease: 3, possible cancer: 1). Three cases were deemed unsuitable by the endoscopist, as symptoms were attributed to other conditions (rhinitis 1, angina 2)". "Early withdrawals (GP n = 3, GNP n = 4) after randomisation were experienced in both groups (Figure 1). Three in the 'GP' group decided not to see their GP. The four in the GNP group were due to work commitments (2), leaving the area (1) and after own GP consultation (1)". |
| Selective reporting (reporting bias) | Unclear risk | The protocol was not available. |
| Contamination | Low risk | Patients in the intervention group went to a nurse‐led clinic, and controls went to their doctor. Therefore, it is unlikely that both groups were contaminated. |
| Bias due to lack of power | Low risk | Number of included patients was approximately similar to results of the sample size calculation. |
| Methods | Randomised trial | |
| Participants | 1501 patients (total group); mean age in intervention group 46.1, in control group 42.8; 38.2% male in intervention group, 40% male in control group 50 GPs 12 NPs | |
| Interventions | Intervention: patients allocated to nurse practitioners Control: patients allocated to GPs Detailed description of the intervention: Compared 2 groups providing care to patients with common complaints as first point of contact The NP saw patients with respiratory and throat problems, ear and nose problems, musculoskeletal problems and injuries, skin injuries, urinary problems, gynaecological problems, and geriatric problems. The role of the NP involved assessing symptoms including physical examinations when appropriate and diagnosing and making decisions about further treatment, including writing prescriptions and referrals to primary or secondary services and clinical investigations. Supervision, oversight: The NP did not have full authority to prescribe medications, and so the GP was always available for consultation and for validation of prescriptions and referrals. | |
| Outcomes | Patient outcomes:
Process of care measures:
Resource utilisation:
Costs: direct healthcare costs, including and excluding productivity | |
| Notes | Country: Netherlands Study period: 6 months Nurse role: first contact and ongoing care Nurse title: nurse practitioners Nurse educational background: EQF level 7 Nurse years of experience: 0 years as an NP, at least 2 years of experience as a registered nurse Nurse additional training: unknown | |
| Risk of bias | ||
| Bias | Authors' judgement | Support for judgement |
| Random sequence generation (selection bias) | Low risk | The sequence process included a random component. |
| Allocation concealment (selection bias) | Low risk | Patients and investigators enrolling patients could not foresee assignment. |
| Baseline characteristics | Low risk | Baseline outcomes were reported and were similar for both groups. Only age was different. "Patients who returned all questionnaires were statistically significantly older (mean = 48Æ74, SD = 16Æ8) than those who did not (mean = 42Æ75, SD = 16Æ4; p < 0Æ001). There were no statistically significant differences in gender and type of diagnosis between patients with or without complete data. No statistically significant differences were noted between patients in two groups in terms of other (chronic) diseases". |
| Baseline outcome measurement | Unclear risk | Primary outcomes could not be assessed before the intervention. |
| Blinding of participants and personnel (performance bias) | Unclear risk | Patients and care providers were not blind to the intervention. It is unclear whether the outcome was influenced by lack of blinding of patients and care providers. |
| Blinding of outcome assessment (detection bias) | Unclear risk | No information |
| Incomplete outcome data (attrition bias) | Low risk | Follow‐up of patients > 80% "499 met one or more exclusion criteria, declined to participate, had no interest or were too ill". "58 patients who were allocated to the NP intervention group and 47 patients in the reference group did not attend the appointment they had booked or refused to participate because of being too ill or not having an interest". |
| Selective reporting (reporting bias) | Unclear risk | The protocol was not available. |
| Contamination | Low risk | It is unlikely that patients who visited the GP consulted the NP for the same question/problem, or vice versa. |
| Bias due to lack of power | Unclear risk | No power calculation performed |
| Methods | Randomised trial | |
| Participants | 450 patients (total group), mean age 61 years, 98% male | |
| Interventions | Intervention: patients allocated to nurse‐led primary care Detailed description of the intervention: not available Supervision, oversight: First‐year residents and newly graduated nurse practitioners were required to present every patient to the attending doctors during the first 6 months of their appointment, whereas the remainder of residents and nurse practitioners presented cases only when they believed it to be necessary. | |
| Outcomes | Resource utilisation:
| |
| Notes | Country: USA Study period: 12 months Nurse role: first contact and ongoing primary care Nurse title: nurse practitioners Nurse educational background: EQF level unknown Nurse years of experience: unknown Nurse additional training: unknown | |
| Risk of bias | ||
| Bias | Authors' judgement | Support for judgement |
| Random sequence generation (selection bias) | Low risk | The sequence process included a random component. |
| Allocation concealment (selection bias) | Low risk | Participants or investigators enrolling participants could not foresee assignments. A computerised system was used. |
| Baseline characteristics | Unclear risk | No information |
| Baseline outcome measurement | Unclear risk | Primary outcomes were not assessed before the intervention. |
| Blinding of participants and personnel (performance bias) | Low risk | Practitioners low risk, patients no information (unclear risk) |
| Blinding of outcome assessment (detection bias) | Unclear risk | No information |
| Incomplete outcome data (attrition bias) | Unclear risk | No information available about follow‐up |
| Selective reporting (reporting bias) | Unclear risk | The protocol was not available. |
| Contamination | Unclear risk | No information. However, the quote "For the purposes of this study, patients remained in the group to which they were initially assigned, even if their type of primary care provider changed after the first visit" suggests that contamination has occurred. |
| Bias due to lack of power | Unclear risk | No power calculation performed |
| Methods | Randomised trial | |
| Participants | 239 patients (total group); mean age in intervention group 67.1 (11.0), in control group 69.5 (10.6); 52.9% male in intervention group, 42.3% male in control group 5 doctors (GPs) 2 nurses | |
| Interventions | Intervention: patients with T2DM allocated to nurse practitioners Control: patients with T2DM allocated to GPs Detailed description of the intervention: Compared 2 groups providing diabetes care:
Eligible patients were selected via the GPs’ patient information system and the local pharmacy. Initial selection included patients with a diagnosis of diabetes, patients who were on medication for diabetes, and patients whose glycated haemoglobin (HbA1c) levels had been measured within the past 3 years. Exclusion criteria were (1) no diagnosis of diabetes, (2) type 1 diabetes, (3) diabetes not treated in the primary healthcare setting, (4) inability to participate in the study because of old age or comorbidity, in the opinion of the GP, and (5) not willing to return for follow‐up. PNs were permitted to prescribe 14 different medications and to adjust dosages for a further 30. They were also allowed to order laboratory tests. PNs specifically were not permitted to prescribe insulin but were able to adjust the dosage. Supervision, oversight: PNs worked with a protocol published in "protocollaire diabeteszorg". The protocol indicated when the PN had to consult the GP. In case the patient showed specific complaints during consultation, the patient would be referred to the GP. | |
| Outcomes | Patient outcomes:
Process of care measures:
Resource utilisation:
| |
| Notes | Country: Netherlands Study period: unknown Nurse role: ongoing care for patients with diabetes type 2 in a primary care setting Nurse title: practice nurse Nurse educational background: EQF level 5 Nurse years of experience: 2 PNs, experienced in working as a nurse; however no prior experience working in general practice Nurse additional training: At the beginning of the trial, PNs received 1 week of training on a detailed treatment and management protocol aimed at optimising glucose, blood pressure, and lipid profile regulation and eye and foot care in patients with diabetes. Training aimed to educate PNs to a level comparable to the level of a GP, so they would be able to provide diabetes care without supervision. | |
| Risk of bias | ||
| Bias | Authors' judgement | Support for judgement |
| Random sequence generation (selection bias) | Low risk | A random sequence was used; sequence generation was by odd/even number of closed envelopes. "Patients willing to participate were then randomised by two independent medical investigators (STH and NK)…... Subjects with even numbers were assigned to the intervention group, and those with odd numbers were assigned to the control group". |
| Allocation concealment (selection bias) | Low risk | Allocation was concealed using sequentially numbered closed envelopes "The patient population was randomised using non‐transparent, closed envelopes containing sequential numbers". |
| Baseline characteristics | Low risk | Characteristics of patients were similar in both groups. "The groups were comparable with respect to age, gender, T2DM duration, body mass index (BMI), blood pressure, HbA1c and lipid profile". |
| Baseline outcome measurement | Low risk | Baseline outcomes were reported and were similar for both groups, except feet at‐risk. One of the secondary outcomes was measures to prevent development of diabetic foot symptoms. The percentage of feet at‐risk cases was calculated. Therefore, we do not expect bias due to unsimilarity in baseline feet at‐risk. "The groups were comparable with respect to age, gender, T2DM duration, body mass index (BMI), blood pressure, HbA1c and lipid profile. However, more patients in the PN group had feet at‐risk compared to the GP group". |
| Blinding of participants and personnel (performance bias) | Unclear risk | It is unclear whether the outcome was influenced by lack of blinding of patients and care providers. |
| Blinding of outcome assessment (detection bias) | Unclear risk | Not performed. It is unclear whether the outcome was influenced by lack of blinding of the outcome assessment, because outcomes could not be easily influenced. "The outcome assessors of the clinical variables (such as blood pressure) were not blinded to the intervention". |
| Incomplete outcome data (attrition bias) | Low risk | Follow‐up of patients > 80% |
| Selective reporting (reporting bias) | Unclear risk | The protocol was not available. |
| Contamination | Unclear risk | Allocation was by patient. Only 1 practice was involved. Not reported whether trial authors protect against contamination |
| Bias due to lack of power | Unclear risk | Lack of power, according to the power calculation. If this really was biased, the outcome was unclear. However, trial authors discussed the following: "the required sample size to detect a 0Æ5%‐point difference in HbA1c was a total of 216 patients. Unfortunately, we only have a complete follow‐up of 206 patients. However, the difference in HbA1c ( confidence interval) between groups after 14 months was 0Æ042% (0Æ207;0Æ265). As the confidence interval does not include the possibility of a 0Æ5%‐point difference in HbA1c between groups, we are able to make the conclusions as hypothesised". |
| Methods | Randomised trial | |
| Participants | 1461 patients (total group), 708 control, 753 intervention; mean age in intervention group 39.0 (15.1), in control group 38.6 (14.5); 39.0% male in intervention group, 38.8% male in control group 142 GPs 155 nurses | |
| Interventions | Intervention: care delivered by nurses to patients asking same‐day appointment Control: usual care delivered by GPs to patients asking same‐day appointment Detailed description of the intervention: Compared effectiveness of care delivered by nurses vs usual care delivered by GPs, in adult patients asking to be seen on the same day in primary care practices. Patients assigned to the intervention group were seen by trained nurses, who followed guidelines developed during the study's preparation phase. Nurses had access to an electronic application, which included the guidelines, designed as a decision‐making support tool. Patients assigned to the control group were seen by the GP, who followed the usual procedures established in the practice and did not have access to any kind of decision‐making support tools. Supervision, oversight: unknown | |
| Outcomes | Patient outcomes:
Process of care measures:
Resource utilisation:
| |
| Notes | Country: Spain Study period: 5 months Nurse role: nurses trained to respond to low‐complexity, acute pathologies Nurse title: nurse Nurse educational background: EQF level unknown Nurse years of experience: unknown Nurse additional training: unknown | |
| Risk of bias | ||
| Bias | Authors' judgement | Support for judgement |
| Random sequence generation (selection bias) | Low risk | The sequence process included a random component. "Participants were randomly assigned following simple randomisation procedures to intervention or control using an automatic probabilistic function which assigns one group or another using a probability of 0.5. Patients were recruited consecutively until the necessary number of subjects was obtained, ensuring a balanced allocation of groups". |
| Allocation concealment (selection bias) | Low risk | Patients and investigators enrolling patients could not foresee assignment. "The application was used to implement the random allocation sequence. The sequence was concealed until groups were assigned because the application generated the sequence just after the patient gave oral and written consent to participate in the study". |
| Baseline characteristics | Low risk | Characteristics of patients were similar in both groups. |
| Baseline outcome measurement | Unclear risk | Outcome patient preference was not assessed before the intervention. |
| Blinding of participants and personnel (performance bias) | Unclear risk | It is unclear whether the outcome was influenced by lack of blinding of patients and care providers. "Participants, nurses and GPs where not blinded to group assignment". |
| Blinding of outcome assessment (detection bias) | Low risk | Outcome assessors were blind. |
| Incomplete outcome data (attrition bias) | Low risk | Follow‐up of patients > 80% |
| Selective reporting (reporting bias) | Unclear risk | The protocol was not available. |
| Contamination | Unclear risk | One of the outcomes was ‘level of resolution by nurses’. |
| Bias due to lack of power | Low risk | Sufficient power "…obtaining a final sample size of 1,340 patients (670 per group)" |
| Methods | Randomised trial | |
| Participants | 107 patients (total group). Mean age in intervention group 55.0 (12.3), in control group 55.8 (13.2); 45.0% male in intervention group, 44% male in control group 5 nurses Unknown number of rheumatologists | |
| Interventions | Intervention: patients monitored by a nurse, later monitored by a rheumatologist Control: patients monitored by a rheumatologist Detailed description of the intervention: Compared and evaluated treatment outcomes at a nurse‐led rheumatology clinic and a rheumatologist‐led clinic in patients with low disease activity or in remission undergoing biological therapy. The intention was to replace one of the 2 annual rheumatologist monitoring visits by a nurse‐led rheumatology monitoring visit in patients undergoing biological therapy.
Supervision, oversight: If necessary, the nurse could contact the rheumatologist to ask for advice or to obtain a prescription. | |
| Outcomes | Patient outcomes:
Resouce utilisation:
Costs: total annual rheumatology care per patient | |
| Notes | Country: Sweden Study period: 22 months Nurse role: nurse‐led rheumatology monitoring visit for patients undergoing biological therapy Nurse title: registered nurse Nurse educational background: EQF level 6 Nurse years of experience: 22 to 39 years' professional experience and 9 to 20 years' experience managing rheumatic diseases in both in‐patient and out‐patient rheumatology care Nurse additional training: Nurses had undergone special training provided by a rheumatologist and RA instructors to assess swollen and tender joints based on the 28‐joint count to make an evidence‐based assessment of disease activity. • Theoretical lecture about anatomy of the joint with pictures and about joint examination techniques – inspection, palpation, assessing range of motion and function for a half hour • Practical examination of the hand and wrist. Nurses were trained in groups of 2 to 3 by RA instructors (patient partners) who had RA themselves and were well educated. Time: 1.5 hours • Same procedure, but now foot and ankle. Time: 1.5 hours • All nurses also got a booklet about hand and wrist examination, and another about foot and ankle examination, for self‐study and training. • One week later, another 1.5‐hour lecture to repeat both hand and foot examinations in the same groups • Rheumatologist met the whole group of nurses and gave a lecture on how to examine the big joints ‐ shoulder, elbow, knee, and hip. Nurses examined an RA patient and then practiced on each other. Time: 1.5 hours • Time to ask the rheumatologist questions afterwards if needed, and to watch the rheumatologist examining other patients in the practice | |
| Risk of bias | ||
| Bias | Authors' judgement | Support for judgement |
| Random sequence generation (selection bias) | Low risk | The sequence process included a random component. "Randomization took the form of sealed envelopes containing assignment to one of the two groups. The envelopes were mixed and when a patient met the inclusion criteria, an envelope was randomly picked". |
| Allocation concealment (selection bias) | Low risk | Patients and investigators enrolling patients could not foresee assignment. "Randomization took the form of sealed envelopes containing assignment to one of the two groups. The envelopes were mixed and when a patient met the inclusion criteria, an envelope was randomly picked". |
| Baseline characteristics | Unclear risk | Characteristics of patients were similar in both groups, except in those with rheumatic disease. It is unclear whether this biased trial results. |
| Baseline outcome measurement | Low risk | Primary outcomes were assessed before the intervention. Mean differences were used as an outcome. |
| Blinding of participants and personnel (performance bias) | Unclear risk | No information available |
| Blinding of outcome assessment (detection bias) | High risk | Not performed "The monitoring by the rheumatology nurse (intervention group) and the rheumatologist (control group) included an assessment of the number of swollen and tender joints based on the DAS28". and "All patients were monitored by the rheumatologist at baseline and after 12 months". |
| Incomplete outcome data (attrition bias) | Low risk | Follow‐up of patients > 80% "In total, 47 patients (89%) in the intervention group and 50 patients (93%) in the control group completed the 12‐month trial". |
| Selective reporting (reporting bias) | Unclear risk | The protocol was not available. |
| Contamination | Unclear risk | Not reported whether trial authors protect against contamination |
| Bias due to lack of power | Low risk | Sufficient power "Based on a change of 0.6 in the DAS28 score and a SD of 1.0, the power analysis demonstrated that 95 patients would be a sufficient number to detect a clinically moderate difference between groups at a 5% significance level with at least 90% power. It was decided to include 107 patients to allow for the predicted 10% dropout. The primary outcome measure was change in the DAS28 over a 12‐month period". |
| Methods | Randomised trial | |
| Participants | 10134 patients (total group), all ages, 48% male | |
| Interventions | Intervention: nurse call management during out‐of‐hours Detailed description of the intervention: Compared 2 groups answering incoming phone calls for patients during out‐of‐hours Nurse telephone consultation: In the intervention arm of the trial, all calls were passed straight to the nurse, except in the case of immediate referral to the ambulance service by the receptionist. The nurse then undertook a systematic assessment of the caller's problem and recommended an appropriate course of action. The nurse was aided by TAS (telephone advice system), a computer‐based primary care call management system. Triage nurses were able to complete calls without onward referral. Call management options for nurses included:
At the time of the study, triage nurses were seen to be acting as ‘competent agents’ of the GP. They had personal professional responsibility to ensure that they had been adequately prepared for the role and were accountable for their own actions. The GP could delegate care, but not accountability for that care. Doctor telephone consultation: Incoming phone calls were answered by a receptionist, who passed the message to a doctor. Call management options for the GP were:
Supervision, oversight: Nurses would refer calls to a GP if in doubt about how best to manage a situation, or would discuss the situation with the patient (in person at the centre or over the telephone). Before the end of every shift, triage nurses contacted the general practitioners on duty to report back on all calls they had managed. Formal, monthly professional supervision was provided by the trial project nurse. | |
| Outcomes | Patient outcomes:
Resource utilisation:
| |
| Notes | Country: UK Study period: 3 to 7 days Nurse role: first contact care for patients with urgent problems out‐of‐hours Nurse title: not clear Nurse educational background: EQF level 6 Nurse years of experience: Nurses were required to have a minimum of 5 years of post registration experience, including experience in primary health care. Nurse additional training: 6‐week educational programme to prepare nurses for a 3‐month probationary period of supervised telephone triage practice. The taught component covered clinical skills (management of adult and child health problems and related pharmacology); telephone consultation (including professional and medicolegal aspects, communication, and interpersonal skills at different phases of the telephone encounter); assessment and decision‐making skills in telephone triage; approaches to managing a variety of situations on the telephone including ‘difficult’ calls using scenarios; skills in using the TAS system; and patient perspectives. Programme contributors were largely drawn from clinical GPs involved with the trial and academic staff. The programme comprised approximately 40 hours in total, with 20 hours taught over 6 weeks and 20 hours of individual practical work and assessment. | |
| Risk of bias | ||
| Bias | Authors' judgement | Support for judgement |
| Random sequence generation (selection bias) | Low risk | The sequence process included a random component. "The trial year was divided into 26 blocks of two weeks. Within each block, one of each pair of matching out of hours periods ‐ for example, Tuesday evenings ‐ was randomly allocated to receive the intervention, the other being allocated to the normal service, by means of a random number generator on a Hewlett Packard 21S pocket calculator". |
| Allocation concealment (selection bias) | Low risk | Patients and investigators enrolling patients could not foresee assignment. |
| Baseline characteristics | Low risk | Baseline characteristics were reported and were similar for both groups. |
| Baseline outcome measurement | Unclear risk | Primary outcomes were not assessed before the intervention. |
| Blinding of participants and personnel (performance bias) | Unclear risk | Personnel (low risk): "The complete pattern of intervention periods was known in advance only to the lead investigators and the trial coordinator. Nurses providing the intervention knew their shifts only after the duty roster for general practitioners providing out of hours care had been fixed. General practitioners were therefore blind to the intervention at the point at which they were able to choose or swap duty periods". Patients (unclear risk): no blinding; however it is unclear whether the outcome was influenced by lack of blinding of patients |
| Blinding of outcome assessment (detection bias) | Unclear risk | No information |
| Incomplete outcome data (attrition bias) | Low risk | Follow‐up of patients > 80% |
| Selective reporting (reporting bias) | Unclear risk | The protocol was not available. |
| Contamination | Unclear risk | No information |
| Bias due to lack of power | Low risk | Sufficient power. "..., we calculated that 5455 patients would be required in each arm of the trial using the formula described by Jones et al". |
| Methods | Randomised trial | |
| Participants | 66 patients (total group), 16+ years, 12% male | |
| Interventions | Intervention: patients allocated to nurse‐led care Detailed description of the intervention: Compared 2 groups delivering care to patients with chronic illnesses:
Supervision, oversight: unknown | |
| Outcomes | Patient outcomes:
Resource utilisation:
| |
| Notes | Country: USA Study period: 12 months Nurse role: ongoing primary care for patients with stable chronic disease Nurse title: not clear Nurse educational background: EQF level unknown Nurse years of experience: unknown Nurse additional training: unknown | |
| Risk of bias | ||
| Bias | Authors' judgement | Support for judgement |
| Random sequence generation (selection bias) | Unclear risk | No information |
| Allocation concealment (selection bias) | Unclear risk | No information |
| Baseline characteristics | Low risk | Baseline characteristics were reported and were similar for both groups. |
| Baseline outcome measurement | Low risk | Baseline outcomes were reported and were similar for both groups. |
| Blinding of participants and personnel (performance bias) | Unclear risk | Not performed |
| Blinding of outcome assessment (detection bias) | Unclear risk | No information |
| Incomplete outcome data (attrition bias) | Low risk | Follow‐up of patients > 80% |
| Selective reporting (reporting bias) | Unclear risk | The protocol was not available. |
| Contamination | High risk | Potential contamination represented by cross‐over of patients/clinicians between groups "On 95% of these occasions, patients were seen by the nurse alone". |
| Bias due to lack of power | Unclear risk | No power calculation performed |
| Methods | Randomised trial | |
| Participants | 1347 patients (total group), mean age 66 years, 69% male | |
| Interventions | Intervention: patients with coronary heart disease allocated to nurse‐led follow‐up Detailed description of the intervention: Compared 3 different interventions for improving secondary preventive care of patients with coronary heart disease delivered at the level of general practice: audit and feedback; recall to a general practitioner; and recall to a nurse clinic
Supervision, oversight: unknown | |
| Outcomes | Patient outcomes:
Process of care:
Resource utilisation:
| |
| Notes | Country: UK Study period: 18 months Nurse role: ongoing primary care for patients with coronary heart disease Nurse title: practice nurse Nurse educational background: EQF level unknown Nurse years of experience: unknown Nurse additional training: Nurses received education on how to implement the clinical protocol. | |
| Risk of bias | ||
| Bias | Authors' judgement | Support for judgement |
| Random sequence generation (selection bias) | Unclear risk | No information |
| Allocation concealment (selection bias) | Unclear risk | No information |
| Baseline characteristics | Low risk | Baseline characteristics were reported and were similar for both groups. "Characteristics of the patients were similar in the three trial groups". "At baseline about 30% of patients were adequately assessed overall". |
| Baseline outcome measurement | Low risk | Baseline outcomes were reported and were similar for both groups. Effect sizes were adjusted for baseline. |
| Blinding of participants and personnel (performance bias) | Unclear risk | Not performed |
| Blinding of outcome assessment (detection bias) | Unclear risk | No information |
| Incomplete outcome data (attrition bias) | Low risk | Follow‐up of patients > 80% |
| Selective reporting (reporting bias) | Unclear risk | The protocol was not available. |
| Contamination | Low risk | Allocation was by practice. "at the level of general practice" |
| Bias due to lack of power | Unclear risk | No power calculation performed |
| Methods | Randomised trial | |
| Participants | 1316 patients (total group), mean age 44.5 years, 25.5% male | |
| Interventions | Intervention: patients allocated to nurse‐led care Detailed description of the intervention: Compared NPs and doctors as primary care providers within a conventional medical care framework at the same medical centre, where all other elements of care were identical. NPs provided all ambulatory primary care, including 24‐hour call, and made independent decisions for referrals to specialists and hospitalisations. NPs and doctors had the same authority to prescribe, consult, refer, and admit patients. Furthermore, they used the same pool of specialists, in‐patient units, and emergency departments. Supervision, oversight: MD supervision of NPs was consistent with New York State and hospital regulations: In New York State, NPs have a written agreement with an MD that states the MD will meet with the NP once or twice a year to review any practice issues, or to discuss certain cases. No on‐site or regular "supervision" is provided. In terms of hospitals in New York State, and an MD must sign off on every hospital admission within 24 hours of admission, but this still allows an NP with privileges to independently admit and care for a patient. | |
| Outcomes | Patient outcomes:
Process of care:
Resource utilisation:
| |
| Notes | Country: USA Study period: 2 years Nurse role: first contact and ongoing primary care Nurse title: nurse practitioners Nurse educational background: EQF level 7 Nurse years of experience: average of 8 to 10 years of experience for NPs in the study Nurse additional training: Additional training was received from MDs in hospital‐based activities, including how to admit and bring necessary resources to the patient (specialists, radiology, lab work, etc); training was also provided in interpreting tests and conducting emergency department evaluations. | |
| Risk of bias | ||
| Bias | Authors' judgement | Support for judgement |
| Random sequence generation (selection bias) | Unclear risk | No method of randomisation was clearly reported. "Those who provided informed consent were randomly and blindly assigned to either the nurse practitioner or 1 of the physician practices. Different assignment ratios were used during the recruitment period. Initially the ratio was 2:1, with more patients assigned to the nurse practitioner practice, because it opened after the physician practices and was able to accept more new patients. Subsequently, the ratio was changed to 1:1 as the nurse practitioner practice’s patient panel increased". |
| Allocation concealment (selection bias) | Unclear risk | Method of concealment was not described in sufficient detail. |
| Baseline characteristics | Low risk | Most baseline characteristics were reported and were similar for both groups. "With regard to demographic characteristics, groups are similar with exception: Significant more patients Medicaid enrolled in physician group (95.7%) versus 87.4% nurse group; p = 0.004". |
| Baseline outcome measurement | Low risk | Baseline outcomes were reported and were similar for both groups. |
| Blinding of participants and personnel (performance bias) | Unclear risk | It is unclear whether the outcome was influenced by lack of blinding of patients and care providers. "Those who provided informed consent were randomly and blindly assigned to either the nurse practitioner or 1 of the physician practices". |
| Blinding of outcome assessment (detection bias) | Unclear risk | No information. |
| Incomplete outcome data (attrition bias) | High risk | Follow‐up of patients < 80% (Figure 1, page 64) 1316 were enrolled, 1040 completed 6‐month interview (79%). 77/145 = 53.1%; 119/145 = 82.06% |
| Selective reporting (reporting bias) | Unclear risk | The protocol was not available. |
| Contamination | High risk | Contamination could have occurred. "The 159 patients (12.1%) who, after the first visit, either went to a clinic other than the one assigned or to multiple primary care clinics were maintained in the initially assigned group for the analyses, consistent with an intent‐to‐treat analysis. All analyses were repeated without these 159 patients, and the results were the same". Art. Lenz et al: "The present analysis is limited to the 406 patients who received primary care only from the assigned practice and made at least one follow‐up visit to that practice during the 2 years following the initial visit. This subsample was the only one that received the treatment as assigned and in which the effect of the treatment could be isolated". |
| Bias due to lack of power | Low risk | Sufficient power |
| Methods | Randomised trial | |
| Participants | 181 patients (total group), 91 intervention group, 90 control group; mean age in intervention group 60.2 (11.3), in control group 57.3 (12.2); 26.5% male in intervention group, 25.7% male in control group 9 nurses 10 doctors (rheumatologists) | |
| Interventions | Intervention: RA patients allocated to nurse‐led care Control: RA patients allocated to rheumatologist care Detailed description of the intervention: Compared 2 groups providing care to patients with a positive diagnosis of RA
Supervision, oversight: Rheumatology nurse‐led clinics were autonomous but were conducted alongside rheumatologist‐led clinics; therefore, a rheumatologist was available on‐site and could be consulted. | |
| Outcomes | Patient outcomes:
Resource utilisation: Costs: EQ5D, costs applied to units of resource use | |
| Notes | Country: UK Study period: 4 years Nurse role: ongoing care for patients with rheumatological arthritis Nurse title: clinical nurse specialist Nurse educational background: EQF level 7 Nurse years of experience: The nurse had a median experience of 10 years in their current post and had experience in running nurse‐led clinics. Nurse additional training: none | |
| Risk of bias | ||
| Bias | Authors' judgement | Support for judgement |
| Random sequence generation (selection bias) | Low risk | The sequence process included a random component. "Randomisation was on a 1 : 1 basis to either NLC (experimental group) or rheumatologist‐led care (RLC) (control group), by random permuted blocks, using the stratification factors, centre and DAS28 (low disease activity DAS28 ≤ 3.2, or moderate to high disease activity DAS28 > 3.2)". |
| Allocation concealment (selection bias) | Low risk | Patients or investigators enrolling patients could not foresee assignments, because a random permuted block method was used. |
| Baseline characteristics | Low risk | Characteristics of patients were similar in both groups, except DMARD. In the analyses, trial authors corrected for DMARD. "The demographics and baseline characteristics of patients under NLC (n = 91) were comparable to those under RLC (n = 90) except in the proportion of patients receiving biological disease‐modifying antirheumatic drugs (DMARD)". "The baseline difference in the proportion of patients receiving biological DMARD was a result of chance (not systematic). In the follow‐up period, the proportion of patients receiving biological agents in NLC remained more or less constant while that in RLC doubled. Assuming that change onto biological agents would significantly improve DAS28, this was likely to favour RLC. Predictably, additional adjustment for baseline biological agents increased the effects on NLC". |
| Baseline outcome measurement | Low risk | Primary outcomes were assessed before the intervention. |
| Blinding of participants and personnel (performance bias) | Unclear risk | It is unclear whether the outcome was influenced by lack of blinding of patients and care providers. |
| Blinding of outcome assessment (detection bias) | Low risk | Outcome assessor was blind. "The independent assessors, performing the joint counts for DAS28, were masked". |
| Incomplete outcome data (attrition bias) | Unclear risk | Follow‐up of patients < 80% However, intention‐to‐treat and per‐protocol analyses were performed. Differences in outcomes were reported. "Of the 622 patients who were assessed for eligibility, 181 were eventually randomly assigned and 133 (73.5%) had complete DAS28 data for all the five visits (PP analysis)". |
| Selective reporting (reporting bias) | Low risk | The protocol was available. |
| Contamination | Low risk | One patient crossed over. It seems that the patient crossing over was registered; therefore no further contamination took place. |
| Bias due to lack of power | Low risk | Sufficient power "Allowing for a 10% participant dropout rate, a total sample size of 180 participants (90 per treatment arm) was needed on the basis of a repeated‐measures analysis of between‐group differences averaged over four equidistant follow‐up time points given 90% power and one‐sided statistical testing with 2.5% significance level (with anticipated SD of 1.5, intraclass correlation coefficient of 0.5)". |
| Methods | Randomised trial | |
| Participants | 812 patients (total group), gender unknown 4 nurses 4 medical officers | |
| Interventions | Intervention: patients with HIV allocated to nurses Control: patients with HIV allocated to medical officers Detailed description of the intervention: Compared nurse‐ vs doctor‐monitored HIV care. All patients were managed under South African National Guidelines for HIV treatment and were given standard ART regimens. Supervision, oversight: unknown | |
| Outcomes | Patient outcomes:
| |
| Notes | Country: South Africa Time period: 47 months Nurse role: primary healthcare nurses Nurse type: primary healthcare nurses Nurse educational background: EQF level unknown Nurse years of experience: unknown Nurse additional training: unknown | |
| Risk of bias | ||
| Bias | Authors' judgement | Support for judgement |
| Random sequence generation (selection bias) | Low risk | The sequence process included a random component. "Participants were randomly assigned in a ratio of 1:1 within sites. Randomisation lists were generated centrally with a stratified permuted block randomisation (with blocks of six). The strata corresponded to the different study sites". |
| Allocation concealment (selection bias) | Low risk | Patients and investigators enrolling patients could not foresee assignment. |
| Baseline characteristics | Low risk | Characteristics of patients were similar in both groups. |
| Baseline outcome measurement | Low risk | Baseline outcome measurement was not relevant. "The primary study outcome was a composite endpoint of possible treatment‐limiting events that could occur on first‐line ART". |
| Blinding of participants and personnel (performance bias) | Unclear risk | Not performed It is unclear whether the outcome was influenced by lack of blinding of patients and care providers. "Neither the participant nor those analysing the data were masked to the assignment". |
| Blinding of outcome assessment (detection bias) | Unclear risk | Not performed It is unclear whether the outcome was influenced by lack of blinding of the outcome assessment. "Neither the participant nor those analysing the data were masked to the assignment". |
| Incomplete outcome data (attrition bias) | Low risk | Follow‐up of patients > 80% There were 10 lost to follow‐up in the nurse group and 14 lost to follow‐up in the doctor group". Trial authors did not mention the reason for loss to follow‐up, but all patients were included in primary outcome analysis. |
| Selective reporting (reporting bias) | Unclear risk | The protocol was not available. |
| Contamination | Low risk | It is unlikely that both groups were contaminated. "To limit contamination between randomised groups, work activity and monitoring schedules were separated with routine visits scheduled on different days of the week, although at least one clinician was available to undertake unscheduled visits in the other group of the study". |
| Bias due to lack of power | Low risk | Sufficient power "The sample size was calculated based on an 18‐month accrual and 96 weeks’ follow‐up with 80% power and α of 0·05. Because we did not record significant household clustering, enrolment was able to be discontinued after 812 patients with no compromise of pre‐established study power". |
| Methods | Randomised trial | |
| Participants | 1815 patients (total group), mean age 27.5 years, 40% male | |
| Interventions | Intervention: patients allocated to nurse Detailed description of the intervention: Compared acceptability and effectiveness of a practice‐based minor illness service led by nurses versus routine care offered by general practitioners. Nurses managed patient care and took the history, performed a physical examination, offered advice and treatment, issued prescriptions (which required a doctor's signature), and referred the patient to the doctor when appropriate. Supervision, oversight: Patients seen by a nurse were referred to a general practitioner when appropriate. | |
| Outcomes | Patient outcomes:
Process of care:
Resource utilisation:
| |
| Notes | Country: UK Study period: 2 weeks Nurse role: first contact care for patients with urgent problems Nurse title: practice nurse Nurse educational background: EQF level unknown Nurse years of experience: average of 8.4 (3.8) years of experience in practice nursing Nurse additional training: 3‐month academically accredited degree level course on managing minor illnesses. Nurses attended one half‐day a week of formal group teaching by a nurse practitioner and were taught twice a week by general practitioners during routine surgeries in the practice where the nurses worked. | |
| Risk of bias | ||
| Bias | Authors' judgement | Support for judgement |
| Random sequence generation (selection bias) | Low risk | Sequence was generated by non‐resealable opaque envelopes. "Allocation to being seen by a doctor or nurse was determined using random permuted blocks of four with sequentially numbered, non‐resealable opaque envelopes". |
| Allocation concealment (selection bias) | Low risk | Allocation was concealed by sequentially numbered, non‐resealable opaque envelopes. "Allocation to being seen by a doctor or nurse was determined using random permuted blocks of four with sequentially numbered, non‐resealable opaque envelopes". |
| Baseline characteristics | Low risk | Baseline characteristics were reported and were similar for both groups. "The two groups of patients were comparable in terms of age, sex, the number who usually preferred to see a female doctor rather than a male, and their reported rates of consultation in the previous 12 months (table 1)". Baseline outcome measures were not relevant. |
| Baseline outcome measurement | Unclear risk | Primary outcomes were not assessed before the intervention. |
| Blinding of participants and personnel (performance bias) | Unclear risk | It is unclear whether the outcome was influenced by lack of blinding of patients and care providers. |
| Blinding of outcome assessment (detection bias) | Unclear risk | No information |
| Incomplete outcome data (attrition bias) | Low risk | For most outcomes, follow‐up was > 80%. Follow‐up for satisfaction questionnaire was > 75%, for mailed questionnaire 76%. |
| Selective reporting (reporting bias) | Unclear risk | The protocol was not available. |
| Contamination | Unclear risk | No information |
| Bias due to lack of power | Low risk | Sufficient power "It was calculated that 1060 valid responses would be sufficient to detect an effect size of 0.2 SD at the 95% confidence level with a power of 90% using two tailed tests". |
| Methods | Randomised trial | |
| Participants | 4325 patients (total group), all ages, 42.5% male | |
| Interventions | Intervention: families allocated to nurse Detailed description of the intervention: not available Supervision, oversight: unknown | |
| Outcomes | Patient outcomes:
Process of care:
Resource utilisation:
| |
| Notes | Country: Canada Study period: 12 months Nurse role: first contact and ongoing primary care Nurse title: nurse practitioners Nurse educational background: EQF level unknown Nurse years of experience: unknown Nurse additional training: unknown | |
| Risk of bias | ||
| Bias | Authors' judgement | Support for judgement |
| Random sequence generation (selection bias) | Unclear risk | No information |
| Allocation concealment (selection bias) | Unclear risk | Method of concealment was not described in sufficient detail. "Because a case load half that of a family physician's was considered manageable for nurse practitioner, the eligible families were stratified by practice of origin, and randomly allocated in a ration of 2:1. They formed a randomized conventional group, assigned to continuing primary clinical services from a family physician and a conventional nurse, and a randomized nurse‐practitioner group, whose first‐contact primary clinical services were to be provided by a nurse practitioner". |
| Baseline characteristics | Low risk | Baseline characteristics were reported and were similar for both groups. "As determined in the 1971 household survey, the patients in the conventional and nurse‐practitioner groups had highly similar values for physical function, ability to carry out usual daily activities and freedom from bed disability the baseline health status of the two groups of patients showed only minor differences that were not statistically significant (at an alpha level of 0.05)". Figure 1: Baseline outcome variable was measured. "Physical status of patients in surveys during baseline and comparison periods" |
| Baseline outcome measurement | Low risk | Baseline outcomes were reported and were similar for both groups. |
| Blinding of participants and personnel (performance bias) | Unclear risk | It is unclear whether the outcome was influenced by lack of blinding of patients and care providers. |
| Blinding of outcome assessment (detection bias) | Unclear risk | No information |
| Incomplete outcome data (attrition bias) | Low risk | Follow‐up of patients > 80% "The resulting cohort that was successfully interviewed in both years included 817 patients, with 296 in the experimental group and 21 in the conventional control group. The referral rates in the surveys were 11% in 1971 and 5% in 1972". |
| Selective reporting (reporting bias) | Unclear risk | The protocol was not available. |
| Contamination | High risk | It is likely that both groups were contaminated, because randomisation was by families within a practice. Not reported whether they protect against contamination |
| Bias due to lack of power | Unclear risk | No power calculation performed |
| Methods | Randomised trial | |
| Participants | 1316 patients (total group), all ages, 42% male | |
| Interventions | Intervention: patients allocated to nurse Detailed description of the intervention: Compared care given by general practitioners and nurse practitioners for patients requesting a same‐day appointment Supervision, oversight: unknown | |
| Outcomes | Patient outcomes:
Process of care:
Resource utilisation:
| |
| Notes | Country: UK Study period: 2 weeks Nurse role: first contact care for patients with urgent problems Nurse title: nurse practitioners Nurse educational background: EQF levels 5, 6, and 7 Nurse years of experience: The median length of time nurses had been qualified as nurse practitioners was 3 (range 1 to 5) years, and the median time as registered nurses was 22 (9 to 35) years. Each nurse practitioner had been seeing patients as first point of contact for at least 2 years. Nurse additional training: unknown | |
| Risk of bias | ||
| Bias | Authors' judgement | Support for judgement |
| Random sequence generation (selection bias) | Low risk | The sequence process included a random component. "In each practice, experimental sessions were booked when both the nurse practitioner and a general practitioner had appointments available for patients who asked to be seen on the same day. Patients were eligible for entry to the study if they requested an appointment the same day and were able to come to the experimental session. If these conditions were satisfied, the receptionist then asked patients whether they would agree to be randomised to see either a[n] NP or a GP. A method of coded block randomisation was developed which meant that neither the receptionist nor the patient could determine the group to which a patient had been allocated at the time of booking. The coded blocks were generated from random number tables. The randomisation code was broken by one of the researchers at the start of each experimental session, at which point it became apparent which patient would see which practitioner. Randomization continued until a minimum of 60 patients in each practice had been allocated to the clinician groups". |
| Allocation concealment (selection bias) | Low risk | Patients and investigators enrolling patients could not foresee assignment. "Method of coded block randomisation was developed which meant that neither the receptionist nor the patient could determine the group to which a patient had been allocated at the time of booking. The coded blocks were generated from random number tables. The randomisation code was broken by one of the researchers at the start of each experimental session, at which point it became apparent which patient would see which practitioner". |
| Baseline characteristics | Low risk | Baseline characteristics were reported and were similar for both groups. |
| Baseline outcome measurement | Unclear risk | No baseline outcome measurement was performed. |
| Blinding of participants and personnel (performance bias) | Unclear risk | GPs and NPs were not blinded. Patients were not blinded. It is unclear whether the outcome was influenced by lack of blinding of patients and care providers. |
| Blinding of outcome assessment (detection bias) | Unclear risk | No information |
| Incomplete outcome data (attrition bias) | High risk | Follow‐up of patients < 80% |
| Selective reporting (reporting bias) | Unclear risk | The protocol was not available. |
| Contamination | Unclear risk | No information Allocation on patient level |
| Bias due to lack of power | Unclear risk | No power calculation performed |
| Methods | Randomised trial | |
| Participants | 1626 patients (1626 randomised, 701 trial population); 64% male 6 practice nurses 25 GPs | |
| Interventions | Intervention: patients at cardiovascular risk allocated to practice nurses Control: patients at cardiovascular risk allocated to GPs Detailed description of the intervention: Compared 2 groups following the Dutch guideline for cardiovascular risk management. Patients in the practice nurse group had a consultation with the practice nurse for assessment of other risk factors, and a 3‐monthly monitoring schedule was set up for patients but was adjusted individually according to the risk profile, (co)morbidity, and patient preferences. Patients could be referred to other professionals, such as a dietician. Substitution involved the following tasks:
Supervision, oversight: unknown | |
| Outcomes | Patient outcomes:
Process of care:
Resource use:
| |
| Notes | Country: Netherlands Study period: not clear (1 measurement at 1 year with an unclear total period of the study) Nurse role: health education: secondary prevention consultation for patients with cardiovascular disease Nurse title: practice nurse Nurse educational background: EQF level 5 Nurse years of experience: unknown Nurse additional training: All nurses received a 1‐day course on motivational interviewing and shared decision‐making. | |
| Risk of bias | ||
| Bias | Authors' judgement | Support for judgement |
| Random sequence generation (selection bias) | Low risk | |
| Allocation concealment (selection bias) | Low risk | |
| Baseline characteristics | Low risk | |
| Baseline outcome measurement | Low risk | Baseline outcomes were reported. "The marginal mean is controlled for health care centre, baseline risk factors, and other confounders". |
| Blinding of participants and personnel (performance bias) | Low risk | |
| Incomplete outcome data (attrition bias) | Low risk | |
| Contamination | High risk | |
| Bias due to lack of power | Low risk | |
Outcomes: If we noted a difference in incomplete outcome data or baseline outcome measurement for different outcomes in the studies, we described these as support for judgement.
ART: antiretroviral therapy.
BP: blood pressure.
CCDS: computerised clinical decision support.
Chol: cholesterol.
CVD: cardiovascular disease.
DAS28: disease activity score 28.
DMARD: disease‐modifying antirheumatic drug.
EQ‐5D: EuroQoL Group Quality of Life Questionnaire.
EQF: European Qualifications Framework.
GI: gastrointestinal.
GNP: geriatric nurse practitioner.
GORD: gastroesophageal reflux disease.
GP: general practitioner.
HbA1c: glycated haemoglobin.
Hdl: high‐density lipoprotein.
HIV: human immunodeficiency virus.
HRQOL: health‐related quality of life.
NLC: nurse‐led care.
NP: nurse practitioner.
NUD: non‐ulcer dyspepsia.
PN: practical nurse.
RA: rheumatoid arthritis.
RLC: rheumatologist‐led care.
SF‐12: Short Form questionnaire.
T2DM: type 2 diabetes mellitus.
Characteristics of excluded studies [ordered by study ID]
| Study | Reason for exclusion |
| CBA design | |
| non‐randomised study | |
| CBA design | |
| Setting: mixed primary healthcare and hospital care | |
| non‐randomised study | |
| Setting: mixed primary care and hospital medicine | |
| Aimed at mental health problems (alcohol abuse and addiction) | |
| CBA design | |
| non‐randomised study |
CBA: controlled before‐after study.
Characteristics of studies awaiting assessment [ordered by study ID]
| Methods | Cluster randomised trial |
| Participants | 40 patients in intervention group. Mean age: 40 (8.4). 65 patients in control group. Mean age: 42 (8,5) 80% male in intervention group, 74% male in control group |
| Interventions | Intervention: patients allocated to nurse‐initiated antiviral therapy Detailed description of the intervention: Patients without contraindications to nurse‐led therapy were offered immediate antiviral therapy administered by their Blood Borne Virus Team nurse in their outreach clinic without physician assessment. Patients who did not fulfil the safety criteria for the ‘nurse led’ treatment arm were referred to one of the specialist addiction units for treatment, that is, were managed according to current standard of care. Supervision, oversight: unknown |
| Outcomes |
|
| Notes | Country: UK Study period: 24‐48 weeks Nurse role: administration of antiviral therapy Nurse title: Blood Borne Virus nurses Nurse educational background: unknown Nurse years of experience: unknown Nurse additional training: unknown |
Data and analyses
| Outcome or subgroup title | No. of studies | No. of participants | Statistical method | Effect size |
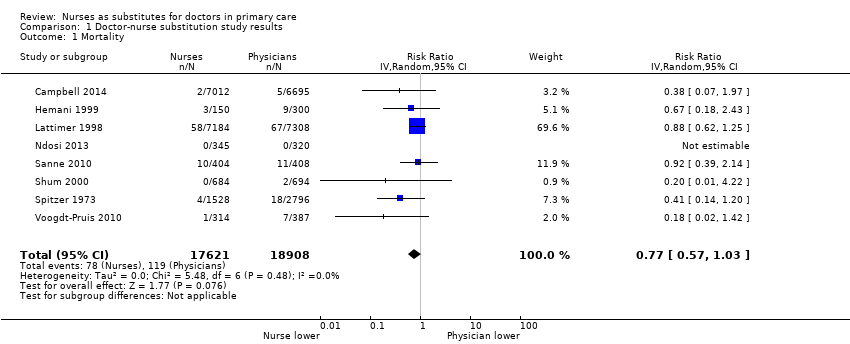
| 1 Mortality Show forest plot | 8 | 36529 | Risk Ratio (IV, Random, 95% CI) | 0.77 [0.57, 1.03] |
| Analysis 1.1  Comparison 1 Doctor‐nurse substitution study results, Outcome 1 Mortality. | ||||
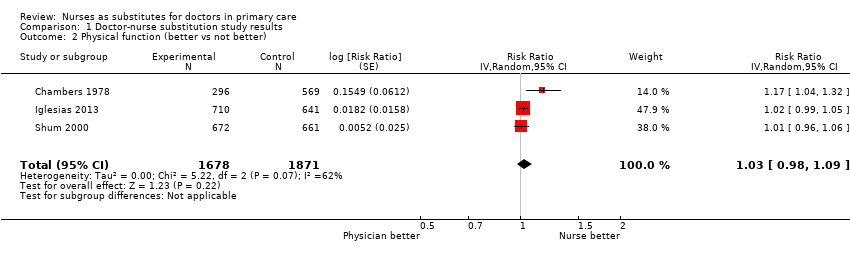
| 2 Physical function (better vs not better) Show forest plot | 3 | 3549 | Risk Ratio (Random, 95% CI) | 1.03 [0.98, 1.09] |
| Analysis 1.2  Comparison 1 Doctor‐nurse substitution study results, Outcome 2 Physical function (better vs not better). | ||||
| 3 Pain Show forest plot | 2 | Mean Difference (Random, 95% CI) | 0.76 [‐3.85, 5.38] | |
| Analysis 1.3  Comparison 1 Doctor‐nurse substitution study results, Outcome 3 Pain. | ||||
| 4 Quality of life Show forest plot | 6 | 16002 | Std. Mean Difference (Random, 95% CI) | 0.16 [0.00, 0.31] |
| Analysis 1.4  Comparison 1 Doctor‐nurse substitution study results, Outcome 4 Quality of life. | ||||
| 5 Systolic blood pressure Show forest plot | 3 | 1023 | Mean Difference (IV, Random, 95% CI) | ‐3.73 [‐6.02, ‐1.44] |
| Analysis 1.5 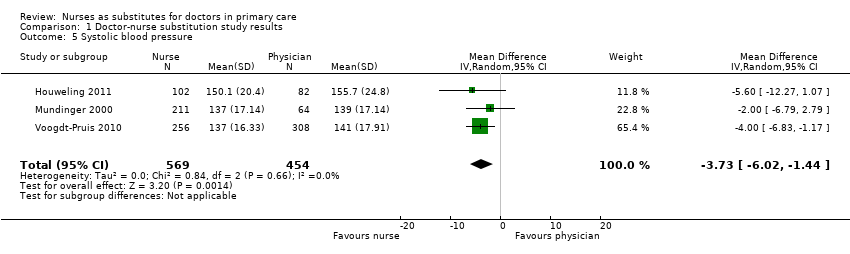 Comparison 1 Doctor‐nurse substitution study results, Outcome 5 Systolic blood pressure. | ||||
| 6 Diastolic blood pressure Show forest plot | 2 | 562 | Mean Difference (IV, Random, 95% CI) | ‐2.54 [‐4.57, ‐0.52] |
| Analysis 1.6  Comparison 1 Doctor‐nurse substitution study results, Outcome 6 Diastolic blood pressure. | ||||
| 7 Total cholesterol Show forest plot | 2 | 702 | Mean Difference (IV, Random, 95% CI) | ‐0.15 [‐0.32, 0.02] |
| Analysis 1.7 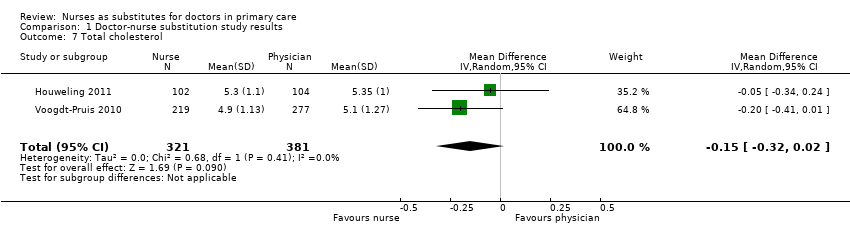 Comparison 1 Doctor‐nurse substitution study results, Outcome 7 Total cholesterol. | ||||
| 8 HbA1c Show forest plot | 2 | 310 | Mean Difference (IV, Random, 95% CI) | 0.08 [‐0.25, 0.41] |
| Analysis 1.8 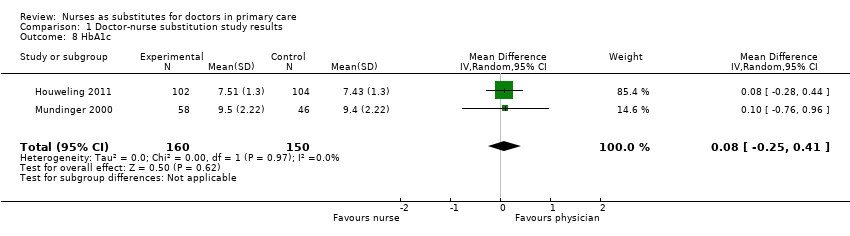 Comparison 1 Doctor‐nurse substitution study results, Outcome 8 HbA1c. | ||||
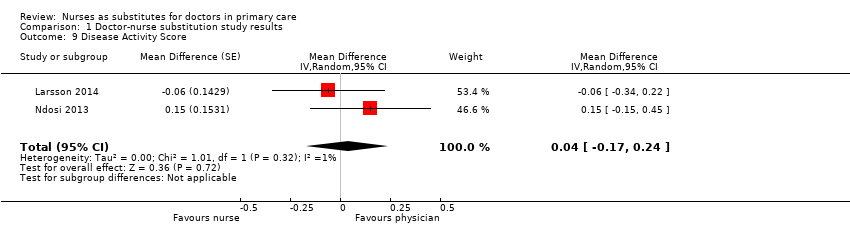
| 9 Disease Activity Score Show forest plot | 2 | Mean Difference (Random, 95% CI) | 0.04 [‐0.17, 0.24] | |
| Analysis 1.9  Comparison 1 Doctor‐nurse substitution study results, Outcome 9 Disease Activity Score. | ||||
| 10 Patient satisfaction Show forest plot | 7 | 16993 | Std. Mean Difference (Random, 95% CI) | 0.08 [0.01, 0.15] |
| Analysis 1.10  Comparison 1 Doctor‐nurse substitution study results, Outcome 10 Patient satisfaction. | ||||
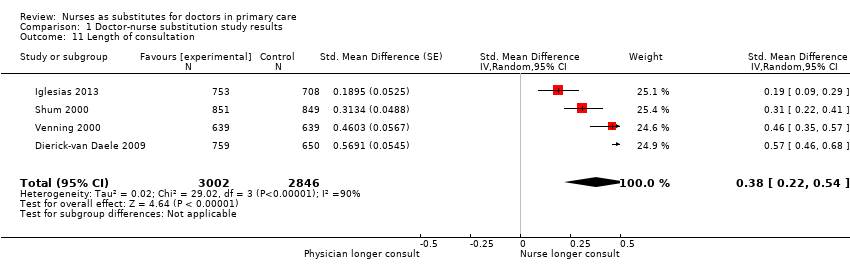
| 11 Length of consultation Show forest plot | 4 | 5848 | Std. Mean Difference (Random, 95% CI) | 0.38 [0.22, 0.54] |
| Analysis 1.11  Comparison 1 Doctor‐nurse substitution study results, Outcome 11 Length of consultation. | ||||
| 12 Scheduled return visits Show forest plot | 3 | 3934 | Risk Ratio (Random, 95% CI) | 1.31 [0.89, 1.94] |
| Analysis 1.12 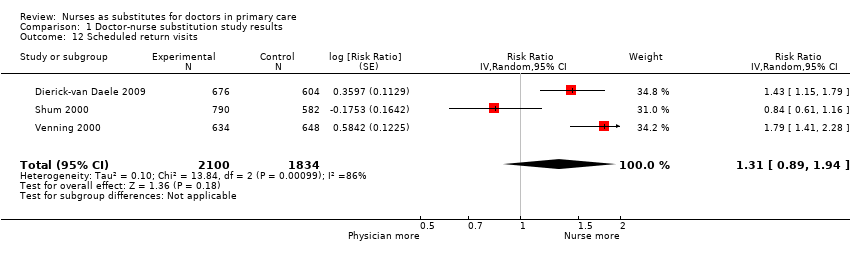 Comparison 1 Doctor‐nurse substitution study results, Outcome 12 Scheduled return visits. | ||||
| 13 Attended return visit Show forest plot | 4 | 5064 | Risk Ratio (Random, 95% CI) | 1.19 [1.07, 1.33] |
| Analysis 1.13  Comparison 1 Doctor‐nurse substitution study results, Outcome 13 Attended return visit. | ||||
| 14 Prescription ordered Show forest plot | 4 | 5702 | Risk Ratio (Random, 95% CI) | 0.99 [0.95, 1.03] |
| Analysis 1.14 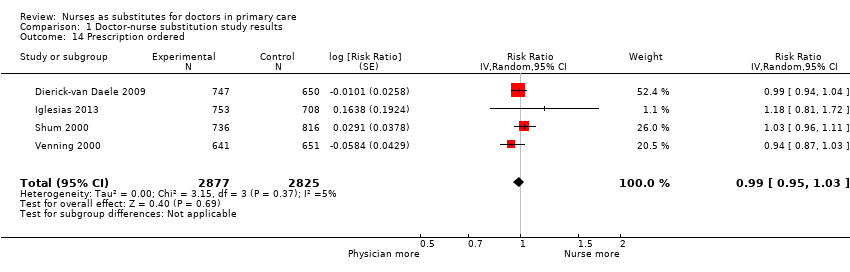 Comparison 1 Doctor‐nurse substitution study results, Outcome 14 Prescription ordered. | ||||
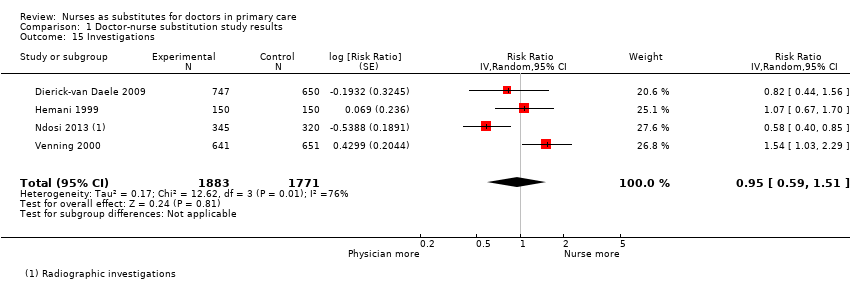
| 15 Investigations Show forest plot | 4 | 3654 | Risk Ratio (Random, 95% CI) | 0.95 [0.59, 1.51] |
| Analysis 1.15  Comparison 1 Doctor‐nurse substitution study results, Outcome 15 Investigations. | ||||
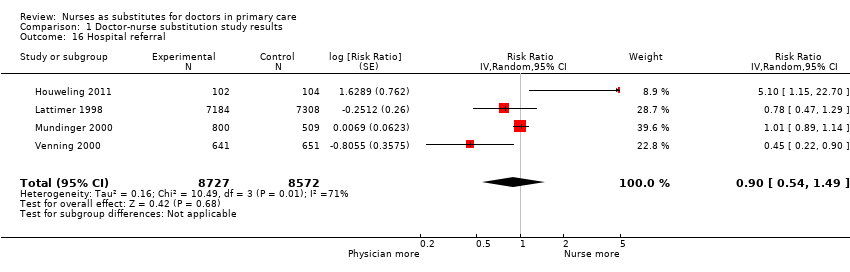
| 16 Hospital referral Show forest plot | 4 | 17299 | Risk Ratio (Random, 95% CI) | 0.90 [0.54, 1.49] |
| Analysis 1.16  Comparison 1 Doctor‐nurse substitution study results, Outcome 16 Hospital referral. | ||||
| 17 Attendance at accident and emergency Show forest plot | 6 | 29905 | Risk Ratio (Random, 95% CI) | 1.00 [0.91, 1.09] |
| Analysis 1.17  Comparison 1 Doctor‐nurse substitution study results, Outcome 17 Attendance at accident and emergency. | ||||
| 18 Hospital admission Show forest plot | 3 | 16466 | Risk Ratio (Random, 95% CI) | 1.04 [0.78, 1.39] |
| Analysis 1.18  Comparison 1 Doctor‐nurse substitution study results, Outcome 18 Hospital admission. | ||||
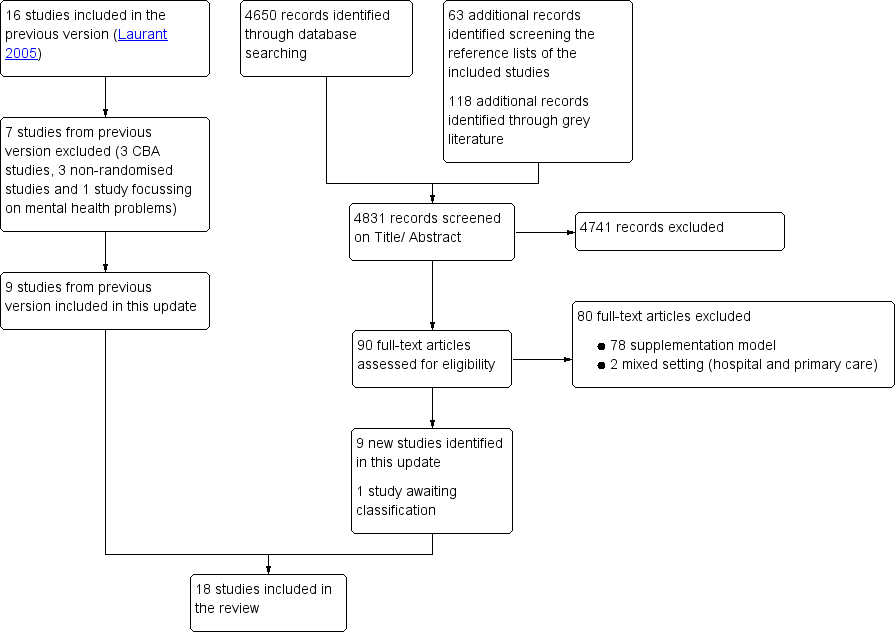
Study flow diagram.
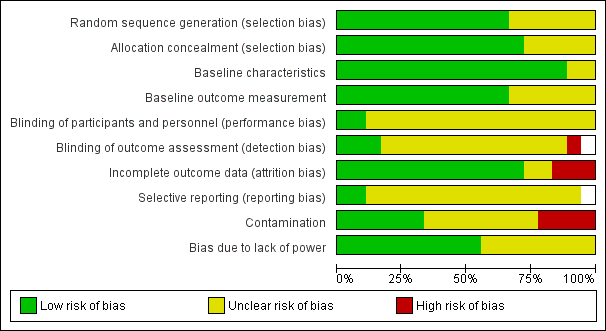
Risk of bias graph: review authors' judgements about each risk of bias item presented as percentages across all included studies.

Risk of bias summary: review authors' judgements about each risk of bias item for each included study.
Comparison 1 Doctor‐nurse substitution study results, Outcome 1 Mortality.
Comparison 1 Doctor‐nurse substitution study results, Outcome 2 Physical function (better vs not better).

Comparison 1 Doctor‐nurse substitution study results, Outcome 3 Pain.

Comparison 1 Doctor‐nurse substitution study results, Outcome 4 Quality of life.

Comparison 1 Doctor‐nurse substitution study results, Outcome 5 Systolic blood pressure.

Comparison 1 Doctor‐nurse substitution study results, Outcome 6 Diastolic blood pressure.

Comparison 1 Doctor‐nurse substitution study results, Outcome 7 Total cholesterol.

Comparison 1 Doctor‐nurse substitution study results, Outcome 8 HbA1c.
Comparison 1 Doctor‐nurse substitution study results, Outcome 9 Disease Activity Score.

Comparison 1 Doctor‐nurse substitution study results, Outcome 10 Patient satisfaction.
Comparison 1 Doctor‐nurse substitution study results, Outcome 11 Length of consultation.

Comparison 1 Doctor‐nurse substitution study results, Outcome 12 Scheduled return visits.

Comparison 1 Doctor‐nurse substitution study results, Outcome 13 Attended return visit.

Comparison 1 Doctor‐nurse substitution study results, Outcome 14 Prescription ordered.
Comparison 1 Doctor‐nurse substitution study results, Outcome 15 Investigations.
Comparison 1 Doctor‐nurse substitution study results, Outcome 16 Hospital referral.

Comparison 1 Doctor‐nurse substitution study results, Outcome 17 Attendance at accident and emergency.

Comparison 1 Doctor‐nurse substitution study results, Outcome 18 Hospital admission.
| Nurse‐led primary care compared with doctor‐led primary care for patient outcomes, process of care and utilisation | ||||||
| Patient or population: all presenting patients in primary care Settings: UK (n = 6), Netherlands (n = 3), USA (n = 3), Canada (n = 3), Sweden (n = 1), Spain (n = 1), South Africa (n = 1) Intervention: substitution of doctors with nurses for primary care Comparison: routine doctor‐led primary care | ||||||
| Outcomes | Impact | Number of participants | Certainty of the evidence | |||
| Illustrative comparative risks* (95% CI) | Effect estimate | Results in words | ||||
| Assumed risk | Corresponding risk | |||||
| Doctor‐led primary care | Nurse‐led primary care | |||||
| Mortality follow‐up: 0.5 to 48 months Mean = 21 (SD 19) months | 6.29 per 1000 | 4.84 per 1000 (4 to 6) | RR 0.77 (0.57 to 1.03) | Nurse‐led primary care may lead to slightly fewer deaths among certain groups of patients, compared to doctor‐led care. However, the results vary and it is possible that nurse‐led primary care makes little or no difference to the number of deaths. | 36,529 (8)1 | ⊕⊕⊝⊝ a |
| Patient health status follow‐up: 0.2 to 47 months Mean = 14 (SD 12) months | Compared to doctor‐led care, nurse‐led primary care probably slightly improves blood pressure control; probably leads to similar outcomes for diabetes indicators and measures of disease activity and pain in people with rheumatological disorders; may lead to similar outcomes for physical functioning; and leads to similar outcomes for cholesterol | Clinical outcomes (3) Self‐reported measurements (13)2 | ⊕⊕⊕⊝ b | |||
| Satisfaction and preferences follow‐up: 0.5 to 25 months Mean = 12 (SD 10) months | Patient satisfaction is probably slightly higher in nurse‐led primary care compared to doctor‐led primary care. | 16,993 | ⊕⊕⊕⊝ c | |||
| Quality of life follow‐up: 6 to 25 months Mean = 15 (SD 9) months | Quality of life may be slightly higher in nurse‐led primary care compared to doctor‐led primary care. | 16,002 | ⊕⊕⊝⊝d | |||
| Process of care follow‐up: 0.5 to 48 months Mean = 17 (SD 15) months | We are uncertain of the effects of nurse‐led care on process of care because the certainty of this evidence was assessed as very low. | (10)5 | ⊕⊝⊝⊝e Very low | |||
| Utilisation (consultations, prescriptions, tests, investigations, and services) follow‐up: 0.2 to 48 months Mean = 14 (SD 13) months | Consultations: Compared to doctor‐led primary care, consultation length is probably longer in nurse‐led primary care; there may be little or no difference in scheduled return visits; and the number of return visits attended is slightly higher for nurses. Prescriptions, tests and investigations: There is little or no difference between nurses and doctors in the number of prescriptions and may be little or no difference in the number of tests and investigations ordered. Use of other services: There may be little or no difference between nurses and doctors in the likelihood of hospital referrals and hospital admissions; little or no difference in attendance at accident and emergency units. | (16)6 | ⊕⊕⊕⊝ f | |||
| Costs follow‐up: 0.2 to 48 months Mean = 14 (SD 14) months | We are uncertain of the effects of nurse‐led care on the cost of care because the certainty of this evidence was assessed as very low. | (9)7 | ⊕⊝⊝⊝ g | |||
| *The basis for the assumed risk is the mean control group risk across studies for pooled results. The corresponding risk is based on the assumed risk in the comparison group and the relative effect of the intervention (and its 95% CI). aDowngraded by 1 for imprecision owing to a wide confidence interval that includes no effect and downgraded by 1 for clinical heterogeneity as the trials contributing to this estimate are quite varied (some focus on people with specific health issues and others on more generalist primary care attenders). bDowngraded by 1. Outcomes were downgraded by 1 for inconsistency, imprecision, indirectness or high risk of bias. The certainty of the evidence is moderate for all outcomes listed, apart for physical functioning for which the certainty of evidence was low and cholesterol for which the certainty of evidence was high. cDowngraded by 1 for inconsistency. dDowngraded by 1 for imprecision, due to a wide confidence interval that touches on the null, and 1 for inconsistency eNon‐comparable results and therefore downgraded to very low. fDowngraded by 1. Outcomes were downgraded by 1 for inconsistency, imprecision or high risk of bias. gNon‐comparable results (the types of costs assessed varied widely and a range of different approaches were used to value resources and calculate costs) and therefore downgraded to very low. 1Campbell 2014; Hemani 1999; Lattimer 1998; Ndosi 2013; Sanne 2010; Shum 2000; Spitzer 1973; Voogdt‐Pruis 2010. 2Campbell 2014; Chambers 1978; Chan 2009; Dierick‐van Daele 2009; Houweling 2011; Iglesias 2013; Larsson 2014; Lattimer 1998; Lewis 1967; Moher 2001; Mundinger 2000; Sanne 2010; Shum 2000; Spitzer 1973; Venning 2000; Voogdt‐Pruis 2010. 3Campbell 2014; Dierick‐van Daele 2009; Iglesias 2013; Larsson 2014; Mundinger 2000; Shum 2000; Venning 2000. 4Campbell 2014; Chan 2009; Dierick‐van Daele 2009; Houweling 2011; Mundinger 2000; Ndosi 2013. 5Campbell 2014; Dierick‐van Daele 2009; Houweling 2011; Moher 2001; Mundinger 2000; Ndosi 2013; Shum 2000; Spitzer 1973; Venning 2000; Voogdt‐Pruis 2010. 6Campbell 2014; Chan 2009; Dierick‐van Daele 2009; Hemani 1999; Houweling 2011; Iglesias 2013; Larsson 2014; Lattimer 1998; Lewis 1967; Moher 2001; Mundinger 2000; Ndosi 2013; Shum 2000; Spitzer 1973; Venning 2000; Voogdt‐Pruis 2010. 7Campbell 2014; Chambers 1978; Chan 2009; Dierick‐van Daele 2009; Lattimer 1998; Lewis 1967; Ndosi 2013; Spitzer 1973; Venning 2000. *there may be additional data in the Campbell 2014 articles that have not been extracted | ||||||
| GRADE Working Group grades of evidence. †Substantially different = a large enough difference that it might affect a decision. | ||||||
| Study | Various health status outcomes |
| Health status: ‐ Emotional function: no differencea ‐ Social function: no differencea | |
| Health status: ‐ Severity of symptoms: Nurse group had greatest improvement. Difference adjusted for baseline 2.3 (95% CI 1.4 to 3.1), P < 0.001 | |
| Health status: ‐ Burden of illness: nurse vs doctor (MD 0.27, P = 0.16) ‐ Concerns about illness: nurse vs doctor (MD 0.11, P = 0.20) ‐ Absence of work: both nurse and doctor 1.11 daysa,b ‐ Ability to perform daily activities: nurse mean 2.53, doctor mean 2.69a,b | |
| Objective measures of patient health (MD (95% CI)): ‐ BMI (kg/m2): nurse ‐0.2 (‐0.5; 0.1), doctor ‐0.3 (‐0.6; ‐0.1), P = 0.377 ‐ Cholesterol/HDL: nurse ‐0.03 (‐0.1; 0.2), doctor ‐0.07 (‐0.1; ‐0.2), P = 0.321 Health status: ‐ Diabetes symptom score: no differencea,b ‐ Fatigue: no differencea,b ‐ Cognitive distress: no differencea,b | |
| Health status: ‐ DAS28‐CRP: nurse vs doctor 0.05 (95% CI ‐0.28 to 0.19, P = 0.70) ‐ ESR (mm/h): nurse vs doctor ‐1.05 (95% CI ‐3.97 to 1.86, P = 0.47) ‐ CRP (mg/L): nurse vs doctor ‐1.07 (95% CI ‐2.02 to ‐0.12, P = 0.03) ‐ Swollen joints (28): nurse vs doctor 0.13 (95% CI ‐2.18 to 0.61, P = 0.60) ‐ Tender joints (28): nurse vs doctor 0.33 (95% CI ‐0.47 to 1.13, P = 0.42) ‐ VAS global health (mm): nurse vs doctor 4.29 (95% CI ‐2.58 to 11.16, P = 0.22) | |
| Health status: ‐ Resolution of symptoms in nurse group from 16.33 to 18.39 (possible range 6 to 24; higher scores mean fewer reductions in complaints). Doctors no change. P < 0.02 | |
| Health status (lifestyle factor): ‐ Smoking: no differencea ‐ Blood pressure (mmHg) systolic: nurse 148 (142 to 153), GP 147 (135 to 153), P = 0.82a ‐ Blood pressure (mmHg) diastolic: nurse 80 (74 to 87), GP 81 (75 to 83), P = 0.82a ‐ Cholesterol (mmol/L) total: nurse 5.4 (5.2 to 5.5), GP 5.5 (5.0 to 5.9), P = 0.61a ‐ Cholesterol (mmol/L) high‐density lipoprotein: nurse 1.2 (1.1 to 1.3), GP 1.2 (1.2 to 1.3), P = 0.83a | |
| Health status (10 dimensions): no differenceb Objective measures of patient health: ‐ Asthma ‐ peak flow: NP 292.82 (94.2), GP 319.90 (136.56), P = 0.365 | |
| Health status: ‐ Fatigue ITT: nurse < doctor; mean (95% CI) 3.38 (‐2.01 to 8.76), P = 0.0171 ‐ Stiffness ITT: nurse < doctor; mean (95% CI) 8.91 (‐2.66 to 20.5), P = 0.0113 ‐ RAQoL ITT: nurse < doctor; mean (95% CI) ‐0.14 (‐1.77 to 1.49), P = 0.0001 ‐ HAQ ITT: nurse > doctor; mean (95% CI) ‐0.07 (‐0.21 to 0.07), P < 0.0001 ‐ HAD‐Anxiety ITT: nurse < doctor; mean (95% CI) 0.54 (‐0.36 to 1.43), P = 0.0179 ‐ HAD‐Depression ITT: nurse < doctor; mean (95% CI) 0.12 (‐0.65 to 0.89), P = 0.0004 ‐ ASES ITT: nurse > doctor; mean (95% CI) ‐0.92 (‐4.96 to 3.12), P = 0.0019 | |
| Health status: ‐ Cumulative failure: nurse 48%, doctor 44% HR (95% CI) 1.09 (0.89 to 1.33) ‐ All virological failure: nurse 11%, doctor 10% HR (95% CI) 1.15 (0.75 to 1.76) ‐ Toxicity failure: nurse 17%, doctor 16% HR (95% CI) 1.04 (0.74 to 1.45) ‐ Death: nurse 3%, doctor 3% HR (95% CI) 0.92 (0.39 to 2.17) | |
| Health status: ‐ Physical function (3 indicators): nurses 86%, doctors 88%b ‐ Emotional function: nurses 58%, doctors 58%b ‐ Social function: nurses 84%, doctors 83%b | |
| Health status: no differencea | |
| Objective measures of patient health: ‐ LDL cholesterol: nurse 2.9, doctors 3.0, P = 0.07 ‐ BMI: nurse 27.2, doctor 27.2, P = 0.87 Health status (lifestyle factor): ‐ Smoking: 4% of smokers in the GP group (4/102) Subgroup: at‐risk patients ‐ Systolic blood pressure: nurse 144.0, doctor 147.6, P = 0.1 ‐ Total cholesterol: nurse 5.2, doctor 5.6, P = 0.006 ‐ LDL cholesterol: nurse 3.1, doctor 3.3, P = 0.16 ‐ BMI: nurse 28.6, doctor 28.6, P = 0.78 | |
| a Authors reported no effect size or reported effect sizes in graphs (no exact effect sizes extracted). b No p‐value reported. ASES: Standardized Shoulder Assessment Form. BMI: body mass index. CI: confidence interval. CRP: C‐reactive protein. DAS28: disease activity score 28. ESR: erythrocyte sedimentation rate. GP: general practitioner. HAD: Hospital and Anxiety Depression Scale. HAQ: Health Assessment Questionnaire. HDL: high‐density lipoprotein. HR: heart rate. ITT: intention‐to‐treat. LDL: low‐density lipoprotein. MD: mean difference. NP: nurse practitioner. RAQoL: Rheumatoid Arthritis Quality of Life Questionnaire. VAS: visual analogue scale. *there may be additional data in the Campbell 2014 articles that have not been extracted | |
| Study | Satisfaction, preference |
| Overall satisfaction: nurse triage vs GP triage MD 2.60 (95% CI 0.58 to 4.63)a | |
| Overall satisfaction: nurse vs doctor (0 to 10), MD ‐0.015, P = 0.83 Communication/attitude (1 to 6) ‐ Understanding: nurse vs doctor, MD ‐0.015, P = 0.41 ‐ Telling the plan: nurse vs doctor, MD ‐0.02, P = 0.74 ‐ Explaination goals and treatment: nurse vs doctor, MD ‐0.01, P = 0.76 ‐ Importance advice: nurse vs doctor, MD ‐0.07, P = 0.17 ‐ Appropriate attention: nurse vs doctor, MD 0.01, P = 0.78 Provision of information (1 to 6) ‐ Cause of problems: nurse vs doctor, MD ‐0.08, P = 0.21 ‐ Relief of symptoms: nurse vs doctor, MD ‐0.04, P = 0.47 ‐ Duration of illness: nurse vs doctor, MD ‐0.09, P = 0.25 ‐ Change of recurrence: nurse vs doctor, MD ‐0.15, P = 0.08 ‐ What to do: nurse vs doctor, MD ‐0.06, P = 0.45 Subgroup at least 1 chronic condition Satisfaction: NP 8.35 (1.07) vs GP 8.11 (1.32), P = 0.02 Judgement seeing the right professional: P = 0.35b Attending same provider in future: P = 0.67 Recommendation to others: P = 0.41 | |
| Satisfaction: ‐ Satisfaction with duration of the visit (0 to 10): doctor 8.1, nurse 8.4; MD (95% CI%) 0.256 (0.016 to 0.496)a ‐ Satisfaction with personal attention (0 to 10): doctor 8.1, nurse 8.4, MD (95% CI%) 0.240 (0.003 to 0.476)a ‐ Satisfaction with explanations and information received in the visit (0 to 10): doctor 8.3, nurse 8.5, MD (95% CI%) 0.240 (0.015 to 0.495)a Provider preference: More than 40% of patients in each group expressed indifference. In the control group, 13.9% of patients would prefer to be seen by a nurse, as opposed to 20.9% in the intervention group.a | |
| Confidence: ‐ NRS confidence: nurse vs doctor: 0.20 (95% CI ‐0.29 to 0.69), P = 0.42 | |
| Provider preference: doctor 5.72 vs nurse 9.80, P < 0.001. Possible range 0 to 20; higher scores indicate a more positive view of the provider. | |
| Satisfaction (9 items): no difference in overall satisfaction, or on any of the 9 subscalesa Would recommend provider to others: no differencea | |
| Leeds Satisfaction Questionnaire ‐ LSQ Week 26 ‐ LSQ‐General: nurse vs doctor effect size: 0.17, P = 0.036 ‐ LSQ‐Information: nurse vs doctor effect size: 0.08, P = 0.327 ‐ LSQ‐Empathy: nurse vs doctor effect size: 0.05, P = 0.557 ‐ LSQ‐Technical: nurse vs doctor effect size: 0.08, P = 0.293 ‐ LSQ‐Attitude: nurse vs doctor effect size: 0.14, P = 0.082 ‐ LSQ‐Access: nurse vs doctor effect size: 0.01, P = 0.936 Week 52 ‐ LSQ‐General: nurse vs doctor effect size: 0.12, P = 0.183 ‐ LSQ‐Information: nurse vs doctor effect size: 0.09, P = 0.301 ‐ LSQ‐Empathy: nurse vs doctor effect size: 0.05, P = 0.578 ‐ LSQ‐Technical: nurse vs doctor effect size: 0.08, P = 0.369 ‐ LSQ‐Attitude: nurse vs doctor effect size: 0.08, P = 0.375 ‐ LSQ‐Access: nurse vs doctor effect size: 0.10, P = 0.248 | |
| Satisfaction: ‐ Professional care: nurse 79.2 (13.4) vs GP 76.7 (15.1), possible range 0 to 100, P = 0.002 ‐ Relationship to provider: nurse 64.3 (15.7) vs GP 64.2 (16.9), possible range 0 to 100, P = 0.945 ‐ Adequacy of time: nurse 73.3 (16.9) vs GP 67.7 (19.3), possible range 0 to 100, P < 0.001 ‐ Explanation helpful: nurse 88.8% vs GP 87.3%, P = 0.359 ‐ Advice helpful: nurse 86.9% vs GP 83.9%, P = 0.060 Provider preference: GP group: 47.5% prefer GP, 2.0% nurse, 50.5% no preference. Nurse group: 31.5% prefer GP, 7.5% nurse, 61% no preference; P < 0.001 | |
| Satisfaction: nurses 96%, doctors 97%a | |
| Satisfaction: Adults ‐ Communication: NP 4.35 (0.54) vs GP 4.21 (0.60), P = 0.001 ‐ Distress relief: NP 4.43 (0.47) vs GP 4.26 (0.57), P = 0.001 ‐ Professional care: NP 4.44 (0.49) vs GP 4.22 (0.57), P < 0.001 Children ‐ General: NP 4.39 (0.46) vs GP 4.17 (0.57), P < 0.001 ‐ Communication with parent: no difference ‐ Communication with child: NP 4.16 (0.63) vs GP 3.67 (0.77), P < 0.001 ‐ Distress relief: NP 4.41 (0.53) vs GP 4.21 (0.64), P = 0.002 ‐ Adherence intent: no difference | |
| ano p‐value reported b authors reported no effect size or reported effect sizes in graphs (no exact effect sizes extracted) CI: confidence interval. GP: general practitioner. LSQ: Leeds Satisfaction Questionnaire. MD: mean difference. NP: nurse practitioner. NRS: Numeric Rating Scale *there may be additional data in the Campbell 2014 articles that have not been extracted | |
| Study | Compliance | Other |
| Rating information (5 items): no differencea,b | ||
| Enablement: nurse vs GP, MD = 0.65 (CI ‐1.50 to 0.19), P = 0.13 | ||
| Patient adherence to medical treatment after 1 year of follow‐up nurse vs doctor (95% CI) Medication blood pressure: 92.2 vs 84.9 (1.06 to 3.73; P = 0.03) Forgetting to take medication: group difference 1.32 (0.88 to 1.97; P = 0.18) ‐ Never: 52.6 vs 61.0 ‐ Sometimes: 46.8 vs 39.0 Patient lifestyle after 1 year of follow‐up nurse vs doctor (95% CI) ‐ Exercise: 28.6 vs 27.3 (0.73 to 1.67; P = 0.79) ‐ Alcohol 5 days per week at most: 78.6 vs 75.5 (0.79 to 2.01; P = 0.33) ‐ Alcohol 2 for woman, 3 for man at most: 79.1 vs 80.6 (0.53 to 1.56; P = 0.73) ‐ Fat intake: 6.5 vs 7.2 (0.02 to 1.28; P = 0.04) | ||
| aTrial authors reported only the direction of the outcome; it is unknown if the difference is statistically significant. bTrial authors reported no effect size or reported effect sizes on graphs (no exact effect sizes extracted). CI: confidence interval. GP: general practitioner. MD: mean difference. | ||
| Study | Provider care |
| Difficulty with (nurse triage vs GP triage, MD (95% CI): Phone access: 6.49 (–1.26 to 14.25)a Receiving prompt care: 6.63 (3.23 to 10.03)a Seeing a doctor or nurse: 3.67 (–0.37 to 7.71)a Getting medical help: 5.09 (2.69 to 7.50)a Convenience of care 3.68 (1.13 to 6.24)a Problem resolution: nurse triage vs GP triage: 0.41 (–1.86 to 2.67)a Process indicators: ‐ Number of contacts per person: nurse vs GP triage: 1·04 (1·01 to 1·08)a ‐ 23% in the GP‐triage group and 12% in the nurse‐triage group had just 1 contact after their initial consultation requestb | |
| Adherence to guidelines: nurse 79.8%, doctor 76.2%a,c | |
| Process indicators: ‐ Patients with last retina control > 24 months ago (n = 64) referred to an ophthalmologist: nurse 24/34 (70.6) vs GP 11/30 (36.7), P = 0.007 ‐ Patients with feet at‐risk (n = 109) for whom measures were taken: nurse 34/60 (56.7) vs GP 13/49 (26.5), P = 0.001 ‐ Patients referred to an internist to start insulin therapy: nurse 10/102 (9.8) vs GP 2/104 (1.9), P = 0.015 ‐ Patients with HbA1c ≥ 7 at baseline (n = 120), for whom glucose‐lowering therapy was intensified: nurse 53/64 (82.8) vs GP 28/56 (50.0), P = 0.001 ‐ Patients with BP > 140/90 at baseline (n = 170) for whom blood pressure‐lowering therapy was intensified: nurse 42/85 (49.4) vs GP 24/85 (28.2), P = 0.005 ‐ Patients not meeting target values for lipid profile at baseline (n = 55), for whom lipid‐lowering therapy was intensified: nurse 13/29 (44.8) vs GP 13/26 (50.0), P = 0.147 | |
| Adequate assessment: ‐ Clinical assessment: nurse vs GP: 9% (95% CI ‐3 to 22), P = 0.13 ‐ Blood pressure: no differencec ‐ Cholesterol: no differencec ‐ Smoking status: no differencec | |
| Documentation of provider behaviour diabetes care: ‐ Education (8 items): overall ‘any education’: nurse 84,9% vs medical doctor 42.4% (P < 0.001). With regard to specific items, nurse more education: 4 out of 7 topics: nutrition, weight, exercise, and medication (P < 0.01) ‐ History taken (5 items): no difference ‐ Monitoring (9 items): nurse ordered/carried out more laboratory tests, such as urinalysis (nurse 80.2%, medical doctor 55.9%, P < 0.01) and glycosylated haemoglobin (A1C value) (nurse 81.4, medical doctor 66.1, P < 0.05); nurse reported more frequently height of patients (nurse 91.9%, medical doctor 71.2%, P < 0.01). On other 6 items, no difference ‐ Referral (1 item): no differences | |
| Interventions: ‐ Giving patient education: nurse > doctor; RR (95% CI) 1.76 (1.15 to 2.69), P = 0.009 ‐ Giving psychosocial support: nurse > doctor; RR (95% CI) 3.29 (2.55 to 4.24), P < 0.0001 | |
| Provision of information: ‐ Self‐medication: nurse 22.2% vs GP 13.7%, P < 0.001 ‐ Self‐management: nurse 81.7% vs GP 57.6%, P < 0.001 | |
| Adequate treatment: ‐ Drug treatment: nurses 71%, doctors 75%a ‐ Management of episodes: nurses 69%, doctors 66%a | |
| Lifestyle and medical intervention nurse vs doctor: ‐ Smoking behaviour 8.2% vs 3.2%a ‐ Blood pressure 35.4% vs 26.6% (1.01 to 2.24; P = 0.04) ‐ Lipids 47.1 vs 22.3 (1.98 to 4.43; P < 0.01) ‐ Weight 36.9 vs 7.6 (4.26 to 12.52; P < 0.01) ‐ Exercise 19.4 vs 3.2a ‐ Food intake 14.6 vs 3.2a ‐ Medication 22.3 vs 14.7 (0.99 to 2.59; P = 0.05) ‐ None 22.8 vs 43.2 (1.69 to 3.86; P < 0.01) Asked about the use of medication: nurse vs doctor Group difference 2.12 (1.38 to 3.26; P < 0.01) ‐ Never 57.4 vs 75.4 ‐ Sometimes 20.0 vs 14.4 ‐ Often 22.1 vs 9.7 | |
| Examinations: nurse vs GP: MD 0.19 (95% CI ‐0.03 to 0.71), P = 0.072 | |
| aNo P value reported. bTrial authors reported only the direction of the outcome; it remains unknown whether the difference is statistically significant. cTrial authors reported no effect size or reported effect sizes in graphs (no exact effect sizes extracted). CI: confidence interval. GP: general practitioner. MD: mean difference. RR: risk ratio. *there may be additional data in the Campbell 2014 articles that have not been extracted | |
| Study | Number, length, and frequency of consultations | Numbers of prescriptions, tests, and investigations | Use of other services |
| Referrals: nurse 12%, doctor 14.2%, P = 0.24a | |||
| Compared to qualified doctors Consultation rate: Nurses 3.52 vs qualified doctors 4.03 (P > 0.05) Compared to residents (trainee doctors) Consultation rate: Nurses 3.52 vs residents 2.95 (P < 0.05) | Mean utilisation rate: Compared to qualified doctors Tests & investigations: Lab tests: NP 32.67, doctor 29.46, P > 0.05 Radiological tests (total): NP 1.68. doctor 1.37, P > 0.05 ‐ CT/MRI: NP 0.32, doctor 0.13, P < 0.05 ‐ Ultrasound: NP 0.16, doctor 0.07, P < 0.05 Compared to residents (trainee doctors) Tests & investigations: Lab tests: NP 32.67, doctor 28.26, P > 0.05 ‐ Urinalysis: NP 1.31, doctor 0.99, P < 0.05 ‐ Thyroid function: NP 0.37, doctor 0.19, P < 0.05 Radiological tests: NP 1.68, doctor 1.48, P > 0.05 | Mean utilisation rate: Compared to qualified doctors Hospital admission: NP 0.43, doctor 0.33, P > 0.05 Emergency room visits: NP 1.22, doctor 1.23, P > 0.05 Specialty visits: NP 5.35, doctor 4.26, P > 0.05 Compared to residents (trainee doctors) Hospital admission: NP 0.43, doctor 0.31, P > 0.05 Emergency department visits: NP 1.22, doctor 1.05, P > 0.05 Specialty visits: NP 5.35, doctor 4.21, P > 0.05 | |
| Mean number of visits: nurse 6.1, GP 2.8 (P < 0.0001) Total duration of visits: significantly higher in nurse groupa Consultation of nurses' patients with GP: Median number of these consultations per patient was 1.4 (25 to 75 quartiles: 0.0 to 2.0) with median time of 1.0 (25 to 75 quartiles: 0.0 to 3.3) minute | |||
| Level of resolution by nurses: Nurses led 86.3% (95% CI 83.6 to 88.7) of consultations without referral to GP (referrals according to protocol indication not included) | |||
| Proportion nurse‐led vs doctor‐led: ‐ Cortisone injections in addition to regular rheumatologist monitoring visits (1:0.7; P = 0.463) ‐ Blood tests (1:3.9; P = 0.014) ‐ Radiography (1:1.6; P = 0.162) ‐ Pharmacological therapy (1:1.1; P = 0.029) | Proportion nurse‐led vs doctor‐led: ‐ Additional telephone calls to a rheumatology nurse (1:1.8; P = 0.060) ‐ Additional telephone calls to a rheumatologist (1:1.9; P =0.287) ‐ Additional rheumatologist visits (1:2.4; P = 0.077) ‐ Team rehabilitation in in‐patient settings (0:79; P = 0.086) ‐ Team rehabilitation in out‐patient settings (15:0; P = 0.135) ‐ Occupational therapist treatments (0:3.0; P = 0.162) ‐ Psychosocial treatments (0:1.0; P = 0.152) ‐ Specialist consultations (1:1.0; P = 0.949) | ||
| Impact on GP workload: ‐ Telephone advice from GP: fewer with nurse‐led care, 35% reductionb ‐ Surgery visits: 10% fewer with nurse‐led careb ‐ Home visits: 6% fewer home visits during intervention periodb | Hospital admission within 24 hours: nurse 2%, GP 6.5%, RR 0.31 (95% CI 0.07 to 1.42) Hospital admission within 3 days: nurse 5%, GP 6.5%, RR 0.77 (95% CI 0.26 to 2.28) Emergency department visit: nurse 3%, GP 2%, RR 1.84 (95% CI 0.31 to 10.82) | ||
| Consultation length: doctor 15 minutes, nurse 30 minutesc Consultation rate: doctor 150 visits, nurse 345 visitsc | Days in hospital: doctor 68 days, nurse 45 daysc | ||
| Prescriptions: ‐ Antihypertensives: no difference, P = 0.35a ‐ Lipid lowering: no difference, P = 0.63a ‐ Antiplatelet: nurse 8% (95% CI 1% to 9%) more than GP (P = 0.031) | |||
| Consultation rate: Doctor patients had higher primary care utilisation than nurse | Speciality visits: no differenced, P = 0.61 | ||
| Consultation length: Mean total consultation time: nurse 111 min, doctor 71 mina,b Consultation rate: Patients attending all 5 sessions: nurse 92%, doctor 85%a,b | ‐ Change in medicines: nurse < doctor; RR (95% CI) 0.58 (0.43 to 0.79), P = 0.0006 ‐ Dosage changes: nurse < doctor; RR (95% CI) 0.52 (0.34 to 0.79), P = 0.0020 ‐ Intra‐articular injections: nurse < doctor; RR (95% CI) 0.82 (0.50 to 1.35), P = 0.4400 ‐ Intramusclar injections: nurse < doctor; RR (95% CI) 0.73 (0.45 to 1.19), P = 0.2100 ‐ Non‐protocol bloods: nurse < doctor; RR (95% CI) 1.02 (0.74 to 1.40), P = 0.9100 | ‐ Referral to physiotherapy: nurse < doctor; RR (95% CI) 1.21 (0.62 to 2.39), P = 0.5800 ‐ Referral to occupational therapy: nurse < doctor; RR (95% CI) 1.74 (0.76 to 3.96), P = 0.1900 ‐ Referral to podiatry: nurse < doctor; RR (95% CI) 0.89 (0.37 to 2.14), P = 0.8000 ‐ Conferrals: nurse < doctor; RR (95% CI) 2.92 (1.77 to 4.83), P < 0.0001 ‐ Referral to other consultants: nurse < doctor; RR (95% CI) 0.58 (0.11 to 3.11), P = 0.5200 | |
| Out‐of‐hours calls: nurse 0.9% vs GP 1.8%, P = 0.218 | |||
| Physical examinations: nurse vs GP; MD 0.19 (95% CI ‐0.03 to 0.71), P = 0.072 | |||
| Referred to professional nurse vs doctor: ‐ Dietician 17.0 vs 8.9b ‐ Physiotherapist 3.1 vs 1.9b ‐ Cardiovascular specialist 1.9 vs 6.3b ‐ Visited a cardiovascular specialist 46.3 vs 45.3 (0.84 to 1.79; P = 0.30) ‐ Admission into hospital because of CVD 10.4 vs 13.4 (0.43 to 1.38; P = 0.38) | |||
| aTrial authors reported no effect size or reported effect sizes in graphs (no exact effect sizes extracted). bNo P value reported. cTrial authors reported only the direction of the outcome; it remains unknown whether the difference is statistically significant. dToo many numbers to report. CI: confidence interval. CT: computed tomography. CVD: cardiovascular disease. GP: general practitioner. MRI: magnetic resonance imaging. NP: nurse practitioner. RR: risk ratio. *there may be additional data in the Campbell 2014 articles that have not been extracted | |||
| Study | Costs based on | Cost outcomes |
|
| Total costs: Mean 28‐day cost estimates for primary outcome contacts: Nurses ‐ £75·68 (63·09) GPs ‐ £75·21 (65·45) | |
|
| Costs of medication use: Nurses – mean £35.5 (SD £48.8) Doctors – mean £71.7 (SD £ 63.1) Mean difference (adjusted baseline level): £39.6 (95% CI 24.2 to 55.1); P < 0.001 | |
|
| Total direct healthcare costs: Nurses: €31.94 Doctors: €40.15 Mean difference (95% CI): €8.21 (3.56 to 12.85); P = 0.001 Total direct healthcare costs and productivity: Nurses: €140.40 Doctors: €145.87 Mean difference (95% CI): €1.48 (‐4.94 to 7.90); P = 0.65 Subgroup younger than 65 years: Total direct healthcare costs and productivity: Nurses: €161.57 Doctors: €170.75 Mean difference (95% CI): €9.18 (4.84 to 13.88); P < 0.001 | |
|
| Total annual rheumatology care per patient: Nurse‐led: €14107,70 Doctor‐led: €16274,90 Mean difference (95% CI): −2167.2 (−3757.3 to −641.7) P = 0.004 | |
|
| Annual direct cost:Nurse‐led service: ‐ £81,237 more than doctor‐led service Savings: Generated in reduced hospital and primary care utilisation £94,422 Net reduction in costs:with nurse‐led service £3,728 to £123,824 (determined by sensitivity analysis) | |
|
| Total direct cost per year: Nurses ‐ $3,251 Doctors ‐ $4,199 Average cost per patient per year: Nurses ‐ $98.51 Doctors ‐ $127.24 | |
|
| NHS resources plus out‐of‐pocket expenditures: Nurses ‐ mean £1276 Doctors ‐ mean £2286 (95% CI ‐352 to 1773) P = 0.1872 | |
|
| Average cost per patient per year: Nurses ‐ $297.01 Doctors – $285.67 | |
|
| Total direct cost per consultation: Nurses – mean £18.11 (SD £33.43; range £0.66 to £297.1) Doctors – mean £20.70 (SD £33.43; range £0.78 to £300.6) Mean difference (adjusted age, sex): £2.33 (95% CI 1.62 to 6.28); P = 0.247 | |
| aSpitzer reported an overall reduction in practice costs following the introduction of nurse practitioners, but this finding was based on observational before‐and‐after data. Data obtained from the related randomised controlled trial (reported above) did not support this finding. A&E: accident and emergency. CI: confidence interval. DEXA: dual energy x‐ray absorptiometry. GP: general practitioner. *there may be additional data in the Campbell 2014 articles that have not been extracted | ||
| Focus of other reviews | Differences from our review | ||||
| Does not include meta‐analyses | Includes nurses working as supplements according to our definition | Includes non‐randomised studies | Focusses on particular countries | Has a particular focus on cost outcomes | |
| This literature review assesses the impact of advanced primary care nursing roles, particularly first contact nursing roles, for patients, nurses themselves, and their colleagues. | x | x | x | ||
| This study used the literature search Horrocks 2002 and aims to estimate resource use for a typical same‐day primary care consultation and the cost difference of employing an extra salaried GP or nurse practitioner. | x | UK | x | ||
| This systematic review compares effects of nurse practitioners and doctors providing care at first point on patient satisfaction, health status, process measures, and quality of care. | x | x | Developed countries | ||
| Martínez‐González 2014a; Martínez‐González 2014b; Martínez‐González 2015a; Martínez‐González 2015b; Martínez‐González 2015c Several systematic reviews investigating effects of nurses working as substitutes for doctors in primary care on clinical effectiveness, course of disease, process care, resource utilisation, and costs. | x | ||||
| This systematic review determines the cost‐effectiveness of nurse practitioners delivering primary and specialised ambulatory care. | x | x | |||
| This structured literature review investigates the value of advance practice nurses in delivering primary care, with a particular emphasis on the contributions of nurse practitioners. | x | x | x | ||
| This systematic reviews compares patient outcomes of care by advanced practice registered nurses (APRNs) to care by other providers (doctors or teams without APRNs). | x | x | x | USA | |
| This systematic review includes 10 studies evaluating the cost and quality of care provided by APRNs in primary care. | x | ||||
| APRN: advanced practice registered nurse. | |||||
| Outcome or subgroup title | No. of studies | No. of participants | Statistical method | Effect size |
| 1 Mortality Show forest plot | 8 | 36529 | Risk Ratio (IV, Random, 95% CI) | 0.77 [0.57, 1.03] |
| 2 Physical function (better vs not better) Show forest plot | 3 | 3549 | Risk Ratio (Random, 95% CI) | 1.03 [0.98, 1.09] |
| 3 Pain Show forest plot | 2 | Mean Difference (Random, 95% CI) | 0.76 [‐3.85, 5.38] | |
| 4 Quality of life Show forest plot | 6 | 16002 | Std. Mean Difference (Random, 95% CI) | 0.16 [0.00, 0.31] |
| 5 Systolic blood pressure Show forest plot | 3 | 1023 | Mean Difference (IV, Random, 95% CI) | ‐3.73 [‐6.02, ‐1.44] |
| 6 Diastolic blood pressure Show forest plot | 2 | 562 | Mean Difference (IV, Random, 95% CI) | ‐2.54 [‐4.57, ‐0.52] |
| 7 Total cholesterol Show forest plot | 2 | 702 | Mean Difference (IV, Random, 95% CI) | ‐0.15 [‐0.32, 0.02] |
| 8 HbA1c Show forest plot | 2 | 310 | Mean Difference (IV, Random, 95% CI) | 0.08 [‐0.25, 0.41] |
| 9 Disease Activity Score Show forest plot | 2 | Mean Difference (Random, 95% CI) | 0.04 [‐0.17, 0.24] | |
| 10 Patient satisfaction Show forest plot | 7 | 16993 | Std. Mean Difference (Random, 95% CI) | 0.08 [0.01, 0.15] |
| 11 Length of consultation Show forest plot | 4 | 5848 | Std. Mean Difference (Random, 95% CI) | 0.38 [0.22, 0.54] |
| 12 Scheduled return visits Show forest plot | 3 | 3934 | Risk Ratio (Random, 95% CI) | 1.31 [0.89, 1.94] |
| 13 Attended return visit Show forest plot | 4 | 5064 | Risk Ratio (Random, 95% CI) | 1.19 [1.07, 1.33] |
| 14 Prescription ordered Show forest plot | 4 | 5702 | Risk Ratio (Random, 95% CI) | 0.99 [0.95, 1.03] |
| 15 Investigations Show forest plot | 4 | 3654 | Risk Ratio (Random, 95% CI) | 0.95 [0.59, 1.51] |
| 16 Hospital referral Show forest plot | 4 | 17299 | Risk Ratio (Random, 95% CI) | 0.90 [0.54, 1.49] |
| 17 Attendance at accident and emergency Show forest plot | 6 | 29905 | Risk Ratio (Random, 95% CI) | 1.00 [0.91, 1.09] |
| 18 Hospital admission Show forest plot | 3 | 16466 | Risk Ratio (Random, 95% CI) | 1.04 [0.78, 1.39] |