Profesionales de enfermería como reemplazantes de los médicos en la atención primaria
Appendices
Appendix 1. Search strategies 2015
CENTRAL, the Cochrane Library (searched 2017)
| ID | Search | Hits |
| #1 | MeSH descriptor: [Nurses] explode all trees | 1141 |
| #2 | MeSH descriptor: [Midwifery] this term only | 322 |
| #3 | (nurse or nurses or midwife or midwives):ti,ab | 12380 |
| #4 | #1 or #2 or #3 | 12750 |
| #5 | MeSH descriptor: [Physicians] this term only | 781 |
| #6 | MeSH descriptor: [General Practitioners] explode all trees | 176 |
| #7 | MeSH descriptor: [Physicians, Family] this term only | 479 |
| #8 | MeSH descriptor: [Physicians, Primary Care] this term only | 127 |
| #9 | (physician* or doctor or doctors or general next practitioner* or GP or GPs or family next practitioner* or "conventional care" or "usual care" or treatment near/1 usual):ti,ab | 37835 |
| #10 | #5 or #6 or #7 or #8 or #9 | 38075 |
| #11 | MeSH descriptor: [Primary Health Care] this term only | 3964 |
| #12 | MeSH descriptor: [Family Practice] explode all trees | 2190 |
| #13 | MeSH descriptor: [Ambulatory Care] this term only | 3294 |
| #14 | MeSH descriptor: [Ambulatory Care Facilities] explode all trees | 1873 |
| #15 | MeSH descriptor: [Community Health Services] this term only | 1056 |
| #16 | MeSH descriptor: [Community Medicine] this term only | 46 |
| #17 | MeSH descriptor: [Home Care Services] this term only | 1831 |
| #18 | ("primary care" or "primary healthcare" or "primary health care" or primary next practice* or general next practice* or family next practice* or outpatient* or "ambulatory care" or "community care" or community next health* or "community medicine" or "home care"):ti,ab | 38393 |
| #19 | #11 or #12 or #13 or #14 or #15 or #16 or #17 or #18 | 43654 |
| #20 | MeSH descriptor: [Community Health Nursing] 2 tree(s) exploded | 390 |
| #21 | MeSH descriptor: [Delegation, Professional] this term only | 3 |
| #22 | [mh Nurses/UT] | 36 |
| #23 | MeSH descriptor: [Midwifery] explode all trees and with qualifier(s): [Manpower ‐ MA] | 3 |
| #24 | MeSH descriptor: [Nurse's Role] this term only | 350 |
| #25 | (substitut* or delegat* or task* near/2 shift* or change* near/2 role* or expand* near/2 role* or extend* near/2 role* or expand* near/2 responsabilit* or extend* near/2 responsabilit* or expand* near/2 task* or extend* near/2 task*):ti,ab and (nurse or nurses or midwife or midwives):ti,ab | 167 |
| #26 | ("nurse led" or "nurse managed" or "nurse run"):ti,ab | 994 |
| #27 | #21 or #22 or #23 or #24 or #25 or #26 | 1461 |
| #28 | MeSH descriptor: [Professional Role] this term only | 186 |
| #29 | MeSH descriptor: [Professional Autonomy] this term only | 36 |
| #30 | MeSH descriptor: [Professional Competence] this term only | 244 |
| #31 | MeSH descriptor: [Clinical Competence] this term only | 2609 |
| #32 | MeSH descriptor: [Task Performance and Analysis] this term only | 2138 |
| #33 | MeSH descriptor: [Outcome Assessment (Health Care)] this term only | 6564 |
| #34 | MeSH descriptor: [Delivery of Health Care] this term only | 911 |
| #35 | (role or competence or performance or skill or skills) near/3 (nurse or nurses or midwife or midwives):ti,ab | 296 |
| #36 | #28 or #29 or #30 or #31 or #32 or #33 or #34 or #35 | 12559 |
| #37 | #4 and #10 and #19 | 1703 |
| #38 | #10 and #20 | 66 |
| #39 | #19 and #27 | 554 |
| #40 | #4 and #19 and #36 | 345 |
| #41 | #37 or #38 or #39 or #40 in Trials | 1972 |
| #42 | MeSH descriptor: [Nurse Practitioners] explode all trees and with qualifier(s): [Organization & administration ‐ OG, Standards ‐ ST, Utilization ‐ UT] | 98 |
| #43 | nurse next (led or managed or management or run or delivered):ti | 587 |
| #44 | #42 or #43 in Trials | 594 |
| #45 | #41 or #44 Publication Year from 2015 to 2017, in Trials | 366 |
CENTRAL, the Cochrane Library (searched 2015)
| #1 | MeSH descriptor: [Nurses] explode all trees | 987 |
| #2 | MeSH descriptor: [Midwifery] this term only | 254 |
| #3 | (nurse or nurses or midwife or midwives):ti,ab | 9484 |
| #4 | #1 or #2 or #3 | 9809 |
| #5 | MeSH descriptor: [Physicians] this term only | 613 |
| #6 | MeSH descriptor: [General Practitioners] explode all trees | 86 |
| #7 | MeSH descriptor: [Physicians, Family] this term only | 465 |
| #8 | MeSH descriptor: [Physicians, Primary Care] this term only | 62 |
| #9 | (physician* or doctor or doctors or general next practitioner* or GP or GPs or family next practitioner* or "conventional care" or "usual care" or treatment near/1 usual):ti,ab | 27535 |
| #10 | #5 or #6 or #7 or #8 or #9 | 27728 |
| #11 | MeSH descriptor: [Primary Health Care] this term only | 3089 |
| #12 | MeSH descriptor: [Family Practice] explode all trees | 2130 |
| #13 | MeSH descriptor: [Ambulatory Care] this term only | 3034 |
| #14 | MeSH descriptor: [Ambulatory Care Facilities] explode all trees | 1642 |
| #15 | MeSH descriptor: [Community Health Services] this term only | 854 |
| #16 | MeSH descriptor: [Community Medicine] this term only | 39 |
| #17 | MeSH descriptor: [Home Care Services] this term only | 1563 |
| #18 | ("primary care" or "primary healthcare" or "primary health care" or primary next practice* or general next practice* or family next practice* or outpatient* or "ambulatory care" or "community care" or community next health* or "community medicine" or "home care"):ti,ab | 30438 |
| #19 | #11 or #12 or #13 or #14 or #15 or #16 or #17 or #18 | 35098 |
| #20 | MeSH descriptor: [Community Health Nursing] 2 tree(s) exploded | 375 |
| #21 | MeSH descriptor: [Delegation, Professional] this term only | 1 |
| #22 | [mh Nurses/UT] | 36 |
| #23 | MeSH descriptor: [Midwifery] explode all trees and with qualifier(s): [Manpower ‐ MA] | 2 |
| #24 | MeSH descriptor: [Nurse's Role] this term only | 310 |
| #25 | (substitut* or delegat* or task* near/2 shift* or change* near/2 role* or expand* near/2 role* or extend* near/2 role* or expand* near/2 responsabilit* or extend* near/2 responsabilit* or expand* near/2 task* or extend* near/2 task*):ti,ab and (nurse or nurses or midwife or midwives):ti,ab | 123 |
| #26 | ("nurse led" or "nurse managed" or "nurse run"):ti,ab | 695 |
| #27 | #21 or #22 or #23 or #24 or #25 or #26 | 1097 |
| #28 | MeSH descriptor: [Professional Role] this term only | 141 |
| #29 | MeSH descriptor: [Professional Autonomy] this term only | 32 |
| #30 | MeSH descriptor: [Professional Competence] this term only | 210 |
| #31 | MeSH descriptor: [Clinical Competence] this term only | 1984 |
| #32 | MeSH descriptor: [Task Performance and Analysis] this term only | 1810 |
| #33 | MeSH descriptor: [Outcome Assessment (Health Care)] this term only | 5316 |
| #34 | MeSH descriptor: [Delivery of Health Care] this term only | 729 |
| #35 | (role or competence or performance or skill or skills) near/3 (nurse or nurses or midwife or midwives):ti,ab | 230 |
| #36 | #28 or #29 or #30 or #31 or #32 or #33 or #34 or #35 | 10124 |
| #37 | #4 and #10 and #19 | 1315 |
| #38 | #10 and #20 | 64 |
| #39 | #19 and #27 | 424 |
| #40 | #4 and #19 and #36 | 300 |
| #41 | #37 or #38 or #39 or #40 in Trials | 1520 |
MEDLINE, Ovid (searched 2017)
| # | Searches | Results |
| 1 | exp Nurse Practitioners/og, st, ut [Organization & Administration, Standards, Utilization] | 4459 |
| 2 | (nurse adj (led or managed or management or run or delivered)).ti. | 1732 |
| 3 | or/1‐2 | 6127 |
| 4 | exp Nurses/ | 80220 |
| 5 | Midwifery/ | 17512 |
| 6 | (nurse or nurses or midwife or midwives).ti,ab. | 238820 |
| 7 | or/4‐6 | 287084 |
| 8 | Physicians/ | 78793 |
| 9 | General Practitioners/ | 5342 |
| 10 | Physicians, Family/ | 15802 |
| 11 | Physicians, Primary Care/ | 2199 |
| 12 | (physician* or doctor or doctors or general practitioner* or GP* or family practitioner? or conventional care or usual care or treatment as usual).ti,ab. | 601268 |
| 13 | or/8‐12 | 639057 |
| 14 | Primary Health Care/ | 64700 |
| 15 | Family Practice/ | 63955 |
| 16 | Ambulatory Care/ | 39608 |
| 17 | exp Ambulatory Care Facilities/ | 50994 |
| 18 | Community Health Services/ | 29745 |
| 19 | Community Medicine/ | 1966 |
| 20 | Home Care Services/ | 31082 |
| 21 | (primary care or primary healthcare or primary health care or primary practice? or general practice? or family practice? or outpatient? or ambulatory care or community care or community health* or community medicine or home care).ti,ab. | 317006 |
| 22 | or/14‐21 | 464085 |
| 23 | Community Health Nursing/ | 19226 |
| 24 | Delegation, Professional/ | 533 |
| 25 | exp Nurses/ma, ut [Manpower, Utilization] | 1944 |
| 26 | Midwifery/ma, ut [Manpower, Utilization] | 354 |
| 27 | Nurse's Role/ | 37906 |
| 28 | (substitut* or delegat* or (task? adj2 shift*) or (change* adj2 role?) or (expand* adj2 role?) or (extend* adj2 role?) or (expand* adj2 responsabilit*) or (extend* adj2 responsabilit*) or (expand* adj2 task?) or (extend* adj2 task?)).ti,ab. and (nurse or nurses or midwife or midwives).mp. | 3511 |
| 29 | (nurse led or nurse managed or nurse run).ti,ab. | 3356 |
| 30 | or/24‐29 | 46163 |
| 31 | Professional Role/ | 10722 |
| 32 | Professional Autonomy/ | 9162 |
| 33 | Professional Competence/ | 22804 |
| 34 | Clinical Competence/ | 78620 |
| 35 | "Task Performance and Analysis"/ | 28279 |
| 36 | "Outcome Assessment (Health Care)"/ | 60323 |
| 37 | Delivery of Health Care/ | 76184 |
| 38 | Health Resources/ma [Manpower] | 1 |
| 39 | ((role or competence or performance or skill?) adj3 (nurse or nurses or midwife or midwives)).ti,ab. | 13857 |
| 40 | or/31‐39 | 286993 |
| 41 | randomized controlled trial.pt. | 456235 |
| 42 | pragmatic clinical trial.pt. | 530 |
| 43 | controlled clinical trial.pt. | 93311 |
| 44 | multicenter study.pt. | 222585 |
| 45 | (randomis* or randomiz* or randomly allocat* or random allocat*).ti,ab. | 530083 |
| 46 | (trial or multicenter or multi center or multicentre or multi centre).ti. | 208025 |
| 47 | or/41‐46 [Modified version of CHSSS Max Sensitivity/Precision 2008] | 984560 |
| 48 | exp Animals/ | 21008246 |
| 49 | Humans/ | 16648674 |
| 50 | 48 not (48 and 49) | 4359572 |
| 51 | review.pt. | 2256553 |
| 52 | meta analysis.pt. | 76540 |
| 53 | news.pt. | 181319 |
| 54 | comment.pt. | 685589 |
| 55 | editorial.pt. | 432663 |
| 56 | cochrane database of systematic reviews.jn. | 13061 |
| 57 | comment on.cm. | 685588 |
| 58 | (systematic review or literature review).ti. | 92433 |
| 59 | or/50‐58 | 7614173 |
| 60 | 47 not 59 | 830997 |
| 61 | 3 and 60 | 487 |
| 62 | 7 and 13 and 22 and 60 | 1798 |
| 63 | 13 and 23 and 60 | 91 |
| 64 | 22 and 30 and 60 | 587 |
| 65 | 7 and 22 and 40 and 60 | 496 |
| 66 | or/61‐65 | 2532 |
| 67 | remove duplicates from 66 | 2360 |
| 68 | limit 67 to yr="2015 ‐ 2017" | 350 |
MEDLINE, Ovid (searched 2015)
| # | Searches | Results |
| 1 | exp Nurses/ | 71138 |
| 2 | Midwifery/ | 15065 |
| 3 | (nurse or nurses or midwife or midwives).ti,ab. | 199597 |
| 4 | or/1‐3 | 244175 |
| 5 | Physicians/ | 61940 |
| 6 | General Practitioners/ | 2235 |
| 7 | Physicians, Family/ | 14696 |
| 8 | Physicians, Primary Care/ | 1355 |
| 9 | (physician* or doctor or doctors or general practitioner* or GP* or family practitioner? or conventional care or usual care or treatment as usual).ti,ab. | 508208 |
| 10 | or/5‐9 | 540257 |
| 11 | Primary Health Care/ | 55075 |
| 12 | Family Practice/ | 59999 |
| 13 | Ambulatory Care/ | 36174 |
| 14 | exp Ambulatory Care Facilities/ | 44114 |
| 15 | Community Health Services/ | 27027 |
| 16 | Community Medicine/ | 1890 |
| 17 | Home Care Services/ | 27898 |
| 18 | (primary care or primary healthcare or primary health care or primary practice? or general practice? or family practice? or outpatient? or ambulatory care or community care or community health* or community medicine or home care).ti,ab. | 263380 |
| 19 | or/11‐18 | 397575 |
| 20 | Community Health Nursing/ | 18468 |
| 21 | Delegation, Professional/ | 431 |
| 22 | exp Nurses/ma, ut [Manpower, Utilization] | 1863 |
| 23 | Midwifery/ma, ut [Manpower, Utilization] | 305 |
| 24 | Nurse's Role/ | 33510 |
| 25 | (substitut* or delegat* or (task? adj2 shift*) or (change* adj2 role?) or (expand* adj2 role?) or (extend* adj2 role?) or (expand* adj2 responsabilit*) or (extend* adj2 responsabilit*) or (expand* adj2 task?) or (extend* adj2 task?)).ti,ab. and (nurse or nurses or midwife or midwives).mp. | 2931 |
| 26 | (nurse led or nurse managed or nurse run).ti,ab. | 2509 |
| 27 | or/21‐26 | 40314 |
| 28 | Professional Role/ | 8704 |
| 29 | Professional Autonomy/ | 8537 |
| 30 | Professional Competence/ | 20500 |
| 31 | Clinical Competence/ | 66723 |
| 32 | "Task Performance and Analysis"/ | 24353 |
| 33 | "Outcome Assessment (Health Care)"/ | 50016 |
| 34 | Delivery of Health Care/ | 66159 |
| 35 | Health Resources/ma [Manpower] | 1 |
| 36 | ((role or competence or performance or skill?) adj3 (nurse or nurses or midwife or midwives)).ti,ab. | 11774 |
| 37 | or/28‐36 | 245604 |
| 38 | randomized controlled trial.pt. | 382060 |
| 39 | pragmatic clinical trial.pt. | 92 |
| 40 | controlled clinical trial.pt. | 88475 |
| 41 | multicenter study.pt. | 177243 |
| 42 | (randomis* or randomiz* or randomly allocat* or random allocat*).ti,ab. | 410331 |
| 43 | (trial or multicenter or multi center or multicentre or multi centre).ti. | 154503 |
| 44 | or/38‐43 [Modified version of CHSSS Max Sensitivity/Precision 2008] | 800967 |
| 45 | exp Animals/ | 17606521 |
| 46 | Humans/ | 13630323 |
| 47 | 45 not (45 and 46) | 3976198 |
| 48 | review.pt. | 1925848 |
| 49 | meta analysis.pt. | 52132 |
| 50 | news.pt. | 165705 |
| 51 | comment.pt. | 606507 |
| 52 | editorial.pt. | 366834 |
| 53 | cochrane database of systematic reviews.jn. | 10839 |
| 54 | comment on.cm. | 606507 |
| 55 | (systematic review or literature review).ti. | 55879 |
| 56 | or/47‐55 | 6755068 |
| 57 | 44 not 56 | 679799 |
| 58 | 4 and 10 and 19 and 57 | 1440 |
| 59 | 10 and 20 and 57 | 87 |
| 60 | 19 and 27 and 57 | 428 |
| 61 | 4 and 19 and 37 and 57 | 400 |
| 62 | or/58‐61 | 1809 |
CINAHL, EbscoHost (searched 2017)
| # | Query | Results |
| S61 | S59 AND S60 | 62 |
| S60 | PY 2015 OR PY 2016 OR PY 2017 | 453,305 |
| S59 | S49 AND S57 [Exclude MEDLINE records] | 328 |
| S58 | S49 AND S57 | 1,354 |
| S57 | S50 OR S51 OR S52 OR S53 OR S54 OR S55 OR S56 | 218,043 |
| S56 | TI trial or multicenter or "multi center" or multicentre or "multi centre" | 46,982 |
| S55 | TI ( randomis* or randomiz* or randomly) OR AB ( randomis* or randomiz* or randomly) | 120,964 |
| S54 | (MH "Multicenter Studies") | 22,224 |
| S53 | (MH "Clinical Trials") | 87,754 |
| S52 | (MH "Randomized Controlled Trials") | 30,526 |
| S51 | PT clinical trial | 52,908 |
| S50 | PT randomized controlled trial | 30,877 |
| S49 | S44 OR S45 OR S46 OR S47 OR S48 | 30,520 |
| S48 | S4 AND S17 AND S39 | 2,019 |
| S47 | S17 AND S27 | 5,416 |
| S46 | S8 AND S18 | 801 |
| S45 | S4 AND S8 AND S17 | 4,523 |
| S44 | S41 OR S42 OR S43 | 22,587 |
| S43 | TI ( nurse W0 (led or managed or management or run or delivered) ) | 2,045 |
| S42 | (MH "Clinical Nurse Specialists") | 5,529 |
| S41 | (MH "Nurse Practitioners+") | 15,944 |
| S40 | S28 OR S29 OR S30 OR S31 OR S32 OR S33 OR S34 OR S35 OR S36 OR S37 OR S38 OR S39 | 158,594 |
| S39 | TI ( (role or competence or performance or skill or skills) N3 (nurse or nurses or midwife or midwives) ) OR AB ( (role or competence or performance or skill or skills) N3 (nurse or nurses or midwife or midwives) ) | 19,444 |
| S38 | (MH "Health Resource Utilization/MA") | 1,017 |
| S37 | (MH "Health Care Delivery") | 26,197 |
| S36 | (MH "Outcome Assessment") | 19,978 |
| S35 | (MH "Task Performance and Analysis") | 6,102 |
| S34 | (MH "Professional Competence") | 9,330 |
| S33 | (MH "Nursing Skills") | 3,090 |
| S32 | (MH "Clinical Competence") | 21,138 |
| S31 | (MH "Professional Autonomy") | 3,383 |
| S30 | (MH "Physician's Role") | 6,094 |
| S29 | (MH "Nursing Role") | 40,396 |
| S28 | (MH "Professional Role") | 21,193 |
| S27 | S19 or S20 or S21 or S22 or S25 or S26 | 49,630 |
| S26 | TI ( "nurse led" or "nurse managed" or "nurse run" ) OR AB ( "nurse led" or "nurse managed" or "nurse run" ) | 3,147 |
| S25 | S23 AND S24 | 4,157 |
| S24 | TX ( nurse or nurses or midwife or midwives ) OR TX ( nurse or nurses or midwife or midwives ) | 543,661 |
| S23 | TI ( substitut* or delegat* or (task* N2 shift*) or (change* N2 role*) or (expand* N2 role*) or (extend* N2 role*) or (expand* N2 responsabilit*) or (extend* N2 responsabilit*) or (expand* N2 task*) or (extend* N2 task*) ) OR AB ( substitut* or delegat* or (task* N2 shift*) or (change* N2 role*) or (expand* N2 role*) or (extend* N2 role*) or (expand* N2 responsabilit*) or (extend* N2 responsabilit*) or (expand* N2 task*) or (extend* N2 task*) ) | 13,864 |
| S22 | (MH "Nursing Role") | 40,396 |
| S21 | (MH "Midwives+/MA/UT") | 210 |
| S20 | (MH "Nurses+/MA/UT") | 2,301 |
| S19 | (MH "Delegation of Authority") | 1,623 |
| S18 | (MH "Community Health Nursing+") | 23,411 |
| S17 | S9 OR S10 OR S11 OR S12 OR S13 OR S14 OR S15 OR S16 | 141,570 |
| S16 | TI ( "primary care" or "primary healthcare" or "primary health care" or primary W0 practice* or general W0 practice* or family W0 practice* or outpatient* or "ambulatory care" or "community care" or community W0 health* or "community medicine" or "home care" ) OR AB ( "primary care" or "primary healthcare" or "primary health care" or primary W0 practice* or general W0 practice* or family W0 practice* or outpatient* or "ambulatory care" or "community care" or community W0 health* or "community medicine" or "home care" ) | 89,176 |
| S15 | (MH "Home Health Care") | 15,668 |
| S14 | (MH "Community Medicine") | 46 |
| S13 | (MH "Community Health Services") | 12,590 |
| S12 | (MH "Ambulatory Care Facilities+") | 9,408 |
| S11 | (MH "Ambulatory Care") | 6,683 |
| S10 | (MH "Family Practice") | 12,121 |
| S9 | (MH "Primary Health Care") | 34,178 |
| S8 | S5 OR S6 OR S7 | 130,746 |
| S7 | TI ( physician* or doctor or doctors or (general W0 practitioner*) or GP or GPs or (family W0 practitioner*) or "conventional care" or "usual care" or "treatment as usual" ) OR AB ( physician* or doctor or doctors or (general W0 practitioner*) or GP or GPs or (family W0 practitioner*) or "conventional care" or "usual care" or "treatment as usual" ) | 105,241 |
| S6 | (MH "Physicians, Family") | 9,248 |
| S5 | (MH "Physicians") | 35,499 |
| S4 | S1 OR S2 OR S3 | 327,119 |
| S3 | TI ( nurse or nurses or midwife or midwives ) OR AB ( nurse or nurses or midwife or midwives ) | 233,516 |
| S2 | (MH "Midwives+") | 9,480 |
| S1 | (MH "Nurses+") | 165,004 |
CINAHL, EbscoHost (searched 2015)
| # | Query | Results |
| S54 | S49 OR S50 OR S51 OR S52 Exclude MEDLINE records | 259 |
| S53 | S49 OR S50 OR S51 OR S52 | 1,199 |
| S52 | S4 AND S17 AND S40 AND S48 | 1,065 |
| S51 | S17 AND S27 AND S48 | 245 |
| S50 | S8 AND S18 AND S48 | 48 |
| S49 | S4 AND S8 AND S17 AND S48 | 537 |
| S48 | S41 OR S42 OR S43 OR S44 OR S45 OR S46 OR S47 | 177,524 |
| S47 | TI trial or multicenter or "multi center" or multicentre or "multi centre" | 35,740 |
| S46 | TI ( randomis* or randomiz* or randomly) OR AB ( randomis* or randomiz* or randomly) | 99,382 |
| S45 | (MH "Multicenter Studies") | 8,673 |
| S44 | (MH "Clinical Trials") | 80,747 |
| S43 | (MH "Randomized Controlled Trials") | 20,909 |
| S42 | PT clinical trial | 51,624 |
| S41 | PT randomized controlled trial | 24,980 |
| S40 | S28 OR S29 OR S30 OR S31 OR S32 OR S33 OR S34 OR S35 OR S36 OR S37 OR S38 OR S39 | 956,442 |
| S39 | TI ( (role or competence or performance or skill or skills) N3 (nurse or nurses or midwife or midwives) ) OR AB ( (role or competence or performance or skill or skills) N3 (nurse or nurses or midwife or midwives) ) | 16,049 |
| S38 | (MH "Health Resource Utilization/MA") | 890,003 |
| S37 | (MH "Health Care Delivery") | 23,166 |
| S36 | (MH "Outcome Assessment") | 17,332 |
| S35 | (MH "Task Performance and Analysis") | 5,148 |
| S34 | (MH "Professional Competence") | 8,480 |
| S33 | (MH "Nursing Skills") | 2,663 |
| S32 | (MH "Clinical Competence") | 18,541 |
| S31 | (MH "Professional Autonomy") | 3,105 |
| S30 | (MH "Physician's Role") | 5,524 |
| S29 | (MH "Nursing Role") | 37,124 |
| S28 | (MH "Professional Role") | 18,725 |
| S27 | S19 or S20 or S21 or S22 or S25 or S26 | 45,412 |
| S26 | TI ( "nurse led" or "nurse managed" or "nurse run" ) OR AB ( "nurse led" or "nurse managed" or "nurse run" ) | 2,769 |
| S25 | S23 AND S24 | 3,814 |
| S24 | TX ( nurse or nurses or midwife or midwives ) OR TX ( nurse or nurses or midwife or midwives ) | 450,292 |
| S23 | TI ( substitut* or delegat* or (task* N2 shift*) or (change* N2 role*) or (expand* N2 role*) or (extend* N2 role*) or (expand* N2 responsabilit*) or (extend* N2 responsabilit*) or (expand* N2 task*) or (extend* N2 task*) ) OR AB ( substitut* or delegat* or (task* N2 shift*) or (change* N2 role*) or (expand* N2 role*) or (extend* N2 role*) or (expand* N2 responsabilit*) or (extend* N2 responsabilit*) or (expand* N2 task*) or (extend* N2 task*) ) | 12,387 |
| S22 | (MH "Nursing Role") | 37,124 |
| S21 | (MH "Midwives+/MA/UT") | 179 |
| S20 | (MH "Nurses+/MA/UT") | 2,019 |
| S19 | (MH "Delegation of Authority") | 1,524 |
| S18 | (MH "Community Health Nursing+") | 21,668 |
| S17 | S9 OR S10 OR S11 OR S12 OR S13 OR S14 OR S15 OR S16 | 125,143 |
| S16 | TI ( "primary care" or "primary healthcare" or "primary health care" or primary W0 practice* or general W0 practice* or family W0 practice* or outpatient* or "ambulatory care" or "community care" or community W0 health* or "community medicine" or "home care" ) OR AB ( "primary care" or "primary healthcare" or "primary health care" or primary W0 practice* or general W0 practice* or family W0 practice* or outpatient* or "ambulatory care" or "community care" or community W0 health* or "community medicine" or "home care" ) | 78,393 |
| S15 | (MH "Home Health Care") | 14,528 |
| S14 | (MH "Community Medicine") | 36 |
| S13 | (MH "Community Health Services") | 11,175 |
| S12 | (MH "Ambulatory Care Facilities+") | 8,574 |
| S11 | (MH "Ambulatory Care") | 6,117 |
| S10 | (MH "Family Practice") | 10,420 |
| S9 | (MH "Primary Health Care") | 30,073 |
| S8 | S5 OR S6 OR S7 | 114,891 |
| S7 | TI ( physician* or doctor or doctors or (general W0 practitioner*) or GP or GPs or (family W0 practitioner*) or "conventional care" or "usual care" or "treatment as usual" ) OR AB ( physician* or doctor or doctors or (general W0 practitioner*) or GP or GPs or (family W0 practitioner*) or "conventional care" or "usual care" or "treatment as usual" ) | 91,989 |
| S6 | (MH "Physicians, Family") | 8,240 |
| S5 | (MH "Physicians") | 31,958 |
| S4 | S1 OR S2 OR S3 | 301,180 |
| S3 | TI ( nurse or nurses or midwife or midwives ) OR AB ( nurse or nurses or midwife or midwives ) | 216,144 |
| S2 | (MH "Midwives+") | 8,346 |
| S1 | (MH "Nurses+") | 151,395 |
Open Grey = 21 hits (27.02.2017)
1. ("nurse led" OR "nurse managed" OR "nurse run" OR "nurse delivered") = 18 hits
2. (substitute OR substitution OR substituting) AND (nurse OR nurses) AND (doctor OR doctors OR physician OR physicians OR "general practitioner" OR "general practitioners") = 3 hits
Grey Literature Report = 97 hits (27.02.2017)
The Grey Literature Report was searched on 27 February 2017 using different search terms:
1. "nurse practitioner" = 14 hits
2. "nurse clinician" = 1 hit
3. "nurse led" = 6 hits
4. "nurse managed" = 65 hits
6. "nurse delivered" = 11 hits
7. substitut ‐ with Additional Keywords: doctor = 0 hits
8. substitut ‐ with Additional Keywords: physician = 0 hits
9. substitut ‐ with Additional Keywords: "general practitioner" = 0 hits
International Clinical Trials Registry Platform (ICTRP), Word Health Organization (WHO): www.who.int/ictrp/en/= 71 hits (21.02.2017)
1. Advanced search: nurse led OR nurse managed OR nurse run OR nurse delivered [in Title + Recruitment status: All]
OR
nurse led OR nurse managed OR nurse run OR nurse delivered [in Intervention + Recruitment status: All]
2. Advanced search: substitut* AND nurse* AND (doctor* OR physician* OR general practitioner OR general practitioners) [in Title + Recruitment status: All]
OR
substitut* AND nurse* AND (doctor* OR physician* OR general practitioner OR general practitioners) [in Intervention + Recruitment status: All]
ClinicalTrials.gov, US National Institutes of Health (NIH):clinicaltrials.gov/= 172 hits (21.02.2017)
1. Search Terms: "nurse led" OR "nurse managed" OR "nurse run" OR "nurse delivered"
2. Search Terms: (substitute OR substitution OR substituting) AND (nurse OR nurses) AND (doctor OR doctors OR physician OR physicians OR "general practitioner" OR "general practitioners")
Science Citation Index and the Social Sciences Citation Index, Web of Science, Thomson Reuters = 41 hits (2015)
Citation search for the following studies: Campbell 2014; Houweling 2011; Iglesias 2013; Larsson 2014; Ndosi 2014
Appendix 2. GRADE profiles
Assessing the certainty [1]of evidence across studies for an outcome
Comparison nurse ‐ doctor substitution in primary care
Certainty assessment of evidence for each outcome
| No of studies | Design | Risk of bias | Inconsistency | Indirectness [2] | Imprecision | Other [3] | Certainty (overall score) [4] | |||
| Outcome: mortality | ||||||||||
| 8 | Randomised trials | No serious risk of bias | The trials contributing to this estimate are quite varied (some focus on people with specific health issues and others on more generalist primary care attenders (‐1) | No serious indirectness | Wide CI that includes no effect (‐1) | None | Low | |||
| Outcome: patient health status | ||||||||||
| Clinical outcomes (3) Self‐reported measurements (13) | Randomised trials | No serious risk of bias | Some studies: effect varies between trials (‐0.5) | No serious indirectness | Some studies: wide CI (‐0.5) | None | Moderate | |||
| Outcome: physical function | ||||||||||
| 3 | Randomised trials | No serious risk of bias | Effect varies between trials. (‐1) | No serious indirectness | No serious imprecision | None | Moderrate | |||
| Outcome: pain | ||||||||||
| 2 | Randomised trials | No serious risk of bias | No serious inconsistency | Only patients with rheumatoid arthritis were included (‐1). | No serious imprecision | None | Moderate | |||
| Outcome: systolic blood pressure | ||||||||||
| 3 | Randomised trials | High risk of bias in 1 out of 3 studies (‐1) | No serious inconsistency | No serious indirectness | No serious imprecision | None | Moderate | |||
| Outcome: diastolic blood pressure | ||||||||||
| 2 | Randomised trials | High risk of bias in 1 out of 2 studies (‐1) | No serious inconsistency | No serious indirectness | No serious imprecision | None | Moderate | |||
| Outcome: total cholesterol | ||||||||||
| 2 | Randomised trials | No serious risk of bias | No serious inconsistency | No serious indirectness | No serious imprecision | None | High | |||
| Outcome: HbA1C | ||||||||||
| 2 | Randomised trials | High risk of bias in 1 out of 2 studies (‐1) | No serious inconsistency | No serious indirectness | No serious imprecision | None | Moderate | |||
| Outcome: DAS | ||||||||||
| 2 | Randomised trials | No serious risk of bias | No serious inconsistency | Only patients with rheumatoid arthritis were included. (‐1) | No serious imprecision | None | Moderate | |||
| Outcome: satisfaction and preference | ||||||||||
| 7 | Randomised trials | No serious risk of bias | Important heterogeneity (‐1) | No serious indirectness | No serious imprecision | None | Moderate | |||
| Outcome: quality of life | ||||||||||
| 6 | Randomised trials | No serious risk of bias | Important heterogeneity (‐1) | No serious indirectness | Wide CI that includes no effect (‐1) | None | Low | |||
| Outcome: process of care ‐ no GRADE due to no pooled analyses and a wide range of outcomes | ||||||||||
| Outcome: utilisation | ||||||||||
| 19 | Randomised trials | No serious risk of bias | Some outcomes: important heterogeneity and effects that vary between trials (‐0.5) | No serious indirectness | Some outcomes: Wide CI (‐0.5) | None | Moderate | |||
| Outcome: length of consultation | ||||||||||
| 4 | Randomised trials | No serious risk of bias | Important heterogeneity (‐1) | No serious indirectness | No serious imprecision | None | Moderate | |||
| Outcome scheduled: return visits | ||||||||||
| 3 | Randomised trials | No serious risk of bias | Important heterogeneity (‐1) | No serious indirectness | Wide CI (‐1) | None | Low | |||
| Outcome: attended return visits | ||||||||||
| 4 | Randomised trials | No serious risk of bias | No serious inconsistency | No serious indirectness | No serious imprecision | None | High | |||
| Outcome: prescriptions ordered | ||||||||||
| 4 | Randomised trials | No serious risk of bias | No serious inconsistency | No serious indirectness | No serious imprecision | None | High | |||
| Outcome: investigations | ||||||||||
| 4 | Randomised trials | No serious risk of bias | Important heterogeneity (‐1) | No serious indirectness | Wide CI (‐1) | None | Low | |||
| Outcome: hospital referral | ||||||||||
| 5 | Randomised trials | No serious risk of bias | Important heterogeneity (‐1) | No serious indirectness | Wide CI (‐1) | None | Low | |||
| Outcome: attendance at A&E | ||||||||||
| 6 | Randomised trials | No serious risk of bias | No serious inconsistency | No serious indirectness | No serious imprecision | None | High | |||
| Outcome: hospital admission | ||||||||||
| 3 | Randomised trials | High risk of bias in 1 out of 3 studies (‐1). | No serious inconsistency | No serious indirectness | Wide CI (‐1) | None | Low | |||
| Outcome: costs ‐ no grade since the types of costs assessed varied widely and a range of different approaches were used to value resources and calculate costs | ||||||||||
[1] This can also be referred to as ‘quality of the evidence’ or ‘confidence in the estimate’. The “certainty of the evidence” is an assessment of how good an indication the research provides of the likely effect; i.e. the likelihood that the effect will be substantially different from what the research found. By “substantially different”, we mean a large enough difference that it might affect a decision.
[2] Indirectness includes consideration of:
· Indirect (between‐study) comparisons
· Indirect (surrogate) outcomes
· Applicability (study populations, interventions, or comparisons that are different from those of interest).
[3] Other considerations for downgrading include publication bias. Other considerations for upgrading include a strong association with no plausible confounders, a dose response relationship, and if all plausible confounders or biases would decrease the size of the effect (if there is evidence of an effect), or increase it if there is evidence of no harmful effect (safety).
[4]
4 High = This research provides a very good indication of the likely effect. The likelihood that the effect will be substantially different** is low.
3 Moderate = This research provides a good indication of the likely effect. The likelihood that the effect will be substantially different** is moderate.
2 Low = This research provides some indication of the likely effect. However, the likelihood that it will be substantially different** is high.
1 Very low = This research does not provide a reliable indication of the likely effect. The likelihood that the effect will be substantially different** is very high.
** Substantially different = a large enough difference that it might affect a decision.
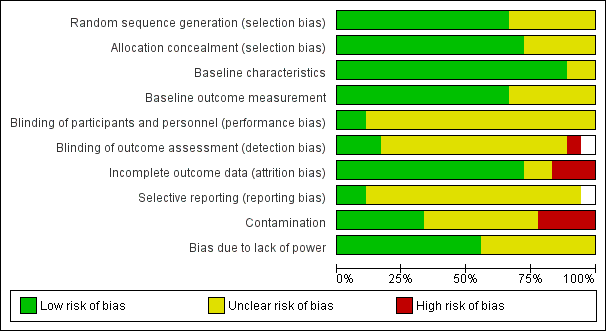
Risk of bias graph: review authors' judgements about each risk of bias item presented as percentages across all included studies.

Risk of bias summary: review authors' judgements about each risk of bias item for each included study.
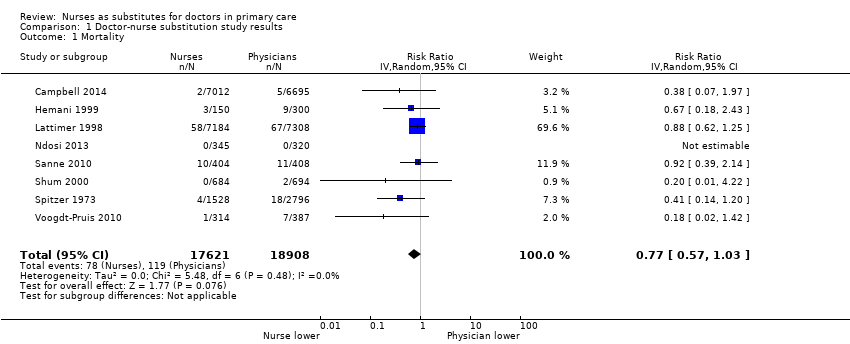
Comparison 1 Doctor‐nurse substitution study results, Outcome 1 Mortality.
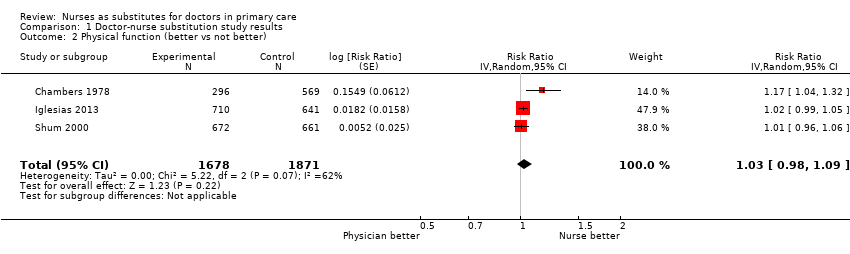
Comparison 1 Doctor‐nurse substitution study results, Outcome 2 Physical function (better vs not better).

Comparison 1 Doctor‐nurse substitution study results, Outcome 3 Pain.

Comparison 1 Doctor‐nurse substitution study results, Outcome 4 Quality of life.
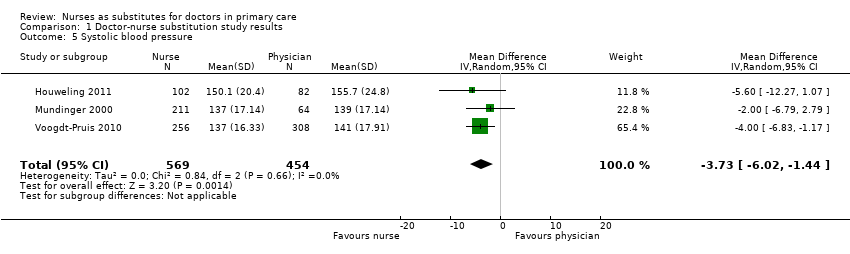
Comparison 1 Doctor‐nurse substitution study results, Outcome 5 Systolic blood pressure.

Comparison 1 Doctor‐nurse substitution study results, Outcome 6 Diastolic blood pressure.
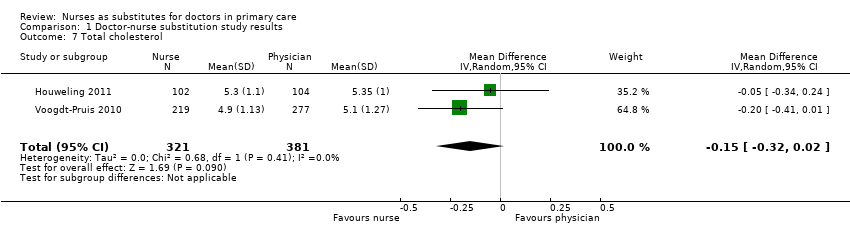
Comparison 1 Doctor‐nurse substitution study results, Outcome 7 Total cholesterol.
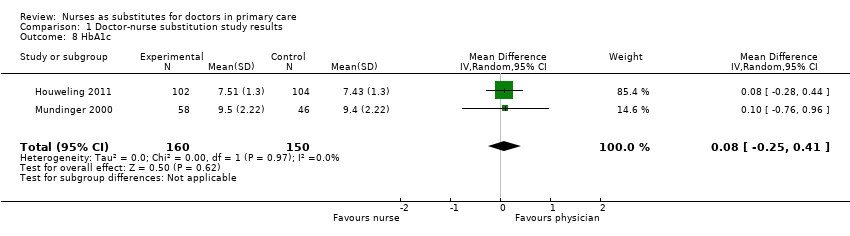
Comparison 1 Doctor‐nurse substitution study results, Outcome 8 HbA1c.

Comparison 1 Doctor‐nurse substitution study results, Outcome 9 Disease Activity Score.

Comparison 1 Doctor‐nurse substitution study results, Outcome 10 Patient satisfaction.

Comparison 1 Doctor‐nurse substitution study results, Outcome 11 Length of consultation.
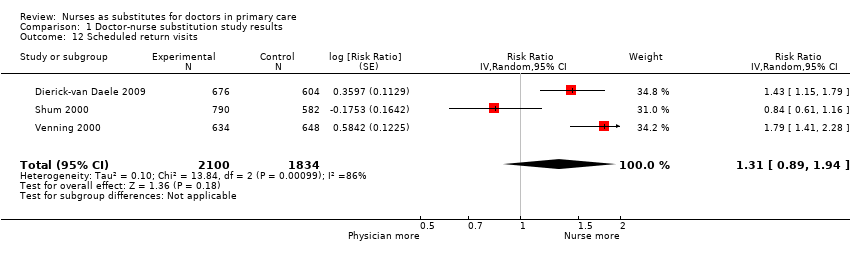
Comparison 1 Doctor‐nurse substitution study results, Outcome 12 Scheduled return visits.

Comparison 1 Doctor‐nurse substitution study results, Outcome 13 Attended return visit.
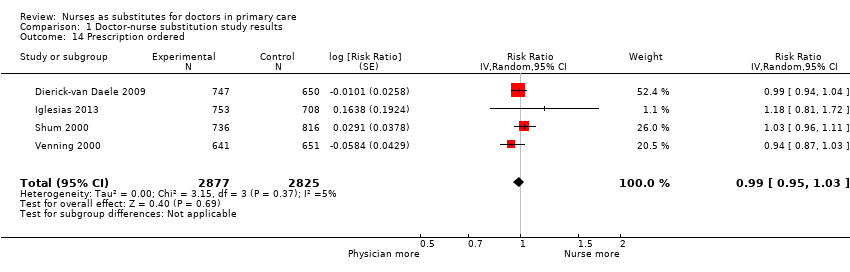
Comparison 1 Doctor‐nurse substitution study results, Outcome 14 Prescription ordered.

Comparison 1 Doctor‐nurse substitution study results, Outcome 15 Investigations.
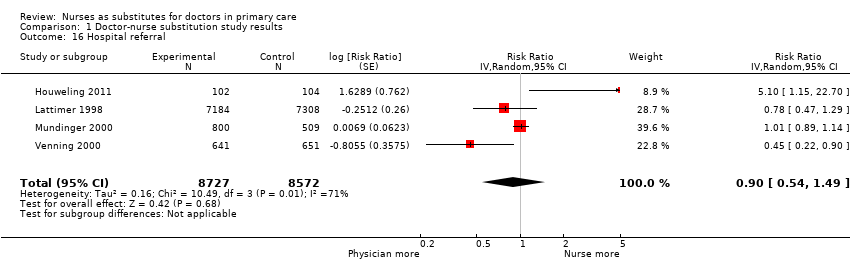
Comparison 1 Doctor‐nurse substitution study results, Outcome 16 Hospital referral.

Comparison 1 Doctor‐nurse substitution study results, Outcome 17 Attendance at accident and emergency.

Comparison 1 Doctor‐nurse substitution study results, Outcome 18 Hospital admission.
| Nurse‐led primary care compared with doctor‐led primary care for patient outcomes, process of care and utilisation | ||||||
| Patient or population: all presenting patients in primary care Settings: UK (n = 6), Netherlands (n = 3), USA (n = 3), Canada (n = 3), Sweden (n = 1), Spain (n = 1), South Africa (n = 1) Intervention: substitution of doctors with nurses for primary care Comparison: routine doctor‐led primary care | ||||||
| Outcomes | Impact | Number of participants | Certainty of the evidence | |||
| Illustrative comparative risks* (95% CI) | Effect estimate | Results in words | ||||
| Assumed risk | Corresponding risk | |||||
| Doctor‐led primary care | Nurse‐led primary care | |||||
| Mortality follow‐up: 0.5 to 48 months Mean = 21 (SD 19) months | 6.29 per 1000 | 4.84 per 1000 (4 to 6) | RR 0.77 (0.57 to 1.03) | Nurse‐led primary care may lead to slightly fewer deaths among certain groups of patients, compared to doctor‐led care. However, the results vary and it is possible that nurse‐led primary care makes little or no difference to the number of deaths. | 36,529 (8)1 | ⊕⊕⊝⊝ a |
| Patient health status follow‐up: 0.2 to 47 months Mean = 14 (SD 12) months | Compared to doctor‐led care, nurse‐led primary care probably slightly improves blood pressure control; probably leads to similar outcomes for diabetes indicators and measures of disease activity and pain in people with rheumatological disorders; may lead to similar outcomes for physical functioning; and leads to similar outcomes for cholesterol | Clinical outcomes (3) Self‐reported measurements (13)2 | ⊕⊕⊕⊝ b | |||
| Satisfaction and preferences follow‐up: 0.5 to 25 months Mean = 12 (SD 10) months | Patient satisfaction is probably slightly higher in nurse‐led primary care compared to doctor‐led primary care. | 16,993 | ⊕⊕⊕⊝ c | |||
| Quality of life follow‐up: 6 to 25 months Mean = 15 (SD 9) months | Quality of life may be slightly higher in nurse‐led primary care compared to doctor‐led primary care. | 16,002 | ⊕⊕⊝⊝d | |||
| Process of care follow‐up: 0.5 to 48 months Mean = 17 (SD 15) months | We are uncertain of the effects of nurse‐led care on process of care because the certainty of this evidence was assessed as very low. | (10)5 | ⊕⊝⊝⊝e Very low | |||
| Utilisation (consultations, prescriptions, tests, investigations, and services) follow‐up: 0.2 to 48 months Mean = 14 (SD 13) months | Consultations: Compared to doctor‐led primary care, consultation length is probably longer in nurse‐led primary care; there may be little or no difference in scheduled return visits; and the number of return visits attended is slightly higher for nurses. Prescriptions, tests and investigations: There is little or no difference between nurses and doctors in the number of prescriptions and may be little or no difference in the number of tests and investigations ordered. Use of other services: There may be little or no difference between nurses and doctors in the likelihood of hospital referrals and hospital admissions; little or no difference in attendance at accident and emergency units. | (16)6 | ⊕⊕⊕⊝ f | |||
| Costs follow‐up: 0.2 to 48 months Mean = 14 (SD 14) months | We are uncertain of the effects of nurse‐led care on the cost of care because the certainty of this evidence was assessed as very low. | (9)7 | ⊕⊝⊝⊝ g | |||
| *The basis for the assumed risk is the mean control group risk across studies for pooled results. The corresponding risk is based on the assumed risk in the comparison group and the relative effect of the intervention (and its 95% CI). aDowngraded by 1 for imprecision owing to a wide confidence interval that includes no effect and downgraded by 1 for clinical heterogeneity as the trials contributing to this estimate are quite varied (some focus on people with specific health issues and others on more generalist primary care attenders). bDowngraded by 1. Outcomes were downgraded by 1 for inconsistency, imprecision, indirectness or high risk of bias. The certainty of the evidence is moderate for all outcomes listed, apart for physical functioning for which the certainty of evidence was low and cholesterol for which the certainty of evidence was high. cDowngraded by 1 for inconsistency. dDowngraded by 1 for imprecision, due to a wide confidence interval that touches on the null, and 1 for inconsistency eNon‐comparable results and therefore downgraded to very low. fDowngraded by 1. Outcomes were downgraded by 1 for inconsistency, imprecision or high risk of bias. gNon‐comparable results (the types of costs assessed varied widely and a range of different approaches were used to value resources and calculate costs) and therefore downgraded to very low. 1Campbell 2014; Hemani 1999; Lattimer 1998; Ndosi 2013; Sanne 2010; Shum 2000; Spitzer 1973; Voogdt‐Pruis 2010. 2Campbell 2014; Chambers 1978; Chan 2009; Dierick‐van Daele 2009; Houweling 2011; Iglesias 2013; Larsson 2014; Lattimer 1998; Lewis 1967; Moher 2001; Mundinger 2000; Sanne 2010; Shum 2000; Spitzer 1973; Venning 2000; Voogdt‐Pruis 2010. 3Campbell 2014; Dierick‐van Daele 2009; Iglesias 2013; Larsson 2014; Mundinger 2000; Shum 2000; Venning 2000. 4Campbell 2014; Chan 2009; Dierick‐van Daele 2009; Houweling 2011; Mundinger 2000; Ndosi 2013. 5Campbell 2014; Dierick‐van Daele 2009; Houweling 2011; Moher 2001; Mundinger 2000; Ndosi 2013; Shum 2000; Spitzer 1973; Venning 2000; Voogdt‐Pruis 2010. 6Campbell 2014; Chan 2009; Dierick‐van Daele 2009; Hemani 1999; Houweling 2011; Iglesias 2013; Larsson 2014; Lattimer 1998; Lewis 1967; Moher 2001; Mundinger 2000; Ndosi 2013; Shum 2000; Spitzer 1973; Venning 2000; Voogdt‐Pruis 2010. 7Campbell 2014; Chambers 1978; Chan 2009; Dierick‐van Daele 2009; Lattimer 1998; Lewis 1967; Ndosi 2013; Spitzer 1973; Venning 2000. *there may be additional data in the Campbell 2014 articles that have not been extracted | ||||||
| GRADE Working Group grades of evidence. †Substantially different = a large enough difference that it might affect a decision. | ||||||
| Study | Various health status outcomes |
| Health status: ‐ Emotional function: no differencea ‐ Social function: no differencea | |
| Health status: ‐ Severity of symptoms: Nurse group had greatest improvement. Difference adjusted for baseline 2.3 (95% CI 1.4 to 3.1), P < 0.001 | |
| Health status: ‐ Burden of illness: nurse vs doctor (MD 0.27, P = 0.16) ‐ Concerns about illness: nurse vs doctor (MD 0.11, P = 0.20) ‐ Absence of work: both nurse and doctor 1.11 daysa,b ‐ Ability to perform daily activities: nurse mean 2.53, doctor mean 2.69a,b | |
| Objective measures of patient health (MD (95% CI)): ‐ BMI (kg/m2): nurse ‐0.2 (‐0.5; 0.1), doctor ‐0.3 (‐0.6; ‐0.1), P = 0.377 ‐ Cholesterol/HDL: nurse ‐0.03 (‐0.1; 0.2), doctor ‐0.07 (‐0.1; ‐0.2), P = 0.321 Health status: ‐ Diabetes symptom score: no differencea,b ‐ Fatigue: no differencea,b ‐ Cognitive distress: no differencea,b | |
| Health status: ‐ DAS28‐CRP: nurse vs doctor 0.05 (95% CI ‐0.28 to 0.19, P = 0.70) ‐ ESR (mm/h): nurse vs doctor ‐1.05 (95% CI ‐3.97 to 1.86, P = 0.47) ‐ CRP (mg/L): nurse vs doctor ‐1.07 (95% CI ‐2.02 to ‐0.12, P = 0.03) ‐ Swollen joints (28): nurse vs doctor 0.13 (95% CI ‐2.18 to 0.61, P = 0.60) ‐ Tender joints (28): nurse vs doctor 0.33 (95% CI ‐0.47 to 1.13, P = 0.42) ‐ VAS global health (mm): nurse vs doctor 4.29 (95% CI ‐2.58 to 11.16, P = 0.22) | |
| Health status: ‐ Resolution of symptoms in nurse group from 16.33 to 18.39 (possible range 6 to 24; higher scores mean fewer reductions in complaints). Doctors no change. P < 0.02 | |
| Health status (lifestyle factor): ‐ Smoking: no differencea ‐ Blood pressure (mmHg) systolic: nurse 148 (142 to 153), GP 147 (135 to 153), P = 0.82a ‐ Blood pressure (mmHg) diastolic: nurse 80 (74 to 87), GP 81 (75 to 83), P = 0.82a ‐ Cholesterol (mmol/L) total: nurse 5.4 (5.2 to 5.5), GP 5.5 (5.0 to 5.9), P = 0.61a ‐ Cholesterol (mmol/L) high‐density lipoprotein: nurse 1.2 (1.1 to 1.3), GP 1.2 (1.2 to 1.3), P = 0.83a | |
| Health status (10 dimensions): no differenceb Objective measures of patient health: ‐ Asthma ‐ peak flow: NP 292.82 (94.2), GP 319.90 (136.56), P = 0.365 | |
| Health status: ‐ Fatigue ITT: nurse < doctor; mean (95% CI) 3.38 (‐2.01 to 8.76), P = 0.0171 ‐ Stiffness ITT: nurse < doctor; mean (95% CI) 8.91 (‐2.66 to 20.5), P = 0.0113 ‐ RAQoL ITT: nurse < doctor; mean (95% CI) ‐0.14 (‐1.77 to 1.49), P = 0.0001 ‐ HAQ ITT: nurse > doctor; mean (95% CI) ‐0.07 (‐0.21 to 0.07), P < 0.0001 ‐ HAD‐Anxiety ITT: nurse < doctor; mean (95% CI) 0.54 (‐0.36 to 1.43), P = 0.0179 ‐ HAD‐Depression ITT: nurse < doctor; mean (95% CI) 0.12 (‐0.65 to 0.89), P = 0.0004 ‐ ASES ITT: nurse > doctor; mean (95% CI) ‐0.92 (‐4.96 to 3.12), P = 0.0019 | |
| Health status: ‐ Cumulative failure: nurse 48%, doctor 44% HR (95% CI) 1.09 (0.89 to 1.33) ‐ All virological failure: nurse 11%, doctor 10% HR (95% CI) 1.15 (0.75 to 1.76) ‐ Toxicity failure: nurse 17%, doctor 16% HR (95% CI) 1.04 (0.74 to 1.45) ‐ Death: nurse 3%, doctor 3% HR (95% CI) 0.92 (0.39 to 2.17) | |
| Health status: ‐ Physical function (3 indicators): nurses 86%, doctors 88%b ‐ Emotional function: nurses 58%, doctors 58%b ‐ Social function: nurses 84%, doctors 83%b | |
| Health status: no differencea | |
| Objective measures of patient health: ‐ LDL cholesterol: nurse 2.9, doctors 3.0, P = 0.07 ‐ BMI: nurse 27.2, doctor 27.2, P = 0.87 Health status (lifestyle factor): ‐ Smoking: 4% of smokers in the GP group (4/102) Subgroup: at‐risk patients ‐ Systolic blood pressure: nurse 144.0, doctor 147.6, P = 0.1 ‐ Total cholesterol: nurse 5.2, doctor 5.6, P = 0.006 ‐ LDL cholesterol: nurse 3.1, doctor 3.3, P = 0.16 ‐ BMI: nurse 28.6, doctor 28.6, P = 0.78 | |
| a Authors reported no effect size or reported effect sizes in graphs (no exact effect sizes extracted). b No p‐value reported. ASES: Standardized Shoulder Assessment Form. BMI: body mass index. CI: confidence interval. CRP: C‐reactive protein. DAS28: disease activity score 28. ESR: erythrocyte sedimentation rate. GP: general practitioner. HAD: Hospital and Anxiety Depression Scale. HAQ: Health Assessment Questionnaire. HDL: high‐density lipoprotein. HR: heart rate. ITT: intention‐to‐treat. LDL: low‐density lipoprotein. MD: mean difference. NP: nurse practitioner. RAQoL: Rheumatoid Arthritis Quality of Life Questionnaire. VAS: visual analogue scale. *there may be additional data in the Campbell 2014 articles that have not been extracted | |
| Study | Satisfaction, preference |
| Overall satisfaction: nurse triage vs GP triage MD 2.60 (95% CI 0.58 to 4.63)a | |
| Overall satisfaction: nurse vs doctor (0 to 10), MD ‐0.015, P = 0.83 Communication/attitude (1 to 6) ‐ Understanding: nurse vs doctor, MD ‐0.015, P = 0.41 ‐ Telling the plan: nurse vs doctor, MD ‐0.02, P = 0.74 ‐ Explaination goals and treatment: nurse vs doctor, MD ‐0.01, P = 0.76 ‐ Importance advice: nurse vs doctor, MD ‐0.07, P = 0.17 ‐ Appropriate attention: nurse vs doctor, MD 0.01, P = 0.78 Provision of information (1 to 6) ‐ Cause of problems: nurse vs doctor, MD ‐0.08, P = 0.21 ‐ Relief of symptoms: nurse vs doctor, MD ‐0.04, P = 0.47 ‐ Duration of illness: nurse vs doctor, MD ‐0.09, P = 0.25 ‐ Change of recurrence: nurse vs doctor, MD ‐0.15, P = 0.08 ‐ What to do: nurse vs doctor, MD ‐0.06, P = 0.45 Subgroup at least 1 chronic condition Satisfaction: NP 8.35 (1.07) vs GP 8.11 (1.32), P = 0.02 Judgement seeing the right professional: P = 0.35b Attending same provider in future: P = 0.67 Recommendation to others: P = 0.41 | |
| Satisfaction: ‐ Satisfaction with duration of the visit (0 to 10): doctor 8.1, nurse 8.4; MD (95% CI%) 0.256 (0.016 to 0.496)a ‐ Satisfaction with personal attention (0 to 10): doctor 8.1, nurse 8.4, MD (95% CI%) 0.240 (0.003 to 0.476)a ‐ Satisfaction with explanations and information received in the visit (0 to 10): doctor 8.3, nurse 8.5, MD (95% CI%) 0.240 (0.015 to 0.495)a Provider preference: More than 40% of patients in each group expressed indifference. In the control group, 13.9% of patients would prefer to be seen by a nurse, as opposed to 20.9% in the intervention group.a | |
| Confidence: ‐ NRS confidence: nurse vs doctor: 0.20 (95% CI ‐0.29 to 0.69), P = 0.42 | |
| Provider preference: doctor 5.72 vs nurse 9.80, P < 0.001. Possible range 0 to 20; higher scores indicate a more positive view of the provider. | |
| Satisfaction (9 items): no difference in overall satisfaction, or on any of the 9 subscalesa Would recommend provider to others: no differencea | |
| Leeds Satisfaction Questionnaire ‐ LSQ Week 26 ‐ LSQ‐General: nurse vs doctor effect size: 0.17, P = 0.036 ‐ LSQ‐Information: nurse vs doctor effect size: 0.08, P = 0.327 ‐ LSQ‐Empathy: nurse vs doctor effect size: 0.05, P = 0.557 ‐ LSQ‐Technical: nurse vs doctor effect size: 0.08, P = 0.293 ‐ LSQ‐Attitude: nurse vs doctor effect size: 0.14, P = 0.082 ‐ LSQ‐Access: nurse vs doctor effect size: 0.01, P = 0.936 Week 52 ‐ LSQ‐General: nurse vs doctor effect size: 0.12, P = 0.183 ‐ LSQ‐Information: nurse vs doctor effect size: 0.09, P = 0.301 ‐ LSQ‐Empathy: nurse vs doctor effect size: 0.05, P = 0.578 ‐ LSQ‐Technical: nurse vs doctor effect size: 0.08, P = 0.369 ‐ LSQ‐Attitude: nurse vs doctor effect size: 0.08, P = 0.375 ‐ LSQ‐Access: nurse vs doctor effect size: 0.10, P = 0.248 | |
| Satisfaction: ‐ Professional care: nurse 79.2 (13.4) vs GP 76.7 (15.1), possible range 0 to 100, P = 0.002 ‐ Relationship to provider: nurse 64.3 (15.7) vs GP 64.2 (16.9), possible range 0 to 100, P = 0.945 ‐ Adequacy of time: nurse 73.3 (16.9) vs GP 67.7 (19.3), possible range 0 to 100, P < 0.001 ‐ Explanation helpful: nurse 88.8% vs GP 87.3%, P = 0.359 ‐ Advice helpful: nurse 86.9% vs GP 83.9%, P = 0.060 Provider preference: GP group: 47.5% prefer GP, 2.0% nurse, 50.5% no preference. Nurse group: 31.5% prefer GP, 7.5% nurse, 61% no preference; P < 0.001 | |
| Satisfaction: nurses 96%, doctors 97%a | |
| Satisfaction: Adults ‐ Communication: NP 4.35 (0.54) vs GP 4.21 (0.60), P = 0.001 ‐ Distress relief: NP 4.43 (0.47) vs GP 4.26 (0.57), P = 0.001 ‐ Professional care: NP 4.44 (0.49) vs GP 4.22 (0.57), P < 0.001 Children ‐ General: NP 4.39 (0.46) vs GP 4.17 (0.57), P < 0.001 ‐ Communication with parent: no difference ‐ Communication with child: NP 4.16 (0.63) vs GP 3.67 (0.77), P < 0.001 ‐ Distress relief: NP 4.41 (0.53) vs GP 4.21 (0.64), P = 0.002 ‐ Adherence intent: no difference | |
| ano p‐value reported b authors reported no effect size or reported effect sizes in graphs (no exact effect sizes extracted) CI: confidence interval. GP: general practitioner. LSQ: Leeds Satisfaction Questionnaire. MD: mean difference. NP: nurse practitioner. NRS: Numeric Rating Scale *there may be additional data in the Campbell 2014 articles that have not been extracted | |
| Study | Compliance | Other |
| Rating information (5 items): no differencea,b | ||
| Enablement: nurse vs GP, MD = 0.65 (CI ‐1.50 to 0.19), P = 0.13 | ||
| Patient adherence to medical treatment after 1 year of follow‐up nurse vs doctor (95% CI) Medication blood pressure: 92.2 vs 84.9 (1.06 to 3.73; P = 0.03) Forgetting to take medication: group difference 1.32 (0.88 to 1.97; P = 0.18) ‐ Never: 52.6 vs 61.0 ‐ Sometimes: 46.8 vs 39.0 Patient lifestyle after 1 year of follow‐up nurse vs doctor (95% CI) ‐ Exercise: 28.6 vs 27.3 (0.73 to 1.67; P = 0.79) ‐ Alcohol 5 days per week at most: 78.6 vs 75.5 (0.79 to 2.01; P = 0.33) ‐ Alcohol 2 for woman, 3 for man at most: 79.1 vs 80.6 (0.53 to 1.56; P = 0.73) ‐ Fat intake: 6.5 vs 7.2 (0.02 to 1.28; P = 0.04) | ||
| aTrial authors reported only the direction of the outcome; it is unknown if the difference is statistically significant. bTrial authors reported no effect size or reported effect sizes on graphs (no exact effect sizes extracted). CI: confidence interval. GP: general practitioner. MD: mean difference. | ||
| Study | Provider care |
| Difficulty with (nurse triage vs GP triage, MD (95% CI): Phone access: 6.49 (–1.26 to 14.25)a Receiving prompt care: 6.63 (3.23 to 10.03)a Seeing a doctor or nurse: 3.67 (–0.37 to 7.71)a Getting medical help: 5.09 (2.69 to 7.50)a Convenience of care 3.68 (1.13 to 6.24)a Problem resolution: nurse triage vs GP triage: 0.41 (–1.86 to 2.67)a Process indicators: ‐ Number of contacts per person: nurse vs GP triage: 1·04 (1·01 to 1·08)a ‐ 23% in the GP‐triage group and 12% in the nurse‐triage group had just 1 contact after their initial consultation requestb | |
| Adherence to guidelines: nurse 79.8%, doctor 76.2%a,c | |
| Process indicators: ‐ Patients with last retina control > 24 months ago (n = 64) referred to an ophthalmologist: nurse 24/34 (70.6) vs GP 11/30 (36.7), P = 0.007 ‐ Patients with feet at‐risk (n = 109) for whom measures were taken: nurse 34/60 (56.7) vs GP 13/49 (26.5), P = 0.001 ‐ Patients referred to an internist to start insulin therapy: nurse 10/102 (9.8) vs GP 2/104 (1.9), P = 0.015 ‐ Patients with HbA1c ≥ 7 at baseline (n = 120), for whom glucose‐lowering therapy was intensified: nurse 53/64 (82.8) vs GP 28/56 (50.0), P = 0.001 ‐ Patients with BP > 140/90 at baseline (n = 170) for whom blood pressure‐lowering therapy was intensified: nurse 42/85 (49.4) vs GP 24/85 (28.2), P = 0.005 ‐ Patients not meeting target values for lipid profile at baseline (n = 55), for whom lipid‐lowering therapy was intensified: nurse 13/29 (44.8) vs GP 13/26 (50.0), P = 0.147 | |
| Adequate assessment: ‐ Clinical assessment: nurse vs GP: 9% (95% CI ‐3 to 22), P = 0.13 ‐ Blood pressure: no differencec ‐ Cholesterol: no differencec ‐ Smoking status: no differencec | |
| Documentation of provider behaviour diabetes care: ‐ Education (8 items): overall ‘any education’: nurse 84,9% vs medical doctor 42.4% (P < 0.001). With regard to specific items, nurse more education: 4 out of 7 topics: nutrition, weight, exercise, and medication (P < 0.01) ‐ History taken (5 items): no difference ‐ Monitoring (9 items): nurse ordered/carried out more laboratory tests, such as urinalysis (nurse 80.2%, medical doctor 55.9%, P < 0.01) and glycosylated haemoglobin (A1C value) (nurse 81.4, medical doctor 66.1, P < 0.05); nurse reported more frequently height of patients (nurse 91.9%, medical doctor 71.2%, P < 0.01). On other 6 items, no difference ‐ Referral (1 item): no differences | |
| Interventions: ‐ Giving patient education: nurse > doctor; RR (95% CI) 1.76 (1.15 to 2.69), P = 0.009 ‐ Giving psychosocial support: nurse > doctor; RR (95% CI) 3.29 (2.55 to 4.24), P < 0.0001 | |
| Provision of information: ‐ Self‐medication: nurse 22.2% vs GP 13.7%, P < 0.001 ‐ Self‐management: nurse 81.7% vs GP 57.6%, P < 0.001 | |
| Adequate treatment: ‐ Drug treatment: nurses 71%, doctors 75%a ‐ Management of episodes: nurses 69%, doctors 66%a | |
| Lifestyle and medical intervention nurse vs doctor: ‐ Smoking behaviour 8.2% vs 3.2%a ‐ Blood pressure 35.4% vs 26.6% (1.01 to 2.24; P = 0.04) ‐ Lipids 47.1 vs 22.3 (1.98 to 4.43; P < 0.01) ‐ Weight 36.9 vs 7.6 (4.26 to 12.52; P < 0.01) ‐ Exercise 19.4 vs 3.2a ‐ Food intake 14.6 vs 3.2a ‐ Medication 22.3 vs 14.7 (0.99 to 2.59; P = 0.05) ‐ None 22.8 vs 43.2 (1.69 to 3.86; P < 0.01) Asked about the use of medication: nurse vs doctor Group difference 2.12 (1.38 to 3.26; P < 0.01) ‐ Never 57.4 vs 75.4 ‐ Sometimes 20.0 vs 14.4 ‐ Often 22.1 vs 9.7 | |
| Examinations: nurse vs GP: MD 0.19 (95% CI ‐0.03 to 0.71), P = 0.072 | |
| aNo P value reported. bTrial authors reported only the direction of the outcome; it remains unknown whether the difference is statistically significant. cTrial authors reported no effect size or reported effect sizes in graphs (no exact effect sizes extracted). CI: confidence interval. GP: general practitioner. MD: mean difference. RR: risk ratio. *there may be additional data in the Campbell 2014 articles that have not been extracted | |
| Study | Number, length, and frequency of consultations | Numbers of prescriptions, tests, and investigations | Use of other services |
| Referrals: nurse 12%, doctor 14.2%, P = 0.24a | |||
| Compared to qualified doctors Consultation rate: Nurses 3.52 vs qualified doctors 4.03 (P > 0.05) Compared to residents (trainee doctors) Consultation rate: Nurses 3.52 vs residents 2.95 (P < 0.05) | Mean utilisation rate: Compared to qualified doctors Tests & investigations: Lab tests: NP 32.67, doctor 29.46, P > 0.05 Radiological tests (total): NP 1.68. doctor 1.37, P > 0.05 ‐ CT/MRI: NP 0.32, doctor 0.13, P < 0.05 ‐ Ultrasound: NP 0.16, doctor 0.07, P < 0.05 Compared to residents (trainee doctors) Tests & investigations: Lab tests: NP 32.67, doctor 28.26, P > 0.05 ‐ Urinalysis: NP 1.31, doctor 0.99, P < 0.05 ‐ Thyroid function: NP 0.37, doctor 0.19, P < 0.05 Radiological tests: NP 1.68, doctor 1.48, P > 0.05 | Mean utilisation rate: Compared to qualified doctors Hospital admission: NP 0.43, doctor 0.33, P > 0.05 Emergency room visits: NP 1.22, doctor 1.23, P > 0.05 Specialty visits: NP 5.35, doctor 4.26, P > 0.05 Compared to residents (trainee doctors) Hospital admission: NP 0.43, doctor 0.31, P > 0.05 Emergency department visits: NP 1.22, doctor 1.05, P > 0.05 Specialty visits: NP 5.35, doctor 4.21, P > 0.05 | |
| Mean number of visits: nurse 6.1, GP 2.8 (P < 0.0001) Total duration of visits: significantly higher in nurse groupa Consultation of nurses' patients with GP: Median number of these consultations per patient was 1.4 (25 to 75 quartiles: 0.0 to 2.0) with median time of 1.0 (25 to 75 quartiles: 0.0 to 3.3) minute | |||
| Level of resolution by nurses: Nurses led 86.3% (95% CI 83.6 to 88.7) of consultations without referral to GP (referrals according to protocol indication not included) | |||
| Proportion nurse‐led vs doctor‐led: ‐ Cortisone injections in addition to regular rheumatologist monitoring visits (1:0.7; P = 0.463) ‐ Blood tests (1:3.9; P = 0.014) ‐ Radiography (1:1.6; P = 0.162) ‐ Pharmacological therapy (1:1.1; P = 0.029) | Proportion nurse‐led vs doctor‐led: ‐ Additional telephone calls to a rheumatology nurse (1:1.8; P = 0.060) ‐ Additional telephone calls to a rheumatologist (1:1.9; P =0.287) ‐ Additional rheumatologist visits (1:2.4; P = 0.077) ‐ Team rehabilitation in in‐patient settings (0:79; P = 0.086) ‐ Team rehabilitation in out‐patient settings (15:0; P = 0.135) ‐ Occupational therapist treatments (0:3.0; P = 0.162) ‐ Psychosocial treatments (0:1.0; P = 0.152) ‐ Specialist consultations (1:1.0; P = 0.949) | ||
| Impact on GP workload: ‐ Telephone advice from GP: fewer with nurse‐led care, 35% reductionb ‐ Surgery visits: 10% fewer with nurse‐led careb ‐ Home visits: 6% fewer home visits during intervention periodb | Hospital admission within 24 hours: nurse 2%, GP 6.5%, RR 0.31 (95% CI 0.07 to 1.42) Hospital admission within 3 days: nurse 5%, GP 6.5%, RR 0.77 (95% CI 0.26 to 2.28) Emergency department visit: nurse 3%, GP 2%, RR 1.84 (95% CI 0.31 to 10.82) | ||
| Consultation length: doctor 15 minutes, nurse 30 minutesc Consultation rate: doctor 150 visits, nurse 345 visitsc | Days in hospital: doctor 68 days, nurse 45 daysc | ||
| Prescriptions: ‐ Antihypertensives: no difference, P = 0.35a ‐ Lipid lowering: no difference, P = 0.63a ‐ Antiplatelet: nurse 8% (95% CI 1% to 9%) more than GP (P = 0.031) | |||
| Consultation rate: Doctor patients had higher primary care utilisation than nurse | Speciality visits: no differenced, P = 0.61 | ||
| Consultation length: Mean total consultation time: nurse 111 min, doctor 71 mina,b Consultation rate: Patients attending all 5 sessions: nurse 92%, doctor 85%a,b | ‐ Change in medicines: nurse < doctor; RR (95% CI) 0.58 (0.43 to 0.79), P = 0.0006 ‐ Dosage changes: nurse < doctor; RR (95% CI) 0.52 (0.34 to 0.79), P = 0.0020 ‐ Intra‐articular injections: nurse < doctor; RR (95% CI) 0.82 (0.50 to 1.35), P = 0.4400 ‐ Intramusclar injections: nurse < doctor; RR (95% CI) 0.73 (0.45 to 1.19), P = 0.2100 ‐ Non‐protocol bloods: nurse < doctor; RR (95% CI) 1.02 (0.74 to 1.40), P = 0.9100 | ‐ Referral to physiotherapy: nurse < doctor; RR (95% CI) 1.21 (0.62 to 2.39), P = 0.5800 ‐ Referral to occupational therapy: nurse < doctor; RR (95% CI) 1.74 (0.76 to 3.96), P = 0.1900 ‐ Referral to podiatry: nurse < doctor; RR (95% CI) 0.89 (0.37 to 2.14), P = 0.8000 ‐ Conferrals: nurse < doctor; RR (95% CI) 2.92 (1.77 to 4.83), P < 0.0001 ‐ Referral to other consultants: nurse < doctor; RR (95% CI) 0.58 (0.11 to 3.11), P = 0.5200 | |
| Out‐of‐hours calls: nurse 0.9% vs GP 1.8%, P = 0.218 | |||
| Physical examinations: nurse vs GP; MD 0.19 (95% CI ‐0.03 to 0.71), P = 0.072 | |||
| Referred to professional nurse vs doctor: ‐ Dietician 17.0 vs 8.9b ‐ Physiotherapist 3.1 vs 1.9b ‐ Cardiovascular specialist 1.9 vs 6.3b ‐ Visited a cardiovascular specialist 46.3 vs 45.3 (0.84 to 1.79; P = 0.30) ‐ Admission into hospital because of CVD 10.4 vs 13.4 (0.43 to 1.38; P = 0.38) | |||
| aTrial authors reported no effect size or reported effect sizes in graphs (no exact effect sizes extracted). bNo P value reported. cTrial authors reported only the direction of the outcome; it remains unknown whether the difference is statistically significant. dToo many numbers to report. CI: confidence interval. CT: computed tomography. CVD: cardiovascular disease. GP: general practitioner. MRI: magnetic resonance imaging. NP: nurse practitioner. RR: risk ratio. *there may be additional data in the Campbell 2014 articles that have not been extracted | |||
| Study | Costs based on | Cost outcomes |
|
| Total costs: Mean 28‐day cost estimates for primary outcome contacts: Nurses ‐ £75·68 (63·09) GPs ‐ £75·21 (65·45) | |
|
| Costs of medication use: Nurses – mean £35.5 (SD £48.8) Doctors – mean £71.7 (SD £ 63.1) Mean difference (adjusted baseline level): £39.6 (95% CI 24.2 to 55.1); P < 0.001 | |
|
| Total direct healthcare costs: Nurses: €31.94 Doctors: €40.15 Mean difference (95% CI): €8.21 (3.56 to 12.85); P = 0.001 Total direct healthcare costs and productivity: Nurses: €140.40 Doctors: €145.87 Mean difference (95% CI): €1.48 (‐4.94 to 7.90); P = 0.65 Subgroup younger than 65 years: Total direct healthcare costs and productivity: Nurses: €161.57 Doctors: €170.75 Mean difference (95% CI): €9.18 (4.84 to 13.88); P < 0.001 | |
|
| Total annual rheumatology care per patient: Nurse‐led: €14107,70 Doctor‐led: €16274,90 Mean difference (95% CI): −2167.2 (−3757.3 to −641.7) P = 0.004 | |
|
| Annual direct cost:Nurse‐led service: ‐ £81,237 more than doctor‐led service Savings: Generated in reduced hospital and primary care utilisation £94,422 Net reduction in costs:with nurse‐led service £3,728 to £123,824 (determined by sensitivity analysis) | |
|
| Total direct cost per year: Nurses ‐ $3,251 Doctors ‐ $4,199 Average cost per patient per year: Nurses ‐ $98.51 Doctors ‐ $127.24 | |
|
| NHS resources plus out‐of‐pocket expenditures: Nurses ‐ mean £1276 Doctors ‐ mean £2286 (95% CI ‐352 to 1773) P = 0.1872 | |
|
| Average cost per patient per year: Nurses ‐ $297.01 Doctors – $285.67 | |
|
| Total direct cost per consultation: Nurses – mean £18.11 (SD £33.43; range £0.66 to £297.1) Doctors – mean £20.70 (SD £33.43; range £0.78 to £300.6) Mean difference (adjusted age, sex): £2.33 (95% CI 1.62 to 6.28); P = 0.247 | |
| aSpitzer reported an overall reduction in practice costs following the introduction of nurse practitioners, but this finding was based on observational before‐and‐after data. Data obtained from the related randomised controlled trial (reported above) did not support this finding. A&E: accident and emergency. CI: confidence interval. DEXA: dual energy x‐ray absorptiometry. GP: general practitioner. *there may be additional data in the Campbell 2014 articles that have not been extracted | ||
| Focus of other reviews | Differences from our review | ||||
| Does not include meta‐analyses | Includes nurses working as supplements according to our definition | Includes non‐randomised studies | Focusses on particular countries | Has a particular focus on cost outcomes | |
| This literature review assesses the impact of advanced primary care nursing roles, particularly first contact nursing roles, for patients, nurses themselves, and their colleagues. | x | x | x | ||
| This study used the literature search Horrocks 2002 and aims to estimate resource use for a typical same‐day primary care consultation and the cost difference of employing an extra salaried GP or nurse practitioner. | x | UK | x | ||
| This systematic review compares effects of nurse practitioners and doctors providing care at first point on patient satisfaction, health status, process measures, and quality of care. | x | x | Developed countries | ||
| Martínez‐González 2014a; Martínez‐González 2014b; Martínez‐González 2015a; Martínez‐González 2015b; Martínez‐González 2015c Several systematic reviews investigating effects of nurses working as substitutes for doctors in primary care on clinical effectiveness, course of disease, process care, resource utilisation, and costs. | x | ||||
| This systematic review determines the cost‐effectiveness of nurse practitioners delivering primary and specialised ambulatory care. | x | x | |||
| This structured literature review investigates the value of advance practice nurses in delivering primary care, with a particular emphasis on the contributions of nurse practitioners. | x | x | x | ||
| This systematic reviews compares patient outcomes of care by advanced practice registered nurses (APRNs) to care by other providers (doctors or teams without APRNs). | x | x | x | USA | |
| This systematic review includes 10 studies evaluating the cost and quality of care provided by APRNs in primary care. | x | ||||
| APRN: advanced practice registered nurse. | |||||
| Outcome or subgroup title | No. of studies | No. of participants | Statistical method | Effect size |
| 1 Mortality Show forest plot | 8 | 36529 | Risk Ratio (IV, Random, 95% CI) | 0.77 [0.57, 1.03] |
| 2 Physical function (better vs not better) Show forest plot | 3 | 3549 | Risk Ratio (Random, 95% CI) | 1.03 [0.98, 1.09] |
| 3 Pain Show forest plot | 2 | Mean Difference (Random, 95% CI) | 0.76 [‐3.85, 5.38] | |
| 4 Quality of life Show forest plot | 6 | 16002 | Std. Mean Difference (Random, 95% CI) | 0.16 [0.00, 0.31] |
| 5 Systolic blood pressure Show forest plot | 3 | 1023 | Mean Difference (IV, Random, 95% CI) | ‐3.73 [‐6.02, ‐1.44] |
| 6 Diastolic blood pressure Show forest plot | 2 | 562 | Mean Difference (IV, Random, 95% CI) | ‐2.54 [‐4.57, ‐0.52] |
| 7 Total cholesterol Show forest plot | 2 | 702 | Mean Difference (IV, Random, 95% CI) | ‐0.15 [‐0.32, 0.02] |
| 8 HbA1c Show forest plot | 2 | 310 | Mean Difference (IV, Random, 95% CI) | 0.08 [‐0.25, 0.41] |
| 9 Disease Activity Score Show forest plot | 2 | Mean Difference (Random, 95% CI) | 0.04 [‐0.17, 0.24] | |
| 10 Patient satisfaction Show forest plot | 7 | 16993 | Std. Mean Difference (Random, 95% CI) | 0.08 [0.01, 0.15] |
| 11 Length of consultation Show forest plot | 4 | 5848 | Std. Mean Difference (Random, 95% CI) | 0.38 [0.22, 0.54] |
| 12 Scheduled return visits Show forest plot | 3 | 3934 | Risk Ratio (Random, 95% CI) | 1.31 [0.89, 1.94] |
| 13 Attended return visit Show forest plot | 4 | 5064 | Risk Ratio (Random, 95% CI) | 1.19 [1.07, 1.33] |
| 14 Prescription ordered Show forest plot | 4 | 5702 | Risk Ratio (Random, 95% CI) | 0.99 [0.95, 1.03] |
| 15 Investigations Show forest plot | 4 | 3654 | Risk Ratio (Random, 95% CI) | 0.95 [0.59, 1.51] |
| 16 Hospital referral Show forest plot | 4 | 17299 | Risk Ratio (Random, 95% CI) | 0.90 [0.54, 1.49] |
| 17 Attendance at accident and emergency Show forest plot | 6 | 29905 | Risk Ratio (Random, 95% CI) | 1.00 [0.91, 1.09] |
| 18 Hospital admission Show forest plot | 3 | 16466 | Risk Ratio (Random, 95% CI) | 1.04 [0.78, 1.39] |