ایورمکتین و پرمترین در درمان گال
Appendices
Appendix 1. Search strategy
| Search set | CIDG SRa/ EconLit/ ERIC | CENTRAL | MEDLINE/Embaseb | LILACSb | IndMED |
| 1 | scabies | scabies ti, ab | scabies ti, ab | scabies | scabies |
| 2 | — | "scabies" [MeSH] | "scabies" [MeSH/Emtree] | permethrin | sarcoptes scabiei |
| 3 | — | "sarcoptes scabiei" [MeSH] | "sarcoptes scabiei" [MeSH/Emtree] | ivermectin | 1 or 2 |
| 4 | — | 1 or 2 or 3 | 1 or 2 or 3 | 2 or 3 | — |
| 5 | — | permethrin ti, ab | permethrin ti, ab | 1 and 4 | — |
| 6 | — | "permethrin" [MeSH] | "permethrin" [MeSH/Emtree] | — | — |
| 7 | — | "pyrethrins" [MeSH] | "pyrethrins" [MeSH] | — | — |
| 8 | — | ivermectin ti, ab | "pyrethroid" [Emtree] | — | — |
| 9 | — | "ivermectin" [MeSH] | ivermectin ti, ab | — | — |
| 10 | — | 5 or 6 or 7 or 8 or 9 | "ivermectin" [MeSH/Emtree] | — | — |
| 11 | — | 4 and 10 | 5 or 6 or 7 or 8 or 9 or 10 | — | — |
| 12 | — | — | 4 and 11 | — | — |
aCochrane Infectious Diseases Group Specialized Register.
bSearch terms used in combination with the search strategy for retrieving trials developed by the Cochrane Collaboration (Lefebvre 2011).
Appendix 2. Sensitivity analyses: summary table
| Comparison | Subgroup | Outcome | Sensitivity analysis | Meta‐analysis |
| Ivermectin 200 μg/kg versus permethrin 5% cream | — | Complete clearance ‐ week 2 | Without Usha 2000 (significant effect estimate): RR 0.96, 95% CI 0.88 to 1.06 (I² statistic = 0%) Without Bachewar 2009; Rohatgi 2013 (some participants were re‐treated after 1 week): RR 0.81, 95% CI 0.56 to 1.19 (I² statistic = 71%) | RR 0.91, 95% CI 0.76 to 1.08 (I² statistic = 61%) |
| IVER 1 to 3 doses versus PER 1 to 3 doses | Complete clearance ‐ week 4 | Without Usha 2000 (significant effect estimate): RR 0.97, 95% CI 0.91 to 1.05 (I² statistic = 31%) Without Usha 2000; Mushtaq 2010 (non‐responders re‐treated after 2 weeks): RR 0.98, 95% CI 0.91 to 1.06 (I² statistic = 36%) | RR 0.92, 95% CI 0.82 to 1.03 (I² statistic = 74%) |
Abbreviations: CI: confidence interval; IVER: ivermectin; PER: permethrin; RR: risk ratio.
Appendix 3. Number of participants re‐treated
| Study | Initial treatment | Follow‐up week 1 | Follow‐up week 2 | Follow‐up week 3 | Follow‐up week 4 |
| Studies that treated participants once | |||||
| 1 x IVER 200 µg/kg | ‐ | ‐ | ‐ | ‐ | |
| 1 x PER 5% | ‐ | ‐ | ‐ | ‐ | |
| 1 x IVER 200 µg/kg | ‐ | ‐ | ‐ | ‐ | |
| 1 x PER 5% | ‐ | ‐ | ‐ | ‐ | |
| Studies that treated participants once and re‐treated only non‐responders | |||||
| 1 x IVER 1% | Yes, 4/32 participants | ‐ | ‐ | ‐ | |
| 1 x IVER 200 µg/kg | Yes, 8/30 participants | ‐ | ‐ | ‐ | |
| 1 x IVER 200 µg/kg | Yes, 44.44% of participants | ‐ | ‐ | ‐ | |
| 1 x PER 5% | Yes, 17.86% of participants | ‐ | ‐ | ‐ | |
| 1 x IVER 200 µg/kg | Yes, n unclear | Yes, n unclear | Switch over to PER 5% | ‐ | |
| 1 x IVER 1% | Yes, n unclear | Yes, n unclear | Switch over to PER 5% | ‐ | |
| 1 x PER 5% | Yes, n unclear | Yes, n unclear | Yes, n unclear | ‐ | |
| 1 x IVER 200 µg/kg | ‐ | Yes, n unclear | ‐ | ‐ | |
| 1 x PER 5% | ‐ | Yes, n unclear | ‐ | ‐ | |
| 1 x IVER 200 µg/kg | Yes, n unclear | ‐ | ‐ | ‐ | |
| 1 x PER 5% | Yes, n unclear | ‐ | ‐ | ‐ | |
| 1 x IVER 200 µg/kg | ‐ | Yes, 12 participants | ‐ | Cross‐over if treatment failure | |
| 1 x PER 5% | ‐ | Yes, 1 participant | ‐ | Cross‐over if treatment failure | |
| 1 x IVER 200 µg/kg | Yes, n unclear | ‐ | ‐ | ‐ | |
| 1 x PER 5% | Yes, n unclear | ‐ | ‐ | ‐ | |
| 1 x IVER 200 µg/kg | Yes, n unclear | ‐ | ‐ | ‐ | |
| 1 x PER 5% | Yes, n unclear | ‐ | ‐ | ‐ | |
| Studies that treated all participants with more than 1 dose | |||||
| 1 x IVER 200 µg/kg | 1 x IVER 200 µg/kg | Yes, time and n unclear | |||
| PER 5% for 5 consecutive nights | ‐ | ||||
| 1 x IVER 200 µg/kg | ‐ | 1 x IVER 200 µg/kg | ‐ | ‐ | |
| 1 x PER 5% | ‐ | ‐ | ‐ | ‐ | |
| 1 x IVER 250 µg/kg | ‐ | ‐ | ‐ | ‐ | |
| 1 x IVER 250 µg/kg | Day 3: 1 x IVER 250 µg/kg | Day 10: 1 x IVER 250 µg/kg | ‐ | ‐ | |
| 1 x IVER 200 µg/kg | 1 x IVER 200 µg/kg | ‐ | ‐ | ‐ | |
| 1 x PER 5% | 1 x PER 5% | ‐ | ‐ | ‐ | |
| 1 x IVER 200 µg/kg | ‐ | ‐ | ‐ | ‐ | |
| 1 x IVER 200 µg/kg | ‐ | Day 15: 1 x IVER 200 µg/kg | ‐ | ‐ | |
| 1 x PER 5% | ‐ | ‐ | ‐ | ‐ | |
Abbreviations: IVER: ivermectin; PER: permethrin.
Appendix 4. Definition and diagnosis of complete clearance
| Study | Name of outcome | Definition and evaluation |
| Complete cure |
| |
| Cure |
| |
| Cure |
| |
| Clinical cure of scabietic lesions |
| |
| Improvement clinically |
| |
| Cure |
| |
| Complete improvement |
| |
| Complete clinical cure |
| |
| Cure of disease |
| |
| Cure |
| |
| Cure |
| |
| Complete clinical cure |
| |
| Complete clearance |
| |
| Cure rate |
| |
| Cure |
|
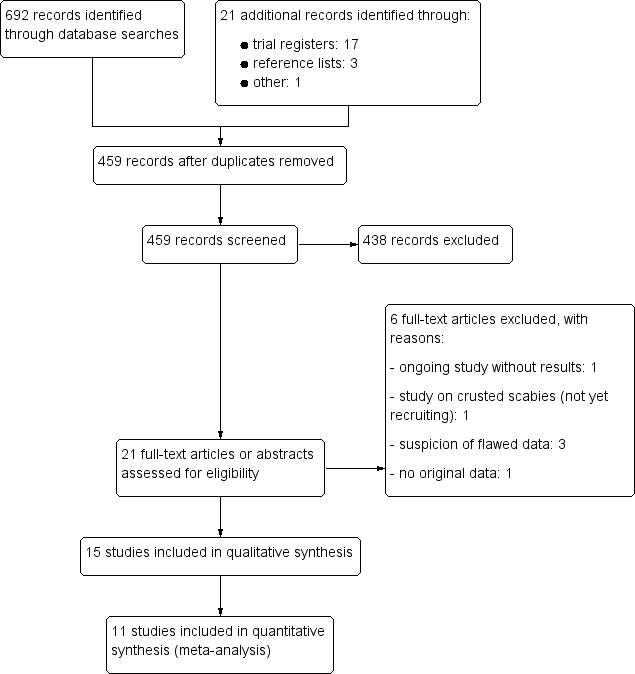
Study flow diagram.

‘Risk of bias' summary: review authors' judgements about each risk of bias item for each included trial.

Forest plot of comparison: 1 Ivermectin 200 μg/kg versus permethrin 5% cream, outcome: 1.1 Complete clearance ‐ week 1.

Forest plot of comparison: 1 Ivermectin 200 μg/kg versus permethrin 5% cream, outcome: 1.2 Complete clearance ‐ week 2.

Forest plot of comparison: 1 Ivermectin 200 μg/kg (1 to 3 doses) versus permethrin 5% cream (1 to 3 applications), outcome: 1.3 Complete clearance ‐ week 4.
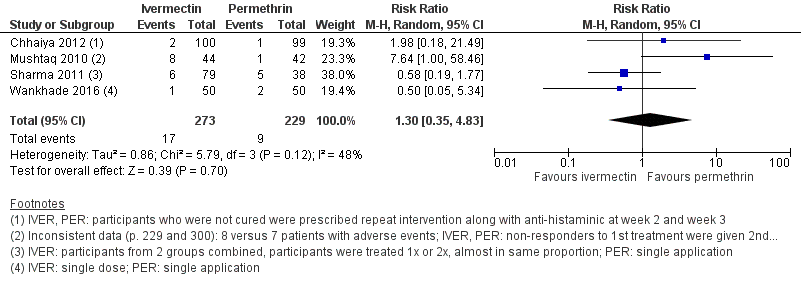
Forest plot of comparison: 1 Ivermectin 200 μg/kg versus permethrin 5% cream, outcome: 1.5 Number of participants with ≥ 1 adverse event ‐ week 4.
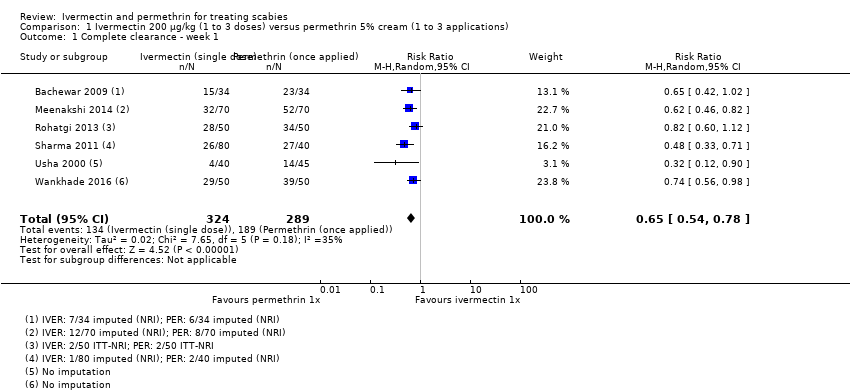
Comparison 1 Ivermectin 200 μg/kg (1 to 3 doses) versus permethrin 5% cream (1 to 3 applications), Outcome 1 Complete clearance ‐ week 1.
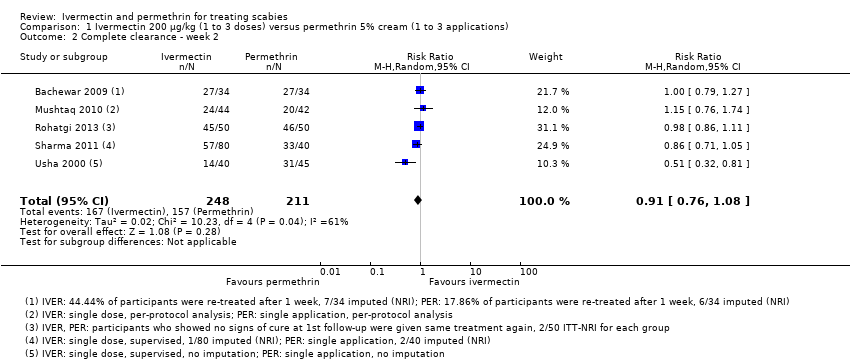
Comparison 1 Ivermectin 200 μg/kg (1 to 3 doses) versus permethrin 5% cream (1 to 3 applications), Outcome 2 Complete clearance ‐ week 2.

Comparison 1 Ivermectin 200 μg/kg (1 to 3 doses) versus permethrin 5% cream (1 to 3 applications), Outcome 3 Complete clearance ‐ week 4.

Comparison 1 Ivermectin 200 μg/kg (1 to 3 doses) versus permethrin 5% cream (1 to 3 applications), Outcome 4 Subgroup analysis for 1.3.2 ‐ complete clearance ‐ week 4.

Comparison 1 Ivermectin 200 μg/kg (1 to 3 doses) versus permethrin 5% cream (1 to 3 applications), Outcome 5 Number of participants with ≥ 1 adverse event ‐ week 2.

Comparison 1 Ivermectin 200 μg/kg (1 to 3 doses) versus permethrin 5% cream (1 to 3 applications), Outcome 6 Number of participants with ≥ 1 adverse event ‐ week 4.

Comparison 1 Ivermectin 200 μg/kg (1 to 3 doses) versus permethrin 5% cream (1 to 3 applications), Outcome 7 Withdrawal due to adverse event ‐ week 4.

Comparison 2 Ivermectin 200 μg/kg (1 to 2 doses) versus permethrin 5% lotion (1 to 5 applications), Outcome 1 Complete clearance ‐ week 1.
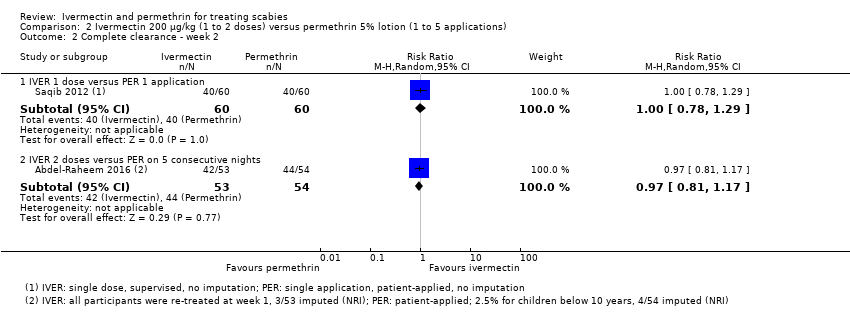
Comparison 2 Ivermectin 200 μg/kg (1 to 2 doses) versus permethrin 5% lotion (1 to 5 applications), Outcome 2 Complete clearance ‐ week 2.
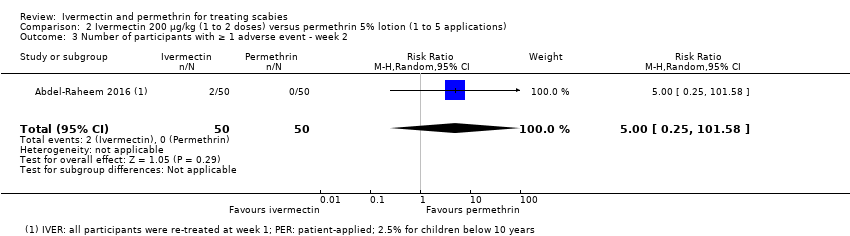
Comparison 2 Ivermectin 200 μg/kg (1 to 2 doses) versus permethrin 5% lotion (1 to 5 applications), Outcome 3 Number of participants with ≥ 1 adverse event ‐ week 2.
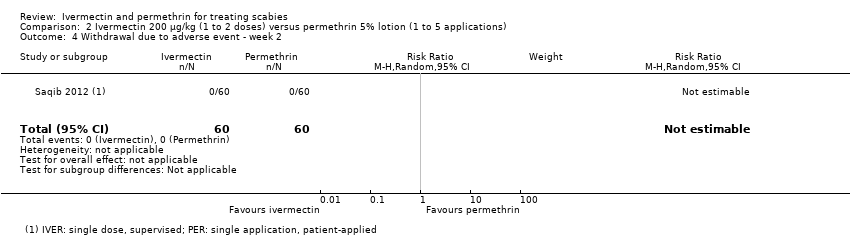
Comparison 2 Ivermectin 200 μg/kg (1 to 2 doses) versus permethrin 5% lotion (1 to 5 applications), Outcome 4 Withdrawal due to adverse event ‐ week 2.

Comparison 3 Ivermectin 200 μg/kg (1 to 3 doses) versus ivermectin 1% lotion/solution (1 to 3 applications), Outcome 1 Complete clearance ‐ week 1.

Comparison 3 Ivermectin 200 μg/kg (1 to 3 doses) versus ivermectin 1% lotion/solution (1 to 3 applications), Outcome 2 Complete clearance ‐ week 2.
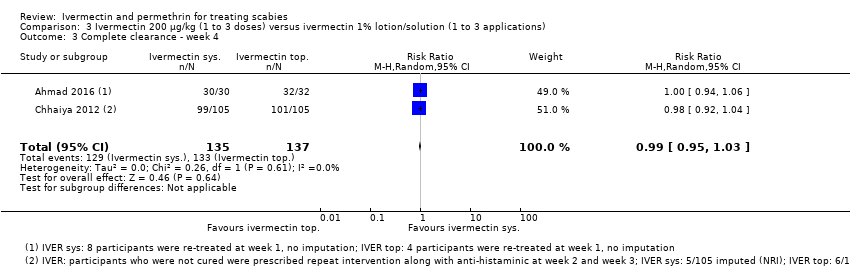
Comparison 3 Ivermectin 200 μg/kg (1 to 3 doses) versus ivermectin 1% lotion/solution (1 to 3 applications), Outcome 3 Complete clearance ‐ week 4.

Comparison 3 Ivermectin 200 μg/kg (1 to 3 doses) versus ivermectin 1% lotion/solution (1 to 3 applications), Outcome 4 Number of participants with ≥ 1 adverse event ‐ week 4.

Comparison 3 Ivermectin 200 μg/kg (1 to 3 doses) versus ivermectin 1% lotion/solution (1 to 3 applications), Outcome 5 Withdrawal due to adverse event ‐ week 4.
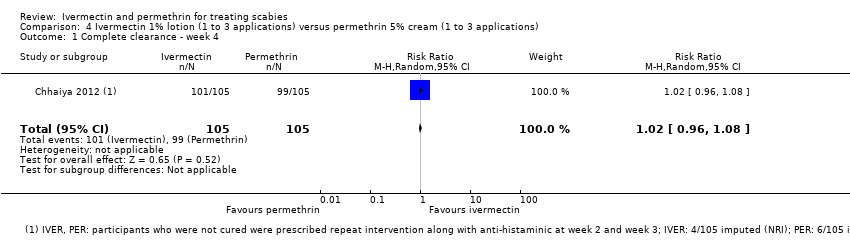
Comparison 4 Ivermectin 1% lotion (1 to 3 applications) versus permethrin 5% cream (1 to 3 applications), Outcome 1 Complete clearance ‐ week 4.

Comparison 4 Ivermectin 1% lotion (1 to 3 applications) versus permethrin 5% cream (1 to 3 applications), Outcome 2 Number of participants with ≥ 1 adverse event ‐ week 4.
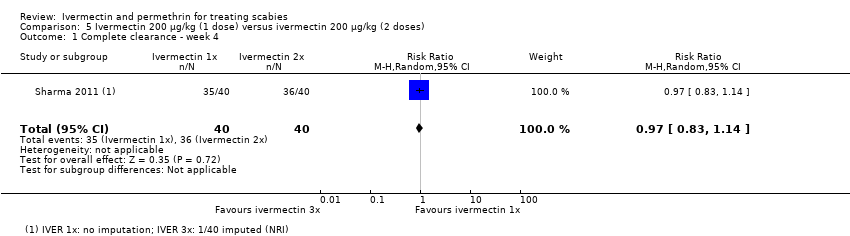
Comparison 5 Ivermectin 200 μg/kg (1 dose) versus ivermectin 200 μg/kg (2 doses), Outcome 1 Complete clearance ‐ week 4.
| Oral ivermectin 200 μg/kg (1 to 3 doses) compared to topical permethrin 5% cream (1 to 3 applications) for treating scabies | ||||||
| Patient or population: people with scabies, 2 to 80 years of age | ||||||
| Outcomes | Anticipated absolute effects* (95% CI) | Relative effect | Number of participants | Certainty of the evidence | Comments | |
| Risk with permethrin 5% cream | Risk with ivermectin 200 μg/kg | |||||
| Complete clearance ‐ week 1 | 654 per 1000 | 425 per 1000 | RR 0.65 | 613 | ⊕⊕⊝⊝ | ‐ |
| Complete clearance ‐ week 2 | 744 per 1000 | 677 per 1000 | RR 0.91 | 459 | ⊕⊕⊝⊝ | In 1 study non‐responders were re‐treated after 1 week; in 1 study 44.44% of participants (IVER) and 17.86% of participants (PER) were re‐treated after 1 week (absolute numbers are unclear). |
| Complete clearance ‐ week 4 ‐ IVER 1 dose versus PER 1 application | 900 per 1000 | 900 per 1000 | RR 1.00 | 80 | ⊕⊕⊕⊕ | ‐ |
| Complete clearance ‐ week 4 ‐ IVER 1 to 3 doses versus PER 1 to 3 applications | 932 per 1000 | 857 per 1000 | RR 0.92 | 581 | ⊕⊕⊝⊝ | In 3 studies non‐responders were re‐treated once; in 1 study non‐responders were re‐treated after 2 and/or 3 weeks (absolute numbers are unclear); in 1 study 12 participants (IVER) and 1 participant (PER) were re‐treated after 2 weeks. |
| Complete clearance ‐ week 4 ‐ IVER 2 doses versus PER 1 application | 900 per 1000 | 873 per 1000 | RR 0.97 | 80 | ⊕⊕⊕⊕ | ‐ |
| Number of participants with ≥ 1 AE ‐ week 2 | 0 per 1000 | 0 per 1000 | Not estimable | 55 | ⊕⊕⊕⊝ | 0 events; 44.44% of participants (IVER) and 17.86% of participants (PER) were re‐treated after 1 week (absolute numbers are unclear) |
| Number of participants with ≥ 1 AE ‐ week 4 | 39 per 1000 | 51 per 1000 | RR 1.30 | 502 | ⊕⊕⊝⊝ | In 1 study non‐responders were re‐treated after 2 weeks; in 1 study non‐responders were re‐treated after 2 and 3 weeks; in 1 study participants in IVER group were re‐treated (absolute numbers are unclear). |
| Withdrawal due to AE ‐ week 4 | See comment | See comment | ‐ | 305 | ⊕⊕⊕⊝ | 0 events; in 1 study non‐responders were re‐treated after 1 week (absolute numbers are unclear); in 1 study 12 participants (IVER) and 1 participant (PER) were re‐treated after 2 weeks |
| *The risk in the intervention group (and its 95% CI) is based on the assumed risk in the comparison group and the relative effect of the intervention (and its 95% CI). | ||||||
| GRADE Working Group grades of evidence | ||||||
| 1Usha 2000; Bachewar 2009; Sharma 2011; Rohatgi 2013; Meenakshi 2014; Wankhade 2016. | ||||||
| Oral ivermectin 200 μg/kg (1 to 2 doses) compared to topical permethrin 5% lotion (1 to 5 applications) for treating scabies | ||||||
| Patient or population: people with scabies, 5 to 60 years of age | ||||||
| Outcomes | Anticipated absolute effects* (95% CI) | Relative effect | Number of participants | Certainty of the evidence | Comments | |
| Risk with permethrin 5% lotion | Risk with ivermectin 200 μg/kg | |||||
| Complete clearance ‐ week 1 ‐ IVER 1 dose versus PER 1 application | 733 per 1000 | 682 per 1000 | RR 0.93 | 120 | ⊕⊕⊕⊝ | ‐ |
| Complete clearance ‐ week 1 ‐ IVER 1 dose versus PER on 5 consecutive nights | 593 per 1000 | 415 per 1000 | RR 0.70 | 107 | ⊕⊕⊝⊝ | ‐ |
| Complete clearance ‐ week 2 ‐ IVER 1 dose versus PER 1 application | 667 per 1000 | 667 per 1000 | RR 1.00 | 120 | ⊕⊕⊝⊝ | ‐ |
| Complete clearance ‐ week 2 ‐ IVER 2 doses versus PER on 5 consecutive nights | 815 per 1000 | 790 per 1000 | RR 0.97 | 107 | ⊕⊕⊕⊝ | ‐ |
| Number of participants with ≥ 1 AE ‐ week 2 ‐ IVER 2 doses versus PER on 5 consecutive nights | 0 per 1000 | 0 per 1000 | RR 5.00 | 100 | ⊕⊝⊝⊝ | ‐ |
| Withdrawal due to AE ‐ week 2 ‐ IVER 1 dose versus PER 1 application | 0 per 1000 | 0 per 1000 | Not estimable | 120 | ⊕⊕⊕⊝ | 0 events |
| *The risk in the intervention group (and its 95% CI) is based on the assumed risk in the comparison group and the relative effect of the intervention (and its 95% CI). Abbreviations: AE: adverse event; CI: confidence interval; IVER: ivermectin; PER: permethrin; RCT: randomized controlled trial; RR: risk ratio | ||||||
| GRADE Working Group grades of evidence | ||||||
| 1Saqib 2012. | ||||||
| Oral ivermectin 200 μg/kg (1 to 3 doses) compared to topical ivermectin 1% lotion/solution (1 to 3 applications) for treating scabies | ||||||
| Patient or population: people with scabies, 5 to 80 years of age | ||||||
| Outcomes | Anticipated absolute effects* (95% CI) | Relative effect | Number of participants | Certainty of the evidence | Comments | |
| Risk with ivermectin 1% lotion/solution | Risk with ivermectin 200 μg/kg | |||||
| Complete clearance ‐ week 1 | 875 per 1000 | 735 per 1000 | RR 0.84 | 62 | ⊕⊕⊝⊝ | ‐ |
| Complete clearance ‐ week 2 | 1000 per 1000 | 1000 per 1000 | RR 1.00 | 62 | ⊕⊕⊕⊝ | 8 participants (oral IVER) and 4 participants (topical IVER) were re‐treated after 1 week. |
| Complete clearance ‐ week 4 | 971 per 1000 | 961 per 1000 | RR 0.99 | 272 | ⊕⊕⊕⊝ | In 1 study 8 participants (oral IVER) and 4 participants (topical IVER) were re‐treated after 1 week; in 1 study non‐responders were re‐treated after 2 and/or 3 weeks (absolute numbers are unclear). |
| Number of participants with ≥ 1 AE ‐ week 4 | 0 per 1000 | 0 per 1000 | RR 5.05 | 201 | ⊕⊝⊝⊝ | Non‐responders were re‐treated after 2 and/or 3 weeks (absolute numbers are unclear). |
| Withdrawal due to AE ‐ week 4 | 0 per 1000 | 0 per 1000 | Not estimable | 62 | ⊕⊕⊕⊝ | 0 events; 8 participants (oral IVER) and 4 participants (topical IVER) were re‐treated after 1 week. |
| *The risk in the intervention group (and its 95% CI) is based on the assumed risk in the comparison group and the relative effect of the intervention (and its 95% CI). | ||||||
| GRADE Working Group grades of evidence | ||||||
| 1Ahmad 2016. | ||||||
| Topical ivermectin 1% lotion (1 to 3 applications) compared to topical permethrin 5% cream (1 to 3 applications) for treating scabies | ||||||
| Patient or population: people with scabies, 5 to 80 years of age | ||||||
| Outcomes | Anticipated absolute effects* (95% CI) | Relative effect | Number of participants | Certainty of the evidence | Comments | |
| Risk with permethrin 5% cream | Risk with ivermectin 1% lotion | |||||
| Complete clearance ‐ week 4 | 943 per 1000 | 962 per 1000 | RR 1.02 | 210 | ⊕⊕⊕⊝ | Non‐responders were re‐treated after 2 and/or 3 weeks (absolute numbers are unclear). |
| Number of participants with ≥ 1 AE ‐ week 4 | 10 per 1000 | 3 per 1000 | RR 0.33 | 200 | ⊕⊝⊝⊝ | Non‐responders were re‐treated after 2 and/or 3 weeks (absolute numbers are unclear). |
| *The risk in the intervention group (and its 95% CI) is based on the assumed risk in the comparison group and the relative effect of the intervention (and its 95% CI). | ||||||
| GRADE Working Group grades of evidence | ||||||
| 1Chhaiya 2012. | ||||||
| Oral ivermectin 200 μg/kg (1 dose) compared to oral ivermectin 200 μg/kg (2 doses) for treating scabies | ||||||
| Patient or population: people with scabies, over 5 years of age | ||||||
| Outcomes | Anticipated absolute effects* (95% CI) | Relative effect | Number of participants | Certainty of the evidence | Comments | |
| Risk with ivermectin 200 μg/kg 2 doses | Risk with ivermectin 200 μg/kg 1 dose | |||||
| Complete clearance ‐ week 4 | 900 per 1000 | 873 per 1000 | RR 0.97 | 80 | ⊕⊕⊕⊕ | ‐ |
| *The risk in the intervention group (and its 95% CI) is based on the assumed risk in the comparison group and the relative effect of the intervention (and its 95% CI). | ||||||
| GRADE Working Group grades of evidence | ||||||
| Outcome or subgroup title | No. of studies | No. of participants | Statistical method | Effect size |
| 1 Complete clearance ‐ week 1 Show forest plot | 6 | 613 | Risk Ratio (M‐H, Random, 95% CI) | 0.65 [0.54, 0.78] |
| 2 Complete clearance ‐ week 2 Show forest plot | 5 | 459 | Risk Ratio (M‐H, Random, 95% CI) | 0.91 [0.76, 1.08] |
| 3 Complete clearance ‐ week 4 Show forest plot | 6 | Risk Ratio (M‐H, Random, 95% CI) | Subtotals only | |
| 3.1 IVER 1 dose versus PER 1 application | 1 | 80 | Risk Ratio (M‐H, Random, 95% CI) | 1.0 [0.86, 1.16] |
| 3.2 IVER 1 to 3 doses versus PER 1 to 3 applications | 5 | 581 | Risk Ratio (M‐H, Random, 95% CI) | 0.92 [0.82, 1.03] |
| 3.3 IVER 2 doses versus PER 1 application | 1 | 80 | Risk Ratio (M‐H, Random, 95% CI) | 0.97 [0.83, 1.14] |
| 4 Subgroup analysis for 1.3.2 ‐ complete clearance ‐ week 4 Show forest plot | 5 | Risk Ratio (M‐H, Random, 95% CI) | Subtotals only | |
| 4.1 IVER 1 to 3 doses versus PER 1 to 3 applications ‐ 5 studies | 5 | 581 | Risk Ratio (M‐H, Random, 95% CI) | 0.92 [0.82, 1.03] |
| 4.2 IVER 1 to 3 doses versus PER 1 to 3 applications ‐ 3 studies | 3 | 410 | Risk Ratio (M‐H, Random, 95% CI) | 0.98 [0.91, 1.06] |
| 5 Number of participants with ≥ 1 adverse event ‐ week 2 Show forest plot | 1 | 55 | Risk Ratio (M‐H, Random, 95% CI) | 0.0 [0.0, 0.0] |
| 6 Number of participants with ≥ 1 adverse event ‐ week 4 Show forest plot | 4 | 502 | Risk Ratio (M‐H, Random, 95% CI) | 1.30 [0.35, 4.83] |
| 7 Withdrawal due to adverse event ‐ week 4 Show forest plot | 3 | 305 | Risk Ratio (M‐H, Random, 95% CI) | 0.0 [0.0, 0.0] |
| Outcome or subgroup title | No. of studies | No. of participants | Statistical method | Effect size |
| 1 Complete clearance ‐ week 1 Show forest plot | 2 | Risk Ratio (M‐H, Random, 95% CI) | Subtotals only | |
| 1.1 IVER 1 dose versus PER 1 application | 1 | 120 | Risk Ratio (M‐H, Random, 95% CI) | 0.93 [0.74, 1.17] |
| 1.2 IVER 1 dose versus PER on 5 consecutive nights | 1 | 107 | Risk Ratio (M‐H, Random, 95% CI) | 0.70 [0.47, 1.03] |
| 2 Complete clearance ‐ week 2 Show forest plot | 2 | Risk Ratio (M‐H, Random, 95% CI) | Subtotals only | |
| 2.1 IVER 1 dose versus PER 1 application | 1 | 120 | Risk Ratio (M‐H, Random, 95% CI) | 1.0 [0.78, 1.29] |
| 2.2 IVER 2 doses versus PER on 5 consecutive nights | 1 | 107 | Risk Ratio (M‐H, Random, 95% CI) | 0.97 [0.81, 1.17] |
| 3 Number of participants with ≥ 1 adverse event ‐ week 2 Show forest plot | 1 | 100 | Risk Ratio (M‐H, Random, 95% CI) | 5.00 [0.25, 101.58] |
| 4 Withdrawal due to adverse event ‐ week 2 Show forest plot | 1 | 120 | Risk Ratio (M‐H, Random, 95% CI) | 0.0 [0.0, 0.0] |
| Outcome or subgroup title | No. of studies | No. of participants | Statistical method | Effect size |
| 1 Complete clearance ‐ week 1 Show forest plot | 1 | 62 | Risk Ratio (M‐H, Random, 95% CI) | 0.84 [0.65, 1.08] |
| 2 Complete clearance ‐ week 2 Show forest plot | 1 | 62 | Risk Ratio (M‐H, Random, 95% CI) | 1.0 [0.94, 1.06] |
| 3 Complete clearance ‐ week 4 Show forest plot | 2 | 272 | Risk Ratio (M‐H, Random, 95% CI) | 0.99 [0.95, 1.03] |
| 4 Number of participants with ≥ 1 adverse event ‐ week 4 Show forest plot | 1 | 201 | Risk Ratio (M‐H, Random, 95% CI) | 5.05 [0.25, 103.87] |
| 5 Withdrawal due to adverse event ‐ week 4 Show forest plot | 1 | 62 | Risk Ratio (M‐H, Random, 95% CI) | 0.0 [0.0, 0.0] |
| Outcome or subgroup title | No. of studies | No. of participants | Statistical method | Effect size |
| 1 Complete clearance ‐ week 4 Show forest plot | 1 | 210 | Risk Ratio (M‐H, Random, 95% CI) | 1.02 [0.96, 1.08] |
| 2 Number of participants with ≥ 1 adverse event ‐ week 4 Show forest plot | 1 | 200 | Risk Ratio (M‐H, Random, 95% CI) | 0.33 [0.01, 7.93] |
| Outcome or subgroup title | No. of studies | No. of participants | Statistical method | Effect size |
| 1 Complete clearance ‐ week 4 Show forest plot | 1 | 80 | Risk Ratio (M‐H, Random, 95% CI) | 0.97 [0.83, 1.14] |