Scolaris Content Display Scolaris Content Display

Study flow diagram.
Figuras y tablas -
Figure 1

Study flow diagram.

Risk of bias graph: review authors' judgements about each risk of bias item presented as percentages across all included studies.
Figuras y tablas -
Figure 2

Risk of bias graph: review authors' judgements about each risk of bias item presented as percentages across all included studies.

Risk of bias summary: review authors' judgements about each risk of bias item for each included study.
Figuras y tablas -
Figure 3

Risk of bias summary: review authors' judgements about each risk of bias item for each included study.

Comparison 1 Motor neuroprosthesis versus another assistive technology device, Outcome 1 Activities involving limbs: walking speed until 6 months of device use.
Figuras y tablas -
Analysis 1.1

Comparison 1 Motor neuroprosthesis versus another assistive technology device, Outcome 1 Activities involving limbs: walking speed until 6 months of device use.

Comparison 1 Motor neuroprosthesis versus another assistive technology device, Outcome 2 Activities involving limbs: walking speed between 6 and 12 months of device use.
Figuras y tablas -
Analysis 1.2

Comparison 1 Motor neuroprosthesis versus another assistive technology device, Outcome 2 Activities involving limbs: walking speed between 6 and 12 months of device use.

Comparison 1 Motor neuroprosthesis versus another assistive technology device, Outcome 3 Activities involving limbs: walking speed.
Figuras y tablas -
Analysis 1.3

Comparison 1 Motor neuroprosthesis versus another assistive technology device, Outcome 3 Activities involving limbs: walking speed.

Comparison 1 Motor neuroprosthesis versus another assistive technology device, Outcome 4 Activities involving limbs: TUG.
Figuras y tablas -
Analysis 1.4

Comparison 1 Motor neuroprosthesis versus another assistive technology device, Outcome 4 Activities involving limbs: TUG.

Comparison 1 Motor neuroprosthesis versus another assistive technology device, Outcome 5 Activities involving limbs: mEFAP.
Figuras y tablas -
Analysis 1.5

Comparison 1 Motor neuroprosthesis versus another assistive technology device, Outcome 5 Activities involving limbs: mEFAP.

Comparison 1 Motor neuroprosthesis versus another assistive technology device, Outcome 6 Participation scale of HRQoL.
Figuras y tablas -
Analysis 1.6

Comparison 1 Motor neuroprosthesis versus another assistive technology device, Outcome 6 Participation scale of HRQoL.

Comparison 1 Motor neuroprosthesis versus another assistive technology device, Outcome 7 Exercise capacity: 6MWT.
Figuras y tablas -
Analysis 1.7

Comparison 1 Motor neuroprosthesis versus another assistive technology device, Outcome 7 Exercise capacity: 6MWT.

Comparison 1 Motor neuroprosthesis versus another assistive technology device, Outcome 8 Balance: BBS.
Figuras y tablas -
Analysis 1.8

Comparison 1 Motor neuroprosthesis versus another assistive technology device, Outcome 8 Balance: BBS.

Comparison 1 Motor neuroprosthesis versus another assistive technology device, Outcome 9 Adverse events: number of dropouts during the intervention period.
Figuras y tablas -
Analysis 1.9

Comparison 1 Motor neuroprosthesis versus another assistive technology device, Outcome 9 Adverse events: number of dropouts during the intervention period.

Comparison 1 Motor neuroprosthesis versus another assistive technology device, Outcome 10 Adverse events: serious adverse events related to intervention/during the intervention period.
Figuras y tablas -
Analysis 1.10

Comparison 1 Motor neuroprosthesis versus another assistive technology device, Outcome 10 Adverse events: serious adverse events related to intervention/during the intervention period.

Comparison 1 Motor neuroprosthesis versus another assistive technology device, Outcome 11 Adverse events: falls.
Figuras y tablas -
Analysis 1.11

Comparison 1 Motor neuroprosthesis versus another assistive technology device, Outcome 11 Adverse events: falls.

Summary of findings for the main comparison. Motor neuroprosthesis compared to another assistive technology device for promoting recovery of function after stroke

Motor neuroprosthesis compared to another assistive technology device for promoting recovery of function after stroke

Patient or population: promoting recovery of function after stroke
Setting: home or community context
Intervention: motor neuroprosthesis
Comparison: another assistive technology device

Outcomes

Anticipated absolute effects* (95% CI)

Relative effect
(95% CI)

Number of participants
(studies)

Certainty of the evidence
(GRADE)

Comments

Risk with another assistive technology device

Risk with motor neuroprosthesis

Independence in activities of daily living

(No data)

No studies

Insufficient evidence

No trials measured this outcome.

Activities involving limbs

Walking speed until 6 months of device use (m/s)

timed measures at the end of treatment

The mean walking speed in the control group was on average

0.58 m/s.

0.05 mean difference lower
(0.1 lower to 0) on intervention group

605

(2 RCTs)

⊕⊕⊕⊝
Lowa,b

Minimal important difference for comfortable walking speed in chronic stroke participant is 0.2 m/s (Hiengkaew 2012).

Walking speed between 6 and 12 months of device use (m/s)

timed measures at the end of treatment

The mean walking speed in the control group was on average

0.69 m/s.

0 mean difference

(0.05 lower to 0.05 higher)

713

(3 RCTs)

⊕⊕⊝⊝
Lowa,c

Minimal important difference for comfortable walking speed in chronic stroke participant is 0.2 m/s (Hiengkaew 2012).

TUG (s)

timed measures at the end of treatment

The mean TUG in the control group was on average

27.57 s.

0.51 mean difference higher

(4.41 lower to 5.43 higher) on intervention group

692
(2 RCTs)

⊕⊕⊕⊝
Moderatea

mEFAP (s)

timed measures at the end of treatment

The mean mEFAP in the control group was on average

286.43 s.

14.77 mean difference higher

(12.52 lower to 42.06 higher) on intervention group

605
(2 RCTs)

⊕⊕⊝⊝
Lowa,e

Participation scales of HRQoL

timed measures at the end of treatment

The mean participation scales of HRQoL in the control groups was NA.d

0.26 standardized mean difference (0.22 lower to 0.74 higher)

632

(3 RCTs)

⊕⊝⊝⊝
Very lowa,e,f

Using Cohen's rules of thumb, 0.26 represents a small effect.

Exercise capacity: 6MWT (m)

timed measures at the end of treatment

The mean 6MWT in the control group was on average

208.12 m.

9.03 mean difference lower

(26.87 lower to 8.81 higher) on intervention group

692
(2 RCTs)

⊕⊕⊝⊝
Lowa,e

There are no accurate indices of minimal important difference for 6MWT in people poststroke whose gait speed was ≥ 0.40 m/s (Fulk 2018).

Balance: BBS

timed measures at the end of treatment

The mean BBS in the control group was on average

44.15.

0.34 mean difference lower

(1.96 lower to 1.28 higher) on intervention group

692
(2 RCTs)

⊕⊕⊕⊝
Moderatea

Minimal detectable change for BBS in chronic stroke participant is 5 points (Hiengkaew 2012).

Adverse events

Number of dropouts during the intervention period

Study population

RR 1.48
(1.11 to 1.97)

829
(4 RCTs)

⊕⊕⊝⊝
Lowe,g

96 per 1000**

142 per 1000**
(106 to 188)

Falls

Study population

RR 1.20
(0.92 to 1.55)

802
(3 RCTs)

⊕⊕⊕⊝
Moderatee,h

296 per 1000**

355 per 1000**
(272 to 459)

*The risk in the intervention group (and its 95% confidence interval) is based on the assumed risk in the comparison group and the relative effect of the intervention (and its 95% CI).

**We used the median control group risk across studies.

6MWT: 6‐minute walk test; BBS: Berg Balance Scale; CI: confidence interval; HRQoL: health‐related quality of life; mEFAP: modified Emory Functional Ambulation Profile; NA: not applicable; RCT: randomized controlled trial; RR: risk ratio; TUG: Timed Up and Go test.

GRADE Working Group grades of evidence
High certainty: We are very confident that the true effect lies close to that of the estimate of the effect.
Moderate certainty: We are moderately confident in the effect estimate: the true effect is likely to be close to the estimate of the effect, but there is a possibility that it is substantially different.
Low certainty: Our confidence in the effect estimate is limited: the true effect may be substantially different from the estimate of the effect.
Very low certainty: We have very little confidence in the effect estimate: the true effect is likely to be substantially different from the estimate of effect.

aThe outcome assessors were not blinded in the larger study.
bThe evidence of this effect is removed when sensitivity analysis is performed, suggesting some inconsistency in this finding.
cOne study has high risk of bias for incomplete outcome data.
dNo data can be provided due to the combination of different outcome measures for the same outcome in this analysis.
eImprecise due to confidence intervals that included potential for important harm or benefit.
fConsiderable heterogeneity between trials.
gAs no study included motor neuroprosthesis (MN) directed to the upper limb, this effect addresses only lower limb MN and not the whole category of MN.
hAlthough two of the three studies were sponsored by the manufacturers, they clearly described fall events. There is no blinding of outcome assessment for the largest study, but this would seem not to interfere with this outcome.

Figuras y tablas -
Summary of findings for the main comparison. Motor neuroprosthesis compared to another assistive technology device for promoting recovery of function after stroke
Table 1. Intervention characteristics of the MN used in the included trials

Study ID (report)

MN device

Duration of exposure to MN intervention

Conditioning protocol used to adapt participants to MN use

MN use/daily use for increasing the activities and participation in the home or community context
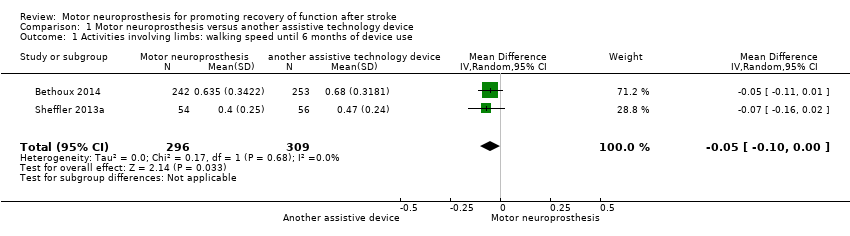
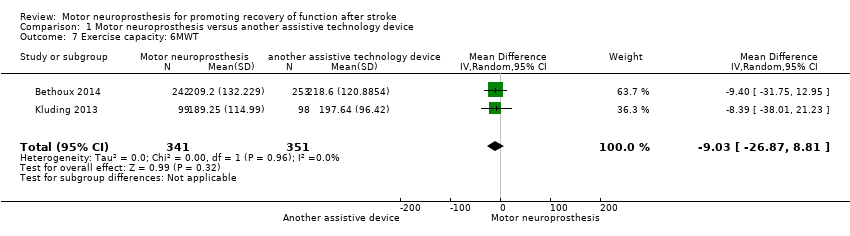
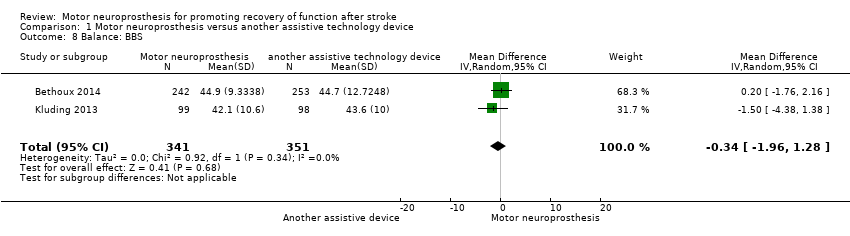
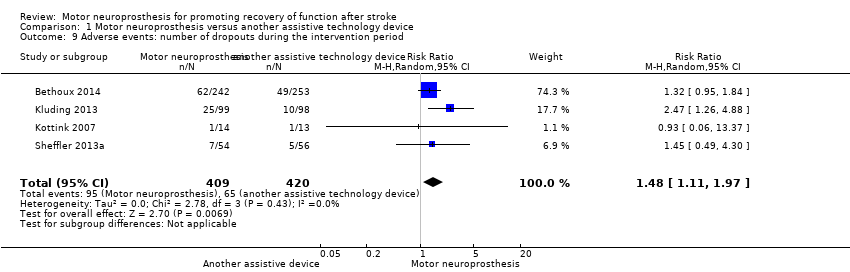
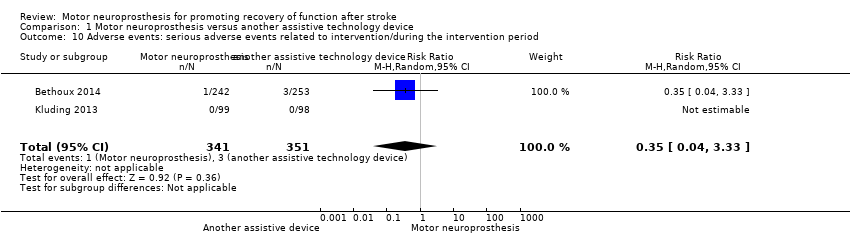
Bethoux 2014

The MN used was the WalkAide device (Innovative Neurotronics, Austin, TX, USA). It is a commercially available, battery‐operated, single‐channel surface peroneal nerve stimulator that consists of a cuff worn around the proximal part of the lower leg, which holds the control module and surface electrodes. This device uses a tilt sensor and an accelerometer to trigger ankle dorsiflexion and control the timing and duration of peroneal nerve stimulation during the swing phase of gait to alleviate foot drop.

The duration of MN intervention was 12 months. The conditioning protocol occurred in the first 2 weeks, after which participants started daily use of MN device.

The first part consisted of fitting and programming the MN device as well as patient education performed by WalkAide‐certified orthotist or licensed physical therapist. The conditioning protocol included a 2‐week progressive wearing schedule of MN device.

Participants were instructed to wear MN device on a full‐time basis (quote: "ie, for all walking activities throughout the day").

Kluding 2013

The MN used was the NESS L300 device (Bioness Inc, Valencia, CA, USA). It is a commercially available, battery‐operated, single‐channel surface peroneal nerve stimulator that consists of a cuff with integrated stimulation unit and electrodes, a control unit, and an in‐shoe pressure sensor. The pressure sensor detects heel off and initial contact events during gait. It transmits wireless signals to the stimulation cuff, which initiates or pauses the stimulation of deep and superficial branches of the peroneal nerve via 2 surface electrodes that activate dorsiflexors and evertors muscles to ensure foot clearance during the swing phase of gait and prevent excessive ankle inversion during early stance.

The duration of MN intervention was 30 weeks. The conditioning protocol occurred in the first 6 weeks. Participants used the MN device all day between week 4 and week 30.

The first part consisted of initial fitting of the device, gait training, wearing schedule, home exercise program, and participant education based on manufacturer standardized protocols. For the first 3 weeks, participants followed the standard conditioning protocol (gradually increasing walking with the MN from 15 minutes each day to all‐day use). During the same period, participants also used the MN for cyclic stimulation while not walking in order to gradually strengthen and condition the muscles to avoid fatigue when using the device (Dunning 2013).* During the first 6 weeks of the study, participants also received 8 dose‐matched sessions of physical therapy. The first 2 to 4 therapy visits focused on education on device use, initial gait training, and an individualized home exercise program. The remaining physical therapy sessions focused on gait training (Kluding 2013).

Participants used the MN all day for ambulation (Dunning 2013).*

Kottink 2007

The MN used was the STIMuSTEP device (FineTech Medical Ltd, Hertfordshire, UK). It is a commercially available, battery‐operated, 2‐channel implantable device composed of implantable components such as a stimulator, 2 leads, and bipolar intraneural electrodes, and non‐implantable components such as an external transmitter with a built‐in antenna and a pressure sensor. 1 electrode is surgically positioned under the epineurium of the superficial peroneal nerve and the other under the epineurium of the deep peroneal nerve. This device promotes the ankle dorsiflexion/eversion during gait to correct foot drop, and a pressure sensor placed inside the shoe determines the on and off switching of the stimulation.

The duration of MN intervention was 26 weeks. The intervention began with the surgical procedure for placement of the implant. After 2 weeks of the surgery, the wound was checked and first test stimulation took place. The conditioning protocol began at the third week, and all‐day MN use began at the sixth week.

Quote: "Two weeks after the surgery the wound was checked and a first test stimulation took place. In the third week, stimulation during walking was tested and the stimulator was taken home by the patient. The use of the stimulator was gradually increased over 2 weeks to prevent severe muscle pain and fatigue. After this period patients were allowed to use the system all day."

Participants were allowed to use the system all day between week 6 and week 26.

Sheffler 2013a

The MN used to correct foot drop was the Odstock Dropped‐Foot Stimulator (ODFS) device (Odstock Medical Ltd, Salisbury Wiltshire, UK). The ODFS is a commercially available, battery‐operated, single‐channel surface peroneal nerve stimulator consisting of an electrical stimulator, a control module, pressure sensors, and surface electrodes. The stimulation is triggered by an insole pressure‐sensing foot switch that detects heel rise at pre‐swing.

The duration of MN intervention was 12 weeks. The conditioning protocol occurred over the 12 weeks. Daily MN use began once device safety was demonstrated by participants.

In the first 5 weeks the Functional Training phase (2 x 1‐hour sessions per week) took place, in which participants were trained to use MN device for home and community mobility with an assistive device, if needed. Activities included passive and active range‐of‐motion exercises, lower extremity strengthening, standing balance and weight‐shifting activities to the affected limb with transition to least‐restrictive assistive device, and refinement of a reciprocal gait pattern. Exercises were done with multiple repetitions with an increase in difficulty and a decrease in cues, with and without the MN device, as appropriate. In the last 7 weeks the Post‐Functional Training Phase (3 x 1‐hour sessions) took place, in which device function, application, and usage guidelines were reviewed with each participant to maximize MN compliance.

The article did not explicitly mention when participants started all‐day MN use, but reported that as soon as participants demonstrated safe use of the device, it was used up to 8 hours per day.

MN: motor neuroprosthesis

*Dunning 2013 corresponds to the published protocol of the study Kluding 2013.

Figuras y tablas -
Table 1. Intervention characteristics of the MN used in the included trials
Table 2. Outcome measures used from the included trials

Study ID (report)

Independence in ADL

Activities involving limbs

Participation scales of HRQoL

Exercise capacity

Balance

Bethoux 2014

(Bethoux 2014; 6‐month assessment)

Comfortable walking speed measured by 10MWT, TUG, mEFAP

SSQoL (total value); SIS (all domains)

6MWT

BBS

Bethoux 2014

(Bethoux 2015; 12‐month assessment)

Comfortable walking speed measured by 10MWT, mEFAP

6MWT

Kluding 2013 (Kluding 2013)

Comfortable and fast walking speed measured by 10MWT, TUG

SIS (ADL/iADL, Mobility, Participation domains)

6MWT

BBS; FRT

Kottink 2007 (Kottink 2007; Kottink 2008; Kottink 2010; Kottink 2012)

Comfortable walking speed motion analysis system

SF‐36 (all domains)

Sheffler 2013a (Sheffler 2013a; Sheffler 2015)

Comfortable walking speed measured by motion analysis system, mEFAP

SSQoL (total value)

6MWT: 6‐minute walk test
10MWT: 10‐meter walk test
ADL: activities of daily living
BBS: Berg Balance Scale
FRT: Functional Reach Test
HRQoL: health‐related quality of life
iADL: instrumental activities of daily living
mEFAP: modified Emory Functional Ambulation Profile
SF‐36: 36‐item Short Form Health Survey
SIS: Stroke Impact Scale
SSQoL: Stroke‐Specific Quality of Life
TUG: Timed Up and Go test

Figuras y tablas -
Table 2. Outcome measures used from the included trials
Table 3. Dropouts

Study ID (report)

Motor neuroprosthesis

Another assistive technology device

Bethoux 2014

(Bethoux 2014; 6‐month assessment)*

2 deceased; 25 non‐compliance with protocol; 15 participant request; 7 medical reasons; 4 lost to follow‐up; 2 investigator withdrew

2 deceased; 13 non‐compliance with protocol; 18 participant request; 4 medical reasons; 3 lost to follow‐up; 1 investigator withdrew

Bethoux 2014

(Bethoux 2015; 12‐month assessment)**

2 deceased; 25 non‐compliance with protocol; 16 participant request; 7 medical reasons; 6 lost to follow‐up; 6 investigator withdrew

3 deceased; 15 non‐compliance with protocol; 19 participant request; 4 medical reasons; 6 lost to follow‐up; 2 investigators withdrew

Kluding 2013 (Kluding 2013)

2 lost to follow‐up; 23 discontinued intervention

1 lost to follow‐up; 9 discontinued intervention

Kottink 2007 (Kottink 2007; Kottink 2008; Kottink 2010; Kottink 2012)

1 technical defect in the epineural electrode

1 psychological issues not related to the study

Sheffler 2013a (Sheffler 2013a)

6 non‐medical reasons; 1 medical reason

  • 12‐week follow‐up: 2 non‐medical reasons

  • 24‐week follow‐up: 4 non‐medical reasons, 1 medical reason

2 non‐medical reasons; 3 medical reasons

  • 12‐week follow‐up: 1 non‐medical reason

  • 24‐week follow‐up: 3 non‐medical reasons, 1 medical reason

*Bethoux 2014 (six‐month assessment) corresponds to the first report of Bethoux 2014 study whose assessment was made after six months of motor neuroprosthesis use.
**Bethoux 2014 (12‐month assessment) corresponds to the second report of Bethoux 2014 study whose assessment was made after 12 months of motor neuroprosthesis use.

Figuras y tablas -
Table 3. Dropouts
Table 4. Sensitivity analysis excluding studies from the analysis that were at high risk of bias for blinding of outcome assessors

Outcome

Study ID (report)

Analysis results

Activities involving limbs: walking speed until 6 months of device use

Sheffler 2013a

MD −0.07, 95% CI −0.16 to 0.02; P = 0.13; participants = 110; I2 = 0%

Activities involving limbs: walking speed between 6 and 12 months of device use

Kluding 2013; Kottink 2007

MD 0.04, 95% CI −0.09 to 0.16; P = 0.57; participants = 218; I2 = 52%

Activities involving limbs: TUG

Kluding 2013

MD 0.88, 95% CI −6.36 to 8.12; P = 0.81; participants = 197; I2 = 0%

Activities involving limbs: mEFAP

Sheffler 2013a

MD 14.45, 95% CI −13.97 to 42.87; P = 0.32; participants = 110; I2 = 0%

Participation scale of HRQoL

Kottink 2007; Sheffler 2013a

SMD 0.60, 95% CI −0.39 to 1.59; P = 0.24; participants = 137; I2 = 79%

Exercise capacity: 6MWT

Kluding 2013

MD −8.39, 95% CI −38.01 to 21.23; P = 0.58; participants = 197; I2 = 0%

Balance: BBS

Kluding 2013

MD −1.50, 95% CI −4.38 to 1.38; P = 0.31; participants = 197; I2 = 0%

6MWT: 6‐minute walk test
BBS: Berg Balance Scale
CI: confidence interval
HRQoL: health‐related quality of life
MD: mean difference
mEFAP: modified Emory Functional Ambulation Profile
SMD: standardized mean difference
TUG: Timed Up and Go test

Figuras y tablas -
Table 4. Sensitivity analysis excluding studies from the analysis that were at high risk of bias for blinding of outcome assessors
Comparison 1. Motor neuroprosthesis versus another assistive technology device

Outcome or subgroup title

No. of studies

No. of participants

Statistical method

Effect size

1 Activities involving limbs: walking speed until 6 months of device use Show forest plot

2

605

Mean Difference (IV, Random, 95% CI)

‐0.05 [‐0.10, ‐0.00]

2 Activities involving limbs: walking speed between 6 and 12 months of device use Show forest plot

3

713

Mean Difference (IV, Random, 95% CI)

0.00 [‐0.05, 0.05]

3 Activities involving limbs: walking speed Show forest plot

4

823

Mean Difference (IV, Random, 95% CI)

‐0.01 [‐0.06, 0.04]

3.1 Surface MN

3

802

Mean Difference (IV, Random, 95% CI)

‐0.02 [‐0.06, 0.02]

3.2 Implantable MN

1

21

Mean Difference (IV, Random, 95% CI)

0.12 [‐0.04, 0.28]

4 Activities involving limbs: TUG Show forest plot

2

692

Mean Difference (IV, Random, 95% CI)

0.51 [‐4.41, 5.43]

5 Activities involving limbs: mEFAP Show forest plot

2

605

Mean Difference (IV, Random, 95% CI)

14.77 [‐12.52, 42.06]

6 Participation scale of HRQoL Show forest plot

3

632

Std. Mean Difference (IV, Random, 95% CI)

0.26 [‐0.22, 0.74]

7 Exercise capacity: 6MWT Show forest plot

2

692

Mean Difference (IV, Random, 95% CI)

‐9.03 [‐26.87, 8.81]

8 Balance: BBS Show forest plot

2

692

Mean Difference (IV, Random, 95% CI)

‐0.34 [‐1.96, 1.28]

9 Adverse events: number of dropouts during the intervention period Show forest plot

4

829

Risk Ratio (M‐H, Random, 95% CI)

1.48 [1.11, 1.97]

10 Adverse events: serious adverse events related to intervention/during the intervention period Show forest plot

2

692

Risk Ratio (M‐H, Random, 95% CI)

0.35 [0.04, 3.33]

11 Adverse events: falls Show forest plot

3

802

Risk Ratio (M‐H, Random, 95% CI)

1.20 [0.92, 1.55]

Figuras y tablas -
Comparison 1. Motor neuroprosthesis versus another assistive technology device