Efectos de la ingesta total de grasas sobre el peso corporal en niños
Referencias
References to studies included in this review
References to studies excluded from this review
References to studies awaiting assessment
Additional references
References to other published versions of this review
Characteristics of studies
Characteristics of included studies [ordered by study ID]
| Methods | Study design: prospective cohort study. Analysis method for cohort: cluster analysis used to classify children into groups (constant, low‐, medium‐ and high‐fat intake). Non‐parametric Kruskal‐Wallis 1‐way ANOVA used to test differences in SDS‐BMI between groups. How were missing data handled? 55% (274/502) not included in analyses as they had smaller number of DRs due to study abandonment or omitting DRs from study protocol. Baseline characteristics of those excluded not compared to those included in analyses. Number of study contacts: mean (SD) = 12.4 (1.8); median = 12, min = 10, max = 17. Period of follow‐up (total period of observation): 17 years. Periods of recruitment: 1985‐2002. Sample size justification adequately described? No. Sampling method: convenient sampling. Mothers recruited in city of Dortmund and surrounding communities via paediatric practices or personal contacts. Cohorts of about 40‐50 healthy infants enrolled yearly. Study objective: to examine fat intake and other nutrient and food intake of participants with at least 10 dietary measurements from age of 2 up to 18 years. Study population: German children and adolescents aged 2‐18 years. | |
| Participants | Baseline characteristics (reported for 2 groups and overall group) Overall (n = 228)
LF intake group (n = 55)
HF intake group (n = 57)
Included criteria: healthy born German children and adolescents participating in the DONALD study, who could provide at least 10 DRs between 2 and 18 years if age within 17 years' follow‐up. The infants had parents with sufficient German language ability and indicated their willingness to participate in a long‐term study. Excluded criteria: NR. Brief description of participants: children and adolescents aged 2‐18 years who were healthy born and had at least 1 parent with sufficient knowledge of the German language. Total number completed in cohort study: 228 (114 boys, 114 girls). Total number enrolled in cohort study: 502. | |
| Interventions | Description of exposure for cohorts
See Table 6; Table 7; Table 8; Table 9; Table 10; Table 11; Table 12; Table 13; Table 14; Table 15 for details of total fat intake exposure per outcome. | |
| Outcomes | BMI
| |
| Identification | Sponsorship source: Ministry of Education, Science and Research North‐Rhine‐Westphalia, Germany, and German Federal Ministry of Consumer Protection, Food and Agriculture. Country: Germany. Setting: city of Dortmund and surrounding communities. Comments: NA. Author's name: U Alexy. Institution: Research Institute of Child Nutrition (FKE), Heinstueck 11, D‐44225 Dortmund, Germany. Email: alexy@fke‐do.de. Declaration of interests: no. Study ID: Alexy 2004. Type of record: journal article. | |
| Notes | ||
| Risk of bias | ||
| Bias | Authors' judgement | Support for judgement |
| Were adequate outcome data for cohorts available? | Low risk | Analyses included children with ≥ 10 DRs aged 2‐18 years (45% (228/502) aged > 17 years). Characteristics of children excluded from analyses NR. |
| Was there matching of less‐exposed and more‐exposed participants for prognostic factors associated with outcome or were relevant statistical adjustments done? | High risk | No matching reported. No adjustment for parental BMI, physical activity, pubertal stage, SES, e.g. family income. |
| Did the exposures between groups differ in components other than only total fat? | Low risk | |
| Can we be confident in the assessment of outcomes? | Unclear risk | Inadequate description of anthropometric measurement methods. |
| Can we be confident in the assessment of exposure? | Low risk | Usual dietary habit assessed using 3‐consecutive‐day weighed DR, which was repeated yearly. |
| Can we be confident in the assessment of presence or absence of prognostic factors? | Low risk | Physical activity, parental BMI not assessed. |
| Was selection of less‐exposed and more‐exposed groups from the same population? | Low risk | Children selected for same cohort. |
| Methods | Study design: prospective cohort study. Analyses for cohorts: cohort analysis: mean nutrient intakes across increasing quintiles of DP1a, DP1b and DP2 z‐scores estimated by using linear regression. Then, GEEs applied to investigate longitudinal associations between DP z‐scores and fat mass index (FMI) z‐scores. These models regressed FMI on DP z‐score at the previous time point by using DP z‐scores at 7, 10, and 13 years of age and FMI z‐scores at 11, 13 and 15 years of age. Models adjusted for time‐varying covariates (i.e. age, dietary misreporting, physical activity, Tanner stage) and fixed covariates (sex, maternal social class). CIF subsample analysis: linear regression used to model DP1a and DP2 z‐score at ages 5 and 7 years on FM (kg) at age 9 years. How were missing data handled? Cohort: lost to follow‐up at 7 years (6404/14,536, 44%); at 11 years (7542/14,536, 52%); at 13 years (8554/14,536, 59%) and at 15 years (9192/14,536, 63%). Study website contained details of all participants; reasons for attrition not provided by authors. Data analysis included all available data for the different time points. CIF subsample: complete data on diet and BC available for 521 (36%) children at ages 5 and 9 years and 682 (48%) children at ages 7 years and 9 years. Effect of missing data assessed (no data reported). Number of study contacts: 7 (at age 5, 7, 9, 10, 11, 13 and 15 years). Period of follow‐up (total period of observation): 4 years (CIF subsample from 5 to 9 years); 8 years (whole cohort from 7 to 15 years). Periods of recruitment: 1 April 1991 and 31 December 1992. Sample size justification adequately described? Yes. For a normally distributed quantitative trait (e.g. weight), a sample of 10,000 would be 80% certain to be able to show a difference of 0.19 SD as statistically significant if just 2% of the population had relevant exposure, whereas for a population of 1000, there would be sufficient power to demonstrate a difference of 0.62 SD (Golding 2001) Sampling method: convenience sample. Birth cohort that recruited pregnant women in Avon, UK. Of the 14,472 birth outcomes, 14,062 were live births and 13,988 were alive at 1 year. An additional 713 children whose mothers were initially invited but had not enrolled were recruited later. Total baseline cohort therefore included 14,701 children who were alive at 1 year. Of these, 8297 children attended clinics at age of 7 years. CIF sample: random subsample of 1432 children selected from births in the cohort that occurred in last 6 months of recruitment. Study objective: objective 1 (CIF subsample): to identify a DP that explained DED, FD and % energy from fat and analyse its association with fatness in children aged 5‐9 years. Objective 2 (whole cohort): to examine longitudinal relationships between a DP characterised by DED, % energy from fat and FD and FM in children aged 7‐15 years. Objective 3: to identify DPs characterised by high‐sugar content, HF content, or both, and their longitudinal associations with adiposity in children aged 7‐15 years. Study population: children and adolescents aged 5‐15 years in Avon, UK. | |
| Participants | Baseline characteristics (reported for 2 groups: overall cohort and subsample of cohort) Overall cohort
CIF subsample (n = 521)
Included criteria: for cohort analysis, participants of ALSPAC cohort with follow‐up data at ages 7‐15 years were included. For analysis of CIF sample, eligible participants had available data on diet and BC at ages 5, 7 and 9 years. Excluded criteria: NR. Brief description of participants: aged 5‐15 years in ALSPAC cohort, Avon, UK. Total number completed in cohort study: 4729 (at 15 years). Total number enrolled in cohort study: 7285 at age 7 years (CIF subsample: 790 at age 3.6 years). | |
| Interventions | Description of exposure for cohorts Overall cohort
CIF subsample
See Table 6; Table 7; Table 8; Table 9; Table 10; Table 11; Table 12; Table 13; Table 14; Table 15 for details of total fat intake exposure per outcome. | |
| Outcomes | Body fat
Height
| |
| Identification | Sponsorship source: UK Medical Research Council, Wellcome Trust and the University of Bristol. Country: UK. Setting: community. Comments: ALSPAC. Author's name: Gina L Ambrosini. Institution: School of Population Health, The University of Western Australia, Perth, Australia; Medical Research Council Human Nutrition Research, Cambridge, UK. Email: [email protected]. Declaration of interests: Yes. "no conflicts of interest." Study ID: Ambrosini 2016. Type of record: journal article. | |
| Notes | ||
| Risk of bias | ||
| Bias | Authors' judgement | Support for judgement |
| Were adequate outcome data for cohorts available? | Unclear risk | Attrition relevant to eligible analyses for FMI was 35% (2556/7285) over 8 years. For eligible analyses for BMI and height in CIF subsample, attrition over 1.5 years was 11% (84/790), and over 4 years for body fat was 7.3% (38/521). Authors reported that children who attended clinics for follow‐up were more likely to come from more affluent or better‐educated families than were children who did not attend clinics (data NR), and that there were no significant differences in dietary and anthropometric variables between children with complete data compared to those who did not (data NR). |
| Was there matching of less‐exposed and more‐exposed participants for prognostic factors associated with outcome or were relevant statistical adjustments done? | Low risk | Most prognostic variables adjusted for. Parental BMI not assessed during study period. Data analysis of CIF subsample adjusted for prepregnancy maternal BMI and overweight status. |
| Did the exposures between groups differ in components other than only total fat? | Unclear risk | NR. |
| Can we be confident in the assessment of outcomes? | Low risk | Standard methods used for measurement of weight, height and body fatness (DEXA). |
| Can we be confident in the assessment of exposure? | Low risk | Repeated 3‐day food diaries (non‐consecutive days) completed by parent or child, with parental assistance. Authors assessed dietary misreporting of energy intake. |
| Can we be confident in the assessment of presence or absence of prognostic factors? | Low risk | Repeated measurements of total physical activity performed using accelerometer. Mean time spent by children watching TV reported by parents at 4.5 years. Pubertal status self‐reported at 11 and 13 years (using validated diagrams). Parental socioeconomic information and prepregnancy heights and weights were self‐reported. |
| Was selection of less‐exposed and more‐exposed groups from the same population? | Low risk | All participants of the ALSPAC. |
| Methods | Study design: prospective cohort study. Analysis methods for cohorts: prospective associations between DP z‐scores and cardiometabolic risk factors at 14 and 17 years of age analysed using GEE with an exchangeable correlation structure. Beta coefficients resulting from the regression models for these biomarkers were back‐transformed for interpretation. Logarithmic transformation was applied to insulin, HOMA and TG measurements as they were not normally distributed. How were missing data handled? Out of 2337 adolescents eligible at 14 years, 1857 (79.5%) responded to FFQs and 1286 (55%) attended physical assessments. Number of study contacts: 2 (at 14 and 17 years). Period of follow‐up (total period of observation): 3 years. Periods of recruitment: 1989‐1991 (mothers of participants were recruited). Sample size justification adequately described? No. Sampling method: convenience sample. Present analysis uses data collected at 14 (n = 1857) and 17 (n = 1709) years' follow‐up from Raine cohort study. Original cohort comprised 2900 pregnant women recruited into a trial at King Edward Memorial Hospital (Perth, Western Australia) from 1989 to 1991. At 14 years, 2337 adolescents were eligible for follow‐up. Study objective: to examine associations between an "energy‐dense, high‐fat and low fibre" DP and cardiometabolic risk factors, and the tracking of this DP in adolescence. Study population: Australian adolescents aged 14‐17 years. | |
| Participants | Baseline characteristics (reported for 1 overall group)
Included criteria: adolescents who participated in the Raine cohort study and had complete dietary and cardiometabolic data at 14 and 17 years. Excluded criteria: NR. Brief description of the participants: adolescents aged 14‐17 years participating in Raine cohort study. Total number completed in cohort study: 1709 (1009 completed FFQ). Total number enrolled in cohort study: 2337. | |
| Interventions | Description of exposure for cohorts
See Table 6; Table 7; Table 8; Table 9; Table 10; Table 11; Table 12; Table 13; Table 14; Table 15 for details of total fat intake exposure per outcome. | |
| Outcomes | BMI
WC
LDL‐C
HDL‐C
TGs
| |
| Identification | Sponsorship source: Medical Research Council (grant number U105960389) and research grants from the National Health and Medical Research Council of Australia (ID#1022134 (2012‐2014)) and the National Heart Foundation of Australia and Beyond Blue Cardiovascular Disease (grant number G 08P 4036) and Depression Strategic Research Program. Country: Australia. Setting: community in Perth. Comments: Western Australian Pregnancy (Raine) Cohort Study. Author's name: G Appannah. Institution: Department of Nutrition and Dietetics, Faculty of Medicine and Health Sciences, Universiti Putra Malaysia, Serdang, Malaysia; Medical Research Council Human Nutrition Research, Cambridge, UK. Email: [email protected] Declaration of interests: yes. "Authors have no conflicts of interest to declare." Study ID: Appannah 2015. Type of record: journal article. | |
| Notes | ||
| Risk of bias | ||
| Bias | Authors' judgement | Support for judgement |
| Were adequate outcome data for cohorts available? | High risk | High lost to follow‐up rate (35‐40% at 14 and 17 years). Authors did not report any comparative analyses between participants lost to follow‐up and participants who completed study. |
| Was there matching of less‐exposed and more‐exposed participants for prognostic factors associated with outcome or were relevant statistical adjustments done? | Low risk | Study included mainly white participants, upper income families, stratified for gender. Adjusted for age, dietary misreporting, physical fitness, smoking and BMI‐for‐age z‐score. Not adjusted for parental BMI. |
| Did the exposures between groups differ in components other than only total fat? | Unclear risk | NR. |
| Can we be confident in the assessment of outcomes? | Low risk | Standard methods performed for measurement of weight, height, WC and fasting blood samples. |
| Can we be confident in the assessment of exposure? | Low risk | Repeated assessment using a validated semi‐quantitative FFQ. |
| Can we be confident in the assessment of presence or absence of prognostic factors? | Low risk | Physical fitness assessed at each session, using validated test (PWC‐170) which was correlated with self‐reported physical activity. |
| Was selection of less‐exposed and more‐exposed groups from the same population? | Low risk | Mothers of participants selected for 1 cohort. |
| Methods | Study design: prospective cohort study. Analysis methods for cohorts: linear regression models used to estimate effects of diet and physical activity on annual changes in adiposity with 1‐year change in BMI and weight as the continuous variables. Models adjusted for ethnicity, baseline BMI, annual change in height, menstrual history in girls, pubertal stage and age. How were missing data handled? Number of children who did not return at 1‐year follow‐up (22.8%, 3819/16771) and 3‐year follow‐up (23.5%, 3942/16771). Data on BMI, dietary intake and physical activity compared between children who did not return the questionnaires and children who did. Authors indicated that there did not seem to be bias related to dietary intake or adiposity, but children lost to follow‐up were older and more physically active. Number of study contacts: 2 (baseline, 1 year' follow‐up, Berkey 2000); 4 (baseline, 1, 2 and 3 years' follow‐up, Berkey 2005). Period of follow‐up (total period of observation): 1 year (Berkey 2000); 3 years (Berkey 2005). Period of recruitment: 1996. Sample size justification adequately described? No. Sampling method: convenience sample. Participants were children of mothers who were nurses and participated in Nurses' Health Study II. Letters sent to mothers explaining goals of new study and requesting their consents. Study objective: to examine role of physical activity, inactivity and DPs on annual weight changes among preadolescents and adolescents, taking growth and development into account. Study population: preadolescents and adolescents aged 9‐14 years in the USA. | |
| Participants | Baseline characteristics (reported for 1 overall group)
Included criteria: children aged in 9‐14 years of Nurses' Health Study II participants with completed questionnaires at baseline. Excluded criteria: children with misreporting data of dietary intake (500 kcal/day or > 5000 kcal/day), physical activity (> 40 hours/week), screen time (> 80 hours/week), height (> 3 SD), BMI (12 kg/m2 or > 3 SD). Brief description of participants: children aged 9‐14 years residing in 50 states of the USA whose mothers were nurses and participated in the Nurses' Health Study II. Total numbers completed in cohort study: 10,769 included in the data analysis out of 12,952 children who returned after 1 year' follow‐up). Number of children included in data analysis at 3 years NR, although 12,829 children returned after 3 years' follow‐up. Total numbers enrolled in cohort study: 16,771. Eligible sample consisted of 26,765 children (of 18,526 mothers in Nurses' Health Study II). | |
| Interventions | Description of exposure for cohorts
See Table 6; Table 7; Table 8; Table 9; Table 10; Table 11; Table 12; Table 13; Table 14; Table 15 for details of total fat intake exposure per outcome. | |
| Outcomes | Weight
BMI
| |
| Identification | Sponsorship source: grant DK46834 from the National Institutes of Health and, in part, by Kellogg's. Country: USA. Setting: communities in 50 states. Comments: The Growing Up Today Study. Author's name: Catherine S Berky. Institution: Channing Laboratory, Department of Medicine, Brigham Women's Hospital and Harvard Medical School. Email: [email protected]. Declaration of interests: no. Study ID: Berkey 2000. Type of record: journal article. | |
| Notes | We contacted the authors to request relevant numerical outcome data, since they only reported the following sentence about total fat intake and weight in the text: ".... and no fat (dairy, vegetable, or other) intake was significantly associated with weight gain after energy adjustment, nor was total fat intake." We had not received a response by time of publication. | |
| Risk of bias | ||
| Bias | Authors' judgement | Support for judgement |
| Were adequate outcome data for cohorts available? | High risk | High attrition (35.8% (6002/16771) over 1 year). Data on BMI, dietary intake and physical activity compared between children who did not return the questionnaires and children who did. The authors indicated that there did not seem to be bias related to dietary intake or adiposity, but children lost to follow‐up were older and more physically active. |
| Was there matching of less‐exposed and more‐exposed participants for prognostic factors associated with outcome or were relevant statistical adjustments done? | Low risk | Data analyses adjusted for age, gender, ethnicity, pubertal stage while physical activity and total energy intake were included in the model. Parental BMI and SES not adjusted for. Likely that children had similar family income level as their mothers were nurses. |
| Did the exposures between groups differ in components other than only total fat? | Low risk | |
| Can we be confident in the assessment of outcomes? | High risk | Height and weight were self‐reported although specific instructions on how to measure height and weight were given to participants. |
| Can we be confident in the assessment of exposure? | Low risk | Repeated self‐administered, semi‐quantitative FFQs used to assess dietary intake. Participants with dietary misreporting were excluded from data analyses. |
| Can we be confident in the assessment of presence or absence of prognostic factors? | Low risk | Repeated assessments of physical activity, screening time and pubertal stage conducted using validated questionnaires. |
| Was selection of less‐exposed and more‐exposed groups from the same population? | Low risk | Participants selected for 1 cohort study. |
| Methods | Study design: prospective cohort study. Analyses methods for cohorts: multiple regression analyses used to test relation between variables, and partial correlations used to adjust for confounding variables. How were missing data handled? Attrition at 1 year: 31% (reasons not stated). No significant differences in baseline variables observed between children who attended for follow‐up and children who did not. Number of study contacts: 3 (baseline, 6 and 12 months). Period of follow‐up (total period of observation): 1 year. Periods of recruitment: NR. Sample size justification adequately described? No. Sampling method: convenience. Recruitment was done through local advertising. Study objective: to identify, prospectively, whether simply measured indicators of energy intake and expenditure might predict excessive weight gain over time in a cohort of prepubescent children. Study population: prepubertal children aged 6‐9 years in Australia. | |
| Participants | Baseline characteristics (reported for 1 overall group)
Included criteria: children aged 6‐9 years, who had ≥ 1 biological parent agreeable to participate and the family commitment to continued follow‐up for ≥ 12 months. Excluded criteria: NR. Pretreatment: NA. Brief description of participants: children aged 6‐9 years living in New South Wales, Australia. Total number completed in cohort study: at 12 months: 41 (69%). An attempt was made to follow‐up each participant at each 6‐month interval by letter and telephone. Total number enrolled in cohort study: 59 children (41 mothers, 29 fathers). | |
| Interventions | Description of exposure for cohorts
See Table 6; Table 7; Table 8; Table 9; Table 10; Table 11; Table 12; Table 13; Table 14; Table 15 for details of total fat intake exposure per outcome. | |
| Outcomes | BMI
| |
| Identification | Sponsorship source: Australian Rotary Health Foundation, Financial Markets Foundation for Children, National Health and Medical Research Council. Country: Australia. Setting: University Teaching Hospital, Western Australia. Comments: NA. Author's name: N Bogaert. Institution: Department of Endocrinology, Royal Prince Alfred Hospital, Camperdown, NSW, Australia. Email: [email protected]. Declaration of Interests: no Study ID: Bogaert 2003. Type of record: journal article. | |
| Notes | We contacted the authors to request relevant numerical outcome data, since they only reported the following in the text: "We were unable to demonstrate a positive relation between dietary fat and BMI z‐score change…" We had not received a response by time of publication. | |
| Risk of bias | ||
| Bias | Authors' judgement | Support for judgement |
| Were adequate outcome data for cohorts available? | Unclear risk | Attrition at 1 year: 31% (reasons not stated). Authors reported no significant differences in baseline variables observed between children who attended for follow‐up and children who did not (variables were not specified). |
| Was there matching of less‐exposed and more‐exposed participants for prognostic factors associated with outcome or were relevant statistical adjustments done? | Unclear risk | Authors stated that partial correlations were used to adjust for confounding variables, but did not specify any variables. |
| Did the exposures between groups differ in components other than only total fat? | Low risk | |
| Can we be confident in the assessment of outcomes? | Low risk | Height and weight measured using standard techniques. BC determined after an overnight fast using BIA. |
| Can we be confident in the assessment of exposure? | High risk | Single assessment using a 3‐day DR. |
| Can we be confident in the assessment of presence or absence of prognostic factors? | High risk | Only single 3‐day activity record assessed. |
| Was selection of less‐exposed and more‐exposed groups from the same population? | Low risk | Participants recruited as part of 1 cohort study. Recruitment undertaken in local area through advertising. |
| Methods | Study design: prospective cohort study. Analysis methods for cohorts: GEE used to investigate the associations between biological CHD risk factors (BMI, sum of skinfolds, SBP, DBP and serum total cholesterol) and lifestyle predictor variables (habitual physical activity, smoking and dietary intake). How were missing data handled? Complete data sets available for 229 boys and 230 girls (89% follow‐up rate for both sexes). Of children lost to follow‐up, reasons were declined to participate (17%), illness (46%), moving school in the interim (31%) or for other reasons (6%). Number of study contacts: 2 (12 and 15 years). Period of follow‐up (total period of observation): 3 years. Periods of recruitment: 1989‐1990. Sample size justification adequately described? Yes. Sample size calculation for the original cross‐sectional survey: target sample of 250 per age/gender group based on variability of pilot study results and represented a 2% random sample of each population group in Northern Ireland. Sampling method: stratified sample. School children selected from 16 schools in Northern Ireland. Within each school, children were randomly selected. Of all children recruited, overall response rate was 78% (1015 children; 506 boys and girls aged 15 years; 509 boys and girls aged 12 years). Study objective: to examine relationships between the longitudinal development of biological risk factors for CHD in tandem with the development of key risk behaviours in a representative adolescent population drawn from a region with a high prevalence of CHD risk. Study population: school children aged 12 years in Northern Ireland. | |
| Participants | Baseline characteristics (reported as 1 overall group)
Included criteria: children aged 12 years attending selected schools in Northern Ireland. Excluded criteria: NR. Brief description of participants: children aged 12 years attending post‐primary education in Northern Ireland. Total number completed in cohort study: 459. Total number enrolled in cohort study: 509 (12‐year old children). | |
| Interventions | Description of exposure for cohorts
See Table 6; Table 7; Table 8; Table 9; Table 10; Table 11; Table 12; Table 13; Table 14; Table 15 for details of total fat intake exposure per outcome. | |
| Outcomes | HDL‐C
| |
| Identification | Sponsorship source: Northern Ireland Chest, Heart and Stroke Association, British Heart Foundation, Wellcome Trust. Country: Northern Ireland. Setting: post‐primary schools. Comments: Northern Ireland Young Hearts Project. Author's name: C Boreham. Institution: University of Ulster, Jordanstown. Email: NR. Declaration of interests: no. Study ID: Boreham 1999. Type of record: journal article. | |
| Notes | ||
| Risk of bias | ||
| Bias | Authors' judgement | Support for judgement |
| Were adequate outcome data for cohorts available? | Low risk | Complete data sets available for 229 boys and 230 girls (89% follow‐up rate for both sexes). Of those lost to follow‐up, reasons were: declined to participate (17%); illness (46%), moving school in the interim (31%) or for other reasons (6%). |
| Was there matching of less‐exposed and more‐exposed participants for prognostic factors associated with outcome or were relevant statistical adjustments done? | Low risk | Adjusted for physical activity, pubertal stage, SES but not for parental BMI or ethnicity. Regression analysis stratified for gender. |
| Did the exposures between groups differ in components other than only total fat? | Low risk | |
| Can we be confident in the assessment of outcomes? | Unclear risk | Unclear how many skinfold measurements were performed and who performed these. No details provided by authors regarding weight and height measurements. |
| Can we be confident in the assessment of exposure? | Low risk | Repeated assessment of dietary intake. Analysis adjusted for misreporting. |
| Can we be confident in the assessment of presence or absence of prognostic factors? | Low risk | Repeated assessment of physical activity by a 7‐day recall questionnaire. Sexual maturation assessed according to Tanner stage. |
| Was selection of less‐exposed and more‐exposed groups from the same population? | Low risk | All children were participants of the Northern Ireland Young Hearts cohort study. |
| Methods | Study design: prospective cohort study. Analyses methods for cohorts: regression analysis in boys and girls related fat intake to a change in BMI‐for‐age z‐score after 3 and 6 years' follow‐up. Adjusted model after 3 years' follow‐up was adjusted for baseline z‐score, physical activity level, pubertal stage at baseline, energy intake and dietary volume. Adjusted model at 6 years' follow‐up also included parent's income level, inactivity and number of overweight parents. How were missing data handled? At 3 years' follow‐up: participants with missing information on any measurement at baseline (n = 41) and incomplete follow‐up (attrition 25.5%; 150/589) excluded from analyses. Dropout analysis revealed baseline characteristics of anthropometrics and dietary information did not differ between participants (n = 308) that did and participants who did not complete follow‐up (all P > 0.05; data not shown). At 6 years' follow‐up: 384 children were re‐examined (attrition 34.8%; 205/589). Possible dropout effects examined indirectly by comparing baseline age, BMI and fat intake of those children participating only at baseline with children participating at both baseline and follow‐up, which showed no difference between groups (no data or statistical tests reported by authors). According to ethical considerations, it was not permitted to contact children who decided not to participate at follow‐up. Sample size justification adequately described? No. Sampling method: state schools in Odense (Denmark) stratified according to school type, location and SES profile. From each stratum, a proportional, 2‐stage sample of children was randomly selected. From the selected schools, 1356 pupils were invited, and 1020 (75.2%) (589 3rd graders and 421 ninth graders) agreed to participate. Periods of recruitment: 1997‐1998. Period of follow‐up (total period of observation): 6 years. Number of study contacts: 3 (baseline, 3 and 6 years). Study objective: objective 1: to examine associations between DED or fibre intake and 3‐year change in BMI‐for‐age z‐score among 8‐ to 10‐year old boys and girls. Objective 2: to investigate the association between fat intake and weight development among a cohort of children aged 9‐10 years at baseline and 15‐16 years at follow‐up, and whether parents' obesity was modifying the association. Study population: children aged 9‐10 years attending schools in Odense, Denmark. | |
| Participants | Baseline characteristics (reported for 1 overall group)
Included criteria: 9‐ to 10‐year‐old boys and girls attending 3rd grade at selected schools in Odense, Denmark. Excluded criteria: NR. Total number enrolled in cohort study: 589. Total number completed in cohort study: 398 (after 3 years); 384 (after 6 years). Brief description of participants: 9‐ to 10‐year‐old children attending 3rd grade at schools in Odense, Denmark, who participated in the European Youth Heart Study. | |
| Interventions | Description of exposure for cohorts
See Table 6; Table 7; Table 8; Table 9; Table 10; Table 11; Table 12; Table 13; Table 14; Table 15 for details of total fat intake exposure per outcome. | |
| Outcomes | BMI
| |
| Identification | Sponsorship source: NR. Country: Denmark. Setting: schools in Odense. Comments: Danish component of the European Youth Heart Study. Author's name: Carina S Brixval. Institution: Research Unit for Dietary Studies, Institute of Preventive Medicine, Copenhagen, Denmark. Email: [email protected]; [email protected]. Declaration of Interests: yes. "The authors declared no conflict of interest." Study ID: Brixval 2009. Type of record: journal article. | |
| Notes | ||
| Risk of bias | ||
| Bias | Authors' judgement | Support for judgement |
| Were adequate outcome data for cohorts available? | Low risk | Participants with missing information on any measurement at baseline (n = 41) and incomplete follow‐up (attrition 25.5% (150/589) over 3 years) excluded from analyses. Dropout analysis revealed that baseline characteristics of anthropometrics and dietary information did not differ between participants (n = 308) who did and who did not complete the follow‐up (all P > 0.05). At 6 years' follow‐up, 384 children were re‐examined (attrition 34.8% (205/589)). Possible dropout effects examined indirectly by comparing baseline age, BMI and fat intake of those children participating only at baseline with children participating at both baseline and follow‐up, which showed no difference between groups (no data or statistical tests reported by authors). According to ethical considerations, it was not permitted to contact children who decided not to participate at follow‐up. |
| Was there matching of less‐exposed and more‐exposed participants for prognostic factors associated with outcome or were relevant statistical adjustments done? | Low risk | Regression model adjusted for most important prognostic variables. |
| Did the exposures between groups differ in components other than only total fat? | Low risk | |
| Can we be confident in the assessment of outcomes? | Low risk | Height (cm) measured to the nearest 0.1 cm with stadiometer. bodyweight (kg) measured to nearest 0.1 kg with calibrated beam‐scale weight. Participants wore underwear or light garments only. |
| Can we be confident in the assessment of exposure? | High risk | A single 24‐hour dietary recall was performed at baseline. Although it was validated by an estimated food record (completed by parents for the same 24‐hour period) it was not repeated during follow‐up and therefore not likely to reflect the habitual fat intake of children during the study period. |
| Can we be confident in the assessment of presence or absence of prognostic factors? | High risk | Parental BMIs calculated from self‐reported weights and heights. Presence or absence of regular physical exercise assessed at baseline by self‐report. Children's activity level at baseline measured using accelerometers; however, this variable contained significant missing data (33%). Unclear whether pubertal stage of children was based on an assessment or on self‐report. |
| Was selection of less‐exposed and more‐exposed groups from the same population? | Low risk | All participants of the European Youth Heart Study in Denmark. |
| Methods | Study design: prospective cohort study. Analyses for cohorts: analyses conducted on subsample of 798 children who gained weight after 1 year. Predictors of weight gain were individually examined using GEE. To account for correlated data within families, a family identification number was used as the cluster variable. Preliminary graphical analysis indicated that weight gain increased non‐linearly with age; thus, a quadratic term was needed. To address potential confounding between BMI status and predictors of weight gain, GEE analyses were repeated and adjusted for BMI status, age, age squared, sex and Tanner stage. How were missing data handled? Lost to follow‐up at 1 year: 14.6% (151/1030) (reasons not stated). Number of study contacts: 3 (2 baseline visits, at 1 year' follow‐up). Period of follow‐up (total period of observation): 1 year. Periods of recruitment: November 2000 to August 2004. Sample size justification adequately described? No. Sampling method: convenience sample. Recruitment conducted through local TV and radio stations and community outreach efforts. Each family was selected from an overweight proband aged 4‐19 years using bivariate ascertainment scheme (i.e. overweight ≥ 95th percentile for BMI and ≥ 85th percentile for FM). In addition, families were required to have ≥ 3 children aged 4‐19 years. Study objective: to test putative sociodemographic, metabolic and behavioural predictors of weight gain: familial characteristics, birth information, child acculturation, dietary intake, eating behaviour, physical activity, energy expenditure and fasting blood biochemistries, while controlling for sex, age and sexual maturation. Study population: children aged 4‐19 years in Hispanic community. | |
| Participants | Baseline characteristics (reported for 1 overall group)
Included criteria: Hispanic families with ≥ 3 children aged 4‐19 year and ≥ 1 overweight child aged 4‐19 year (overweight was defined as BMI ≥ 95th percentile and FM > 85th percentile). Excluded criteria: NR. Brief description of participants: Hispanic children aged 4‐19 years in the Viva la Familia Study enrolling families with ≥ 1 overweight child. Total number completed in cohort study: 879 (analyses conducted on 798 children). Total number enrolled in cohort study: 1030. | |
| Interventions | Description of exposure for cohorts
See Table 6; Table 7; Table 8; Table 9; Table 10; Table 11; Table 12; Table 13; Table 14; Table 15 for details of total fat intake exposure per outcome. | |
| Outcomes | Weight
| |
| Identification | Sponsorship source: National Institutes of Health (NIH), US Department of Agriculture. Country: USA. Setting: Hispanic communities, Houston, TX. Comments: Viva la Familia Study. Author's name: Nancy F Butte. Institution: US Department of Agriculture, Agricultural Research Service Children’s Nutrition Research Center, Department of Pediatrics, Baylor College of Medicine, Houston, TX, USA. Email: [email protected]. Declaration of interests: yes. "None of the authors had a financial conflict of interest in relation to this study." Study ID: Butte 2007. Type of record: journal article. | |
| Notes | ||
| Risk of bias | ||
| Bias | Authors' judgement | Support for judgement |
| Were adequate outcome data for cohorts available? | High risk | Attrition at 1 year: 14.6% (151/1030). |
| Was there matching of less‐exposed and more‐exposed participants for prognostic factors associated with outcome or were relevant statistical adjustments done? | Low risk | The model using dietary fat intake to predict weight gain did not adjust for parental BMI, physical activity, family income or parental education. However, there was no association between physical activity, family income and parental education and weight gain after adjustment for gender, age, pubertal stage and baseline BMI of the child. |
| Did the exposures between groups differ in components other than only total fat? | Low risk | |
| Can we be confident in the assessment of outcomes? | Unclear risk | Insufficient description of outcome measurement methods. |
| Can we be confident in the assessment of exposure? | High risk | Dietary intake only assessed once, at baseline. |
| Can we be confident in the assessment of presence or absence of prognostic factors? | High risk | Single assessment of physical activity performed. Pubertal stage self‐reported. Unclear whether parental BMI was self‐reported or measured. |
| Was selection of less‐exposed and more‐exposed groups from the same population? | Low risk | All children were participants of the Viva la Familia Study. |
| Methods | Study design: prospective cohort study. Analyses methods for cohorts: linear regression with participant‐level random‐effects model used to examine whether physical activity, diet and environmental exposures were associated prospectively with changes in bodyweight and % body fat. Only variables that were significant were combined into a single multivariate model. How were missing data handled? Only the participants who had valid data for all 3 assessment periods were analysed (n = 265 (87%) compared to n = 303 who were enrolled). Number of study contacts: 3 (baseline in grade 8, 2 follow‐up visits in tenth/eleventh grade or eleventh/twelfth grade). Period of follow‐up (total period of observation): 5 years. Periods of recruitment: 2007, as the follow‐up across grades 10‐12 occurred during 2009‐2011. Sample size justification adequately described? No. Study authors also mentioned that a limitation in the study was the relative small sample size. Sampling method: random sample. Control participants of the TAAG cohort from 2 sites (San Diego, Minneapolis) used (532 eligible girls). For present analysis, 303 girls were randomly selected from 7 different high schools in these sites. Study objective: to study correlates of physical activity and nutrition behaviours and change in BMI percentile and body fat among adolescent girls. Study population: 13‐ to 18‐year‐old girls at high schools in San Diego and Minneapolis. | |
| Participants | Baseline characteristics (reported for 1 overall group)
Included criteria: 8th grade girls who were control participants enrolled in the TAAG study cohort from 2 sites. Excluded criteria: NR. Brief description of participants: school girls, in grade 8 across 7 high schools from 2 sites in the USA (San Diego and Minneapolis/St Paul). During study period, participants were aged 13‐18 years. Total number completed in cohort study: 265 (87%). Total number enrolled in cohort study: 303. | |
| Interventions | Description of exposure for cohorts
See Table 6; Table 7; Table 8; Table 9; Table 10; Table 11; Table 12; Table 13; Table 14; Table 15 for details of total fat intake exposure per outcome. | |
| Outcomes | BMI
Body fat
| |
| Identification | Sponsorship source: National Health, Lung and Blood Institute. Country: USA. Setting: high schools, San Diego and Minneapolis. Comments: NA. Author's name: Deborah A Cohen. Institution: RAND Corporation. Email: [email protected]. Declaration of interests: yes. "None of the authors have any financial relationships relevant to this article or other conflicts of interest to disclose." Study ID: Cohen 2014. Type of record: journal article. Trial ID: TAAG. | |
| Notes | ||
| Risk of bias | ||
| Bias | Authors' judgement | Support for judgement |
| Were adequate outcome data for cohorts available? | Low risk | Attrition low (13%; 38/303). Children with incomplete data did not differ from children with complete data in terms of ethnicity, mother's education and age (data NR). |
| Was there matching of less‐exposed and more‐exposed participants for prognostic factors associated with outcome or were relevant statistical adjustments done? | High risk | Data analysis did not adjust for pubertal stage, parental BMI and total energy intake at baseline. |
| Did the exposures between groups differ in components other than only total fat? | Low risk | |
| Can we be confident in the assessment of outcomes? | High risk | Methods used to measure body fat were inconsistent during the study (skinfold thickness measurements at baseline, BIA during follow‐up). |
| Can we be confident in the assessment of exposure? | High risk | No baseline dietary assessment. Unclear whether they received any training or assistance regarding the completion of the FFQ during follow‐up. |
| Can we be confident in the assessment of presence or absence of prognostic factors? | Low risk | Repeated measurements of physical activity data were performed (accelerometer data for 6 consecutive days). 16.8% of data imputed. Self‐report of variables such as age, ethnicity and mother's education was acceptable at this age. |
| Was selection of less‐exposed and more‐exposed groups from the same population? | Low risk | All control participants of the TAAG cohort. |
| Methods | Study design: prospective cohort study. Analyses methods for cohorts: hierarchical regression used. Predictor variables hypothesised to be most distal to girls' change in BMI (i.e. parent weight status) were entered 1st into model followed by predictors that were more proximal to girls' change in BMI (i.e. girls' physical activity and dietary intake). How were missing data handled? Only families with complete anthropometric data at both time points were used in analyses, resulting in (85.3%; 168/197). 12 families with outlying BMI values (i.e. > 3 SDs from the mean) were identified and removed from analyses. Characteristics of children with missing data NR. Number of study contacts: 2 (at baseline‐5 years and 2 years' follow‐up). Period of follow‐up (total period of observation): 2 years. Periods of recruitment: NR. Sample size justification adequately described? No. Sampling method: convenience sample. Families recruited using flyers and newspaper advertisements. In addition, families with age‐eligible girls within 5‐county radius received letters inviting them to participate and received follow‐up telephone calls. Study objective: to assess predictors of change in girls' BMI aged 5‐7 years and familial aggregation of risk factors associated with childhood overweight. Study population: 5‐year old white girls in Pennsylvania, USA. | |
| Participants | Baseline characteristics (reported for 1 overall group)
Included criteria: 5 years; living with both biological parents; absence of severe food allergies or chronic medical problems affecting food intake; absence of dietary restrictions involving animal products. Families were not recruited on weight status. Excluded criteria: NA. Brief description of participants: 5‐year old white girls from central Pennsylvania who were part of a longitudinal study of the health and development of young girls. Total number completed in cohort study: 192 girls (168 included in analysis). Total number enrolled in cohort study: 197 girls. | |
| Interventions | Description of exposure for cohorts
See Table 6; Table 7; Table 8; Table 9; Table 10; Table 11; Table 12; Table 13; Table 14; Table 15 for details of total fat intake exposure per outcome. | |
| Outcomes | BMI
| |
| Identification | Sponsorship source: National Institutes of Health. Country: USA. Setting: households, Pennsylvania. Comments: NA. Author's name: KK Davison. Institution: Pennsylvania State University. Email: [email protected]. Declaration of interests: no. Study ID: Davison 2001. Type of record: journal article. | |
| Notes | We contacted the authors as they did not report relevant regression coefficients in their regression models. We had not received a response by time of publication. | |
| Risk of bias | ||
| Bias | Authors' judgement | Support for judgement |
| Were adequate outcome data for cohorts available? | High risk | High attrition (15% (29/197) over 2 years). |
| Was there matching of less‐exposed and more‐exposed participants for prognostic factors associated with outcome or were relevant statistical adjustments done? | Low risk | Analyses adjusted for baseline BMI, physical activity, total energy intake of the child and BMI, education and income of parents (SES). |
| Did the exposures between groups differ in components other than only total fat? | Low risk | |
| Can we be confident in the assessment of outcomes? | Unclear risk | Assessment methods (weight, height) not adequately described. |
| Can we be confident in the assessment of exposure? | High risk | Single dietary assessment at baseline (3 × 24‐hour recalls over a 2‐ to 3‐week period during summer). |
| Can we be confident in the assessment of presence or absence of prognostic factors? | High risk | Methods used to assess physical activity of children at baseline and follow‐up were inconsistent. Only a single assessment of physical activity of parents performed at baseline. Assessment methods for parental weight and height not adequately described. |
| Was selection of less‐exposed and more‐exposed groups from the same population? | Low risk | Children selected for 1 cohort study. |
| Methods | Study design: prospective cohort study. Analyses methods for cohorts: repeated measures regression analysis with year as a factor and BMI in each year as dependent variable. Behaviours (TV viewing, sedentary behaviour, physical activity and diet variables), demographics (ethnicity and gender), BMI from the beginning of study and interaction terms for variables differing by year (TV viewing, physical activity, sedentary behaviour) included as independent variables. How were missing data handled? Lost to follow‐up at 3 years: 10.7% (16/149), additional information NR. Number of study contacts: 3 (1, 2 and 3 years). Period of follow‐up (total period of observation): 3 years. Period of recruitment: Between summers of 1986 and 1989. Sample size justification adequately described? No. Sampling method: convenience sample. Families recruited using various methods, including newspaper advertisements, fliers and word of mouth. No details provided regarding number of potentially eligible families. Study objective: to examine whether physical activity, TV viewing, other sedentary behaviours and dietary factors predict BMI among a triethnic cohort of 3‐ to 4‐year‐old children followed over 3‐year period. Study population: healthy 3‐ to 4‐year‐old children in the USA. | |
| Participants | Baseline characteristics (reported for 1 overall group)
Included criteria: 3‐ to 4‐year‐old children with their parents, with only 1 eligible child per family. Excluded criteria: NR. Brief description of participants: healthy 3‐ to 4‐year‐old Anglo‐American, African‐American and Hispanic children in the USA participating in a multicentre study on development of cardiovascular risk factors and associated behaviours. Total number completed in cohort study: 138 (only reported in table). Total number enrolled in cohort study: 149. | |
| Interventions | Description of exposure for cohorts
See Table 6; Table 7; Table 8; Table 9; Table 10; Table 11; Table 12; Table 13; Table 14; Table 15 for details of total fat intake exposure per outcome. | |
| Outcomes | BMI
| |
| Identification | Sponsorship source: National Heart Lung and Blood Institute, USDA. Country: USA. Setting: NR. Comments: Studies of Child Activity and Nutrition (SCAN) multicentre study. Author's name: R Jago. Institution: Children’s Nutrition Research Center, Department of Pediatrics, Baylor College of Medicine, Houston, TX, USA. Email: [email protected]. Declaration of interests: no. Study ID: Jago 2005. Type of record: journal article. | |
| Notes | We contacted the authors to request relevant regression data, since they stated the following in the text: "Dietary factors were not associated with BMI across the three study years." Authors replied that they no longer had the relevant data available. | |
| Risk of bias | ||
| Bias | Authors' judgement | Support for judgement |
| Were adequate outcome data for cohorts available? | Low risk | Lost to follow‐up at 3 years: 10.7% (16/149). |
| Was there matching of less‐exposed and more‐exposed participants for prognostic factors associated with outcome or were relevant statistical adjustments done? | High risk | No adjustment for total energy intake, parental BMI and SES. |
| Did the exposures between groups differ in components other than only total fat? | Low risk | |
| Can we be confident in the assessment of outcomes? | Low risk | Standardised measurements performed (height, weight). |
| Can we be confident in the assessment of exposure? | High risk | Although DRs were done during each study year by direct observation, method may have introduced bias in dietary behaviour of participants. |
| Can we be confident in the assessment of presence or absence of prognostic factors? | High risk | Although assessments of physical activity/inactivity were done during each study year by direct observation using validated methods, direct observation of participants may have introduced bias in their behaviour. |
| Was selection of less‐exposed and more‐exposed groups from the same population? | Low risk | All participants from 1 cohort study. |
| Methods | Study design: prospective cohort study. Analyses methods for cohorts: stepwise multiple regression analysis assessed whether baseline % energy from fat, change from baseline to 1 year, 1 year to 2 years, or baseline to 2 years (along with other variables) predicted change in BMI over 2 years. How were missing data handled? Missing data at baseline: 2 fathers were unavailable for baseline assessments (due to multiple scheduling conflicts), 6 families had some missing measures (no reasons given). Lost to follow‐up at 1 year: 35 families were unavailable after 1 year (20.8%); lost to follow‐up at 2 years: 57 (28.1%). Preliminary analyses investigated whether differences due to attrition were significant on baseline variables. 3 groups of families were formed: participants who did not return for the 1‐year follow‐up, participants not returning for the 2‐year follow‐up and participants who completed the study. No significant differences between groups on children's baseline body mass, energy intake, diet composition (percent of kilocalories from fat), physical activity, sex or familial risk of obesity (P > 0.15). Number of study contacts: 3 (baseline, 1 and 2 years). Period of follow‐up (total period of observation): 2 years. Periods of recruitment: NR. Sample size justification adequately described? No. Sampling method: convenience sample of 219 families with 3‐ to 5‐year‐old children recruited through local paediatricians, daycare centres and churches in Memphis, TN, USA. Study objective: to investigate the extent to which largely modifiable and non‐modifiable risk factors simultaneously predicted weight gain and to determine the precise dietary, physical activity and demographic predictors of weight change in preschool children over a 3‐year period. Additionally, changes in largely modifiable risk factors (e.g. increases or decreases in dietary intake) were evaluated to reflect the dynamic nature of body mass change. Study population: preschool children in Memphis, TN. | |
| Participants | Baseline characteristics (reported for 1 overall group)
Included criteria: natural, biological offspring of his/her parents; no physical handicap or condition that could affect relative weight, dietary intake or physical activity; had parents who were married; had parents without CVD; and had a family who planned to stay in the metropolitan area in the coming year. Excluded criteria: NR. Brief description of participants: preschool children aged 3‐5 years. Total number completed in the cohort study: 146 children completed study; 73 children with some missing data (8 mothers pregnant, 2 fathers not available for baseline assessment, 35 families not available after 1 year, 22 not available at 2 years' follow‐up). Total number enrolled in cohort study: 219 children, including 3 sets of twins of whom only 1 was chosen randomly. | |
| Interventions | Description of exposure for cohorts:
See Table 6; Table 7; Table 8; Table 9; Table 10; Table 11; Table 12; Table 13; Table 14; Table 15 for details of total fat intake exposure per outcome. | |
| Outcomes | BMI
| |
| Identification | Sponsorship source: National Blood, Heart and Lung Institute. Country: USA. Setting: community. Comments: NA. Author's name: Robert C Klesges. Institution: University Prevention Center, Department of Psychology, The University of Memphis, and the Department of Preventive Medicine, University of Tennessee, Memphis, TN, USA. Email: NR. Declaration of interests: no. Study ID: Klesges 1995. Type of record: journal article. | |
| Notes | ||
| Risk of bias | ||
| Bias | Authors' judgement | Support for judgement |
| Were adequate outcome data for cohorts available? | Low risk | Although attrition was high (33% over 2 years), authors demonstrated no significant differences (P > 0.05) in baseline BMI, energy intake and diet composition between participants completing the study and participants who did not. |
| Was there matching of less‐exposed and more‐exposed participants for prognostic factors associated with outcome or were relevant statistical adjustments done? | Low risk | Child age, sex, baseline BMI, baseline energy intake, physical activity and parental BMI were adjusted using multiple regression analyses. Model was not adjusted for ethnicity or SES; however, authors report that participants were mostly white middle‐class children (data not provided). |
| Did the exposures between groups differ in components other than only total fat? | Low risk | |
| Can we be confident in the assessment of outcomes? | Low risk | Standard anthropometric methods used. |
| Can we be confident in the assessment of exposure? | Low risk | Multiple dietary intake assessments completed by both parents and children using the Willett FFQ (baseline, 1 and 2 years). Questionnaire was validated, and assessed dietary intake over the previous 1‐year period. All questionnaires were checked for completeness while families were still present to correct missing data. |
| Can we be confident in the assessment of presence or absence of prognostic factors? | Low risk | Child age, sex, baseline BMI, baseline energy intake, physical activity and parental BMI were adjusted using multiple regression analyses. |
| Was selection of less‐exposed and more‐exposed groups from the same population? | Low risk | All participants in analysis were recruited through local paediatricians, daycare centres as participants of 1 cohort study |
| Methods | Study design: prospective cohort study. Analyses methods for cohorts: girls divided into 2 groups (LF group 20‐30%TE; HF group > 30%TE). The GLM, ANOVA conducted to compare food group intakes, weight status and maternal feeding practices between groups. How were missing data handled? NR. Number of study contacts: baseline (aged 5 years) and after 2 years (aged 7 years) (not clearly reported). Period of follow‐up (total period of observation): 2 years. Period of recruitment: NR. Sample size justification adequately described? No. Sampling method: convenience sample. Girls aged 5‐years and their mothers who were participating in a longitudinal project investigating development of controls of food intake and dieting of girls. Families recruited using flyers and newspaper advertisements. Families with age‐eligible girls (total number NR) within 5‐county radius also received mailings and follow‐up telephone calls. Study objective: to compare girls' diets that had 30% of energy from fat with those meeting the AAP recommendations to maintain dietary fat intake at 30% of energy. Study population: healthy 5‐year‐old girls and their mothers. | |
| Participants | Baseline characteristics (reported for 1 overall group)
Included criteria: 5‐year old girls living with both biological parents. Excluded criteria: severe food allergies or chronic medical problems affecting food intake, and dietary restrictions involving animal products. Brief description of participants: healthy 5‐ to 7‐year‐old white girls in Pennsylvania, USA. Total number completed in cohort study: 192. Total number enrolled in cohort study: 197. | |
| Interventions | Description of exposure for cohorts
See Table 6; Table 7; Table 8; Table 9; Table 10; Table 11; Table 12; Table 13; Table 14; Table 15 for details of total fat intake exposure per outcome. | |
| Outcomes | BMI
Skinfold thickness
| |
| Identification | Sponsorship source: National Institutes of Health and the National Dairy Council. Country: USA. Setting: household. Comments: NA. Author's name: Yoonna Lee. Institution: Human Development and Family Studies, Pennsylvania State University. Email: [email protected]. Declaration of interests: no. Study ID: Lee 2001. Type of record: journal article. | |
| Notes | ||
| Risk of bias | ||
| Bias | Authors' judgement | Support for judgement |
| Were adequate outcome data for cohorts available? | Low risk | Authors stated that 5 girls (2.5% over 2 years) were excluded because of a dietary misreporting (fat intake < 20%). |
| Was there matching of less‐exposed and more‐exposed participants for prognostic factors associated with outcome or were relevant statistical adjustments done? | High risk | Matching NR. Authors did not control for any prognostic factors in analyses. |
| Did the exposures between groups differ in components other than only total fat? | Unclear risk | NR. |
| Can we be confident in the assessment of outcomes? | Low risk | Standardised methods used at baseline and follow‐up (weight, height, skinfold thickness measurements). |
| Can we be confident in the assessment of exposure? | High risk | Single assessment of dietary intake at baseline (3 × 24‐hour recalls during 2‐week period). |
| Can we be confident in the assessment of presence or absence of prognostic factors? | Low risk | No data reported in relation to prognostic factors. |
| Was selection of less‐exposed and more‐exposed groups from the same population? | Low risk | All participants of 1 cohort study. |
| Methods | Study design: prospective cohort study. Analyses methods for cohort: multivariate linear regression modelling for 2 years BMI change of 1st graders and 4th graders. Predictor variables were environmental factors, parental and lifestyle habits. Dependent variables were BMI change between 4 and 6 years' follow‐up. Model adjusted for age, sex, sexual maturation at 6 years' follow‐up (Tanner stage I, II, III, IV, V), baseline BMI, and exercise frequency, screen time, sleep duration, household income, parental BMI, parental education, maternal job, family structure, energy intake, meal skipping and snacking. They only adjusted for the BMI in the 4th survey at 6 years' follow‐up. How were missing data handled? Analytic sample taken of total number of children participating in study. Analytic sample was of children who participated at 4 and 6 years' follow‐up; total of 1504 participants. Original sample was of 893 but new participants were recruited over years (2776 participants at 5 years' follow‐up and 2770 at 6 years' follow‐up). Number of study contacts: 3 (baseline, 1 and 2 years). Period of follow‐up (total period of observation): both 1st graders and 4th graders were followed up for 2 years. Period of recruitment: baseline: 2005. New recruitment in 2008. Sample size justification adequately described? No. Sampling method: in 2005, all 1st graders of 4 elementary schools in Gwacheon city, Seoul were included. In 2008, 1st and 4th graders from 2 elementary schools in Jung‐gu, Seoul and 5 elementary schools in southwestern Gyeonggi province were added to the cohort. Study objective: to assess risk factors associated with children's BMI and their changes over a 2‐year period based on the analysis of the Obesity and Metabolic Disorders Cohort in Childhood registry. Study population: children in elementary school, grades 1 and 4. | |
| Participants | Baseline characteristics (reported for 1 overall group) 1st graders (n = 474); 4th graders (n = 1030)
Included criteria: NR. Excluded criteria: NR. Brief description of participants: 474 1st graders (31.5%) and 1030 4th graders (68.5%). Mean ages: 1st graders: 7.3 (SD 0.3) years; 4th graders: 10.0 (SD 0.4) years. Mean BMI of 1st graders 16.0 (SD 2.3) kg/m2 with 12.0% being over 85th percentile of BMI curve, whereas mean BMI of 4th graders was 18.1 (SD 3.0) kg/m2 with 17.3% being over 85th percentile of BMI curve. Total numbers completed in cohort study: analytic sample taken from entire cohort: 1504. Total number enrolled in cohort study: 893 children enrolled in 2005, and another 1847 children enrolled in 2008, thus total 2740. However, in Figure 1 for the 5 years' follow‐up, it showed that there were, at one point, 2776 children enrolled. | |
| Interventions | Description of exposure for cohort
See Table 6; Table 7; Table 8; Table 9; Table 10; Table 11; Table 12; Table 13; Table 14; Table 15 for details of total fat intake exposure per outcome. | |
| Outcomes | BMI
| |
| Identification | Sponsorship source: NR. Country: Korea. Setting: Elementary schools, Gwacheon city, Seoul. Comments: study name: Obesity and Metabolic Disorders Cohort in Childhood. Author's name: Hyun Hye Lee. Institution: Department of Family Medicine, Inje University College of Medicine, Seoul, Korea. Email: [email protected]. Declaration of Interests: Yes. "No potential conflict of interest relevant to this article was reported." Study ID: Lee 2012. Type of record: journal article. | |
| Notes | ||
| Risk of bias | ||
| Bias | Authors' judgement | Support for judgement |
| Were adequate outcome data for cohorts available? | High risk | Authors used an analytical sample and did not analyse entire cohort, which consisted of 2776 children. Reasons for this not provided. Loss to follow‐up not discussed. |
| Was there matching of less‐exposed and more‐exposed participants for prognostic factors associated with outcome or were relevant statistical adjustments done? | Low risk | Adjusted for age, sex, sexual maturation at 6 years' follow‐up, baseline BMI, exercise, screen time, sleep duration, household income, parental BMI and education, maternal job, family structure, energy intake, meal skipping and snacking. |
| Did the exposures between groups differ in components other than only total fat? | Low risk | |
| Can we be confident in the assessment of outcomes? | Low risk | Trained researchers measured height and weight; used sex‐specific 2007 growth charts for Korean children. |
| Can we be confident in the assessment of exposure? | Low risk | Authors reported: "Dietary intake was recorded for two weekdays and one day on the weekend by a 24‐hour recall method." Large sample size with multiple assessments to provide usual intake estimation. |
| Can we be confident in the assessment of presence or absence of prognostic factors? | Low risk | Over the 2‐year follow‐up period physical activity and screen time was assessed at least twice, with detailed definitions for moderate and vigorous activity to guide parents and children with this. |
| Was selection of less‐exposed and more‐exposed groups from the same population? | Low risk | NA as study did not divide participants into exposed and unexposed groups. All participants were sampled from similar locations. |
| Methods | Study design: prospective cohort study. Analyses methods for cohort: generalised linear estimating equations evaluated longitudinal relationship between body fatness and macronutrient intake. Regression analysis assessed whether body fatness at a particular age was predicted by intake at any of the previous ages. How were missing data handled? Considerable attrition occurred from 500 selected at birth to 198 at 2 years and 130 at 11 years. Information on participants lost before 8 years not available, but sociodemographic status of children remaining in cohort at 8 years was upwardly skewed compared to original cohort due to cohort attrition. Therefore, new recruitment (n = 113) done at age 11 years with age‐matched and socioeconomic balanced to the cohort (Magarey and Boulton 1994). Number of study contacts: 7 (at 2, 4, 6, 8, 11, 13 and 15 years of age). Period of follow‐up (total period of observation): 13 years. Periods of recruitment: November 1975 to June 1976. Sample size justification adequately described? No. Sampling method: 500 infants randomly selected by birth order from healthy term infants born at Queen Victoria Hospital, Adelaide, South Australia between November 1975 and June 1976. Core sample of approximately 150 children was retained in a longitudinal study of growth and nutrition from birth to 15 years of age. A further 113 children recruited for the 11‐year assessment from an age‐matched cross‐sectional sample of 715 children who had taken part in a family heart disease risk factor precursor study when they were 8 years of age. Study objective: to investigate the longitudinal relationship between macronutrient intake and adiposity at ages 2‐15 years. Study population: healthy born children aged 2‐15 years in Adelaide, South Australia. | |
| Participants | Baseline characteristics (reported for 1 overall group)
Included criteria: children who participated in the Adelaide Nutrition Study aged 2‐15 years with available follow‐up data. Excluded criteria: NR. Brief description of participants: children who participated in the Adelaide Nutrition Study aged 2‐15 years with 12‐16% of the boys being overweight, 12‐16% of prepubertal girls (aged 2‐8 years) and 17‐22% of adolescent girls (aged 11‐15 years). Total number completed in cohort study: 218 (at 15 years). Total number enrolled in cohort study: 500 (at birth) + 113 (at 11 years). | |
| Interventions | Description of exposure for cohort
See Table 6; Table 7; Table 8; Table 9; Table 10; Table 11; Table 12; Table 13; Table 14; Table 15 for details of total fat intake exposure per outcome. | |
| Outcomes | Weight
BMI
Skinfold thickness
Height
| |
| Identification | Sponsorship source: National Heart Foundation of Australia, Adelaide Children's Hospital Research Foundation and the National Health and Medical Research Council of Australia. Country: Australia. Setting: community in Adelaide. Comments: Adelaide Nutrition Study (birth cohort). Author's name: AM Magarey. Institution: Department of Public Health, The Flinders University of South Australia. Email: NR. Declaration of interests: no. Study ID: Magarey 2001. Type of record: journal article. | |
| Notes | ||
| Risk of bias | ||
| Bias | Authors' judgement | Support for judgement |
| Were adequate outcome data for cohorts available? | High risk | High attrition (71.4% over 8 years). No information available on children lost to study between 2 and 8 years. Attrition at 11 years: 74%. Since the children who returned had an upwardly skewed sociodemographic profile, another 115 children were recruited from an age‐matched cross‐sectional sample. |
| Was there matching of less‐exposed and more‐exposed participants for prognostic factors associated with outcome or were relevant statistical adjustments done? | High risk | No matching reported. Ethnicity, SES, physical activity and pubertal stage not adjusted for in regression analyses. |
| Did the exposures between groups differ in components other than only total fat? | Unclear risk | NR. |
| Can we be confident in the assessment of outcomes? | Low risk | Anthropometric measurements done using standard methods by 1 observer. |
| Can we be confident in the assessment of exposure? | Low risk | Repeated weighed 3‐day DRs completed by parents and children throughout study. |
| Can we be confident in the assessment of presence or absence of prognostic factors? | Unclear risk | Parental anthropometric data were investigator‐measured once when children were 8‐9 years old. Method not described. |
| Was selection of less‐exposed and more‐exposed groups from the same population? | Low risk | It is likely the 2 groups were from the same population although the original sample were selected from a single hospital (Victoria, Adelaide, Australia) and the additional sample from the same birth cohorts were purposively selected to balance demographic characteristics of the cohorts. |
| Methods | Study design: RCT. Study grouping: parallel. Allocation ratio in RCTs: 1:1. Analyses methods for RCTs: available‐case analysis; end values. Description of randomisation: from 286 finally eligible students, 218 were assigned randomly using a computerised random number generator to participate in the study in 2 groups of 109 students (intervention group and control group). How were missing data handled? Over 12 months, 11 participants lost in intervention group and 16 in control group. Data analysed based on participants having full data at end of follow‐up (98/109 randomised in intervention group; 93/109 randomised in control group). Number of study contacts: 3. Period of follow‐up (from when duration of active intervention period ended): 14 months. Periods of recruitment: NR. Intervention took place between September 2007 and January 2008. Sample size justification adequately described? Was based on previously reported intervention changes in energy intake among children. To detect standardised differences > 5% in dietary intake (main dependent variable) between study groups before and after intervention, achieving 90% statistical power at a probability level < 0.05, 87 participants should be recruited in each study group. To counter potential low response and dropouts, the authors increased this number by 25% to 109 for each study group. Sampling method: 342 adolescents of 5 high schools located in Vyronas district were initially eligible. 309/342 students voluntarily were interested in participating in study. Study objective: to evaluate short‐term (15‐day) and long‐term (12‐month) effects of a 12‐week school‐based health and nutrition interventional programme regarding energy and nutrient intake, dietary changes and BMI. Study population: students aged 12‐13 years (7th grade). | |
| Participants | Baseline characteristics (reported for 2 groups and overall) Lower fat intake (≤ 30%TE)
Usual or modified fat intake
Overall
Included criteria: children aged 12‐13 years at high schools located in Vyronas district, Athens, Greece. Excluded criteria: organic cause for high or low weight, received any medication that might interfere with growth or weight control, or were on specific diets. Pretreatment: no significant differences in age, gender, BMI, overweight/obesity, smoking, screen time, weekly hours of sport activities, weekly hours of playing or walking, and weekly hours of hobbies between groups before the nutrition intervention. Brief description of participants: 12‐ to 13‐year‐old adolescents from Greece; CVD risk: very few children were regular smokers. Total number completed RCT: 98 in intervention group; 93 in control group. Total number randomised: 218. | |
| Interventions | Intervention characteristics Lower fat intake (≤ 30%TE)
Usual or modified fat intake
| |
| Outcomes | BMI
Energy intake
Fat intake
Saturated fat intake
Protein intake
CHO intake
| |
| Identification | Sponsorship source: Ministry of Education and the National Foundation for the Youth. Country: Greece. Setting: high schools, Vyronas district, Athens. Comments: NA. Author's name: Constantinos Mihas. Institution: Department of Internal Medicine, General Hospital of Kimi 'G. Papanikolaou,' Kimi, Evia, 34003 Greece. Email: [email protected]. Declaration of interests: yes; conflicts of Interest: none declared. Study ID: Vyronas 2009. Type of record: journal article. | |
| Notes | ||
| Risk of bias | ||
| Bias | Authors' judgement | Support for judgement |
| Random sequence generation (selection bias) | Low risk | Computerised random number generator used; baseline characteristics similar between groups. |
| Allocation concealment (selection bias) | Unclear risk | NR. |
| Blinding of participants and personnel (performance bias) | Low risk | Authors stated blinding not feasible, but primary outcome not likely to be influenced by lack of blinding. |
| Blinding of outcome assessment (detection bias) | Low risk | Authors stated that blinding was not feasible, but assessment of primary outcome not likely influenced by lack of blinding. |
| Incomplete outcome data (attrition bias) | Low risk | Similar in both groups, paper mentioned loss of 5 participants during trial (due to health problems, lack of interest and move to other schools). Of 109 allocated in each group, 10 in intervention group and 12 in the control group were not analysed (reasons unclear). 10% (22/213) lost over 17 months. |
| Selective reporting (reporting bias) | Low risk | Protocol not available, but prespecified outcomes in methods reported in results section. |
| Other bias | Unclear risk | Limited information on control group diet prescription, unable to judge if prescribed diets being compared differed in components other than total fat. |
| Methods | Study design: prospective cohort study. Analyses methods for cohort: regression model by stepwise selection from explanatory variables: age, BMI, IR and maturation stage at baseline; change in IR over 10 years' follow‐up; total calorie intake; percentage of calories from protein, fat and CHO (mean of interviews) during 10 years' follow‐up; and interaction terms (nutrients X baseline IR). How were missing data handled? NR. Number of study contacts: 10. Period of follow‐up (total period of observation): 10 years. Periods of recruitment: January 1987 to May 1988. Sample size justification adequately described? Reported for NGHS multicentre study. Primary consideration for sample size was adequate power for comparing change in subscapular skinfold between black and white girls. Sample size was increased to maintain sufficient power should only 65% of children be available for follow‐up measurements. Calculated target sample size was 1150 per group. Sampling method: convenient sampling by 3 clinical centres from public and parochial schools at Berkeley, Cincinnati and Westat (members of a medical program), USA. Study objective: to evaluate the role of preteen IR resistance and insulin in adolescent weight gain and the development of IFG and T2DM. Hypothesised that preteen IR, interacting with dietary factors such as total calories and fat calories, and 10‐year change in IR would positively predict 10‐year increases in BMI and the development of IFG and T2DM. Study population: white and black girls aged 9‐10 years living in Berkeley, Cincinnati and Westat, USA. | |
| Participants | Baseline characteristics (reported as 1 overall group and 1 matched subsample) Overall
Subsample (paired matched at enrolment by pubertal stage, FM and insulin)
Included criteria: declared themselves as black or white; aged within 2 weeks of 9 or 10 years at time of 1st clinical visit; parents or guardians who identified themselves as same race as child; parents or guardians completed a household demographic information form and gave consent. Excluded criteria: other ethnic groups. Brief description of participants: 9‐ to 10‐year‐old black and white girls. Total number completed in cohort study: overall n = 639; white n = 280; black n = 359. Total number enrolled in cohort study: overall n = 2379; white n = 1166; black n = 1213. | |
| Interventions | Description of exposure for cohort
See Table 6; Table 7; Table 8; Table 9; Table 10; Table 11; Table 12; Table 13; Table 14; Table 15 for details of total fat intake exposure per outcome. | |
| Outcomes | BMI
WC
| |
| Identification | Sponsorship source: National Heart, Lung, and Blood Institute and the Lipoprotein Research Fund of the Jewish Hospital of Cincinnati. Country: USA. Setting: clinical centres (Berkeley, Cincinnati and Westat). Comments: NGHS. Author's name: John A Morrison. Institution: Division of Cardiology, Cincinnati Children’s Hospital Medical Center, Cincinnati, OH (JAM); the Cholesterol Center, Jewish Hospital of Cincinnati, Cincinnati, OH (CJG and PW); the Department of Mathematics, University of Cincinnati, Cincinnati, OH (PSH). Email: [email protected]; [email protected]. Declaration of interests: yes. "No conflicts of interest for any authors." No honorarium, grant, or other form of payment was given to anyone to produce the manuscript. "None of the authors had a personal or financial conflict of interest." Study ID: Morrison 2008. Type of record: journal article. | |
| Notes | We contacted authors to request relevant regression data since they did not report the regression coefficients for total dietary fat intake alone as a predictor variable of body fatness in their regression models. We had not received a response by time of publication. | |
| Risk of bias | ||
| Bias | Authors' judgement | Support for judgement |
| Were adequate outcome data for cohorts available? | Low risk | Out of 639 girls with complete BMI outcome data, only 521 (81.5%) had dietary data. For 10‐year waist changes, 512 girls had complete data. No assessment comparing girls with dietary data compared to girls who did not. |
| Was there matching of less‐exposed and more‐exposed participants for prognostic factors associated with outcome or were relevant statistical adjustments done? | High risk | Regression model (n = 521) performed by stepwise selection including age, BMI, IR and pubertal stage, 10‐year change in IR, total TE, percentage of calories from fat, protein, CHO during follow‐up period and interaction terms (nutrients × baseline IR). Physical activity/inactivity, parental BMI or SES not included in regression model. Secondary analyses (n = 172) with pair‐matched for race (black‐white); pubertal stage, BMI and insulin levels at 9‐10 years, adjusted for parental obesity level. |
| Did the exposures between groups differ in components other than only total fat? | Low risk | |
| Can we be confident in the assessment of outcomes? | Low risk | Standard methods used for measurement of height, weight, skinfold and circumference measurements. |
| Can we be confident in the assessment of exposure? | Low risk | Dietary intake assessed using repeated 3‐day DRs. |
| Can we be confident in the assessment of presence or absence of prognostic factors? | Low risk | Data collection methods well described for most variables (e.g. pubertal staging, parental obesity). |
| Was selection of less‐exposed and more‐exposed groups from the same population? | Low risk | All participants of the NHLBI growth and health study. |
| Methods | Study design: prospective cohort study. Analyses methods for cohort: intervention and control children from the STRIP RCT analysed together. Repeated measures unbalanced ANOVA used to compare growth of children who were continuously in lowest fat intake quartile (at 24 months, 27.7%TE and 36 months, 28.7%TE) and children in higher fat intake quartiles. Linear regression model used to predict relative weight on age (children aged between 7 and 30‐36 months with 2 to 2.5 years' follow‐up and who had at least 5 measurements were included in this analysis). How were missing data handled? Children with 5 follow‐up measurements included in analyses while information on children with missing data NR. Number of study contacts: 3 (at 24, 30 and 36 months of age). Period of follow‐up (total period of observation): cohort, 2.5 years; present analyses, 1 year. Periods of recruitment: March 1990 to May 1992. Sample size justification adequately described? Yes, for RCT part of STRIP study. "The required sample size for the trial was predicted to achieve, at a 1% significance with 80% power, a 0.2‐mmol/L true difference in the change of serum cholesterol concentration between the study groups, assuming that the SD of serum cholesterol concentration is 0.9 mmol/L." Sampling method: convenience. Study included 1062 infants of 1054 families (56.5% of eligible families) from the well‐baby clinics of Turku, Finland. Study objective: "to study the fat and energy intakes of children between 7 and 36 months of age with different growth patterns." Study population: 24‐ to 36‐month old toddlers in Turku, Finland. | |
| Participants | Baseline characteristics (reported for 2 groups and overall group) Five groups of children representing different extreme growth patterns during the first three years of life were formed (groups: thin, slow‐weight‐gain, normal, rapid‐weight‐gain, and obese ‐ grouped according to relative weight), and their energy and fat intakes analysed. A lower fat (LF) intake group was then formed with children constantly belonging to the lowest relative fat intake quartile, and the rest allocated to other children/higher fat (HF) intake group. Relative weight was defined as deviation of weight in percentages from the mean weight of healthy children of the same height and sex. LF intake
Other children or HF intake
Thin group
Slow weight gain group
Normal group
Rapid weight gain group
Obese group
Overall
Included criteria: families of infants attending routine 5‐month clinic visit. Excluded criteria: NR. Brief description of participants: healthy 24‐ to 36‐month‐old toddlers who participated in the STRIP Baby Trial. Total number completed in cohort study: 848 (children with ≥ 5 measurements between 7 and 36 months included in reported analysis). Total number enrolled in cohort study: 1062. | |
| Interventions | Description of exposure for cohort
See Table 6; Table 7; Table 8; Table 9; Table 10; Table 11; Table 12; Table 13; Table 14; Table 15 for details of total fat intake exposure per outcome. | |
| Outcomes | Weight
| |
| Identification | Sponsorship source: Mannerheim League for Child Welfare; Finnish Cardiac Research Foundation; Foundation for Pediatric Research, Finland; Academy of Finland; Yrjo ̈ Jahnsson Foundation; Juho Vainio Foundation; Turku University Foundation; City of Turku; Chymos Ltd; Raisio Group; and Van den Bergh Foods Company. Country: Finland. Setting: well‐baby clinics of Turku. Comments: NA. Author's name: Harri Niinikoski. Institution: Cardiorespiratory Research Unit and Department of Pediatrics, University of Turku, Turku, Finland. Email: NR. Declaration of Interests: no. Study ID: Niinikoski 1997. Type of record: journal article. | |
| Notes | ||
| Risk of bias | ||
| Bias | Authors' judgement | Support for judgement |
| Were adequate outcome data for cohorts available? | High risk | With 30.3% over 1 year lost (740 completed out of 1062 recruited), information on characteristics of children lost to follow‐up NR. |
| Was there matching of less‐exposed and more‐exposed participants for prognostic factors associated with outcome or were relevant statistical adjustments done? | High risk | No matching reported. No adjustment of prognostic variables. |
| Did the exposures between groups differ in components other than only total fat? | High risk | LF‐intake group likely included toddlers who had been exposed to the nutrition intervention programme. |
| Can we be confident in the assessment of outcomes? | Low risk | Standardised methods for anthropometric measures (weight and height) was performed. |
| Can we be confident in the assessment of exposure? | Low risk | Multiple assessments (24, 30 and 36 months) using 4‐day DRs, which included at least 1 weekend day. |
| Can we be confident in the assessment of presence or absence of prognostic factors? | Low risk | Parental BMI measurement was measured at each visit. Although physical activity was not measured, it is not an important variable at this age |
| Was selection of less‐exposed and more‐exposed groups from the same population? | Low risk | All children were recruited from the same Well‐Baby clinics in Turku, Finland. |
| Methods | Study design: RCT (cohort analysis). Analyses methods for cohorts: longitudinal linear regression models using data from all 3 time points and taking into account correlation between measurements on same person. How were missing data handled? Attrition at 1 year' follow‐up: 7% (46/663); at 3 years: 5% (31/663). Missing data from children who attended follow‐up visits averaged 3% for dietary measures and 5% for biochemical measures. Number of study contacts: 3 (baseline, follow‐up after 1 and 3 years). Period of follow‐up (total period of observation): 3 years (for this analysis). Periods of recruitment: started 1987. Sampling method: convenience sample of 47,000 children prescreened at schools, prepaid health plans and physician clinics at 6 clinical centres; 5122 children attended 1st screening visit; 1637 children attended 2nd screening visit; 752 attended baseline visits (potentially eligible). Study objective: to assess relationship between energy intake from fat and anthropometric, biochemical, and dietary measures of nutritional adequacy and safety. Study population: school children aged 8‐10 years with moderately elevated LDL‐C levels in USA. | |
| Participants | Baseline characteristics (reported as 1 overall group)
Included criteria: boys and girls aged 8‐11 years with primary elevated serum LDL‐C levels (defined as mean of 2 fasting values between 80th and 98th age‐ and sex‐specific percentiles), with no evidence of pubertal development (Tanner stage I) and normal psychosocial and cognitive development. Excluded criteria: major illness; medications that might affect blood lipids or growth (or both); weight‐for‐height < 5th or > 90th percentile, or height 5th percentile for sex‐ and race‐specific growth curves; any household member on a LF or "cholesterol‐lowering" diet; and parental factors such as prior heart disease, extreme obesity or excessive intake of alcohol, which are potential barriers to dietary adherence by the child. Children with serum levels of TGs > 200 mg/dL or of HDL cholesterol 30 mg/dL. Total number completed in cohort study: 632 (at 3 years' follow‐up). Total number enrolled in cohort study: 663. | |
| Interventions | Description of exposure for cohorts
See Table 6; Table 7; Table 8; Table 9; Table 10; Table 11; Table 12; Table 13; Table 14; Table 15 for details of total fat intake exposure per outcome. | |
| Outcomes | Weight
BMI
Skinfold thickness
SBP
DBP
Height
| |
| Identification | Sponsorship source: NHLBI. Country: USA. Setting: 6 clinical centres. Comments: Dietary Intervention Studies in Children (DISC). Author's name: Eva Obarzanek. Institution: DISC Coordinating Center, Maryland Medical Research Institute. Email: [email protected]. Declaration of Interests: no. Study ID: Obarzanek 1997. Type of record: journal article. | |
| Notes | ||
| Risk of bias | ||
| Bias | Authors' judgement | Support for judgement |
| Were adequate outcome data for cohorts available? | Low risk | Low attrition during follow‐up (7% (46/663) over 1 year; and 6% (40/663) over 3 years). |
| Was there matching of less‐exposed and more‐exposed participants for prognostic factors associated with outcome or were relevant statistical adjustments done? | High risk | Analyses adjusted for sex, physical activity and total energy intake. No adjustment for pubertal stage, parental BMI or SES. |
| Did the exposures between groups differ in components other than only total fat? | Low risk | |
| Can we be confident in the assessment of outcomes? | Low risk | Standardised measurements of weight, height and skinfold thickness performed by trained staff. |
| Can we be confident in the assessment of exposure? | Low risk | Repeated assessments of dietary intake (baseline, 1 and 3 years' follow‐up) using multiple 24‐hour dietary recalls. |
| Can we be confident in the assessment of presence or absence of prognostic factors? | Low risk | Repeated assessment of physical activity using validated questionnaire. |
| Was selection of less‐exposed and more‐exposed groups from the same population? | Low risk | Children selected as participants of 1 RCT. |
| Methods | Study design: RCT. Study grouping: parallel group. Allocation ratio in RCTs: 1:1. Analyses methods for RCTs: ITT; end values reported. Description of randomisation: "Computer‐generated randomisation assignments were provided by the coordinating centre to produce within each clinical center approximately equal numbers of participants assigned to the intervention and usual care groups balanced by age and sex;" central allocation; NR who enrolled participants. How were missing data handled? "It was assumed that missing data in both groups would have come from the same distribution as observed data in the usual care group, so missing year 3 LDL‐C data were estimated by drawing values from the usual care group distribution;" "Analyses of secondary outcomes using no imputation for missing values used ANCOVA models for continuous outcomes and Wilcoxon tests for ordered categorical outcomes. Baseline level and sex were included as covariates." Number of study contacts: 8. Period of follow‐up (from when duration of active intervention period ended): approximately 3 years. Period of recruitment: 2.5 years. Sample size justification adequately described? yes: "The sample size of 300 in each treatment group was based on estimates of intervention efficacy. The primary outcomes will be tested at a two‐sided significance level of u=0.05. To test the primary efficacy hypothesis with 90% power, the sample size needed per group is given by n = 2 (1.96 + 1.28)*var/A2, where A is the difference between the average changes in the treatment and control groups, and var is the variance of A. Variance estimates were derived from Bogalusa Heart Study data, using 8‐ to I0‐year‐old children with LDL‐C levels in the 75 to 98th percentile, and calculating baseline and 36‐month follow‐up variances as well as the correlation at these two times." Sampling method: mass mailing used to recruit children from schools, a health maintenance organization and paediatric practices; > 47,000 children were prescreened for potential eligibility; n = 5122 seen for screening 1; n = 1637 for screening 2; n = 752 for baseline visit. Study objective: to assess efficacy and safety of lowering dietary intake of total fat, saturated fat and cholesterol to decrease LDL cholesterol levels in children. Study population: prepubescent boys and girls with primary elevated serum LDL cholesterol levels. | |
| Participants | Baseline characteristics (reported for 2 groups and overall group) Lower fat intake (≤ 30%TE)
Usual or modified fat intake
Overall
Included criteria: boys aged 8 years 7 months to 10 years 10 months and girls aged 7 years 10 months to 10 years 1 month, with primary elevated serum LDL‐C levels (defined as mean of 2 fasting values between 80th and 98th age‐ and sex‐specific percentiles), with no evidence of pubertal development (Tanner stage I) and normal psychosocial and cognitive development. Excluded criteria: major illness; medications that might affect blood lipids or growth (or both); weight‐for‐height < 5th or > 90th percentile, or height < 5th percentile for sex‐ and race‐specific growth curves; any household member on a LF or "cholesterol‐lowering" diet; and parental factors such as prior heart disease, extreme obesity or excessive intake of alcohol, which are potential barriers to dietary adherence by the child. Children with serum levels of TGs > 200 mg/dL or of HDL‐C < 30 mg/dL. Pretreatment: NR. Brief description of participants: prepubertal boys (approximately n = 362) and girls (approximately n = 301) aged 7‐11 years with LDL‐C levels ≥ 80th and < 98th percentiles for age and sex percentiles of the Lipid Research Clinics population. Total number completed in RCT: last visit for BMI (> 5 years): intervention group n = 293; control group n = 283. Total number randomised: total n = 663; intervention group n = 334; control group n = 329. | |
| Interventions | Intervention characteristics Lower fat intake (≤ 30%TE)
Usual or modified fat intake
| |
| Outcomes | Weight
BMI
Total cholesterol
LDL‐C
HDL‐C
TGs
SBP
DBP
Height
Energy intake
Fat intake
Saturated Fat intake
Protein intake
CHO intake
| |
| Identification | Sponsorship source: NHLBI. Country: USA. Setting: 6 clinical centres. Comments: NA. Author's name: Eva Obarzanek. Institution: DISC Coordinating Center, Maryland Medical Research Institute, Baltimore, MD, USA. Email: [email protected]. Declaration of interests: no. Study ID: DISC 2001. Type of record: journal article. | |
| Notes | ||
| Risk of bias | ||
| Bias | Authors' judgement | Support for judgement |
| Random sequence generation (selection bias) | Low risk | In DISC 1995, "computer‐generated randomisation assignments were provided by the coordinating center to produce within each clinical center approximately equal number of participants assigned to the intervention and usual care groups balanced by age and sex." Baseline characteristics similar between groups. |
| Allocation concealment (selection bias) | Low risk | In DISC 1993 authors stated, "eligible children were allocated randomly to intervention and usual‐care groups by the coordinating centre..." thus it appeared that there was a central allocation centre and recruitment at the clinical centres could not have been manipulated. |
| Blinding of participants and personnel (performance bias) | Low risk | In DISC 1993, "though it was not possible to have a double blind trial due to the nature of dietary intervention, a single blind was maintained by using data collectors unaware of group assignment." Participants not blinded. However, lack of double blinding was not likely to influence the outcomes. |
| Blinding of outcome assessment (detection bias) | Low risk | Outcome assessors blinded to group assignment. |
| Incomplete outcome data (attrition bias) | Low risk | Numbers lost to follow‐up: at 3 years: intervention group 14/334 (4.2%) and control group 26/329 (7.9%) (no reasons). At 7 years: intervention group 39/334 (11.7%) and control group 44/329 (13.4%) (no reasons). No differences in age, height, weight, BMI, total and saturated fat intake, serum LDL‐C or serum ferritin, and in distributions of sex, household income and education in those attending final visit vs dropouts. Missing the last visit was not related to treatment assignment. Primary outcomes analysed using ITT, imputation process described; secondary outcomes analysed using per protocol analyses. |
| Selective reporting (reporting bias) | Low risk | Protocol not available, but paper with study design and baseline characteristics available and all the study's prespecified outcomes were reported in the results section. |
| Other bias | Unclear risk | Intervention diet focused only on fat intake changes and encouraged water‐soluble fibre, and control diet AHA publications "Dietary Guidelines for Americans" and "How to Make Your Heart Last a Lifetime" but no detailed nutrition composition detail provided. |
| Methods | Study design: prospective cohort study. Analyses methods for cohorts: bivariate and multivariate regression analysis used for age and gender adjustments. As some families had > 1 child in analysis or child pairs with both biological father and mother (or both), GEE used to generate age and gender adjusted odds ratios that accounted for correlation among multiple within‐family observations. How were missing data handled? 575 parents and 411 children (36.1%) completed study at 2 years. Authors did not state how many started study. They only stated that many did not accept the invitation to participate and mentioned incomplete data as a reason for the final numbers of participants. Reported that characteristics of non‐participants and participants were not significantly different (variables not stated). Number of study contacts: 2 (baseline/year 1; year 2). Period of follow‐up (total period of observation): 1 year. Periods of recruitment: NR. Sampling method: convenience sample. 2690 parents and children with complete CVD risk factor profiles and lifestyle data, who participated in a previous PEP substudy. Study objective: to examine whether associations between improved CVD risk profiles and lifestyle changes persist over 1 year in a real‐life setting. Study population: healthy German grade 1 children of elementary schools in Nuremberg, Germany. | |
| Participants | Baseline characteristics (reported for 1 overall group)
Included criteria: children who did not met exclusion criteria. Excluded criteria: non‐German children; self‐reported cardiovascular, metabolic, endocrine and malignant disorders; extreme physical activity; special nutritional habits and medication. Brief description of participants: healthy German children and parents participating in PEP study. Total number completed in cohort study: 411 (195 boys; 216 girls). 36.1% lost (invited parent‐child pairs), author indicated that characteristics of non‐participants and participants were not significantly different. Total number enrolled in cohort study: 1150 children from 2001 PEP substudy invited. Number enrolled NR. | |
| Interventions | Description of exposure for cohorts Time span: 1 year. Dietary assessment method used: weighed DR. Frequency of dietary assessments: single 7‐day weighed DR at baseline and after 1 year' follow‐up. See Table 6; Table 7; Table 8; Table 9; Table 10; Table 11; Table 12; Table 13; Table 14; Table 15 for details of total fat intake exposure per outcome. | |
| Outcomes | Weight
BMI
Body fat
| |
| Identification | Sponsorship source: Foundation for the Prevention of Atherosclerosis, Nuremberg, Germany; Ludwig Maximilian University, Munich, Germany; Bavarian Ministry of Health, Munich; City of Nuremberg. Country: Germany. Setting: community in Nuremberg. Comments: PEP Family Heart Study. Author's name: Peter Schwandt. Institution: Arteriosklerose Präventions Institut and Ludwig Maximilians University, Munich. Email: API.Schwandt.Haas@t‐online.de. Declaration of Interests: no. Study ID: Schwandt 2010. Type of record: journal article. | |
| Notes | Authors provided separate regression data on children only, since regression data in text referred to both children and adults. | |
| Risk of bias | ||
| Bias | Authors' judgement | Support for judgement |
| Were adequate outcome data for cohorts available? | Unclear risk | Author indicated that characteristics of non‐participants were similar to those who participated in present study but specific variables and analyses NR. Study also had a high non‐response rate as only 36.1% of the invited parent‐child pairs completed follow‐up after 1 year. |
| Was there matching of less‐exposed and more‐exposed participants for prognostic factors associated with outcome or were relevant statistical adjustments done? | High risk | Although age, gender and physical activity were adjusted in the data analyses, parental BMI, SES and energy intake were not adjusted for. |
| Did the exposures between groups differ in components other than only total fat? | Low risk | |
| Can we be confident in the assessment of outcomes? | Low risk | Outcome measures undertaken using standardised methods (weight, height, skinfold thickness measurements, BP). |
| Can we be confident in the assessment of exposure? | Low risk | 7‐day weighed DRs assessed at baseline and 1 year. |
| Can we be confident in the assessment of presence or absence of prognostic factors? | Low risk | Data collection done using acceptable methods. Physical activity assessed by validated questionnaires with a 7‐day recall period at baseline and at 1 year. |
| Was selection of less‐exposed and more‐exposed groups from the same population? | Low risk | All participants from the PEP Healthy Heart study. |
| Methods | Study design: prospective cohort study. Analyses methods for cohorts: multivariable mixed‐effect analysis of each dietary component with the outcomes (WC, BMI, SBP and DBP) conducted. The model with WC was adjusted for age, sex and BMI‐for‐age z‐score, WC and physical activity at baseline. The model with BMI was adjusted for baseline BMI‐for‐age z‐score and physical activity. Models with SBP and DBP were adjusted for baseline BMI‐for‐age z‐score, physical activity and SBP or DBP. Model with SBP was also adjusted for year of study. Interaction analysis conducted for each model to identify significant sex‐specific difference in results. How were missing data handled? Authors reported no statistically significant differences in the SBP z‐scores, DBP z‐scores, BMI‐for‐age z‐scores and WC between the 448 students enrolled and 127 (28.3%) students with missing or incomplete information (data not shown). Number of study contacts: 3 (baseline, 1 and 2 years' follow‐up). Period of follow‐up (total period of observation): 2 years (2009‐2010; 2010‐2011). Periods of recruitment: 2007‐2008. Sample size justification adequately described? No. Sampling method: convenience sample of children in grades 5‐10 from 14 secondary schools, Black Gold School District, Alberta. Of approximately 7000 students, 2189 consented to participate in cohort; 774 students completed baseline dietary questionnaire (Forbes 2013). Of these, 448 students had complete data on dietary intake, physical activity and at ≥ 1 cardiometabolic risk factor at baseline and 1 follow‐up visit. Study objective: to investigate whether specific aspects of dietary intake were associated with prospective changes in cardiometabolic risk factors in children and youths. Study population: school children in grades 5‐10, Black Gold School District, Edmonton, Alberta, Canada. | |
| Participants | Baseline characteristics (reported for 1 overall group)
Included criteria: students with complete data on dietary intake, physical activity and ≥ 1 cardiometabolic risk factor at baseline and ≥ 1 follow‐up. Excluded criteria: energy intake of 500 or ≥ 5000 kcal/day. Brief description of participants: students in grades 5‐10 from rural and urban secondary schools of the Black Gold School District, Edmonton, Alberta, Canada participating in the Healthy Hearts study. Total number completed in cohort study: 321. Total number enrolled in cohort study: 448. | |
| Interventions | Description of exposure for cohorts Time span: 2 years. Dietary assessment method used: validated 24‐hour diet recall (Web‐SPAN) to measure week day dietary intake. Frequency: single 24‐hour dietary recall at baseline. See Table 6; Table 7; Table 8; Table 9; Table 10; Table 11; Table 12; Table 13; Table 14; Table 15 for details of total fat intake exposure per outcome. | |
| Outcomes | BMI
WC
SBP
DBP
| |
| Identification | Sponsorship source: Collaborative Research and Innovation Opportunity (CRIO) Team Grant; Alberta Innovates Health Solutions. Country: Canada. Setting: rural and urban schools, Black Gold School District, Alberta. Comments: Healthy Hearts Study. Author's name: Solmaz Setayeshgar. Institution: School of Public Health, population Health Intervention Research Unit, University of Alberta, Canada. Email: [email protected]. Declaration of Interests: yes. "The authors declare that they have no competing interests." Study ID: Setayeshgar 2017. Type of record: journal article. | |
| Notes | ||
| Risk of bias | ||
| Bias | Authors' judgement | Support for judgement |
| Were adequate outcome data for cohorts available? | High risk | Proportion of students with incomplete data was high (28.3%). Authors reported no statistically significant differences in outcome variables at baseline between children who were enrolled (n = 448) and children with incomplete information (n = 127) (data not shown). They did not compare children who had incomplete data with children who had complete data (n = 321). |
| Was there matching of less‐exposed and more‐exposed participants for prognostic factors associated with outcome or were relevant statistical adjustments done? | High risk | No adjustment for total energy intake, parental BMI, pubertal stage or SES. |
| Did the exposures between groups differ in components other than only total fat? | Low risk | |
| Can we be confident in the assessment of outcomes? | Low risk | Standardised methods used to assess weight, height, WC and BP. |
| Can we be confident in the assessment of exposure? | High risk | Single dietary assessment (validated 24‐hour recall) at baseline. |
| Can we be confident in the assessment of presence or absence of prognostic factors? | High risk | Single assessment of physical activity using a validated method (accelerometer) at baseline. |
| Was selection of less‐exposed and more‐exposed groups from the same population? | Low risk | Children and adolescents were all participants of the Healthy Hearts cohort study. |
| Methods | Study design: prospective cohort study. Analyses methods for cohorts: multiple linear regression analyses done in which change in height, weight and BMI were adjusted for baseline values such as age in months at 1st 24‐hour recall, sex, race/ethnicity and total energy intake. Results did not differ from unadjusted analyses and only unadjusted results were reported. Children categorised based on intake of total fat of < 30% of calories vs ≥ 30%, and groups compared using unpaired 2‐tailed Student's t‐test. How were missing data handled? 215 (90.3%) children followed for ≥ 1 year (no reasons stated for attrition). Number of participants who completed study after 2 years NR. Number of study contacts: mean 8 (range 5‐11). Period of follow‐up (total period of observation): 2.1 (0.31). Periods of recruitment: 1985‐1986. Sample size justification adequately described? No. Sampling method: convenience sample. Participants drawn from children participating in the Columbia University Study of Childhood Activity and Nutrition, a longitudinal observational study. Families recruited mainly through a paediatric practice at The Presbyterian Hospital that served a predominantly Hispanic, densely populated, low‐income neighbourhood in northern Manhattan, New York City. A few families recruited from other community sources. Only 1 child per family was eligible. Study objective: to determine whether a moderately reduced fat diet affected stature or growth of healthy preschool children. Study population: 3‐ to 4‐year‐old children in low‐income neighbourhoods in northern Manhattan, New York City. | |
| Participants | Baseline characteristics (reported for 1 overall group)
Included criteria: families with a healthy child aged 3‐4 years. Excluded criteria: mother was pregnant or postpartum by < 6 months. Brief description of participants: healthy 3‐4 year old Hispanic children. Total number completed in cohort study: NR. 215 children included in analyses; 23 lost to follow‐up or with incomplete data on either anthropometry or dietary intakes excluded. Total number enrolled in cohort study: 238 children. | |
| Interventions | Description of exposure for cohorts
See Table 6; Table 7; Table 8; Table 9; Table 10; Table 11; Table 12; Table 13; Table 14; Table 15 for details of total fat intake exposure per outcome. | |
| Outcomes | Weight
BMI
Height
| |
| Identification | Sponsorship source: National Heart, Lung, and Blood Institute and Cancer Research Foundation of America. Country: USA. Setting: clinic, Northern Manhattan, New York City. Comments: Columbia University Study of Childhood Activity and Nutrition. Author's name: Steven Shea. Institution: Division of General Medicine, Department of Medicine, Columbia University, New York, USA. Email: NR. Declaration of Interests: no. Study ID: Shea 1993. Type of record: journal article. | |
| Notes | ||
| Risk of bias | ||
| Bias | Authors' judgement | Support for judgement |
| Were adequate outcome data for cohorts available? | Unclear risk | 215 (90.3%) children followed for ≥ 1 year (4 follow‐up visits). No reasons stated for attrition. Unclear how many children completed last follow‐up visit after 2 years (mean follow‐up (months) 25 (SD 3.8). |
| Was there matching of less‐exposed and more‐exposed participants for prognostic factors associated with outcome or were relevant statistical adjustments done? | High risk | No matching reported. Multiple linear regression analysis performed to adjust for age in months at 1st 24‐hour recall, sex, race/ethnicity and total energy intake, but findings did not differ in any substantive way from bivariate analyses, and only results of bivariate analyses were reported. No adjustment for physical activity, parental BMI or SES. |
| Did the exposures between groups differ in components other than only total fat? | Unclear risk | NR. |
| Can we be confident in the assessment of outcomes? | Unclear risk | Anthropometric measures not adequately described. |
| Can we be confident in the assessment of exposure? | Low risk | Multiple assessments of dietary intake by repeated 24‐hour food record and FFQ at baseline. |
| Can we be confident in the assessment of presence or absence of prognostic factors? | Low risk | Data on parental BMI, SES or physical activity of children not measured. |
| Was selection of less‐exposed and more‐exposed groups from the same population? | Low risk | Children recruited from 1 cohort study (Columbia University Study of Childhood Activity and Nutrition). |
| Methods | Study design: prospective cohort study. Analyses methods for cohorts: longitudinal dietary intake based on 9 sets of 3‐day dietary data from children aged 2‐8 years. Changes in energy intake over time and gender differences in energy intake tested with GLM repeated measures ANOVA. How were missing data handled? Lost to follow‐up at 3 years: 23 (reasons: travel time required for interviews); at 3.5 and 8 years: 5 (reasons: n = 4: family moved, discontinued participation; n = 1: consistently incomplete data provided by mother). No analysis performed comparing children who completed study to children who did not. Number of study contacts: 11 (2.0, 2.3, 2.7, 3.0, 3.5, 4.0, 4.5, 5.0, 6.0, 7.0 and 8.0 years). Period of follow‐up (total period of observation): 8 years. Periods of recruitment: May‐September 1992. Sample size justification adequately described? No. Sampling method: purposively selected sample of 98 infants aged 2 months recruited from 2 metropolitan areas in Tennessee. Current analysis based on data from 62 children from original cohort, 2 infants who were selected as replacements prior to 1 year of age for cohort and 6 children aged 2 years who participated in a similar infant study from the same laboratory. Study objective: to identify longitudinal variables related to children's BMI at 8 years. Study population: healthy white children aged 2‐8 years in urban area of Tennessee, USA. | |
| Participants | Baseline characteristics (reported for 1 overall group)
Included criteria: children who participated in the original birth cohort aged 2‐8 years with available follow‐up data. Excluded criteria: NR. Brief description of participants: children aged 2‐8 years. Total number completed in cohort study: 70 (37 boys, 33 girls). Total number enrolled in cohort study: 98 (+2 prior to 1 year; +6 at age 2 years). | |
| Interventions | Description of exposure for cohorts
See Table 6; Table 7; Table 8; Table 9; Table 10; Table 11; Table 12; Table 13; Table 14; Table 15 for details of total fat intake exposure per outcome. | |
| Outcomes | BMI
Body fat
Sum of skinfolds
| |
| Identification | Sponsorship source: Gerber Products Company and Tennessee Agricultural Experiment Station. Country: USA. Setting: Urban households, Tennessee. Comments: NA. Author's name: JD Skinner. Institution: Nutrition Department, University of Tennessee, Knoxville, TN, USA. Email: [email protected]. Declaration of Interests: no. Study ID: Skinner 2004. Type of record: journal article. | |
| Notes | ||
| Risk of bias | ||
| Bias | Authors' judgement | Support for judgement |
| Were adequate outcome data for cohorts available? | High risk | Relatively high number of dropouts (36.7% over 6 years; 62/98 children recruited for study were analysed). Baseline data between children who completed and children who did not were not compared. |
| Was there matching of less‐exposed and more‐exposed participants for prognostic factors associated with outcome or were relevant statistical adjustments done? | Low risk | Age, gender, ethnicity and SES were matched while parental BMI, BMI at baseline, adiposity rebound age and physical inactivity were adjusted in linear regression models. |
| Did the exposures between groups differ in components other than only total fat? | Low risk | |
| Can we be confident in the assessment of outcomes? | Low risk | Standard methods performed for measurements of weight, height and DEXA (by trained personnel). |
| Can we be confident in the assessment of exposure? | Low risk | Repeated 3‐day DR completed by mothers who were taught to describe and estimate portion sizes of child's food and beverage intake. Dietician reviewed food records with mother. |
| Can we be confident in the assessment of presence or absence of prognostic factors? | Unclear risk | Information on physical inactivity self‐reported and data collection method not well described. |
| Was selection of less‐exposed and more‐exposed groups from the same population? | Low risk | All children selected for 1 cohort study. |
| Methods | Study design: RCT (cohort analysis). Analyses methods for cohort: children divided into quintiles by mean caloric intake as fat. Repeated measures analyses of variance and covariance performed to compare changes in height‐for‐age z‐score, weight‐for‐age z‐score, weight‐for‐height median, sum of skinfolds, caloric intake and fat intake over time. Potential influence of age and sex assessed in these analyses. How were missing data handled? Attrition rate 5.8% (20/342). Authors stated that pattern of dropouts over time did not differ with respect to age, sex and ethnicity or study group. Because some children did not have available data for all 4 evaluation points, used BMDP‐5V for repeated measures ANOVA to include all possible participants. Number of study contacts: 4 (baseline, 3, 6 and 12 months). Period of follow‐up (total period of observation): 1 year. Periods of recruitment: 1990‐1992. Sample size justification adequately described? NR. Sampling method: convenience sample. Cholesterol screening programme conducted in 9 suburban paediatric practices to identify "at‐risk" children (plasma total cholesterol > 4.55 mmol/L). If mean LDL‐C was elevated (mean fasting plasma LDL‐C 2.77‐4.24 mmol/L for boys and 2.90‐4.24 mmol/L for girls) and children consented they were randomised into 1 of 2 nutrition education intervention groups or an at‐risk control group. Study objective: to evaluate growth of children with hypercholesterolaemia completing an innovative, physician‐initiated, home‐based nutrition education programme or standard nutrition counselling that aimed to lower dietary fat intake. Study population: children aged 4‐10 years with hypercholesterolaemia from suburban paediatric practices in Philadelphia, USA. | |
| Participants | Baseline characteristics (reported for 1 overall group)
Included criteria: children aged 3.9‐9.9 years with elevated plasma total cholesterol > 4.55 mmol/L, fasting plasma LDL‐C 2.77‐4.24 mmol/L for boys and 2.90‐4.24 mmol/L for girls; ≥ 85% of ideal bodyweight. Excluded criteria: secondary causes of hypercholesterolaemia; < 130% of ideal bodyweight. Pretreatment: NR. Brief description of participants: children aged 4‐10 years with hypercholesterolaemia. Total number completed in RCT: intervention group: n = 73/86 and control group: n = 78/87. Total number randomised: n = 271. | |
| Interventions | Description of exposure for cohort
See Table 6; Table 7; Table 8; Table 9; Table 10; Table 11; Table 12; Table 13; Table 14; Table 15 for details of total fat intake exposure per outcome. | |
| Outcomes | Weight:
Skinfold thickness
| |
| Identification | Sponsorship source: National Heart, Lung, and Blood Institute (HL43880‐03), the Howard Heinz Endowment, and the University of Pennsylvania Research Foundation. Country: USA. Setting: suburban paediatric practice offices, Philadelphia, PA. Comments: NA. Author's name: Andrew M Tershakovec. Institution: Division of Gastroenterology and Nutrition, Children's Hospital of Philadelphia, PA, USA. Email: NR. Declaration of Interests: no. Study ID: Children's Health Project. Type of record: journal articles. | |
| Notes | ||
| Risk of bias | ||
| Bias | Authors' judgement | Support for judgement |
| Were adequate outcome data for cohorts available? | Unclear risk | 5.8% (20/342) lost over 1 year. Authors stated that pattern of dropouts over time did not differ with respect to age, sex and ethnicity or study group but no analyses provided. |
| Was there matching of less‐exposed and more‐exposed participants for prognostic factors associated with outcome or were relevant statistical adjustments done? | High risk | Data analyses only adjusted for age. |
| Did the exposures between groups differ in components other than only total fat? | High risk | Children allocated to intervention groups received various dietary interventions. |
| Can we be confident in the assessment of outcomes? | Low risk | Standardised methods used to assess height, weight and skinfold thickness. |
| Can we be confident in the assessment of exposure? | Low risk | Repeated dietary assessments done using 3 × 24‐hour dietary recalls per assessment period. |
| Can we be confident in the assessment of presence or absence of prognostic factors? | Low risk | Prognostic factors such as physical activity and parental BMI not assessed. |
| Was selection of less‐exposed and more‐exposed groups from the same population? | Low risk | All participants of an RCT (Children's Health Project) |
| Methods | Study design: RCT. Study grouping: parallel group. Allocation ratio: 1:1. Analyses methods: "Repeated measures analyses of variance and covariance compared group changes in growth over time related to the intervention (analysis 1) or dietary fat intake (analysis 3)." Description of randomisation: "At‐risk children who met the study criteria and agreed to participate were randomised to study groups using a permuted blocks within strata design. Stratifying on age and gender, we employed an adaptive allocation procedure that yielded balance within first order interactions with season and pediatric practice." Allocation concealment NR. NR who enrolled and assigned participants. How were missing data handled? "Because some subjects did not have available data for all four evaluation points, BMDP‐5V was used for the repeated measures analysis of variance to include all possible participants." Number of study contacts: 4. Period of follow‐up (from when duration of active intervention period ended): 9 months. Periods of recruitment: "Subject enrollment began in October 1990 and continued through December 1992." Sample size justification adequately described? NR. Sampling method: cholesterol screening programme conducted in 9 suburban paediatric practices to identify "at‐risk" children (plasma total cholesterol > 4.55 mmol/L). If mean LDL‐C was elevated (mean fasting plasma LDL‐C 2.77‐4.24 mmol/L for boys and 2.90‐4.24 mmol/L for girls) and children consented they were randomised into 1 of 2 nutrition education intervention groups or an at‐risk control group. Study objective: to evaluate the growth of children with hypercholesterolaemia completing an innovative, physician‐initiated, home‐based nutrition education program or standard nutrition counselling that aims to lower dietary fat intake. Study population: children with hypercholesterolaemia aged 4‐10 years from suburban paediatric practices in Philadelphia, PA, USA. | |
| Participants | Baseline characteristics (reported for 2 groups and overall group) Lower fat intake (≤ 30%TE)
Usual or modified fat intake
Overall
Included criteria: children aged 3.9‐9.9 years with elevated plasma total cholesterol > 4.55 mmol/L, fasting plasma LDL‐C 2.77‐4.24 mmol/L for boys and 2.90‐4.24 mmol/L for girls; ≥ 85% of ideal bodyweight. Excluded criteria: secondary causes of hypercholesterolaemia; < 130% of ideal bodyweight. Pretreatment: NR. Brief description of participants: children aged 4‐10 years with hypercholesterolaemia. Total number completed in RCT: intervention group: n = 73/86 and control group: n = 78/87. Total number randomised: n = 271. | |
| Interventions | Intervention characteristics Lower fat intake (≤ 30%TE)
Usual or modified fat intake
| |
| Outcomes | Weight
Height
| |
| Identification | Sponsorship source: National Heart, Lung, and Blood Institute (HL43880‐03), the Howard Heinz Endowment, and the University of Pennsylvania Research Foundation. Country: USA. Setting: suburban paediatric practice offices, Philadelphia, PA. Comments: NA. Author's name: Andrew M Tershakovec. Institution: Division of Gastroenterology and Nutrition, Children's Hospital of Philadelphia, PA, USA. Email: NR. Declaration of Interests: no. Study ID: Children's Health Project. Type of record: journal article. | |
| Notes | ||
| Risk of bias | ||
| Bias | Authors' judgement | Support for judgement |
| Random sequence generation (selection bias) | Unclear risk | Permuted blocks within strata design used with minimisation. Authors reported that at baseline, the 4 groups were balanced, except for race, but no statistical test for differences reported. |
| Allocation concealment (selection bias) | Unclear risk | NR. |
| Blinding of participants and personnel (performance bias) | Unclear risk | NR. |
| Incomplete outcome data (attrition bias) | High risk | Loss to follow‐up at 12 months: intervention group: 13/86 (15.1%) and control group: 9/87 (10.3%). Reasons for loss to follow‐up NR, except for withdrawal of consent (intervention group 4 and control group 2). Missing data not imputed but authors reported that BMDP‐5V was used for the repeated measures ANOVA to include all possible participants. |
| Selective reporting (reporting bias) | Unclear risk | Primary and secondary outcomes not clearly defined in methods. Study protocol not available. |
| Other bias | Unclear risk | Limited information on control diet prescription; unable to judge if prescribed diets being compared differed in components other than total fat. |
%TE: percentage of total energy intake; AAP: American Academy of Pediatrics; AHA: American Heart Association; ALSPAC: Avon Longitudinal Study of Parents and Children; ANOVA: analysis of variance; BC: body composition; BIA: bioelectrical impedance analysis; BMI: body mass index; BMI‐SDS: body mass index‐standard deviation score; BP: blood pressure; CDC: Centers for Disease Control and Prevention; CHD: coronary heart disease; CHO: carbohydrate; CI: confidence interval; CIF: Children in Focus; CVD: cardiovascular disease; DBP: diastolic blood pressure; DED: dietary energy density; DEXA: dual energy X‐ray absorptiometry; DONALD: Dortmund Nutritional and Anthropometric Longitudinally Designed; DP: dietary pattern; DR: dietary record; FD: fibre density; FFQ: Food Frequency Questionnaire; FM: fat mass; FMI: fat mass index; GEE: generalised estimating equation; GLM: general linear model; HDL‐C: high‐density lipoprotein cholesterol; HF: high fat; HOMA: Homeostasis Model Assessment; HOMA‐IR: Homeostasis Model Assessment‐Insulin Resistance; IFG: impaired fasting glucose; IQR: interquartile range; IR: insulin resistance; ITT: intention to treat; LDL‐C: low‐density lipoprotein cholesterol; LF: low fat; LTPA: leisure‐time physical activity; max: maximum; MD: mean difference; MET: metabolic equivalent; min: minimum; MUFA: monounsaturated fatty acid; n: number of participants; NA: not applicable; NCEP: National Centers for Environmental Prediction; NGHS: National Heart, Lung and Blood institute Growth and Health Study; NHLBI: National Heart, Lung and Blood Institute; NR: not reported; NS: not significant; PEP: Prevention Education Program; PUFA: polyunsaturated fatty acid; RCT: randomised controlled trial; SBP: systolic blood pressure; SD: standard deviation; SDS: standard deviation score; SE: standard error; SES: socioeconomic status; SFA: saturated fatty acid; SS‐SDS: subscapular skinfold‐standard deviation score; STRIP: Special Turku Coronary Risk Factor Intervention Project; T2DM: type 2 diabetes mellitus; TAAG: Trial of Activity for Adolescent Girls Cohort; TC‐SDS: triceps skinfold‐standard deviation score; TG: triglyceride; TV: television; WC: waist circumference.
Characteristics of excluded studies [ordered by study ID]
| Study | Reason for exclusion |
| Wrong exposure. | |
| Wrong intervention. | |
| Wrong study design; did not analyse children's baseline total fat intake to body fatness 12 months later. | |
| Wrong study design; cross‐sectional. | |
| Wrong study design; did not analyse children's baseline total fat intake to body fatness 12 months later. | |
| Wrong intervention. | |
| Wrong study design; did not analyse children's baseline total fat intake to body fatness 12 months later. | |
| Wrong study design; did not analyse children's baseline total fat intake to body fatness 12 months later. | |
| Wrong study design; did not analyse children's baseline total fat intake to body fatness 12 months later. | |
| No eligible outcomes reported AND our outcomes fell outside scope of study. | |
| Wrong duration. | |
| Wrong study design; did not analyse children's baseline total fat intake to body fatness 12 months later. | |
| Wrong study design; cross‐sectional. | |
| Wrong intervention. | |
| Wrong duration. | |
| Wrong duration. | |
| Wrong study design; did not analyse children's baseline total fat intake to body fatness 12 months later. | |
| Wrong exposure. | |
| No eligible comparison. | |
| Wrong study design; did not analyse children's baseline total fat intake to body fatness 12 months later. | |
| Wrong study design; did not analyse children's baseline total fat intake to body fatness 12 months later. | |
| No eligible comparison. | |
| Wrong study design; did not analyse children's baseline total fat intake to body fatness 12 months later. | |
| Wrong study design; did not analyse children's baseline total fat intake to body fatness 12 months later. | |
| Wrong study design; did not analyse children's baseline total fat intake to body fatness 12 months later. | |
| Wrong study design; did not analyse children's baseline total fat intake to body fatness 12 months later. | |
| Wrong intervention. | |
| Wrong study design; analysed twin pairs. | |
| Wrong intervention. | |
| Wrong study design; did not analyse children's baseline total fat intake to body fatness 12 months later. | |
| Wrong study design; cross‐sectional. | |
| Wrong intervention. | |
| Wrong study design; review. | |
| Wrong study design; review. | |
| Wrong comparator. | |
| No eligible outcomes reported AND our outcomes fell outside scope of study. | |
| Duplicate. | |
| Wrong study design; did not analyse children's baseline total fat intake to body fatness 12 months later. | |
| Wrong duration. | |
| Wrong duration. | |
| Wrong intervention. | |
| Duplicate. | |
| Wrong study design; did not analyse children's baseline total fat intake to body fatness 12 months later. | |
| No eligible outcomes reported AND our outcomes fell outside scope of study. | |
| Wrong study design; not RCT. | |
| Wrong intervention. | |
| Wrong study design; did not analyse children's baseline total fat intake to body fatness 12 months later. | |
| Wrong study design; did not analyse children's baseline total fat intake to body fatness 12 months later. | |
| Wrong intervention. | |
| Wrong intervention. | |
| No eligible outcomes reported AND our eligible outcomes fell outside scope of study. | |
| Wrong study design; did not analyse children's baseline total fat intake to body fatness 12 months later. | |
| Wrong study design; did not analyse children's baseline total fat intake to body fatness 12 months later. | |
| Wrong intervention. | |
| Wrong study design; did not analyse children's baseline total fat intake to body fatness 12 months later. | |
| Wrong study design; analysed twin pairs. | |
| Wrong study design; did not analyse children's baseline total fat intake to body fatness 12 months later. | |
| Wrong study design; did not analyse children's baseline total fat intake to body fatness 12 months later. | |
| Wrong study design; did not analyse children's baseline total fat intake to body fatness 12 months later. | |
| Wrong study design; did not analyse children's baseline total fat intake to body fatness 12 months later. | |
| Wrong duration. | |
| Wrong study design; cross‐sectional. | |
| Wrong exposure. | |
| Wrong exposure. | |
| Wrong intervention. | |
| Wrong intervention. | |
| No eligible comparison. | |
| No eligible comparison. | |
| Wrong study design; did not analyse children's baseline total fat intake to body fatness 12 months later. | |
| Wrong study design; did not analyse children's baseline total fat intake to body fatness 12 months later. | |
| Wrong study design; did not analyse children's baseline total fat intake to body fatness 12 months later. | |
| Wrong study design; did not analyse children's baseline total fat intake to body fatness 12 months later. | |
| Wrong study design; did not analyse children's baseline total fat intake to body fatness 12 months later. | |
| Wrong study design; did not analyse children's baseline total fat intake to body fatness 12 months later. | |
| Wrong study design; did not analyse children's baseline total fat intake to body fatness 12 months later. | |
| Wrong study design; did not analyse children's baseline total fat intake to body fatness 12 months later. | |
| Wrong study design; did not analyse children's baseline total fat intake to body fatness 12 months later. | |
| Wrong intervention. | |
| Wrong intervention. | |
| Wrong intervention. | |
| Wrong study design; did not analyse children's baseline total fat intake to body fatness 12 months later. | |
| Duplicate | |
| Wrong study design; did not analyse children's baseline total fat intake to body fatness 12 months later. | |
| Wrong study design; did not analyse children's baseline total fat intake to body fatness 12 months later. | |
| Wrong duration. | |
| Wrong study design; did not analyse children's baseline total fat intake to body fatness 12 months later. | |
| Wrong study design; did not analyse children's baseline total fat intake to body fatness 12 months later. | |
| Wrong intervention. | |
| Wrong intervention. | |
| Wrong intervention. | |
| Wrong intervention. | |
| Wrong intervention. | |
| Wrong study design; did not analyse children's baseline total fat intake to body fatness 12 months later. | |
| Wrong intervention. | |
| Wrong study design; cross‐sectional. | |
| Wrong study design; used baseline data to predict outcomes without including data from the later time point. | |
| Wrong study design; did not analyse children's baseline total fat intake to body fatness 12 months later. | |
| Wrong study design; cross‐sectional. | |
| Wrong intervention. | |
| Wrong intervention. | |
| Wrong intervention. | |
| Wrong intervention. | |
| Wrong intervention. | |
| Wrong study design; analysed twin pairs. | |
| Wrong study design; did not analyse children's baseline total fat intake to body fatness 12 months later. | |
| Wrong study design; did not analyse children's baseline total fat intake to body fatness 12 months later. | |
| Wrong intervention. | |
| Wrong intervention. | |
| Wrong intervention. | |
| Wrong intervention. | |
| Wrong study design; did not analyse children's baseline total fat intake to body fatness 12 months later. | |
| Wrong study population. | |
| Wrong study design; did not analyse children's baseline total fat intake to body fatness 12 months later. | |
| Wrong exposure. | |
| Wrong intervention. | |
| Wrong study design; not RCT. | |
| Wrong duration. | |
| Wrong intervention. | |
| Wrong intervention. | |
| Wrong study design; did not analyse children's baseline total fat intake to body fatness 12 months later. | |
| Wrong study design; did not analyse children's baseline total fat intake to body fatness 12 months later. | |
| Wrong study population. | |
| Wrong intervention. | |
| Wrong intervention. | |
| Wrong intervention. | |
| Wrong intervention. | |
| Wrong study design; did not analyse children's baseline total fat intake to body fatness 12 months later. | |
| Wrong study design; did not analyse children's baseline total fat intake to body fatness 12 months later. | |
| Wrong intervention. | |
| Wrong duration. | |
| Wrong intervention. | |
| Wrong intervention. | |
| Wrong study design; did not analyse children's baseline total fat intake to body fatness 12 months later. | |
| Wrong study design; case‐control. | |
| Wrong study design; did not analyse children's baseline total fat intake to body fatness 12 months later. | |
| Wrong intervention. | |
| Wrong intervention. | |
| Wrong study design; did not analyse children's baseline total fat intake to body fatness 12 months later. | |
| Wrong study population. | |
| Wrong study design; did not analyse children's baseline total fat intake to body fatness 12 months later. | |
| Wrong study design; not RCT. | |
| Wrong study design; not RCT. | |
| Wrong study design; not RCT. | |
| Wrong study design; not RCT. | |
| Wrong intervention. | |
| Wrong study design; did not analyse children's baseline total fat intake to body fatness 12 months later. | |
| Wrong study design; did not analyse children's baseline total fat intake to body fatness 12 months later. |
RCT: randomised controlled trial.
Characteristics of studies awaiting assessment [ordered by study ID]
| Methods | Study design: prospective cohort study. Analyses methods for cohorts: NR. How were missing data handled? NR. Number of study contacts? 2 (baseline‐5 years and 9 years). Period of follow‐up: 4 years. Periods of recruitment: NR. Sample size justification adequately described? No. Sampling method: NR. Study objective: to identify the developmental trajectories of BMI during childhood and identify dietary factors associated with trajectory membership. Study population: children aged 5 years in Ireland. |
| Participants | Baseline characteristics: NR. Included criteria: children from the Lifeways Cross‐Generation birth cohort study with height and weight measurements at 5 and 9 years of age. Excluded criteria: NR. Brief description of participants: children aged 5 years who were participants of the Lifeways Cross‐Generation birth cohort study, Ireland. Total number completed in cohort study: 194 children (at age 9 years). Total number enrolled in cohort study: 194 children (at age 5 years). |
| Interventions | Description of exposure for cohorts:
|
| Outcomes | NR |
| Notes | We were unable to retrieve a full‐text publication of this study, only 2 conference abstracts. We contacted the authors and requested data analyses reporting the relationship between baseline total fat intake in children and absolute or change in body fatness outcomes after at least 1 year' follow‐up. We had not received a response by time of publication. |
| Methods | Study design: prospective cohort study. Analyses methods for cohorts: multiple dietary assessments. Analyses: 1st‐order autoregressive model (fatness at each time point related to exposure at previous time point) estimated by GEEs) with the within‐subject correlations taken into account using GEEs. How were missing data handled? 24% (233/307) lost to follow‐up over 1st 4 years of study. Comparisons between dropouts and remaining participants revealed no selective dropout after 1st year in relation to anthropometric variables, nutrition intake and physical activity. Number of study contacts? 4 (baseline‐13 years, 14 years, 15 years, and 16 years). Period of follow‐up: 3 years. Periods of recruitment: 1977. Sample size justification adequately described ‐ yes/no? The AGAHLS study included 698 children from 2 equally large secondary schools in Amsterdam. Schools selected based on location, i.e. 1 of the schools in a rural area, the other in an urban area, as being representative of the Dutch adolescent population of the 1970s. Sampling method: convenience. Healthy pupils from the 1st and 2nd years of 1 secondary school in Amsterdam. Study objective: to analyse longitudinal relationships between BMI/SSF, and biological and lifestyle risk factors for coronary heart disease. Study population: boys and girls aged 13 years in Amsterdam. |
| Participants | Baseline characteristics (overall)
Included criteria: healthy boys and girls aged 13 years. Excluded criteria: NR. Pretreatment: NA. Brief description of participants: healthy, Dutch school children aged 13 years with above average socioeconomic status who were participants of the Amsterdam Growth Health Longitudinal Study. Total number completed in cohort study: 233 (102 boys, 131 girls) completed 4 annual measurements. Total number enrolled in cohort study: 307 (148 boys, 159 girls). |
| Interventions | Description of exposure for cohorts Time span: 4 years. Dietary assessment method used: cross‐checked, dietary history interview. Frequency of dietary assessments: 1 assessment at each follow‐up visit (at 14, 15 and 16 years). |
| Outcomes | Regression data reported in a graph. |
| Notes | We contacted the authors about the data at ages 14, 15 and 16 years, but had not received this by time of publication, and thus could not classify this study. |
AGAHLS: Amsterdam Growth and Health Longitudinal Study; BMI: body mass index; FFQ: Food Frequency Questionnaire; GEE: generalised estimating equation; NA: not available; NR: not reported; SD: standard deviation; SSF: sum of skinfolds.
Data and analyses
| Outcome or subgroup title | No. of studies | No. of participants | Statistical method | Effect size |
| 1 Weight outcomes (standardised and unstandardised end values) Show forest plot | 2 | Mean Difference (IV, Fixed, 95% CI) | Totals not selected | |
| Analysis 1.1  Comparison 1 Lower fat intake (30% or less of total energy (TE)) versus usual/modified fat intake by time point ranges, Outcome 1 Weight outcomes (standardised and unstandardised end values). | ||||
| 1.1 6 months | 1 | Mean Difference (IV, Fixed, 95% CI) | 0.0 [0.0, 0.0] | |
| 1.2 > 6 to 12 months | 2 | Mean Difference (IV, Fixed, 95% CI) | 0.0 [0.0, 0.0] | |
| 1.3 > 2 to 5 years | 1 | Mean Difference (IV, Fixed, 95% CI) | 0.0 [0.0, 0.0] | |
| 2 Body mass index (BMI) (kg/m2) (end values) Show forest plot | 2 | Mean Difference (IV, Fixed, 95% CI) | Totals not selected | |
| Analysis 1.2  Comparison 1 Lower fat intake (30% or less of total energy (TE)) versus usual/modified fat intake by time point ranges, Outcome 2 Body mass index (BMI) (kg/m2) (end values). | ||||
| 2.1 > 6 to 12 months | 1 | Mean Difference (IV, Fixed, 95% CI) | 0.0 [0.0, 0.0] | |
| 2.2 > 1 to 2 years | 1 | Mean Difference (IV, Fixed, 95% CI) | 0.0 [0.0, 0.0] | |
| 2.3 > 2 to 5 years | 1 | Mean Difference (IV, Fixed, 95% CI) | 0.0 [0.0, 0.0] | |
| 2.4 > 5 years | 1 | Mean Difference (IV, Fixed, 95% CI) | 0.0 [0.0, 0.0] | |
| 3 BMI (kg/m2) (end values): sensitivity analysis (longest follow‐up data only) Show forest plot | 2 | Mean Difference (IV, Fixed, 95% CI) | Totals not selected | |
| Analysis 1.3  Comparison 1 Lower fat intake (30% or less of total energy (TE)) versus usual/modified fat intake by time point ranges, Outcome 3 BMI (kg/m2) (end values): sensitivity analysis (longest follow‐up data only). | ||||
| 3.1 > 1 to 2 years | 1 | Mean Difference (IV, Fixed, 95% CI) | 0.0 [0.0, 0.0] | |
| 3.2 > 5 years | 1 | Mean Difference (IV, Fixed, 95% CI) | 0.0 [0.0, 0.0] | |
| 4 BMI (kg/m2) (end values): sensitivity analysis (shortest follow‐up data only) Show forest plot | 2 | Mean Difference (IV, Fixed, 95% CI) | Totals not selected | |
| Analysis 1.4 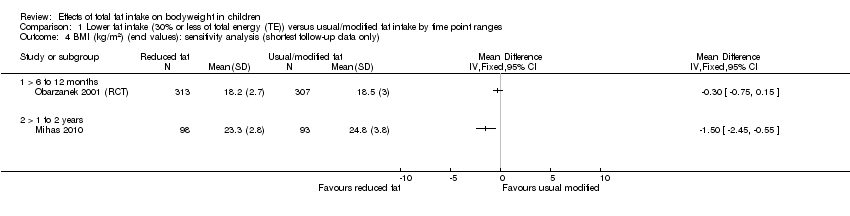 Comparison 1 Lower fat intake (30% or less of total energy (TE)) versus usual/modified fat intake by time point ranges, Outcome 4 BMI (kg/m2) (end values): sensitivity analysis (shortest follow‐up data only). | ||||
| 4.1 > 6 to 12 months | 1 | Mean Difference (IV, Fixed, 95% CI) | 0.0 [0.0, 0.0] | |
| 4.2 > 1 to 2 years | 1 | Mean Difference (IV, Fixed, 95% CI) | 0.0 [0.0, 0.0] | |
| 5 Total cholesterol (mmol/L) (end values) Show forest plot | 1 | Mean Difference (IV, Fixed, 95% CI) | Totals not selected | |
| Analysis 1.5 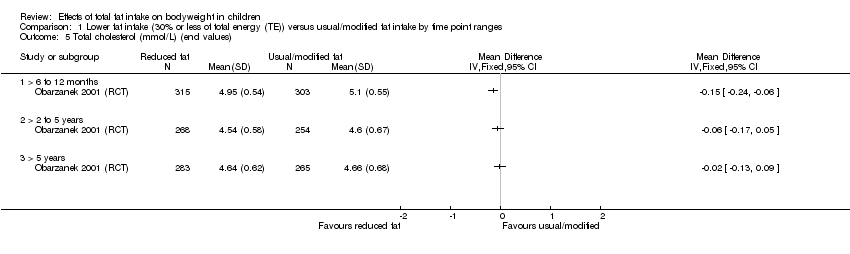 Comparison 1 Lower fat intake (30% or less of total energy (TE)) versus usual/modified fat intake by time point ranges, Outcome 5 Total cholesterol (mmol/L) (end values). | ||||
| 5.1 > 6 to 12 months | 1 | Mean Difference (IV, Fixed, 95% CI) | 0.0 [0.0, 0.0] | |
| 5.2 > 2 to 5 years | 1 | Mean Difference (IV, Fixed, 95% CI) | 0.0 [0.0, 0.0] | |
| 5.3 > 5 years | 1 | Mean Difference (IV, Fixed, 95% CI) | 0.0 [0.0, 0.0] | |
| 6 Low‐density lipoprotein (LDL) cholesterol (mmol/L) Show forest plot | 1 | Mean Difference (IV, Fixed, 95% CI) | Totals not selected | |
| Analysis 1.6 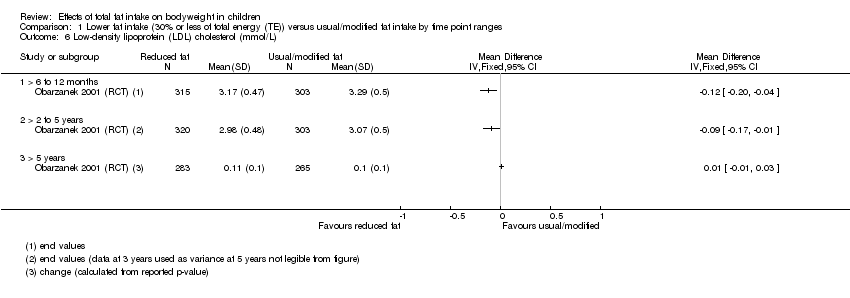 Comparison 1 Lower fat intake (30% or less of total energy (TE)) versus usual/modified fat intake by time point ranges, Outcome 6 Low‐density lipoprotein (LDL) cholesterol (mmol/L). | ||||
| 6.1 > 6 to 12 months | 1 | Mean Difference (IV, Fixed, 95% CI) | 0.0 [0.0, 0.0] | |
| 6.2 > 2 to 5 years | 1 | Mean Difference (IV, Fixed, 95% CI) | 0.0 [0.0, 0.0] | |
| 6.3 > 5 years | 1 | Mean Difference (IV, Fixed, 95% CI) | 0.0 [0.0, 0.0] | |
| 7 High‐density lipoprotein (HDL)‐cholesterol (mmol) (end values) Show forest plot | 1 | Mean Difference (IV, Fixed, 95% CI) | Totals not selected | |
| Analysis 1.7  Comparison 1 Lower fat intake (30% or less of total energy (TE)) versus usual/modified fat intake by time point ranges, Outcome 7 High‐density lipoprotein (HDL)‐cholesterol (mmol) (end values). | ||||
| 7.1 > 6 to 12 months | 1 | Mean Difference (IV, Fixed, 95% CI) | 0.0 [0.0, 0.0] | |
| 7.2 > 2 to 5 years | 1 | Mean Difference (IV, Fixed, 95% CI) | 0.0 [0.0, 0.0] | |
| 7.3 > 5 years | 1 | Mean Difference (IV, Fixed, 95% CI) | 0.0 [0.0, 0.0] | |
| 8 Triglycerides (mmol/L) (end values) Show forest plot | 1 | Mean Difference (IV, Fixed, 95% CI) | Totals not selected | |
| Analysis 1.8 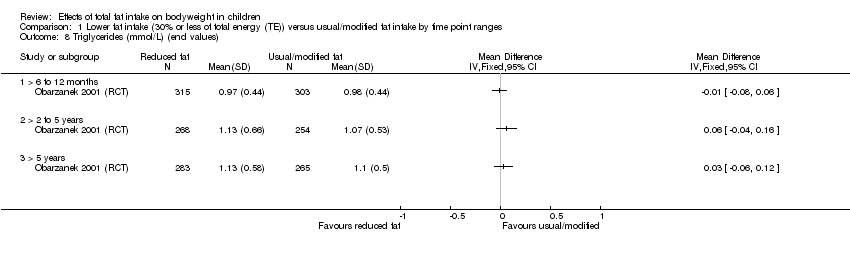 Comparison 1 Lower fat intake (30% or less of total energy (TE)) versus usual/modified fat intake by time point ranges, Outcome 8 Triglycerides (mmol/L) (end values). | ||||
| 8.1 > 6 to 12 months | 1 | Mean Difference (IV, Fixed, 95% CI) | 0.0 [0.0, 0.0] | |
| 8.2 > 2 to 5 years | 1 | Mean Difference (IV, Fixed, 95% CI) | 0.0 [0.0, 0.0] | |
| 8.3 > 5 years | 1 | Mean Difference (IV, Fixed, 95% CI) | 0.0 [0.0, 0.0] | |
| 9 Systolic blood pressure (mmHg) (end values) Show forest plot | 1 | Mean Difference (IV, Fixed, 95% CI) | Totals not selected | |
| Analysis 1.9 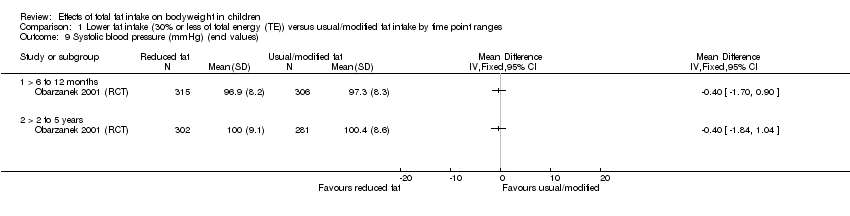 Comparison 1 Lower fat intake (30% or less of total energy (TE)) versus usual/modified fat intake by time point ranges, Outcome 9 Systolic blood pressure (mmHg) (end values). | ||||
| 9.1 > 6 to 12 months | 1 | Mean Difference (IV, Fixed, 95% CI) | 0.0 [0.0, 0.0] | |
| 9.2 > 2 to 5 years | 1 | Mean Difference (IV, Fixed, 95% CI) | 0.0 [0.0, 0.0] | |
| 10 Diastolic blood pressure (mmHg) (end values) Show forest plot | 1 | Mean Difference (IV, Fixed, 95% CI) | Totals not selected | |
| Analysis 1.10  Comparison 1 Lower fat intake (30% or less of total energy (TE)) versus usual/modified fat intake by time point ranges, Outcome 10 Diastolic blood pressure (mmHg) (end values). | ||||
| 10.1 > 6 to 12 months | 1 | Mean Difference (IV, Fixed, 95% CI) | 0.0 [0.0, 0.0] | |
| 10.2 > 2 to 5 years | 1 | Mean Difference (IV, Fixed, 95% CI) | 0.0 [0.0, 0.0] | |
| 11 Height outcomes (standardised and unstandardised end values) Show forest plot | 2 | Mean Difference (IV, Fixed, 95% CI) | Totals not selected | |
| Analysis 1.11  Comparison 1 Lower fat intake (30% or less of total energy (TE)) versus usual/modified fat intake by time point ranges, Outcome 11 Height outcomes (standardised and unstandardised end values). | ||||
| 11.1 6 months | 1 | Mean Difference (IV, Fixed, 95% CI) | 0.0 [0.0, 0.0] | |
| 11.2 > 6 to 12 months | 2 | Mean Difference (IV, Fixed, 95% CI) | 0.0 [0.0, 0.0] | |
| 11.3 > 2 to 5 years | 1 | Mean Difference (IV, Fixed, 95% CI) | 0.0 [0.0, 0.0] | |
| 11.4 > 5 years | 1 | Mean Difference (IV, Fixed, 95% CI) | 0.0 [0.0, 0.0] | |
| 12 Energy intake (kJ) (end values) Show forest plot | 2 | Mean Difference (IV, Fixed, 95% CI) | Totals not selected | |
| Analysis 1.12 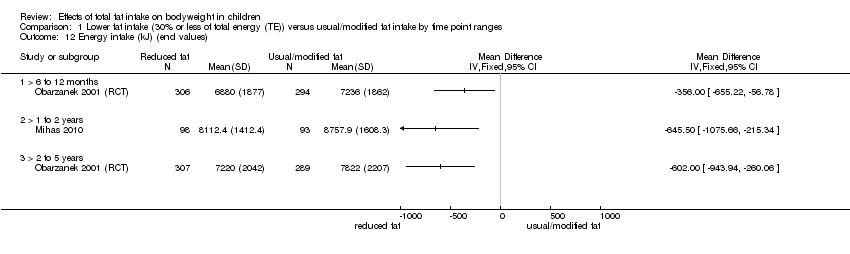 Comparison 1 Lower fat intake (30% or less of total energy (TE)) versus usual/modified fat intake by time point ranges, Outcome 12 Energy intake (kJ) (end values). | ||||
| 12.1 > 6 to 12 months | 1 | Mean Difference (IV, Fixed, 95% CI) | 0.0 [0.0, 0.0] | |
| 12.2 > 1 to 2 years | 1 | Mean Difference (IV, Fixed, 95% CI) | 0.0 [0.0, 0.0] | |
| 12.3 > 2 to 5 years | 1 | Mean Difference (IV, Fixed, 95% CI) | 0.0 [0.0, 0.0] | |
| 13 Fat intake (%TE) (end values) Show forest plot | 2 | Mean Difference (IV, Fixed, 95% CI) | Totals not selected | |
| Analysis 1.13  Comparison 1 Lower fat intake (30% or less of total energy (TE)) versus usual/modified fat intake by time point ranges, Outcome 13 Fat intake (%TE) (end values). | ||||
| 13.1 > 6 to 12 months | 1 | Mean Difference (IV, Fixed, 95% CI) | 0.0 [0.0, 0.0] | |
| 13.2 > 1 to 2 years | 1 | Mean Difference (IV, Fixed, 95% CI) | 0.0 [0.0, 0.0] | |
| 13.3 > 2 to 5 years | 1 | Mean Difference (IV, Fixed, 95% CI) | 0.0 [0.0, 0.0] | |
| 14 Saturated fat intake (%TE) (end values) Show forest plot | 2 | Mean Difference (IV, Fixed, 95% CI) | Totals not selected | |
| Analysis 1.14  Comparison 1 Lower fat intake (30% or less of total energy (TE)) versus usual/modified fat intake by time point ranges, Outcome 14 Saturated fat intake (%TE) (end values). | ||||
| 14.1 > 6 to 12 months | 1 | Mean Difference (IV, Fixed, 95% CI) | 0.0 [0.0, 0.0] | |
| 14.2 > 1 to 2 years | 1 | Mean Difference (IV, Fixed, 95% CI) | 0.0 [0.0, 0.0] | |
| 14.3 > 2 to 5 years | 1 | Mean Difference (IV, Fixed, 95% CI) | 0.0 [0.0, 0.0] | |
| 15 Protein intake (%TE) (end values) Show forest plot | 2 | Mean Difference (IV, Fixed, 95% CI) | Totals not selected | |
| Analysis 1.15 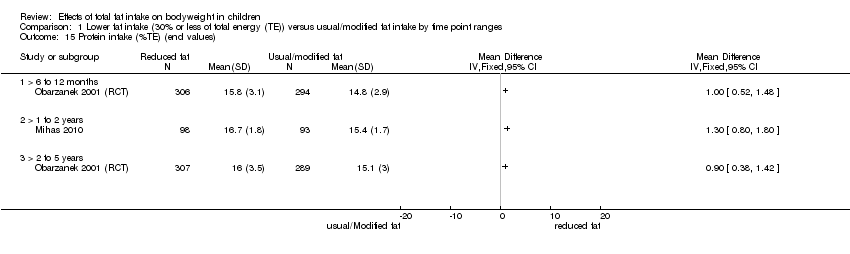 Comparison 1 Lower fat intake (30% or less of total energy (TE)) versus usual/modified fat intake by time point ranges, Outcome 15 Protein intake (%TE) (end values). | ||||
| 15.1 > 6 to 12 months | 1 | Mean Difference (IV, Fixed, 95% CI) | 0.0 [0.0, 0.0] | |
| 15.2 > 1 to 2 years | 1 | Mean Difference (IV, Fixed, 95% CI) | 0.0 [0.0, 0.0] | |
| 15.3 > 2 to 5 years | 1 | Mean Difference (IV, Fixed, 95% CI) | 0.0 [0.0, 0.0] | |
| 16 Carbohydrate (%TE) (end values) Show forest plot | 2 | Mean Difference (IV, Fixed, 95% CI) | Totals not selected | |
| Analysis 1.16  Comparison 1 Lower fat intake (30% or less of total energy (TE)) versus usual/modified fat intake by time point ranges, Outcome 16 Carbohydrate (%TE) (end values). | ||||
| 16.1 > 6 to 12 months | 1 | Mean Difference (IV, Fixed, 95% CI) | 0.0 [0.0, 0.0] | |
| 16.2 > 1 to 2 years | 1 | Mean Difference (IV, Fixed, 95% CI) | 0.0 [0.0, 0.0] | |
| 16.3 > 2 to 5 years | 1 | Mean Difference (IV, Fixed, 95% CI) | 0.0 [0.0, 0.0] | |
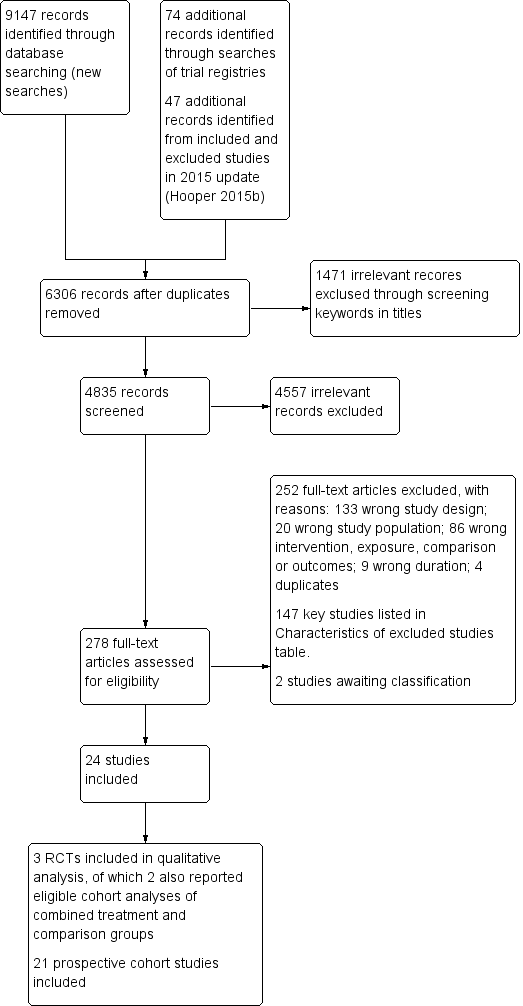
Study flow diagram. RCT: randomised controlled trial.

The bubble‐plot presents the spread of the different ways in which total fat intake estimates were expressed and applied to examine associations with body fatness in the 81 analyses, reporting primary outcomes in the five time point ranges. Combining the many various total fat intake exposure estimates reporting on the same outcome in the same time point range was deemed inappropriate. BMI: body mass index; WC: waist circumference; yr: year.

Risk of bias graph: review authors' judgements about each risk of bias item presented as percentages across all included studies.

Risk of bias summary: review authors' judgements about each risk of bias item for each included study. RCT: randomised controlled trial.

Comparison 1 Lower fat intake (30% or less of total energy (TE)) versus usual/modified fat intake by time point ranges, Outcome 1 Weight outcomes (standardised and unstandardised end values).
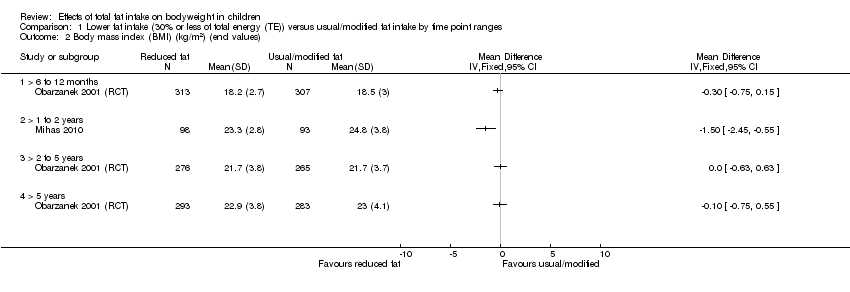
Comparison 1 Lower fat intake (30% or less of total energy (TE)) versus usual/modified fat intake by time point ranges, Outcome 2 Body mass index (BMI) (kg/m2) (end values).

Comparison 1 Lower fat intake (30% or less of total energy (TE)) versus usual/modified fat intake by time point ranges, Outcome 3 BMI (kg/m2) (end values): sensitivity analysis (longest follow‐up data only).

Comparison 1 Lower fat intake (30% or less of total energy (TE)) versus usual/modified fat intake by time point ranges, Outcome 4 BMI (kg/m2) (end values): sensitivity analysis (shortest follow‐up data only).

Comparison 1 Lower fat intake (30% or less of total energy (TE)) versus usual/modified fat intake by time point ranges, Outcome 5 Total cholesterol (mmol/L) (end values).

Comparison 1 Lower fat intake (30% or less of total energy (TE)) versus usual/modified fat intake by time point ranges, Outcome 6 Low‐density lipoprotein (LDL) cholesterol (mmol/L).

Comparison 1 Lower fat intake (30% or less of total energy (TE)) versus usual/modified fat intake by time point ranges, Outcome 7 High‐density lipoprotein (HDL)‐cholesterol (mmol) (end values).

Comparison 1 Lower fat intake (30% or less of total energy (TE)) versus usual/modified fat intake by time point ranges, Outcome 8 Triglycerides (mmol/L) (end values).

Comparison 1 Lower fat intake (30% or less of total energy (TE)) versus usual/modified fat intake by time point ranges, Outcome 9 Systolic blood pressure (mmHg) (end values).

Comparison 1 Lower fat intake (30% or less of total energy (TE)) versus usual/modified fat intake by time point ranges, Outcome 10 Diastolic blood pressure (mmHg) (end values).

Comparison 1 Lower fat intake (30% or less of total energy (TE)) versus usual/modified fat intake by time point ranges, Outcome 11 Height outcomes (standardised and unstandardised end values).

Comparison 1 Lower fat intake (30% or less of total energy (TE)) versus usual/modified fat intake by time point ranges, Outcome 12 Energy intake (kJ) (end values).

Comparison 1 Lower fat intake (30% or less of total energy (TE)) versus usual/modified fat intake by time point ranges, Outcome 13 Fat intake (%TE) (end values).
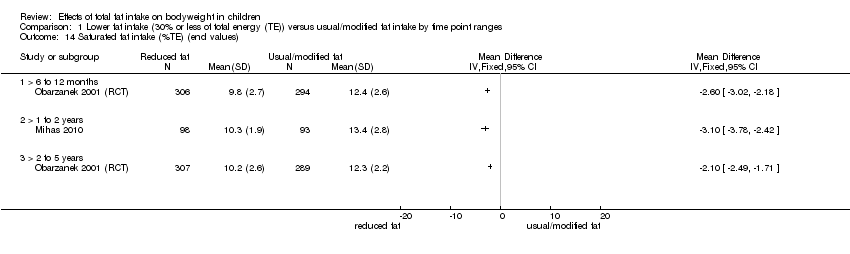
Comparison 1 Lower fat intake (30% or less of total energy (TE)) versus usual/modified fat intake by time point ranges, Outcome 14 Saturated fat intake (%TE) (end values).

Comparison 1 Lower fat intake (30% or less of total energy (TE)) versus usual/modified fat intake by time point ranges, Outcome 15 Protein intake (%TE) (end values).
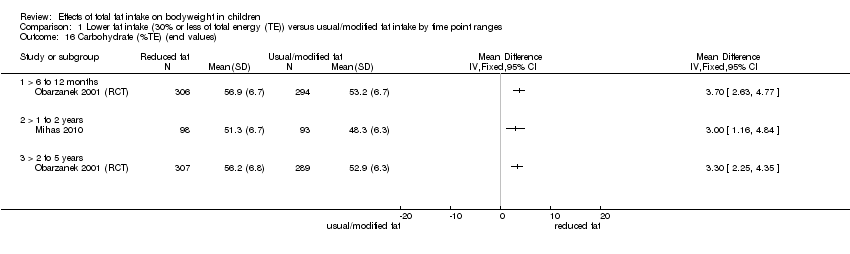
Comparison 1 Lower fat intake (30% or less of total energy (TE)) versus usual/modified fat intake by time point ranges, Outcome 16 Carbohydrate (%TE) (end values).
| Total fat intake ≤ 30% of total energy compared to usual fat intake for bodyweight in children (RCTs) A comprehensive table including data for all time points for each outcome can be found in Appendix 2 | |||||
| Patient or population: boys and girls aged 24 months to 18 years Setting: paediatric practices, schools and health maintenance organisations in high‐income countries Intervention: lower total fat intake ≤ 30%TE Comparison: usual or modified fat intake | |||||
| Outcomes (at time point ranges where data were reported) | No of participants (No of studies) | Illustrated comparative effect (95% CI) | Quality | What happens | |
| Usual fat intake1 | Effect difference with total fat ≤ 30% of total energy2 | ||||
| Weight‐for‐age z‐score Follow‐up: range 6 to 12 months | 151 (1 RCT) | The mean weight‐for‐age z‐score in control group was 0.29 | MD 0.18 lower | ⊕⊝⊝⊝ | We were uncertain whether lower total fat intake (≤ 30%TE) had an effect on weight‐for‐age in children over a 12‐month period (1 study). |
| Weight (kg) | 620 (1 RCT) | The mean weight (kg) in control group was 38.2 | MD 0.5 lower | ⊕⊕⊝⊝ | Lower total fat intake (≤ 30%TE) may have made little or no difference to weight in children over a 5‐year period (1 study). |
| Follow‐up: range 2 to 5 years | 612 (1 RCT) | The mean weight (kg) in control group was 49.5 | MD 0.6 lower | ⊕⊕⊝⊝ | |
| BMI (kg/m2) | 620 (1 RCT) | The mean BMI (kg/m2) in control group was 18.5 | MD 0.3 lower | ⊕⊕⊝⊝ | Lower total fat intake (≤ 30%TE) may have made little or no difference to BMI in children over a 1‐year period (1 study). |
| Follow‐up: range 1 to 2 years | 191 (1 RCT) | The mean BMI (kg/m2) in control group was 24.8 | MD 1.5 lower | ⊕⊕⊕⊝ | Lower total fat intake (≤ 30%TE) probably reduced BMI in children over a period of 1 to 2 years (1 study). |
| Follow‐up: range 2 to 5 years | 541 (1 RCT) | The mean BMI (kg/m2) in control group was 21.7 | MD 0 | ⊕⊕⊝⊝ | Lower total fat intake (≤ 30%TE) may have made little or no difference to BMI in children over a 2 to 5‐year period and > 5‐years (1 study). Please see Appendix 2 for Data for > 5 years. |
| Total cholesterol (mmol/L) | 618 (1 RCT) | The mean total cholesterol (mmol/L) in control group was 5.1 | MD 0.15 lower | ⊕⊕⊕⊝ | Total fat intake ≤ 30%TE probably slightly reduced total cholesterol in children over a 12‐month period (1 study). |
| Follow‐up: range 2 to 5 years | 522 (1 RCT) | The mean total cholesterol (mmol/L) in control group was 4.6 | MD 0.06 lower | ⊕⊕⊝⊝ | Lower total fat intake (≤ 30%TE) may have made little or no difference to total cholesterol in children over a 2 to 5‐year period and > 5‐years (1 study). Please see Appendix 2 for Data for > 5 years. |
| LDL‐C (mmol/L) | 618 (1 RCT) | The mean LDL‐C (mmol/L) in control group was 3.29 | MD 0.12 lower | ⊕⊕⊕⊝ | Lower total fat intake (≤ 30%TE) probably reduced LDL‐C in children over a 12‐month period (1 study) and over a 2 to 5‐year period (1 study). Please see Appendix 2 for Data for > 5 years. |
| Follow‐up: range 2 to 5 years | 623 (1 RCT) | The mean LDL‐C (mmol/L) in control group was 3.07 | MD 0.09 lower | ⊕⊕⊕⊝ | |
| HDL‐C (mmol/L) | 618 (1 RCT) | The mean HDL‐C (mmol/L) in control group was 1.47 | MD 0.03 lower | ⊕⊕⊕⊝ | Lower total fat intake (≤ 30%TE) probably made little or no difference to HDL‐C in children over a 6 to 12‐month period (1 study) and over a 2 to 5‐year period (1 study). Please see Appendix 2 for Data for > 5 years. |
| Follow‐up: range 2 to 5 years | 522 (1 RCT) | The mean HDL‐C (mmol/L) in control group was 1.32 | MD 0.01 lower | ⊕⊕⊕⊝ | |
| Triglycerides (mmol/L) | 618 (1 RCT) | The mean triglycerides (mmol/L) in control group was 0.98 | MD 0.01 lower | ⊕⊕⊕⊝ | Lower total fat intake (≤ 30%TE) probably made little or no difference to triglycerides in children over a 6 to 12‐month period (1 study). Please see Appendix 2 for Data for > 2 years. |
| Height‐for‐age z‐score Follow‐up: range 6 to 12 months | 151 (1 RCT) | The mean height‐for‐age z‐score in control group was 0.05 | MD 0.05 lower | ⊕⊝⊝⊝ | We were uncertain whether lower total fat intake (≤ 30%TE) reduced height‐for‐age in children over a 12‐month period (1 study). |
| Height (cm) | 642 (1 RCT) | The mean height (cm) in control group was 143.1 | MD 0 | ⊕⊕⊝⊝ | Lower total fat intake (≤ 30%TE) may have made little or no difference to height in children over a period > 5 years (1 study). |
| Follow‐up: range 2 to 5 years | 540 (1 RCT) | The mean height (cm) in control group was 167.4 | MD 0.10 lower | ⊕⊕⊝⊝ | |
| %TE: percentage of total energy; BMI: body mass index; CI: confidence interval; HDL‐C: high‐density lipoprotein cholesterol; LDL‐C: low‐density lipoprotein cholesterol; MD: mean difference; RCT: randomised controlled trial. aNotes: For all outcomes, there were too few studies to assess publication bias. | |||||
| GRADE Working Group grades of evidence | |||||
| 1Mean change observed between baseline and follow‐up in the control group. 2Difference in intervention group (and its 95% confidence interval) was based on the assumed change in the comparison group (and its 95% confidence interval). 3Downgraded by 1 for risk of bias: unclear risk of bias across all domains. 4Only 1 study for this outcome, therefore we could not rate for inconsistency. 5Downgraded by 1 for indirectness: participants were children with raised blood lipids, thus results may not be directly generalisable to all children. 6Downgraded by 1 for imprecision: small sample size and confidence interval included no effect and important benefit or harm. 7Not downgraded for serious risk of bias; a well‐conducted trial (methods in place to minimise risk of selection, performance, detection, attrition and reporting bias). 8Downgraded by 1 for imprecision: confidence interval included no effect and important benefit or harm. 9Downgraded by 1 for risk of bias: allocation concealment not reported. 10Not downgraded for serious imprecision: both bounds of the confidence interval indicate benefit, and calculated optimal information size met (158 patients are required to have a 80% chance of detecting, as significant at the 5% level, an important decrease in BMI of 1.7 kg/m2 (the average of the change across the 50th to 97th percentiles in 12.5 year‐olds, as per BMI‐for‐age tables, Centers of Disease Control & Prevention, 2000). 11Not downgraded for serious imprecision: both bounds of the confidence interval indicate benefit. 12Not downgraded for serious imprecision: precise estimate of no effect. 13Downgraded by 1 for imprecision: small sample size (optimal information size not met). | |||||
| Total fat intake and bodyweightin children (cohort studies) A comprehensive table including data for all time points for each outcome can be found in Appendix 3 | ||||
| Patient or population: boys and girls aged 24 months to 18 years Setting: communities, schools, households, healthcare centres in high‐income countries Exposure: total fat intake | ||||
| Outcomes | No of studies (No of participants) | Impact | Quality | What happens |
| Weight (kg) Follow‐up: 2 to 5 years | 4 cohort studies (13,802) | 2 studies that adjusted for TE intake: After 3 years, "Dairy fat was not a stronger predictor of weight gain than other types of fat, and no fat (dairy, vegetable, or other) intake was significantly associated with weight gain after energy adjustment, nor was total fat intake;" no numerical results reported. After 3 years, for every 1% increase in TE intake from total fat of children, weight will decrease by 0.0011 kg. 2 studies that did not adjust for TE intake: After 4 years, weight of children with low‐fat intake (< 30%TE) will increase by 8.1 kg on average, and by 8.9 kg on average in children with high‐fat intake (> 35%TE). After 2 years, children with low‐fat intake (≤ 30%TE) will gain on average 0.2 kg per year more than children with high‐fat intakes (> 30%TE) | ⊕⊝⊝⊝ | When adjusted for TE, we were uncertain whether fat intake was associated with weight in children over 2 to 5 years. When not adjusted for TE, we were uncertain whether lower fat was associated with weight in children over 2 to 5 years. |
| Follow‐up: 5 to 10 years | 1 cohort study (126) | 1 study that did not adjust for TE intake: After 6 years, weight of children with low‐fat intake (< 30%TE) will increase by 16.8 kg on average, and by 13.9 kg on average in children with high‐fat intake (> 35%TE) | ⊕⊝⊝⊝ | We were uncertain whether fat intake was associated with weight over 5 to 10 years (1 study). |
| BMI (kg/m2, kg/m2 per year, z‐score, percentile) Follow‐up: 2 to 5 years | 7 cohort studies (3143) | 4 studies that adjusted for TE intake: After 3 years, for every 1% increase in energy intake from total fat, BMI will decrease by 0.63 z‐score in boys but increase by 0.07 z‐score in girls. "Dietary factors were not associated with BMI across the three study years." After 3 years, for every 1% increase in energy intake from total fat, BMI will decrease by 0.00008 kg/m2. After 4 years, increase in the total fat intake, will increase BMI by 0.087 z‐score. The model explained 48% of variance in the change of BMI z‐score. 2 studies that did not adjust for TE intake: After 2.08 years, low‐fat intake (≤ 30%TE) will result in a 0.02 kg/m2 per year greater increase in BMI on average, compared to high‐fat intake (> 30%TE). After 3 years, for every 1% increase in energy intake from total fat, BMI will decrease by 0.01 percentile in girls. 1 study where TE adjustment was not applicable, as TE was part of exposure: After 3 years, for every 1 z‐score increase in the energy‐dense, high‐fat and low‐fibre dietary pattern, BMI will increase by 0.03 z‐score in boys and by 0.99 z‐score in girls. After 3 years, the ratio of odds for being overweight/obese was 1.04 greater in boys and 1.02 greater in girls with higher dietary pattern z‐scores, compared to the odds in boys and girls with lower dietary pattern z‐scores. | ⊕⊝⊝⊝ Very low6,7,8 | We were uncertain whether fat intake was associated with BMI in children over 2 to 10 years. |
| Follow‐up: 5 to 10 years | 4 cohort studies (1158) | 3 studies that adjusted for TE intake: After 6 years, for every 1% increase in energy intake from total fat, BMI will decrease by 0.011 z‐score in boys but increase by 0.005 z‐score in girls. After 9 years, increase in the total fat intake will increase BMI by 0.122 z‐score. After 10 years, for every 1% increase in energy intake from total fat, BMI will increase by 0.029 kg/m2 in white girls and by 0.012 kg/m2 in black girls. 1 study that did not adjust for TE intake: After 6 years, for every 1 g increases in the fat intake, BMI will increase by 0.01 kg/m2 | ⊕⊝⊝⊝ | |
| LDL‐C (mmol/L) Follow‐up: 2 to 5 years | 1 cohort study (1163) | 1 study where TE adjustment not applicable, as TE was part of exposure: After 3 years, for every 1 z‐score increase in the energy‐dense, high‐fat and low‐fibre dietary pattern, LDL‐C will increase by 0.001 mmol/L in boys and 0.04 mmol/L in girls | ⊕⊝⊝⊝ | We were uncertain whether fat intake was associated with LDL‐C in children over 2 to 5 years (1 study). |
| HDL‐C (mmol/L) Follow‐up: 2 to 5 years | 2 cohort studies (1393) | 1 study that adjusted for TE intake: After 3 years, for every 1% increase in energy intake from total fat, HDL‐C will decrease by 0.21 mmol/L in girls. 1 study where TE adjustment not applicable, as TE was part of exposure: After 3 years, for every 1 z‐score increase in the energy‐dense, high‐fat and low‐fibre dietary pattern, HDL‐C will decrease by 0.002 mmol/L in boys but increase by 0.02 mmol/L in girls. | ⊕⊕⊝⊝ | When adjusted for TE, fat intake may be inversely associated with HDL‐C in girls over 2 to 5 years (1 study). When not adjusted for TE, fat intake may make little or no difference to HDL‐C in girls over 2 to 5 years (1 study). |
| Triglycerides (mmol/L) Follow‐up: 2 to 5 years | 1 cohort study (1163) | 1 study where TE adjustment not applicable, as TE was part of exposure: After 3 years, for every 1 z‐score increase in the energy‐dense, high‐fat and low‐fibre dietary pattern, triglycerides will increase by 1% in either boys or girls. | ⊕⊝⊝⊝ | We were uncertain whether fat intake was associated with triglycerides in children over 2 to 5 years (1 study). |
| Height (cm) Follow‐up: 2 to 5 years | 3 cohort studies (973) | 1 study that adjusted for TE intake: After 3 years, for every 1% increase in energy intake from fat, height in children will decrease by 0.0009 cm on average. 2 studies that did not adjust for TE intake: After 2 years, low‐fat intake (≤ 30%TE) will result in a 0.2 cm per year greater increase in height on average compared to high‐fat intake (> 30%TE). After 4 years, on average children in low‐fat intake (< 30%TE) gain 27.9 cm in height, while children in high‐fat intake (> 35%TE) gain 28.3 cm in height. | ⊕⊝⊝⊝ | We were uncertain whether fat intake was associated with height in children over 2 to 10 years. |
| Follow‐up: 5 to 10 years Age at baseline: 2 years | 1 cohort study (126) | 1 study that did not adjust for TE intake: At 6 years, on average children in low‐fat intake (< 30%TE) gain 44.9 cm in height while children in high‐fat intake (> 35%TE) gain 40.3 cm in height. | ⊕⊝⊝⊝ | |
| BMI: body mass index; HDL‐C: high‐density lipoprotein cholesterol; LDL‐C: low‐density lipoprotein cholesterol; MD: mean difference; TE: total energy. aNotes: Some cohort studies reported more than one eligible analysis for the same outcome (e.g. BMI as continuous or binary outcome) or different measures of exposure (e.g. fat intake as continuous %TE or as binary classification of less‐exposed vs more‐exposed). In these cases, we selected outcomes and exposure measures so as not to use the same study sample of participants more than once per outcome and time point range in the table. For all outcomes, there were too few studies to assess publication bias. | ||||
| GRADE Working Group grades of evidence | ||||
| 1Although, risk of bias was concerning (studies with strong contributions did not adjust for all important prognostic variables), plausible residual confounding would likely reduce the demonstrated effect in the studies that did not adjust for total energy intake; thus we chose not to downgrade for risk of bias. 2Downgraded by 1 for imprecision: in studies reporting variance, the variance included no effect and important benefit or harm. 3Although risk of selection bias (no matching of exposed and non‐exposed groups, or statistical adjustments) and attrition bias (> 50% attrition) was concerning, plausible residual confounding would likely reduce the demonstrated effect as this study did not adjust for total energy; thus we chose not to downgrade for selection bias. 4Only 1 study for this outcome, therefore we could not rate for inconsistency. 5Downgraded by 1 for indirectness: a single study in a high‐income country likely has limited generalisability. 6Imprecision was considered, but we considered a decision would not impact on the rating and thus no judgement was made for imprecision. 7Downgraded by 1 for risk of bias: risk of selection bias: 5 studies did not match exposed and non‐exposed groups or make important statistical adjustments; high risk of detection bias: dietary assessment for 3 studies were not adequately rigorous. 8Downgraded by 1 for inconsistency: some studies reported small to large positive associations between exposure and outcome, while others reported no association or a small to medium inverse association between exposure and outcome. 9Downgraded by 1 for risk of bias: risk of selection bias: 2 studies with strongest contributions, did not adjust for all important prognostic variables; high risk of detection bias: dietary assessment in 1 study was not adequately rigorous. 10Downgraded by 1 for risk of bias: risk of selection bias; no matching of exposed and unexposed groups or adjustment for all important prognostic variables. 11Study was judged to have a lower overall risk of bias; attrition < 50% and satisfactory assessment of exposure. 12Not downgraded for serious imprecision as judged to be precise estimates of no effect in both studies. | ||||
| Recipients | Why | What (materials) | What (procedures) | Who provided | How and where | When and how much | Strategies to improve or maintain intervention fidelity; tailoring and modification | Extent of intervention fidelity |
| 4‐ to 9‐year‐old children with hypercholesterolaemia (plasma total cholesterol > 4.55 mmol/L, fasting plasma LDL‐C 2.77‐4.24 mmol/L for boys and 2.90‐4.24 mmol/L for girls), at ≥ 85% of ideal body weight. | Limited dietary fat was recommended for children aged > 2 years, but there were concerns that lower fat intake of children may affect their growth. Trial evaluated growth of children with hypercholesterolaemia completing an innovative, physician‐initiated, home‐based nutrition education programme or standard nutrition counselling that aimed to lower dietary fat intake. | Nutrition education programme complied with recommendations of the National Cholesterol Education Program Expert Panel on Blood Cholesterol Levels in Children and Adolescents. | Children and ≥ 1 parent (usually mother) attended 45‐ to 60‐minute counselling session with paediatric dietician. Children and parents in at‐risk control and not‐at‐risk control groups were not provided educational information or materials. | 1) Not described; 2) paediatric registered dieticians. | 1) Audiotape stories and picture books and follow‐up paper/pencil activities for children as well as manual for parents. Story and activities to be completed each week; 2) face‐to‐face individual counselling by a dietician. 1) At home; 2) paediatric practice. | 10 weeks with 1) talking‐book lesson; 2) 45‐60 minutes counselling session each week. | Not described Tailoring and modification of intervention during trial were not described. | 1) 71/88; 2) 77/86 completed intervention programmes and returned for evaluation at 3 months after baseline. |
| Prepubertal boys and girls aged 8‐11 years with LDL‐C levels ≥ 80th and < 98th percentiles for age and sex percentiles of the Lipid Research Clinics population. | Aimed to assess feasibility, safety, efficacy and acceptability of lowering dietary intake of total fat, saturated fat and cholesterol to decrease LDL‐C levels. | Intervention group received dietary counselling sessions based on National Cholesterol Education Programme guidelines: 28% of energy from total fat, < 8% from saturated fat, > 9% from polyunsaturated fat, and < 75 mg/1000 kcal of cholesterol per day, not to exceed 150 mg/day. Guidebooks including activities and recipes on diets and food recommendations given to participants and their families. | In first 6 months, 6 weekly and then 5 biweekly group sessions were led by nutritionists and behaviourists, and 2 individual visits were held with nutritionist. Over second 6 months, 4 group and 2 individual sessions were held. During 2nd and 3rd years, group and individual maintenance sessions were held 4‐6 times/year, with monthly telephone contacts between group sessions. During 4th year of follow‐up, 2 group events + 2 individual visits conducted with additional telephone contacts as appropriate. | Nutritionists and behaviourists | 1) Group sessions and 2) individual visits were held, accompanied by telephone contacts in between sessions. 1) At clinics, 2) at home | 6 weekly, 5 biweekly group sessions and 2 individual visits during first 6 months; 4 group and 2 individual sessions during second 6 months; 4‐6 maintenance sessions with telephone contacts between sessions during 2nd and 3rd years; 2 group and 2 individual sessions with telephone contacts as appropriate by 4th year. | By 4th year of follow‐up, individual visits used an individualised approach based on motivational interviewing and stage of change for increasingly busy teenagers. Tailoring and modification of intervention during trial not described. | 295/334 attended the last visit (> 5 years' follow‐up). |
| Students aged 12‐13 years from an urban area in Greece. | Aimed to evaluate the short‐term (15‐day) and long‐term (12‐month) effects of a 12‐week school‐based health and nutrition interventional programme regarding energy and nutrient intake, dietary changes and BMI. | Teaching material for teachers and workbooks for students on nutrition‐dietary habits and physical activity and health based on Social Learning Theory Model were developed and distributed to teacher and each student. | Multicomponent workbooks covering mainly dietary issues, but also dental health hygiene and consumption attitudes, were produced with each student being supplied a workbook. The class home economics teacher implemented 12‐hour‐classroom curriculum incorporating health and nutrition promotion during 12 weeks. 2 meetings were conducted with parents (given screening results of children; presentations given on dietary habits of children to improve health profile of children and prevent development of chronic diseases in the future). Cues and reinforcing messages in the form of posters and displays were provided in the classroom. | Educational intervention (classroom curriculum) delivered by class home economics teachers who were trained and supervised by health visitor or family doctor. | Classroom curriculum; cues and reinforcing messages in the form of posters and displays provided in classroom; nutrition education meetings for parents in group. At school. | 12 hours of classroom material, 2 meetings for parents during a 12‐week period. | Health visitor or family doctor supervised the programme implementation of class home economics teachers who were given 2 × 3‐hour seminars with aims to familiarise teachers about objectives of intervention and their role therein, and to increase their awareness of significance of incorporating health and nutrition in their curriculum before delivering the intervention. Tailoring and modification of intervention during trial not described. | 107/109 participation rates at 15‐days' follow‐up and 98/109 at 12 months' follow‐up. |
| aTIDieR: Template for Intervention Description and Replication, template for this table from Hoffman 2017. BMI: body mass index; LDL‐C: low‐density lipoprotein cholesterol; RCT: randomised controlled trial. | ||||||||
| Outcome Study ID | Follow‐up from baseline | |||||
| Baseline Mean (SD)a | 6 months MD (95% CI) | > 6 to 12 months MD (95% CI) | > 1 to 2 years MD (95% CI) | > 2 to 5 years MD (95% CI) | > 5 years MD (95% CI) | |
| Weight‐for‐age z‐scoreb | ||||||
| 0.04 (1.02); 0.26 (0.93) | ‐0.14 (‐0.45 to 0.17) | ‐0.18b (‐0.51 to 0.15) | ND | ND | ND | |
| Body weight (kg)b | ||||||
| 32.7 (6.8); 33.1 (6.9) | ND | ‐0.50b (‐1.78 to 0.78) | ND | ‐0.60 (‐2.39 to 1.19) | ND | |
| BMI (kg/m2) | ||||||
| 17.5 (2.3); 17.6 (2.4) | ND | ‐0.30 (‐0.75 to 0.15) | ND | 0.00 (‐0.63 to 0.63) | ‐0.10 (‐0.75 to 0.55) | |
| 24 (3.1); 24.3 (3.3) | ND | ND | ‐1.50 (‐2.45 to ‐0.55) | ND | ND | |
| aReduced fat intake group (≤ 30%TE); usual fat intake group. bWeight‐for‐age z‐score and weight (kg) could not be pooled. %TE: percentage of total energy; BMI: body mass index; CI: confidence interval; MD: mean difference; ND: no data in this time point range; SD: standard deviation. | ||||||
| Outcome | Follow‐up from baseline | |||||
| Baseline Mean (SD)a | 6 months MD (95% CI) | > 6 to 12 months MD (95% CI) | > 1 to 2 years MD (95% CI) | > 2 to 5 years MD (95% CI) | > 5 years MD (95% CI) | |
| Total cholesterol (mmol/L) | 5.17 (0.38); 5.17 (0.38) | ND | ‐0.15 (‐0.24 to ‐0.06) | ND | ‐0.06 (‐0.17 to 0.05) | ‐0.02 (‐0.13 to 0.09) |
| LDL‐C (mmol/L) | 3.38 (0.31); 3.38 (0.3) | ND | ‐0.12 (‐0.20 to ‐0.04) | ND | ‐0.09 (‐0.17 to ‐0.01) | 0.01 (‐0.01 to 0.03) |
| HDL‐C (mmol/L) | 1.48 (0.28); 1.47 (0.29) | ND | ‐0.03 (‐0.08 to 0.02) | ND | ‐0.01 (‐0.06 to 0.04) | 0.02 (‐0.03 to 0.07) |
| Triglycerides (mmol/L) | 0.9 (0.33); 0.92 (0.32) | ND | ‐0.01 (‐0.08 to 0.06) | ND | 0.06 (‐0.04 to 0.16) | 0.03 (‐0.06 to 0.12) |
| SBP (mmHg) | 97.31 (9.1); 97.55 (9.4) | ND | ‐0.40 (‐1.70 to 0.90) | ND | ‐0.40 (‐1.84 to 1.04) | ND |
| DBP (mmHg) | 61.97 (9.54); 61.67 (10.23) | ND | ‐0.50 (‐2.00 to 1.00) | ND | ‐0.90 (‐2.30 to 0.50) | ND |
| aReduced fat intake group (≤ 30%TE); usual fat intake group. %TE: percentage of total energy; CI: confidence interval; DBP: diastolic blood pressure; HDL‐C: high‐density lipoprotein cholesterol; LDL‐C: low‐density lipoprotein cholesterol; MD: mean difference; ND: no data in this time point range; SBP: systolic blood pressure; SD: standard deviation. | ||||||
| Outcome Study ID | Follow‐up from baseline | |||||
| Baseline Mean (SD)a | 6 months MD (95% CI) | > 6 to 12 months MD (95% CI) | > 1 to 2 years MD (95% CI) | > 2 to 5 years MD (95% CI) | > 5 years MD (95% CI) | |
| Height‐for‐age z‐scoreb | ||||||
| ‐0.12 (1.02); 0.06 (0.93) | ‐0.02 (‐0.06 to 0.02) | ‐0.05b (‐0.08 to‐0.02) | ND | ND | ND | |
| Height (cm)b | ||||||
| 136.2 (6.8); 136.5 (7) | ND | 0.00b (‐1.11 to 1.11) | ND | ‐0.10 (‐1.54 to 1.34) | ‐0.06 (‐2.06 to 0.86) | |
| aReduced fat intake group (≤ 30%TE); usual fat intake group. bHeight‐for‐age z‐score and height (cm) cannot be pooled. %TE: percentage of total energy; CI: confidence interval; MD: mean difference; ND: no data in this time point range; RCT: randomised controlled trial; SD: standard deviation. | ||||||
| Outcome Study ID | Follow‐up from baseline | |||||
| Baseline Mean (SD)a | 6 months MD (95% CI) | > 6 to 12 months MD (95% CI) | > 1 to 2 years MD (95% CI) | > 2 to 5 years MD (95% CI) | > 5 years MD (95% CI) | |
| Energy (kJ) | ||||||
| 7364 (1832); 7229 (1841) | ND | ‐356.00 (‐655.22 to ‐56.78) | ND | ‐602.00 (‐943.94 to ‐260.06) | ND | |
| 8503.3 (1419.3); 8583.7 (1522.4) | ND | ND | ‐645.50 (‐1075.66 to ‐215.34) | ND | ND | |
| Fat (%TE) | ||||||
| 33.4 (5.5); 34 (4.9) | ND | ‐4.60 (‐5.50 to ‐3.70) | ND | ‐4.40 (‐5.25 to ‐3.55) | ND | |
| 35.4 (4.7); 36.2 (5.2) | ND | ND | ‐5.60 (‐6.91 to ‐4.29) | ND | ND | |
| Saturated fat (%TE) | ||||||
| 12.5 (2.7); 12.7 (2.5) | ND | ‐2.60 (‐3.02 to ‐2.18) | ND | ‐2.10 (‐2.49 to ‐1.71) | ND | |
| 12.4 (2.0); 12.8 (2.3) | ND | ND | ‐3.10 (‐3.78 to ‐2.42) | ND | ND | |
| Protein (%TE) | ||||||
| 14.8 (2.8); 14.6 (2.7) | ND | 1.00 (0.52 to 1.48) | ND | 0.90 (0.38 to 1.42) | ND | |
| 15.3 (1.4); 14.9 (1.8) | ND | ND | 1.30 (0.80 to 1.80) | ND | ND | |
| Carbohydrates (%TE) | ||||||
| 53.0 (6.7); 52.8 (6.2) | ND | 3.70 (2.63 to 4.77) | ND | 3.30 (2.25 to 4.35) | ND | |
| 49.7 (6.2); 48.4 (6.8) | ND | ND | 3.00 (1.16 to 4.84) | ND | ND | |
| aReduced fat intake group (≤ 30%TE); usual fat intake group. %TE: percentage of total energy; MD: mean difference; ND: no data in this time point range; RCT: randomised controlled trial; SD: standard deviation. | ||||||
| Study ID; mean age at baseline; analysis | Outcome | Outcome units | Time point (year) | Exposure | Exposure unit | Results of association (all reported values) | Direction;a energy intake adjusted (yes/no) | Matched groups or adjusted for (or both) | |
| Weight at 1 year: 4 cohort studies; 4 analyses (n ˜ 1949) in boys and girls aged 2‐11 years | |||||||||
| 2 years old; mean end values per group | Relative weightb | % | 1 | Total fat intake (single 4‐day dietary record at baseline, 1.5 and 2 years) | LF (27.7‐28.7 %TE; HF (> 28.7 %TE) | n overall = 740 (LF = 35, HF = 705); mean end values (SD). Baseline: LF = 1 (8); HF = 1 (8). At 1 year: LF = 1 (7); HF = 1 (8); P = 0.81. After 1 year, no difference in relative weight change of children with LF intake compared to children with HF intakes. | 0 No | No matching reported. No adjustment for prognostic variables. | |
| 6.8 years old; regression | Weight | kg | 1 | Total fat intake (single 7‐day weighed dietary record at baseline and 1 year) | g | n overall = 411; regression result. B = 0.09, SE 0.019; P < 0.05. After 1 year, for every 1 g increase in total fat intake of children, weight will increase by 0.09 kg. | + No | Adjusted for age, gender and physical activity. | |
| 11 years old; regression | Weight | kg/year | 1 | Total fat intake (multiple 24‐hour dietary recalls at baseline) | %TE | n overall = 798; regression result. B = 0.044, SE 0.018; P = 0.014. For every 1% increase in energy intake from total fat in children, weight will increase by 0.04 kg/year. | + No | Adjusted for gender, age, age squared, Tanner stage and BMI. | |
| 6.2 years old; mean end values per group | Weight | z‐score | 1 | Total fat intake (multiple 24‐hour dietary recalls at baseline and 1 year) | LF quintile (24 %TE) HF quintile (34%TE) | n overall = NR (LF = NR, HF = NR); mean end values (SD NR). Baseline: LF = ‐0.21; HF = 0.44. At 1 year: LF = ‐0.14; HF = 0.45. After 1 year, weight‐for‐age of children with LF intake will increase by 0.07 z‐scores on average, and by 0.01 z‐scores in children with HF intake. | ‐ No | No matching reported. No adjustment for prognostic variables. | |
| Weight at > 1to 2 years: 1 cohort study; 1 analysis (n = 126) in boys and girls aged 2 years | |||||||||
| 2 years old; mean end values per group | Weight | kg | 2 | Total fat intake (single 3‐day weighed dietary records at baseline and 2 years) | LF < 30%TE; HF > 35%TE | n overall = 126 (LF = 14, HF = 112); mean end values (SD). Baseline: LF = 12.6 (1); HF = 12.8 (1.7). At 2 years: LF (n = 20) 18.4 (2.6); HF (n = 76) 17.9 (2.1); P > 0.05. After 2 years, weight of children with LF intake will increase by 5.8 kg on average, and by 5.1 kg on average in children with HF intake. | ‐ No | No matching reported. No adjustment for prognostic variables. | |
| Weight at > 2to 5 years: 4 cohort studies; 4 analyses (n = 13,802) in boys and girls aged 2‐14 years | |||||||||
| 4.4 years old; mean change per group | Weight | kg/year | 2.1 | Total fat intake (multiple FFQs at baseline) | LF ≤ 30%TE; HF > 30%TE | n overall = 215 (LF = 37, HF = 178); mean change (SD). Baseline: NR. LF = 3 (1.3); HF = 2.8 (1.3); P > 0.05 MD 0.2 (95% CI ‐0.26 to 0.66). After 2 years, children with LF intake will gain on average 0.2 kg/year more than children with HF intakes. | ‐ No | No matching reported. No adjustment for prognostic variables. | |
| 9‐14 years‐old; regression | Weight | kg, 1‐year change | 3 | Total fat intake (single FFQ at baseline, 1, 2 and 3 years) | g | n overall = 12,829; only reported as text. After 3 years, "Dairy fat was not a stronger predictor of weight gain than other types of fat, and no fat (dairy, vegetable, or other) intake was significantly associated with weight gain after energy adjustment, nor was total fat intake." | 0 Yes | Adjusted for age, ethnicity, pubertal stage, annual height growth, baseline BMI and same‐year physical activity. | |
| 9.6 years old; regression | Weight | kg | 3 | Total fat intake (multiple 24‐hour recalls at baseline, 1 and 3 years) | %TE | n overall = 632; regression results. B = ‐0.0011, P = 0.8. After 3 years, for every 1% increase in total energy intake from total fat of children, weight will decrease by 0.0011 kg. | ‐ Yes | Adjusted for gender, physical activity, treatment, visit number, other sources of energy than fat and interactions: fat intake‐by‐treatment, fat intake‐by‐gender, fat intake‐by‐visit number and visit number‐by‐treatment. | |
| 2 years‐old; mean end values per group | Weight | kg | 4 | Total fat intake (single 3‐day weighed dietary record at baseline, 2 and 4 years) | LF < 30%TE; HF > 35%TE | n overall = 126 (LF = 14, HF = 112); mean end values (SD). Baseline: LF = 12.6 (1); HF = 12.8 (1.7). At 4 years: LF (n = 14) 20.7 (3.4); HF (n = 88) 21.7 (3); P > 0.05. After 4 years, weight of children with LF intake will increase by 8.1 kg on average, and by 8.9 kg on average in children with HF intake. | + No | No matching reported. No adjustment for prognostic variables. | |
| Weight at > 5to 10 years: 1 cohort study; 1 analysis (n = 126) in boys and girls aged 2 years | |||||||||
| 2 yrs‐old; mean end values per group | Weight | kg | 6 | Total fat intake (single 3‐day weighed dietary record at baseline, 2 and 4 years; single 4‐day weighed dietary record at 6 years) | LF < 30 %TE; HF > 35 %TE | n overall = 126 (LF = 14, HF = 112); mean end values (SD). Baseline: LF = 12.6 (1); HF = 12.8 (1.7). At 6 years: LF (n = 13) 29.4 (5.9); HF (n = 72) 26.7 (4.3); P > 0.05. After 6 years, weight of children with LF intake will increase by 16.8 kg on average, and by 13.9 kg on average in children with HF intake. | ‐ No | No matching reported. No adjustment for prognostic variables. | |
| aDirection refers to whether there was a positive (+: exposure and outcome moved in the same direction, inverse/negative (‐: exposure and outcome moved in opposite directions) or zero (0: no association) between total fat intake and the outcome. bRelative weight, deviation in percentages from the mean weight of healthy Finnish children of the same height and gender. %TE: percentage of total energy; B: unstandardized beta‐coefficient; BMI: body mass index; CI: confidence interval; FFQ: Food Frequency Questionnaire; LF: low fat; HF: high fat; n: number of participants; NA: not applicable; MD: mean difference; NR: not reported; SD: standard deviation; SE: standard error. | |||||||||
| Study ID; mean age at baseline; analysis | Outcome | Outcome units | Time point (year) | Exposure | Exposure unit | Results of association (all reported values) | Direction;a energy intake adjusted? (yes/no) | Matched groups or adjusted for (or both) |
| BMI at 1 year: 3 cohort studies; 4 analyses (n ˜ 11,180) in boys and girls aged 7‐14 years | ||||||||
| 9‐14 years; regression | BMI | kg/m2, 1‐year change | 1 | Total fat intake (single FFQ at baseline and 1 year) | g | n girls = 6149; regression result. B = 0.0008, SE 0.0016, P = 632. After 1 year, for every 1 g increase in total fat intake, BMI will increase by 0.0008 kg/m2 in girls. | + Yes | Adjusted for total energy intake, age, ethnicity, pubertal stage, annual height growth, baseline BMI and physical activity. |
| 9‐14 years; regression | BMI | kg/m2, 1‐year change | 1 | Total fat intake (single FFQ at baseline and 1 year) | g | n boys = 4620; regression result. B = ‐0.0015, SE 0.0017, P = 0.375. After 1 year, for every 1 g increase in the total fat intake, BMI will decrease by 0.0015 kg/m2 in boys. | ‐ Yes | Adjusted for total energy intake, age, ethnicity, pubertal stage, annual height growth, baseline BMI and physical activity. |
| 8.6 years; regression | BMI | z‐score | 1 | Total fat intake (single 3‐day record at baseline) | %TE | n overall = NR; regression result = NR. "We are unable to demonstrate a positive relation between dietary fat and BMI z‐score change from baseline to 12 months." | 0 NR | Prognostic variables were adjusted for, but not specified which one. |
| 6.8 years; regression | BMI | kg/m2 | 1 | Total fat intake (single 7‐day weighed record at baseline and 1 year) | g | n overall = 411; regression result. B = 0.08, SE 0.007, P = 0.085. After 1 year, for every 1 g increase in the total intake, BMI will increase by 0.08 kg/m2. | + No | Adjusted for age, sex and physical activity. |
| BMI at > 1to 2 years: 7 cohort studies; 10 analyses (n = 3347) in boys and girls aged 2‐13 years | ||||||||
| 3.6 years; mean end values per group | BMI | kg/m2 | 1.5 | Total fat intake (single 3‐day unweighed food record at baseline) | LF quintile (30.4%TE); HF quintile (41.8 %TE) | n boys, at baseline = 438; At 1.5 years = 383 (LF = NR, HF = NR); mean end values (SD). Baseline: LF = 16.6 (95% CI 16.4 to 16.8); HF = 16.3 (95% CI 16.1 to 16.5). At 1.5 years: LF = 16.1 (95% CI 15.8 to 16.3); HF = 15.7 (95% CI 15.5 to 16.0). After 18 months, average BMI decreased by 0.5 kg/m2 among boys in LF intake (30.4%TE) group and by 0.6 kg/m2 in boys in HF intake (41.8%TE) group. | ‐ No | No matching reported. No adjustment for prognostic variables. |
| 3.6 years; mean end values per group | BMI | kg/m2 | 1.5 | Total fat intake (single 3‐day unweighed food record at baseline) | LF quintile (30.4 %TE); HF quintile (41.8 %TE) | n girls, at baseline = 351; at 1.5 years = 323) (LF = NR, HF = NR); mean end values (SD). Baseline: LF = 16.6 (95% CI 16.3 to 16.9); HF = 16.4 (95% CI 16.1 to 16.7). At 1.5 years: LF = 16.1 (95% CI 15.7 to 16.4); HF = 16.1 (95% CI 15.8 to 116.4). After 18 months,average BMI decreased by 0.5 kg/m2 among girls in LF intake group (30.4%TE) and by 0.3 kg/m2 in girls in HF intake group (41.8%TE). | + No | No matching reported. No adjustment for prognostic variables. |
| 5.4 years; regression | BMI | kg/m2, 2‐years change | 2 | Total fat intake (multiple 24‐hour recalls at baseline) | %TE | n overall = 168; regression result. R2 = 0.26, P entry = 0.01, F‐test = 9.27, df = 6, P change = 0.0001. "Percentage of fat intake, baseline BMI, family risk of overweight, mothers’ BMI, fathers’ enjoyment of activity explained 26% of the variance in the change of BMI." | + Yes | Adjusted for age, baseline BMI, family risk of overweight, mothers' change in BMI and fathers' enjoyment of activity. |
| 4.4 years; regression | BMI | kg/m2, 2‐years change | 2 | Change (year 2 to 3 of follow‐up) in total fat intake (single FFQ at baseline, 1 and 2 years) | %TE | n overall = 146; regression result. B = ‐0.04, P = 0.011, t value = 2.58. After 2 years, for every 1% increase in energy intake from total fat from year 2 to 3 of follow‐up, BMI will decrease by 0.04 kg/m2. | ‐ No | Adjusted for age, sex, parental BMI and physical activity. |
| 4.4 years; regression | BMI | kg/m2, 2‐years change | 2 | Baseline dietary fat (single FFQ) | %TE | n overall = 146; regression result. B = 0.034, P = 0.0521, t value = 1.96. After 2 years, for every 1% increase in energy intake from baseline total fat, BMI will increase by 0.034 kg/m2. | + No | Adjusted for age, sex, parental BMI and physical activity. |
| 5 years; mean end values; mean change per groups | BMI | kg/m2 | 2 | Total fat intake (multiple 24‐hour recalls at baseline) | LF ≤ 30%TE; HF > 30%TE | n girls = 192 (LF = 84; HF = 108); mean end values (SD); mean change (SD). Baseline: LF = 15.8 (1.83); HF = 16 (2.08). At 2 years: LF = 16.4 (1.83); HF = 16.9 (3.12); change LF = 0.6 (0.92); change HF = 1.0 (2.08); P < 0.05. MD ‐0.4 (95% CI ‐0.84 to 0.04) After 2 years, LF intake (≤ 30%TE) will result in 0.4 kg/m2 smaller increase in BMI on average compared to HF intake (> 0%TE) in girls. | + No | No matching reported. No adjustment for prognostic variables. |
| 7.3 years; regression | BMI 1st graders | kg/m2, 2‐years change | 2 | Total fat intake (multiple 24‐hour recalls at baseline, 1 and 2 years) | %TE | n overall = 474; regression result. B = 0.021 (95% CI ‐0.004 to 0.046), P = 0.104. After 2 years, for every 1% increase in energy intake from total fat, BMI will increase by 0.021 kg/m2. | + Yes | Adjusted for age, gender, sexual maturation at 6 years' follow‐up, baseline BMI, exercise frequency, screen time, sleep duration, meal skipping and snacking, parental BMI and SES. |
| 10 years; regression | BMI 4th graders | kg/m2, 2‐years change | 2 | Total fat intake (multiple 24‐hour recalls at baseline, 1 and 2 years) | %TE | n overall = 1030; regression result. B = ‐0.007 (95% CI ‐0.024 to 0.012), P = 0.449. After 2 years, for every 1% increase in energy intake from total fat, BMI will decrease by 0.007 kg/m2. | ‐ Yes | Adjusted for age, gender, sexual maturation at 6 years' follow‐up, baseline BMI, exercise frequency, screen time, sleep duration, meal skipping and snacking, parental BMI and SES. |
| 2 years; regression | BMI | z‐score | 2 | Total fat intake (single 3‐day weighed dietary record at baseline and 2 years) | NR | n overall = 155; regression result. β = 0.079, P > 0.1; R2 = 0.493, P < 0.0001. After 2 years, increase in the total fat intake will increase BMI by 0.079 z‐score. | + Yes | Adjusted for baseline BMI‐z score, gender, mother's BMI and father's BMI. |
| 12.5 years; regression | BMI | z‐score | 2 | Total fat intake (single 24‐hour recall at baseline) | per 10 g | n overall = 330; regression result. β = 0.009 (95% CI ‐0.006 to ‐0.02), P = NS. After 2 years, for every 10 g increase in total fat intake, BMI will increase by 0.009 z‐score. | + Yes | Adjusted for baseline BMI z‐score, moderate to vigorous physical activity, vegetables and fruit, fibre, milk, sodium and added sugar intakes. |
| BMI at > 2to 5 years: 7 cohort studies; 11 analyses (n = 4491) in boys and girls aged 2‐14 years | ||||||||
| 4.4 years; mean change per group | BMI | kg/m2 per year | 2.1 | Total fat intake (multiple FFQs at baseline) | LF ≤ 30%TE; HF > 30%TE | n overall = 215 (LF = 37, HF = 178); mean change (SD). LF = 0.2 (0.81), HF = 0.18 (0.68); P > 0.05. MD 0.02 (95% CI ‐0.26 to 0.30). After 25 months, LF intake (≤ 30%TE) will result in a 0.02 kg/m2 per year greater increase in BMI on average, compared to HF intake (> 30%TE). | ‐ No | No matching reported. No adjustment for prognostic variables. |
| 14 years; regression | BMI | z‐score | 3 | Energy‐dense, HF and low‐fibre dietary patternc (single FFQ at baseline and 3 years) | z‐score | n girls = 649; regression result. β = 0.99 (95% CI ‐0.05 to 0.05), P = NR. After 3 years, for every 1 z‐score increase in the energy‐dense, HF and low‐fibre dietary pattern z‐score, BMI will increase by 0.99 z‐score in girls. | + NA; exposure included energy intake | Adjusted for age, dietary misreporting, physical fitness, smoking and BMI z‐score. |
| 14 years; regression | BMI | z‐score | 3 | Energy‐dense, HF and low‐fibre dietary patternc (single FFQ at baseline and 3 years) | z‐score | n boys = 699; regression result. β = 0.03 (95% CI ‐0.01 to 0.08), P = NR. After 3 years, for every 1 z‐score increase in the energy‐dense, HF and low‐fibre dietary pattern, BMI will increase by 0.03 z‐score in boys. | + NA; exposure included energy intake | Adjusted for age, dietary misreporting, physical fitness, smoking and BMI z‐score. |
| 14 years; regression and OR higher vs lower dietary pattern z‐score | BMI | Overweight/obese by IOTF;d odds | 3 | Energy‐dense, HF and low‐fibre dietary patternc (single FFQ at baseline and 3 years) | z‐score | n girls = 649; regression result. OR = 1.02 (95% CI 0.87 to 1.19), P = NR. After 3 years, the ratio of odds for being overweight/obese was 1.02 greater in girls with higher dietary pattern z‐scores compared to the odds in girls with lower dietary pattern z‐scores. | + NA; exposure included energy intake | Adjusted for age, dietary misreporting, physical activity and smoking. |
| 14 years; regression and OR higher vs lower dietary pattern z‐score | BMI | Overweight/obese by IOTF;d odds | 3 | Energy‐dense, HF and low‐fibre dietary patternc(single FFQ) at baseline and 3 years) | z‐score | n boys = 699; regression result. OR = 1.04 (95% CI 0.9 to 1.2), P = NR. After 3 years, the ratio of odds for being overweight/obese is 1.04 greater in boys with higher dietary pattern z‐scores compared to the odds in boys with lower dietary pattern z‐scores. | + NA; exposure includes energy intake | Adjusted for age, dietary misreporting, physical activity and smoking. |
| 9.7 years; regression | BMI | z‐score, 3‐years change | 3 | Dietary fat (single 24‐hour recall at baseline) | %TE | n boys = 181; regression result. β = ‐0.63 (95% CI ‐2.07 to 0.82), P = 0.39. After 3 years, for every 1% increase in energy intake from total fat, BMI will decrease by 0.63 z‐score in boys. | ‐ Yes | Adjusted for age, physical activity level, dietary volume and puberty at baseline. |
| 9.7 years; regression | BMI | z‐score, 3‐years change | 3 | Dietary fat (single 24‐hour recall at baseline) | %TE | n girls = 217; regression result. β = 0.07 (95% CI ‐1.08 to 1.25), P = 0.72. After 3 years, for every 1% increase in energy intake from total fat, BMI will increase by 0.07 z‐score in girls. | + Yes | Adjusted for age, physical activity level, dietary volume and puberty at baseline. |
| 13.9 years; regression | BMI | Percentile, % | 3 | Total fat intake (single FFQ at baseline, 1, 2 and 3 years) | %TE | n girls = 265; regression result. B = ‐0.01, SE = 0.01, P = 0.16. After 3 years, for every 1% increase in energy intake from total fat, BMI will decrease by 0.01 percentile in girls. | ‐ No | Adjusted for age, ethnicity, protein calories, CHO calories, physical activity, physical inactivity and SES. |
| 4.4 years; regression | BMI | kg/m2 | 3 | Total fat intake (observed 4‐day dietary intake at baseline, 1 and 2 years and 3‐day dietary intake at 3 years) | %TE | n overall = 133; regression result. R2 = 0.65, P = NR. "Dietary factors were not associated with BMI across the three study years." | NR Yes | Adjusted for ethnicity, gender, baseline BMI, TV viewing, sedentary behaviour, physical activity, dietary behaviours and interaction terms for variables differing by year. |
| 9.6 years; regression | BMI | kg/m2 | 3 | Total fat intake (multiple 24‐hour recalls at baseline, 1 and 3 years) | %TE | n overall = 632; regression result. B = ‐0.00008, P = 0.9. After 3 years, for every 1% increase in energy intake from total fat, BMI will decrease by 0.00008 kg/m2. | ‐ Yes | Adjusted for gender, physical activity, treatment, visit number, other sources of energy than fat, and for interactions: fat intake‐by‐treatment, fat intake‐by‐gender, fat intake‐by‐visit number and visit number‐by‐treatment. |
| 2 years; regression | BMI | z‐score | 4 | Total fat intake (single 3‐day weighed dietary record at baseline, 2 and 4 years) | NR | n overall = 152; regression result. β = 0.087, P > 0.1; R2 = 0.48, P < 0.0001. After 4 years, increase in the total fat intake, will increase BMI by 0.087 z‐score. The model explained 48% of variance in the change of BMI z‐score. | + Yes | Adjusted for baseline BMI‐z score, gender, mother's BMI and father's BMI. |
| BMI at > 5to 10 years: 4 cohort studies; 6 analyses (n = 1158) in boys and girls aged 2‐10 years | ||||||||
| 9.6 years; regression | BMI | z‐score, 6‐years change | 6 | Dietary fat (single 24‐hour recall at baseline) | %TE | n girls = 177; regression result. β = 0.005, SE 0.008, P = 0.54. After 6 years, for every 1% increase in energy intake from total fat, BMI will increase by 0.005 z‐score in girls. | + Yes | Adjusted for age, puberty status, parent's income level, self‐reported activity, inactivity and number of overweight parents. |
| 9.6 years; regression | BMI | z‐score, 6‐years change | 6 | Dietary fat (single 24‐hour recall at baseline) | %TE | n boys = 147; regression result. β = ‐0.011, SE 0.009, P = 0.2. After 6 years, for every 1% increase in energy intake from total fat, BMI will decrease by 0.011 z‐score in boys. | ‐ Yes | Adjusted for age, puberty status, parent's income level, self‐reported activity, inactivity and number of overweight parents. |
| 2 years; regression | BMI | kg/m2 | 6 | Longitudinal dietary fat (single 24‐hour dietary recall and 2‐day food record at baseline, every 3 months during 1 year, every 6 months during 2 and 3 years, every year during 4, 5 and 6 years) | g | n overall = 70; regression result. B = 0.01, SE 0.01, P = 0.0039, F‐test = 9; R2 = 0.43, P = 0.0001, F‐test = 17.6. After 6 years, for every 1 g increases in the fat intake, BMI will increase by 0.01 kg/m2. | ‐ No | Adjusted for baseline BMI, birthweight, cereal introduction age, breastfeeding duration, dietary variety score 42‐84 months, adiposity rebound, picky eater at age 6 years, sedentary activity at ages 6 and 7 years, foods liked at age 8 years, mother's BMI and father's BMI. |
| 2 years; regression | BMI | z‐score | 9 | Total fat intake (single 3‐day weighed dietary record at baseline, 2 and 4 years, single 4‐day weighed dietary record at 6 and 9 years) | NR | n overall = 243; regression result. β = 0.122, P > 0.1; R2 = 0.38, P < 0.0001. After 9 years, increase in the total fat intake will increase BMI by 0.122 z‐score. | + Yes | Adjusted for baseline BMI‐z score, gender and parental BMI. |
| 10.1 years; regression | BMI | kg/m2, 10‐years change | 10 | Total fat intake (single 3‐day dietary records at 1, 2, 3, 4, 5, 7, 8 and 10 years) × baseline IR | %TE | n white girls = 241; regression result. B = 0.029, SE 0.0028, P < 0.0001, partial R2 = 27. After 10 years, for every 1% increase in energy intake from total fat, BMI will increase by 0.029 kg/m2 in white girls. | + Yes | Adjusted for age, BMI, IR and maturation stage at baseline; change in IR over 10 years' follow‐up; percentage of calories from protein, fat and CHO (mean of interviews) during 10 years' follow‐up; and interaction terms (nutrients × baseline IR). |
| 10.1 years; regression | BMI | kg/m2, 10‐years change | 10 | Total fat intake (single 3‐day dietary records at 1, 2, 3, 4, 5, 7, 8 and 10 years) × baseline IR | %TE | n black girls = 280; regression result. B = 0.012, SE 0.0032, P = 0.0002, partial R2 = 3.6. After 10 years, for every 1% increase in energy intake from total fat, BMI will increase by 0.012 kg/m2 in black girls. | ‐ Yes | Adjusted for age, BMI, IR and maturation stage at baseline; change in IR over 10 years' follow‐up; percentage of calories from protein, fat and CHO (mean of interviews) during 10 years' follow‐up; and interaction terms (nutrients × baseline IR). |
| BMI at > 10 years: 2 cohort studies; 2 analyses (n = 330) in boys and girls aged 2‐3 years | ||||||||
| 2 years; regression | BMI | z‐score | 13 | Total fat intake (single 3‐day weighed dietary record at baseline, 2 and 4 years, single 4‐day weighed dietary record at 6, 9, 11 and 13 years) | NR | n overall = 218; regression result. β = 0.16, 0.05 < P ≤ 0.1; R2 = 0.23, P < 0.0001. After 13 years, increase in the total fat intake will increase BMI by 0.16 z‐score. | + Yes | Adjusted for baseline BMI‐z score, gender, mother's BMI and father's BMI. |
| 3.2 years; mean end values per group | BMI | z‐score | 17 | Total fat intake (single 3‐day weighed dietary record at baseline and each year follow‐up) | LF (32%TE); HF (40%TE) | n overall = 112 (LF = 55; HF = 57); mean end values (SD). Baseline: LF = 0.36 (0.75); HF = 0.07 (0.81). At 17 years: LF = 0.23 (0.9); HF = 0.11 (1.09). After 17 years, on average BMI decrease 0.13 z‐score in the LF (32%TE) group while increase 0.04 z‐score in the HF (40%TE) group. | + No | No matching reported. No adjustments for prognostic variables. |
| aDirection refers to whether there was a positive (+: exposure and outcome moved in the same direction), inverse/negative (‐: exposure and outcome moved in opposite directions) or zero (0: no association) between total fat intake and the outcome. bUnpublished data provided by study authors. c"Energy dense, high fat, low fibre" dietary pattern reflected high intakes of processed meat, chocolate and confectionery, low‐fibre bread, crisps and savoury snacks, fried and roasted potatoes, the high intake of these foods increase the individual’s dietary pattern z‐score. dOverweight/obese was defined by IOTF for children aged 14 years (boys, BMI > 22.62 kg/m2; girls, BMI > 23.34 kg/m2), and aged 17 years (boys, BMI > 24.46 kg/m2; girls, BMI > 24.70 kg/m2). %TE: percentage of total energy; B: unstandardised beta‐coefficient; β: standardised beta‐coefficient; BMI: body mass index; CHO: carbohydrate; CI: confidence interval; df: degrees of freedom; FFQ: Food Frequency Questionnaire; HF: high fat; IR: insulin resistance; IOTF: International Obesity Task Force; LF: low fat; MD: mean difference; n: number of participants; NA: not applicable; NR: not reported; NS: not significant; OR: odds ratio; SD: standard deviation; SE: standard error; SES: socioeconomic status; TV: television. | ||||||||
| Study ID; mean age at baseline; analysis | Outcome | Outcome units | Time point (year) | Exposure | Exposure unit | Results of association (all reported values) | Direction;a energy intake adjusted? (yes/no) | Matched groups or adjusted for (or both) | |
| Waist circumference at > 1to 2 years: 1 cohort study; 1 analysis (n = 310) in boys and girls aged 13 years | |||||||||
| 12.5 years; regression | WC | cm | 2 | Total fat intake (single 24‐hour recall at baseline) | per 10 g | n overall = 310, regression result. B = 0.31 (95% CI 0.08 to 0.58), P ≤ 0.05. After 2 years, for every 10‐g increase in the total fat intake of children, WC will increase by 0.31 cm. | + No | Age, gender, baseline BMI z‐score, baseline WC, moderate to vigorous physical activity, vegetables and fruit, fibre, milk, sodium and added sugar. | |
| Waist circumference at > 2to 5 years: 1 cohort study; 4 analyses (n = 2680) in boys and girls aged 14 years | |||||||||
| 14 years; regression and OR higher vs lower dietary pattern z‐score | WC | WC ≥ 80 cm, odds | 3 | Energy‐dense, high‐fat and low‐fibre dietary patternb (single FFQ at baseline and 3 years) | z‐score | n boys = 697, regression result. OR = 1 (95% CI 0.82 to 1.22). After 3 years, the ratio of odds that WC is ≥ 80 cm is the same in boys with higher dietary pattern z‐scores compared to the odds in boys with lower dietary pattern z‐scores, during the period from 14 to 17 years of age. | 0 NA; exposure includes energy intake | Age, dietary misreporting, physical fitness, smoking and BMI z‐score. | |
| 14 years; regression and OR higher vs lower dietary pattern z‐score | WC | WC ≥ 80 cm, odds | 3 | Energy‐dense, high‐fat and low‐fibre dietary patternb (single FFQ at baseline and 3 years) | z‐score | n girls = 643, regression result. OR = 1.28 (95% CI 1.00 to 1.63). After 3 years, the ratio of odds that WC is ≥ 80 cm is 1.28 greater in girls with higher dietary pattern z‐scores compared to the odds in girls with lower dietary pattern z‐scores, during the period from 14 to 17 years of age. | + NA; exposure includes energy intake | Age, dietary misreporting, physical fitness, smoking and BMI z‐score. | |
| 14 years; regression | WC | z‐score | 3 | Energy‐dense, high‐fat and low‐fibre dietary patternb (single FFQ at baseline and 3 years) | z‐score | n boys = 697, regression result. β = 0.003 (95% CI ‐0.02 to 0.03). After 3 years, for every 1 unit increase in z‐score of the energy‐dense, high‐fat and low‐fibre dietary pattern of boys, WC will increase by 0.003 z‐scores. | + NA; exposure includes energy intake | Age, dietary misreporting, physical fitness, smoking and BMI z‐score. | |
| 14 years; regression | WC | z‐score | 3 | Energy‐dense, high‐fat and low‐fibre dietary patternb (single FFQ at baseline and 3 years) | z‐score | n girls = 643, regression result. β = 0.04 (95% CI 0.01 to 0.07). After 3 years, for every 1 unit increase in z‐score of the energy‐dense, high‐fat and low‐fibre dietary pattern of girls, WC will increase by 0.04 z‐scores. | + NA; exposure includes energy intake | Age, dietary misreporting, physical fitness, smoking and BMI z‐score. | |
| Waist circumference at > 5to 10 years: 1 cohort study; 2 analyses (n = 512) in girls aged 10 years | |||||||||
| 10.1 years; regression | WC | cm, 10‐years change | 10 | Total fat intake (single 3‐day dietary records at 1, 2, 3, 4, 5, 7, 8 and 10 years) × baseline IR | %TE | n white girls = 236. B = 0.053, SE 0.0065, P < 0.0001. After 10 years, for every 1% increase in energy intake from total fat in white girls, WC will increase by 0.053 cm. | + Yes | Age, WC, IR, and maturation stage at baseline; change in IR over 10‐years follow‐up; percentage of calories from protein, fat, and CHO (mean of interviews) during 10‐years follow‐up; and interaction terms (nutrients × baseline IR). | |
| 10.1 years; regression | WC | cm, 10‐years change | 10 | Total fat intake (single 3‐day dietary records at 1, 2, 3, 4, 5, 7, 8 and 10 years) × baseline IR | %TE | n black girls = 276. B = 0.028, SE 0.0056, P < 0.0001. After 10 years, for every 1% increase in energy intake from total fat in black girls, WC will increase by 0.028 cm. | + Yes | "Age, waist circumference, IR, and maturation stage at baseline; change in IR over 10‐y follow‐up; percentage of calories from protein, fat, and CHO (mean of interviews) during 10‐y follow‐up; and interaction terms (nutrients baseline IR)." | |
| aDirection refers to whether there was a positive (+: exposure and outcome moved in the same direction), inverse/negative (‐: exposure and outcome moved in opposite directions) or zero (0: no association) between total fat intake and the outcome. b"Energy dense, high fat, low fibre" dietary pattern reflected high intakes of processed meat, chocolate and confectionery, low‐fibre bread, crisps and savoury snacks, fried and roasted potatoes, the high intake of these foods increase the individual’s dietary pattern z‐score. %TE: percentage of total energy; B: unstandardised beta‐coefficient; β: standardised beta‐coefficient; BMI: body mass index; CHO: carbohydrate; CI: confidence interval; FFQ: Food Frequency Questionnaire; IR: insulin resistance; n: number of participants; NA: not applicable; OR: odds ratio; WC: waist circumference. | |||||||||
| Study ID; mean age at baseline; analysis | Outcome | Outcome units | Time point (years) | Exposure | Exposure unit | Results of association (all reported values) | Direction;a energy intake adjusted (yes/no) | Matched groups or adjusted for (or both) | |||
| Body fat at 1 year: 1 cohort study; 1 analysis (n = 411) in boys and girls aged 7 years | |||||||||||
| 6.8 years; regression | Body fat (skinfold thickness) | % | 1 | Total fat intake (single 7‐day weighed dietary record at baseline and 1 year) | g | n overall = 411, regression result. B = 0.011, SE 0.017, P < 0.05. After 1 year, for every 1 g increase in the total fat intake of children, body fat will increase by 0.01%. | + No | Adjusted for age, gender and physical activity. | |||
| Body fat at > 1to 2 years: 1 cohort study; 1 analysis (n = 625) in boys and girls aged 5 years | |||||||||||
| 5.2 years; regression | Body fat (DEXA) | kg | 2 | Energy‐dense, high‐fat, low‐fibre dietary patternc (single 3‐day dietary record at baseline and 2 years) | z‐score | n overall = 625, regression result. B = 0.28 (95% CI 0.05 to 0.53), P = 0.02. After 2 years, for every 1 unit increase in the dietary pattern z‐score of children, body fat will increase by 0.28 kg. | + NA; exposure includes energy intake | Adjusted for height at age 9 years, gender, misreporting status, maternal BMI, maternal education (5 categories), overweight status (by BMI) at baseline and television watching at 54 months. | |||
| Body fat at > 2to 5 years: 3 cohort studies; 6 analyses (n = 968) in boys and girls aged 2‐14 years | |||||||||||
| 13.9 years; regression | Body fat (skinfold thickness, BIA) | % | 3‐5 | Total fat intake (single FFQ at baseline and once during follow‐up period) | %TE | n girls = 265, regression result. B = ‐0.005, SE 0, P = 0.03. After 3‐5 years, for every 1 % increase in energy intake from total fat of girls, body fat will decrease by 0.005%. | ‐ No | Adjusted for age, ethnicity, protein calories, CHO calories, physical activity, physical inactivity and SES. | |||
| 5.2 years; regression | Body fat (DEXA) | kg | 4 | Energy‐dense, high‐fat, low‐fibre dietary patternc (single 3‐day dietary record at baseline and 2 years) | z‐score | n overall = 483, regression result. B = 0.15 (95 % CI ‐0.15 to 0.45), P = 0.34. After 4 years, for every 1 unit increase in the dietary pattern z‐score of children, body fat will increase by 0.15 kg. | + NA; exposure includes energy intake | Adjusted for height at age 9 years, gender, misreporting status, maternal BMI, maternal education (5 categories), overweight status (by BMI) at baseline and television watching at 54 months. | |||
| 2 years; regression | Body fat (DEXA) | % | 4 | Longitudinal dietary fat (single 24‐hour dietary recall and 2‐day food record at baseline, every 3 months during 1 year, every 6 months during 2 and 3 years, and yearly at 4 years) | NR | n overall = 53, regression result. B = 0.619, SE 0.261, P = 0.02, F‐test = 5.63, R2 = 0.51, p = 0.0001, F‐test = 7.88. After 4 years, for every 1 unit increase in total fat intake of children, body fat will increase by 0.61%. | + No | Adjusted for baseline BMI, parental BMI, gender, protein, calcium and monounsaturated fat. | |||
| 2 years; regression | Body fat (DEXA) | g | 4 | Longitudinal dietary fat (single 24‐hour dietary recall and 2‐day food record at baseline, every 3 months during 1 year, every 6 months during 2 and 3 years, and yearly at 4 years) | NR | n overall = 53, regression result. B = 178.65, SE 70.06, P = 0.01, F‐test = 6.5, R2 = 0.51, P = 0.0001, F‐test = 9.84. After 4 years, for every 1 unit increase in total fat intake of children, body fat will increase by 178 g. | + No | Adjusted for baseline BMI, parental BMI, gender, protein, calcium and monounsaturated fat. | |||
| 2 years; regression | Body fat (DEXA) | % | 4 | Longitudinal dietary fat (single 24‐hour dietary recall and 2‐day food record at baseline, every 3 months during 1 year, every 6 months during 2 and 3 years, and yearly at 4 years). | Number of servings | n overall = 53, regression result. B = 0.465, SE 0.255, P = 0.07, F‐test = 3.34. R2 = 0.47, P = 0.0001, F‐test = 6.93. After 4 years, for every 1 unit increase in the number of fat servings, body fat will increase by 0.47%. | + No | Adjusted for baseline BMI, parental BMI, gender, protein, calcium and monounsaturated fat. | |||
| 2 years; regression | Body fat (DEXA) | g | 4 | Longitudinal dietary fat (single 24‐hour dietary recall and 2‐day food record at baseline, every 3 months during 1 year, every 6 months during 2 and 3 years, and yearly at 4 years). | Number of servings | n overall = 53, regression result. B = 136.48, SE 69.74, P = 0.06, F‐test = 3.83, R2 = 0.47, p = 0.0001, F‐test = 8.31. After 4 years, for every 1 unit increase in the number of fat servings, body fat will increase by 136 g. | + No | Adjusted for baseline BMI, parental BMI, gender, protein, calcium and monounsaturated fat. | |||
| Body fat at > 5to 10 years: 1 cohort study; 3 analyses (n = 156) in boys and girls aged 2 years | |||||||||||
| 2 years; regression | Body fat (DEXA) | % | 6 | Longitudinal dietary fat (single 24‐hour dietary recall and 2‐day food record at baseline, every 3 months during 1 year, every 6 months during 2 and 3 years, every year during 4, 5 and 6 years). | g | n overall = 52, regression result. B = 0.08, partial R2 = 0.06, P = 0.001, F‐test = 4.66, R2 = 0.336, P = 0.002. After 6 years, for every 1 g increase in total fat intake of children, body fat will increase by 0.08%. | + No | Adjusted for gender, sedentary activity, intakes of calcium and polyunsaturated fat. | |||
| 2 years; regression | Body fat (DEXA) | % | 6 | Longitudinal dietary fat (single 24‐hour dietary recall and 2‐day dietary record at baseline, every 3 months during 1 year, every 6 months during 2 and 3 years, every year during 4, 5 and 6 years). | g | n overall = 52, regression result. B = 0.09, partial R2 = 0.02, P = 0.001, F‐test = 4.37, R2 = 0.322, P = 0.002. After 6 years, for every 1 g increase in total fat intake, body fat will increase by 0.09%. | + No | Adjusted for gender, sedentary activity, calcium intake, and polyunsaturated fat intake and father's BMI. | |||
| 2 years; regression | Body fat (DEXA) | kg | 6 | Longitudinal dietary fat (single 24‐hour dietary recall and 2‐day food record at baseline, every 3 months during 1 year, every 6 months during 2 and 3 years, every year during 4, 5 and 6 years) | g | N overall = 52, regression result. B = 0.034, partial R2 = 0.06, P = 0.01, F‐test = 4.19, R2 = 0.26, P = 0.006. After 6 years, for every 1 g increase in total fat intake of children, body fat will increase by 0.03 kg. | + No | Adjusted for sedentary activity, calcium intake and polyunsaturated fat intake. | |||
| aDirection refers to whether there was a positive (+: exposure and outcome moved in the same direction, inverse/negative (‐: exposure and outcome moved in opposite directions) or zero (0: no association between total fat intake and the outcome. bUnpublished data provided by study authors. c"Energy dense, high fat, low fibre" dietary pattern reflected high intakes of processed meat, chocolate and confectionery, low‐fibre bread, crisps and savoury snacks, fried and roasted potatoes, the high intake of these foods increase the individual's dietary pattern z‐score. %TE: percentage of total energy; B: unstandardised beta‐coefficient; BIA: bioelectrical impedance, BMI: body mass index; CHO, carbohydrate; CI: confidence interval; DEXA: dual energy X‐ray absorptiometry; FFQ: food frequency questionnaire; n: number of participants; NA: not applicable; NR: not reported; SD: standard deviation; SE: standard error; SES: socioeconomic status. | |||||||||||
| Study ID; mean age at baseline; analysis | Outcome | Outcome units | Time point (year) | Exposure | Exposure unit | Results of association (all reported values) | Direction;a energy intake adjusted (yes/no) | Matched groups or adjusted for (or both) |
| Fat mass index at > 2to 5 years: 1 cohort study; 1 analysis (n = 4002) in boys and girls aged 8 years | ||||||||
| 7.5 years; regression | Fat mass indexb | z‐score | 4 | Energy‐dense, high‐fat, low‐fibre dietary patternc (single 3‐day dietary records at baseline and 2 years) | z‐score | n overall = 4002, regression result. β = 0.07 (95% CI 0.05 to 0.10), P ≤ 0.0001. After 4 years, for every 1 z‐score increase in the dietary pattern, the fat mass index will increase by 0.07 z‐scores. | + NA; exposure includes energy intake | Adjusted for gender, age at dietary assessment, dietary misreporting, total physical activity at 11 years, maternal prepregnancy BMI and maternal education. |
| Fat mass index at > 5to 10 years: 1 cohort study; 5 analyses (n = 21,542) in boys and girls aged 8 years | ||||||||
| 7.5 years; regression | Fat mass indexb | z‐score | 8 | Energy‐dense, high‐fat, high‐sugar, low‐fibre dietary patternc (single 3‐day dietary record at baseline, 3 and 6 years) | z‐score | n overall = 4729, regression result. β = 0.04 (95% CI 0.01 to 0.08), P = 0.028. After 8 years, for every 1 z‐score increase in the dietary pattern, the fat mass index will increase by 0.04 z‐scores. | + NA; exposure includes energy intake | Adjusted for age, gender, dietary misreporting, physical activity and maternal social class. |
| 7.5 years; regression | Fat mass indexb | z‐score | 8 | Non‐energy‐dense, high‐sugar, LF dietary patternd (single 3‐day dietary record at baseline, 3 and 6 years) | z‐score | n overall = 4729, regression result. β = ‐0.03 (95% CI ‐0.07 to 0.02), P = 0.22. After 8 years, for every 1 z‐score increase in the dietary pattern, the fat mass index will decrease by 0.03 z‐scores. | ‐ NA; exposure includes energy intake | Adjusted for age, gender, dietary misreporting, physical activity and maternal social class. |
| 7.5 years; regression | Fat mass indexb | z‐score | 8 | Energy‐dense, high‐fat, low‐fibre dietary patternc (single 3‐day dietary record at baseline, 3 and 6 years) | z‐score | n overall = 2626, regression result. β = 0.06 (95% CI 0.03 to 0.10), P = 0.0004. After 8 years, for every 1 z‐score increase in the dietary pattern, the fat mass index will increase by 0.06 z‐scores. | + NA; exposure includes energy intake | Adjusted for gender, age at dietary assessment, dietary misreporting, total physical activity at 11 years, maternal pre‐pregnancy BMI and maternal education. |
| 7.5 years; regression | Fat mass indexb | FMI z‐score > 80th percentile; odds | 8 | Energy‐dense, high‐fat, high‐sugar, low‐fibre dietary patternc (single 3‐day dietary record at baseline, 3 and 6 years) | z‐score | n overall = 4729, regression result. OR 1.11 (95% CI 0.97 to 1.28), P = 0.14. After 8 years, the ratio of odds for having FMI z‐score > 80th percentile is 1.11 greater in children with higher dietary pattern z‐scores compared to the odds in children with lower dietary pattern z‐scores. | + NA; exposure includes energy intake | Adjusted for age, gender, dietary misreporting, physical activity and maternal social class. |
| 7.5 years; regression | Fat mass indexb | FMI z‐score > 80th percentile; odds | 8 | Non‐energy‐dense, high‐sugar, LF dietary patternd (single 3‐day dietary record at baseline, 3 and 6 years) | z‐score | n overall = 4729, regression result. OR 0.92 (95% CI 0.78 to 1.09), P = 0.34. After 8 years, the ratio of odds for having FMI z‐score > 80th percentile is 0.92 smaller in children with higher dietary pattern z‐scores compared to the odds in children with lower dietary pattern z‐scores. | ‐ NA; exposure includes energy intake | Adjusted for age, gender, dietary misreporting, physical activity and maternal social class. |
| aDirection refers to whether there was a positive (+: exposure and outcome moved in the same direction), inverse/negative (‐: exposure and outcome moved in opposite directions) or zero (0: no association) between total fat intake and the outcome; bFMI was calculated by dividing fat mass (measured by dual‐energy X‐ray Absorptiometry) (kg) by height (m) raised to the optimum power (calculated by using log‐log regression analysis) to remove any residual correlation between fat mass and height; c"Energy‐dense, high‐fat, low‐fibre" dietary pattern reflected high intakes of processed meat, chocolate and confectionery, low‐fibre bread, crisps and savoury snacks, fried and roasted potatoes, the high intake of these foods increase the individual’s dietary pattern z‐score. dNon‐energy‐dense, high‐sugar, low‐fat dietary pattern reflected higher intakes of sugary foods including sugar‐sweetened beverages, fruit juices, ready‐to‐eat breakfast cereals (low‐fibre breakfast cereals) and low intakes of whole milk, margarines and oils, cheese and crisps. β: standardised beta‐coefficient; BMI: body mass index; FMI: Fat Mass Index ; n: number of participants; NA: not applicable; OR: odds ratio. | ||||||||
| Study ID; mean age at baseline; analysis | Outcome | Outcome units | Time point (year) | Exposure | Exposure unit | Results of association (all reported values) | Direction;a energy intake adjusted (yes/no) | Matched groups or adjusted for (or both) |
| Sum of 4 skinfolds (BC, TC, SC, SI) at 1 year: 1 cohort study; 1 analysis (n = NR) in boys and girls aged 6 years | ||||||||
| 6.2 years; mean end values per group | Sum of skinfolds (BC, TC, SS, SI) | mm | 1 | Total fat intake (multiple 24‐hour recalls at baseline, 3 and 6 months and 1 year) | LF quintile (24%TE); HF quintile (34%TE) | n overall = NR (LF = NR, HF = NR), mean end values (95% CI). Baseline: LF = 24.7 (95% CI 23 to 26.5); HF = 28.8 (95% CI 26.1 to 31.8). At 1 year: (reported in the figure without exact values), LF = lower than baseline; HF = greater than baseline. After 1 year, the sum of skinfolds will decrease in children with a low‐fat intake, and increase in children with high‐fat intake | + No | No matching reported. No adjustment for prognostic variables. |
| Sum of 4 skinfolds (BC, TC, SC, SI) at > 1to 2 years: 1 cohort study; 1 analysis (n = 126) in boys and girls aged 2 years | ||||||||
| 2 years; mean end values per group | Sum of skinfolds (TC, BC, SS, SI) | mm | 2 | Total fat intake (single 3‐day weighed dietary record at baseline and 2 years) | LF < 30%TE; HF > 35%TE | n overall = 126 (LF = 14, HF = 112), mean end values (SD). Baseline: LF = 33.4 (6.8); HF = 32.8 (6.3). At 2 years: LF (n = 20) = 31 (9.2); HF (n = 76) = 31.4 (6.3); P > 0.05. After 2 years, the sum of skinfolds of children with LF intakes will decrease by 2.4 mm on average, and by 1.4 mm in children with HF intake. | + No | No matching reported. No adjustment for prognostic variables. |
| Sum of 4 skinfolds at > 2to 5 years: 1 cohort study; 1 analysis (n ˜ 126) in boys and girls aged 2 years | ||||||||
| 2 years; mean end values per group | Sum of skinfolds (TC, BC, SS, SI) | mm | 4 | Total fat intake (single 3‐day weighed dietary record at baseline, 2 and 4 years) | LF < 30%TE; HF > 35%TE | n overall = 126 (LF = 14, HF = 112), mean end values (SD). Baseline: LF = 33.4 (6.8); HF = 32.8 (6.3); P > 0.05. At 4 years: LF (n = 14) = 27.2 (8); HF (n = 88) = 29.2 (8.9); P > 0.05. After 4 years, the sum of skinfolds of children with LF intakes will decrease by 6.2 mm on average, and by 3.6 mm in children with HF intake | + Yes | No matching reported. No adjustment for prognostic variables. |
| Sum of 4 skinfolds at > 5to 10 years: 1 cohort study; 1 analysis (n = 126) in boys and girls aged 2 years | ||||||||
| 2 years; mean end values per group | Sum of skinfolds (TC, BC, SS, SI) | mm | 6 | Total fat intake (single 3‐day weighed dietary record at baseline, 2 and 4 years, single 4‐day weighed dietary record at 6 years) | LF < 30%TE; HF > 35%TE | n overall = 126 (LF=14, HF=112), mean end values (SD). Baseline LF = 33.4 (6.8); HF = 32.8 (6.3), P > 0.05. At 6 years: LF (n = 13) = 32.8 (13.3); HF (n = 72) = 31.8 (12.8), P > 0.05. After 6 years, the sum of skinfolds of children with LF intakes will decrease by 0.6 mm on average, and by 1 mm in children with HF intake. | ‐ No | No matching reported. No adjustment for prognostic variables. |
| Sum of 3 skinfolds at > 2to 5 years: 1 cohort study; 1 analysis (n = NR) in boys and girls aged 10 years | ||||||||
| 9.6 years; regression | Sum of skinfolds (TC, SS, SI) | mm | 3 | Total fat intake (multiple 24‐hour recalls at baseline, 1 and 3 years) | %TE | n overall = NR; regression result. B = ‐0.005, P = 0.2. After 3 years, for every 1% increase in energy intake from total fat of children, the sum of skinfolds will decrease by 0.005 mm | ‐ Yes | Adjusted for gender, physical activity, treatment, visit number, other sources of energy than fat, and for interactions: fat intake‐by‐treatment, fat intake‐by‐sex, fat intake‐by‐visit number and visit number‐by‐treatment. |
| Sum of 2 skinfolds at > 1to 2 years: 1 cohort study; 1 analysis (n = 192) in girls aged 5 years | ||||||||
| 5 years; mean change per group | Sum of skinfolds (TC, SS) | mm | 2 | Total fat intake (multiple 24‐hour recall at baseline) | LF ≤ 30%TE, HF > 30%TE | n girls = 192 (LF = 84; HF = 108); mean change (SD). Baseline: NR. LF = 0.9 (3.67), HF = 2.1 (5.2); P < 0.05. MD ‐1.2 (95% CI ‐2.46 to 0.06). After 2 years, the sum of skinfolds of girls with LF intake will increase on average by 1.2 mm less than girls with HF intake. | + No | No matching reported. No adjustment for prognostic variables. |
| aDirection refers to whether there was a positive (+: exposure and outcome moved in the same direction, inverse/negative (‐: exposure and outcome moved in opposite directions) or zero (0: no association) between total fat intake and the outcome. %TE: percentage of total energy; BC: biceps; CI: confidence interval; HF: high fat; LF: low fat; MD: mean difference; n: number of participants; NA: not applicable; NR: not reported; SD: standard deviation; SI: supra‐ileac; SS: subscapular; TC: triceps. | ||||||||
| Study ID; mean age at baseline; analysis | Outcome | Outcome units | Time point (year) | Exposure | Exposure unit | Results of association (all reported values) | Direction;a energy intake adjusted (yes/no) | Matched groups or adjusted for (or both) |
| Subscapular skinfold at > 1to 2 years: 1 cohort study; 1 analysis (n = 155) in boys and girls aged 2 years | ||||||||
| 2 years; regression | Subscapular skinfold | z‐score | 2 | Total fat intake (single 3‐day weighed dietary record at baseline and 2 years) | NR | n overall = 155; regression result. β = 0.081, P > 0.1, R2 = 0.47, P < 0.001. After 2 years, increase in the total fat intake will increase subscapular skinfold by 0.081 z‐score | + Yes | Adjusted for subscapular z‐score at baseline, energy intake, gender, mother' subscapular and father' subscapular. |
| Subscapular skinfold at > 2to 5 years: 1 cohort study; 1 analysis (n = 152) in boys and girls aged 2 years | ||||||||
| 2 years; regression | Subscapular skinfold | z‐score | 4 | Total fat intake (single 3‐day weighed dietary record at baseline, 2 and 4 years) | NR | n overall = 152; regression result. β = 0.072, P > 0.1, R2 = 0.38, P < 0.001. After 4 years, increase in the total fat intake will increase subscapular skinfold by 0.072 z‐score. | + Yes | Adjusted for subscapular z‐score at baseline, energy intake, gender, mother' subscapular and father' subscapular. |
| Subscapular skinfold at > 5to 10 years: 1 cohort study; 1 analysis (n = 243) in boys and girls aged 2 years | ||||||||
| 2 years; regression | Subscapular skinfold | z‐score | 9 | Total fat intake (single 3‐day weighed dietary record at baseline, 2 and 4 years, single 4‐day weighed dietary record at 6 and 9 years) | NR | n overall = 243; regression result. β = 0.069, P > 0.1, R2 = 0.26, P < 0.001. After 9 years, increase in the total fat intake will increase subscapular skinfold by 0.069 z‐score. | + Yes | Adjusted for subscapular z‐score at baseline, energy intake, gender, mother' subscapular and father' subscapular. |
| Subscapular skinfold at > 10 years: 1 cohort study; 1 analysis (n = 218) in boys and girls aged 2 years | ||||||||
| 2 years; regression | Subscapular skinfold | z‐score | 13 | Total fat intake (single 3‐day weighed dietary record at baseline, 2 and 4 years, single 4‐day weighed dietary record at 6, 9, 11 and 13 years) | NR | n overall = 218; regression result. β = 0.233, P ≤ 0.01. After 13 years, increase in the total fat intake will increase subscapular skinfold by 0.233 z‐score. | + Yes | Adjusted for subscapular z‐score at baseline, energy intake, gender, mother' subscapular and father' subscapular. |
| Triceps skinfold at > 1to 2 years: 1 cohort study; 1 analysis (n = 155) in boys and girls aged 2 years | ||||||||
| 2 years; regression | Triceps skinfold | z‐score | 2 | Total fat intake (single 3‐day weighed dietary record at baseline and 2 years) | NR | n overall = 155; regression result. β = 0.038, P > 0.1, R2 = 0.27, P ≤ 0.001. After 2 years, increase in the total fat intake will increase triceps skinfold by 0.038 z‐score. | + Yes | Adjusted for triceps z‐score at baseline, gender, mother's triceps and father's triceps. |
| Triceps skinfold at > 2to 5 years: 1 cohort study; 1 analysis (n = 152) in boys and girls aged 2 years | ||||||||
| 2 years; regression | Triceps skinfold | z‐score | 4 | Total fat intake (single 3‐day weighed dietary record at baseline, 2 and 4 years) | NR | n overall = 152; regression result. Β = 0.11, P > 0.1, R2 = 0.043, P > 0.01. After 4 years, increase in the total fat intake will increase triceps skinfold by 0.11 z‐score | + Yes | Adjusted for triceps z‐score at baseline, gender, mother's triceps and father's triceps. |
| Triceps skinfold at > 5to 10 years: 1 cohort study; 1 analysis (n = 243) in boys and girls aged 2 years | ||||||||
| 2 years; regression | Triceps skinfold | z‐score | 9 | Total fat intake (single 3‐day weighed dietary record at baseline, 2 and 4 years, single 4‐day weighed dietary record at 6 and 9 years) | NR | n overall = 243; regression result. β = 0.059, P > 0.1; R2 = 0.12, P ≤ 0.01. After 9 years, increase in the total fat intake will increase triceps skinfold by 0.059 z‐score | + Yes | Adjusted for triceps z‐score at baseline, gender, mother's triceps and father's triceps. |
| Triceps skinfold at > 10 years: 1 cohort study; 1 analysis (n = 218) in boys and girls aged 2 years | ||||||||
| 2 years; regression | Triceps skinfold | z‐score | 13 | Total fat intake (single 3‐day weighed dietary record at baseline, 2 and 4 years, single 4‐day weighed dietary record at 6, 9, 11 and 13 years) | NR | n overall = 218; regression result. β = 0.164; 0.05 < P ≤ 0.1. After 13 years, increase in the total fat intake will increase triceps skinfold by 0.164 z‐score | + Yes | Adjusted for triceps z‐score at baseline, gender, mother's triceps and father's triceps. |
| aDirection refers to whether there was a positive (+: exposure and outcome moved in the same direction), inverse/negative (‐: exposure and outcome moved in opposite directions) or zero (0: no association) between total fat intake and the outcome; B: unstandardised beta‐coefficient; β: standardised beta‐coefficient; n: number of participants; NR: not reported. | ||||||||
| Study ID; mean age at baseline; analysis | Outcome | Outcome units | Time point (year) | Exposure | Exposure unit | Results of association (all reported values) | Direction;a energy intake adjusted (yes/no) | Matched groups or adjusted for (or both) |
| LDL‐C at > 2to 5 years: 1 cohort study; 2 analyses (n = 1163) in boys and girls aged 14 years | ||||||||
| 14 years; regression | LDL‐C | mmol/L | 3 | Energy‐dense, high‐fat and low‐fibre dietary patternb (single FFQ at baseline and 3 years) | z‐score | n girls = 558, regression result. B = 0.04 (95% CI ‐0.01 to 0.08). After 3 years, for every 1 z‐score increase in the dietary pattern, LDL‐C will increase by 0.04 mmol/L in girls. | + NA; exposure includes energy intake | Adjusted for age, dietary misreporting, physical fitness, smoking and BMI z‐score. |
| 14 years; regression | LDL‐C | mmol/L | 3 | Energy‐dense, high‐fat and low‐fibre dietary patternb (single FFQ at baseline and 3 years) | z‐score | n boys = 605, regression result. B = 0.001 (95% CI ‐0.04 to 0.03). After 3 years, for every 1 z‐score increase in the dietary pattern, LDL‐C will increase by 0.001 mmol/L in boys. | + NA; exposure includes energy intake | Adjusted for age, dietary misreporting, physical fitness, smoking and BMI z‐score. |
| HDL‐C at > 2to 5 years: 2 cohort studies; 3 analyses (n = 1393) in boys and girls aged 13 and 14 years | ||||||||
| 14 years; regression; | HDL‐C | mmol/L | 3 | Energy‐dense, high‐fat and low‐fibre dietary patternb (single FFQ at baseline and 3 years) | z‐score | n girls = 558, regression result. B = 0.02 (95% CI 0.002 to 0.04). After 3 years, for every 1 z‐score increase in the dietary pattern HDL‐C will increase by 0.02 mmol/L in girls. | + NA; exposure includes energy intake | Adjusted for age, dietary misreporting, physical fitness, smoking and BMI z‐score. |
| 14 years; regression; | HDL‐C | mmol/L | 3 | Energy‐dense, high‐fat and low‐fibre dietary patternb (single FFQ at baseline and 3 years) | z‐score | n boys = 605, regression result. B = ‐0.002 (95% CI ‐0.02 to 0.01). After 3 years, for every 1 z‐score increase in the dietary pattern HDL‐C will decrease by 0.002 mmol/L in boys. | ‐ NA; exposure includes energy intake | Adjusted for age, dietary misreporting, physical fitness, smoking and BMI z‐score. |
| 12.5 years; regression; | HDL‐C | mmol/L | 3 | Total fat intake (dietary history at baseline and 3 years) | %TE | n girls = 230, regression result. β = ‐0.21, SE 0.1, P = 0.031. After 3 years, for every 1% increase in energy intake from total fat, HDL‐C will decrease by 0.21 mmol/L in girls. | ‐ Yes | Adjusted for sexual maturation, SES, cholesterol intake, CHO intake, cigarette smoking |
| Triglycerides at > 2to 5 years: 1 cohort study; 2 analyses (n = 1163) in boys and girls aged 14 years | ||||||||
| 14 years; regression | Triglycerides | % | 3 | Energy‐dense, high‐fat and low‐fibre dietary patternb (multiple FFQs at baseline and 3 years) | z‐score | n girls = 558, regression result. B = 1 (95% CI 0 to 3). After 3 years, for every 1 z‐score increase in the dietary pattern, triglycerides will increase by 1% in girls. | + NA; exposure includes energy intake | Adjusted for age, dietary misreporting, physical fitness, smoking and BMI z‐score. |
| 14 years; regression | Triglycerides | % | 3 | Energy‐dense, high‐fat and low‐fibre dietary patternb (multiple FFQs at baseline and 3 years) | z‐score | n boys = 605, regression result. B = 1 (95% CI 0 to 3). After 3 years, for every 1 z‐score increase in the dietary pattern, triglycerides will increase by 1% in boys | + NA; exposure includes energy intake | Adjusted for age, dietary misreporting, physical fitness, smoking and BMI z‐score. |
| aDirection refers to whether there was a positive (+: exposure and outcome moved in the same direction), inverse/negative (‐: exposure and outcome moved in opposite directions) or zero (0: no association) between total fat intake and the outcome. b"Energy dense, high fat, low fibre" dietary pattern was defined as high intakes of processed meat, chocolate and confectionery, low‐fibre bread, crisps and savoury snacks, fried and roasted potatoes, the high intake of these foods increase the individual’s dietary pattern z‐score. %TE: percentage of total energy; B: unstandardised beta‐coefficient; BMI: body mass index; CHO: carbohydrate; FFQ: food frequency questionnaire; LDL‐C: low‐density lipoprotein cholesterol; HDL‐C: high‐density lipoprotein cholesterol; NA: not applicable; SE: standard error; SES: socioeconomic status. | ||||||||
| Study ID; mean age at baseline; analysis | Outcome | Outcome units | Time point (year) | Exposure | Exposure unit | Results of association (all reported values) | Direction;a energy intake adjusted (yes/no) | Matched groups or adjusted for (or both) |
| SBP at > 1to 2 years: 1 cohort study; 1 analysis (n = 310) in boys and girls aged 13 years | ||||||||
| 12.5 years; regression | SBP | z‐score | 2 | Total fat intake (single 24‐hour recall at baseline) | per 10 g | n overall = 310; regression result. β = 0.03 (95% CI 0.00004 to 0.06), P < 0.05. After 2 years, for every 10 g increase in total fat intake, SBP will increase by 0.03 z‐score | + No | Adjusted for baseline BMI z‐score, baseline SBP and DBP, moderate to vigorous physical activity, vegetables and fruit, fibre, milk, sodium and added sugar. |
| SBP at > 2to 5 years: 1 cohort study; 1 analysis (n = NR) in boys and girls aged 10 years | ||||||||
| 9.6 years; regression | SBP | mmHg | 3 | Total fat intake (multiple 24‐hour recalls at baseline, 1 and 3 years) | g | n overall = NR; regression result. B = 0.4, P < 0.1. After 3 years, for every 1 g increase in total fat intake, SBP will increase by 0.4 mmHg | + Yes | Adjusted for height, weight and gender, with all sources of calories in the model. |
| DBP at > 1to 2 years: 1 cohort study; 1 analysis (n = 310) in boys and girls aged 13 years | ||||||||
| 12.5 years; regression | DBP | z‐score | 2 | Total fat intake (single 24‐hour recall at baseline) | per 10 g | n overall = 310. β = 0.03 (95% CI 0.003 to 0.05), P < 0.05. After 2 years, for every 10 g increase in total fat intake, DBP will increase by 0.03 z‐scores | + No | Adjusted for baseline BMI z‐score, baseline SBP and DBP, moderate to vigorous physical activity, vegetables and fruit, fibre, milk, sodium and added sugar. |
| DBP at > 2to 5 years: 1 cohort study; 1 analysis (n = NR) in boys and girls aged 10 years | ||||||||
| 9.6 years; regression | DBP | mmHg | 3 | Total fat intake (multiple 24‐hour recalls at baseline, 1 and 3 years) | g | n overall = NR. B = 0.43, 0.01 < P < 0.06. After 3 years, for every 1 g increase in total fat intake, DBP will increase by 0.43 mmHg | + Yes | Adjusted for height, weight and gender, with all sources of calories in the model. |
| aDirection refers to whether there was a positive (+: exposure and outcome moved in the same direction), inverse/negative (‐: exposure and outcome moved in opposite directions) or zero (0: no association) between total fat intake and the outcome. B: unstandardised beta coefficient; β: standardised beta‐coefficient; BMI: body mass index; CI: confidence interval; DBP: diastolic blood pressure; NR: not reported; SBP: systolic blood pressure. | ||||||||
| Study ID; mean age at baseline; analysis | Outcome | Outcome units | Time point (year) | Exposure | Exposure unit | Results of association (all reported values) | Direction;a energy intake adjusted (yes/no) | Matched groups or adjusted for (or both) |
| Height at 1 year: 2 cohort studies; 2 analyses (n ˜ 740) in children aged 2‐6 years | ||||||||
| 2 years; mean end values per group | Relative heightb | % | 1 | Total fat intake (single 4‐day dietary record at baseline, 1.5 and 2 years) | LF (27.7‐28.7 %TE); HF (> 28.7 %TE) | n overall = 740 (LF = 35, HF = 705); mean end values (SD). Baseline: LF = 0.30 (0.9); HF = 0.32 (0.9). At 1 year: LF = 0.18 (1.0); HF = 0.16 (0.9); P = 0.93. After 1 year, on average children with LF intake (27.7‐28.7 %TE) have a relative height change of 0.12% compared to 0.16% for children with HF intake (> 28.7 %TE). | ‐ No | No matching reported. No adjustment for prognostic variables. |
| 6.2 years; mean end values per group | Height | z‐score | 1 | Total fat intake (multiple 24‐hour dietary recalls at baseline and 1 year) | LF quintile (24%TE) HF quintile (34%TE) | n overall = NR (LF = NR, HF = NR); mean end values (SD NR). Baseline: LF = ‐0.23; HF = 0.17. At 1 year: LF = ‐0.11; HF = 0.22. After 1 year, on average children in LF intake (24%TE) quintile gain 0.12 z‐score in height while children in HF intake (34%TE) quintile gain 0.05 z‐score in height. | + No | No matching reported. No adjustment for prognostic variables. |
| Height at > 1to 2 years: 2 cohort study; 3 analysis (n = 836) in boys and girls aged 2‐4 years | ||||||||
| 3.6 years; mean end values per group | Height | cm | 1.5 | Total fat intake (single 3‐day unweighed food record at baseline) | LF quintile (30.4%TE) HF quintile (41.8%TE) | n boys, at baseline = 439; at 1.5 years = 387 (LF = NR, HF = NR); mean end values (SD). Baseline: LF = 99.9 (95% CI 99.2 to 100.5); HF = 99.3 (95% CI 98.7 to 99.9). At 1.5 years: LF = 110.7 (95% CI 109.9 to 111.5); HF = 109.9 (95% CI 109.1 to 110.7). After 1.5 years, on average boys with LF intake (30.4%TE) quintile gain 10.8 cm in height while boys with HF intake (41.8%TE) quintile gain 10.6 cm in height. | ‐ No | No matching reported. No adjustment for prognostic variables. |
| 3.6 years; mean end values per group | Height | cm | 1.5 | Total fat intake (single 3‐day unweighed food record at baseline) | LF quintile (30.4%TE) HF quintile (41.8%TE) | n girls, at baseline = 351; at 1.5 years = 323) (LF = NR, HF = NR); mean end values (SD). Baseline: LF = 99.9 (95% CI 98.0 to 99.8). HF = 98.3 (95% CI 97.6 to 99.1). At 1.5 years: LF = 110.0 (95% CI 108.9 to 111.1); HF = 109.3 (95% CI 108.3 to 110.3). After 1.5 years, on average girls in LF intake (30.4%TE) quintile will gain10.1 cm in height while girls in HF intake (41.8%TE) quintile will gain 11 cm in height. | + No | No matching reported. No adjustment for prognostic variables. |
| 2 years; mean end values per group | Height | cm | 2 | Total fat intake (single 3‐day weighed dietary records at baseline and 2 years) | LF < 30%TE HF > 35%TE | n overall = 126 (LF = 14, HF = 112); mean end values (SD). Baseline: LF = 86.1 (2.6); HF = 87.7 (3.3). At 2 years: LF (n = 20) = 107 (5.5); HF (n = 76) = 106 (3.9); P = NS. After 2 years, on average children with LF intake (< 30%TE) gain 20.9 cm in height, while children with HF intake > 35%TE) gain 18.3 cm in height. | ‐ No | No matching reported. No adjustment for prognostic variables. |
| Height at > 2to 5 years: 3 cohort studies; 3 analyses (n = 973) in boys and girls aged 2‐10 years | ||||||||
| 4.4 years; mean change per group | Height | cm/year | 2.1 | Total fat intake (multiple FFQs at baseline) | LF ≤ 30%TE HF > 30%TE | n overall = 215 (LF = 37, HF = 178), mean change (SD). Baseline: LF = 6.8 (1.4); HF = 6.4 (0.8); P > 0.05. MD 0.2 (95% CI ‐0.24 to 0.64). After 2 years, LF intake (≤ 30%TE) will result in a 0.2 cm/year greater increase in height on average compared to HF intake (> 30%TE). | ‐ No | No matching reported. No adjustment for prognostic variables. |
| 9.6 years regression | Height | cm | 3 | Total fat intake (multiple 24‐hour recalls at baseline, 1 and 3 years) | %TE | n overall = 632; regression results. B = ‐0.0009, P = 0.6. After 3 years, for every 1% increase in energy intake from fat, height in children will decrease by 0.0009 cm on average. | ‐ Yes | Adjusted for gender, physical activity, treatment, visit number, other sources of energy than fat, and for interactions: fat intake‐by‐treatment, fat intake‐by‐gender, fat intake‐by‐visit number and visit number‐by‐treatment. |
| 2 years; mean end values per group | Height | cm | 4 | Total fat intake (single 3‐day weighed dietary record at baseline, 2 and 4 years) | LF < 30%TE HF > 35%TE | n overall = 126 (LF = 14, HF = 112); mean end values (SD). Baseline: LF = 86.1 (2.6); HF = 87.7 (3.3). At 4 years: LF (n = 14) = 114 (5.5); HF (n = 88) = 116 (4.3); P > 0.05. After 4 years, on average children with LF intake (< 30%TE) gain 27.9 cm in height, while children with HF intake (> 35%TE) gain 28.3 cm in height. | + No | No matching reported. No adjustment for prognostic variables. |
| Height at > 5to 10 years: 1 cohort study; 1 analysis (n = 126) in boys and girls aged 2 years | ||||||||
| 2 years; mean end values per group | Height | cm | 6 | Total fat intake (single 3‐day weighed dietary record at baseline, 2 and 4 years; single 4‐day weighed dietary record at 6 years) | LF < 30%TE HF > 35%TE | n overall = 126 (LF = 14, HF = 112); mean end values (SD). Baseline: LF = 86.1 (2.6); HF = 87.7 (3.3). At 6 years: LF (n = 13) = 131 (7.7); HF (n = 72) = 128 (5.2); P > 0.05. At 6 years, on average children in LF intake (< 30%TE) gain 44.9 cm in height while children in HF intake (> 35%TE) gain 40.3 cm in height. | ‐ No | No matching reported. No adjustment for prognostic variables. |
| aDirection refers to whether there was a positive (+: exposure and outcome moved in the same direction), inverse/negative (‐: exposure and outcome moved in opposite directions) or zero (0: no association) between total fat intake and the outcome. bRelative height, deviation in percentages from the mean height of healthy Finnish children of the same height and gender. %TE: percentage of total energy; FFQ: Food Frequency Questionnaire; LF: low fat; HF: high fat; MD: mean difference; NA: not applicable; NR: not reported; SD: standard deviation. | ||||||||
| Outcome or subgroup title | No. of studies | No. of participants | Statistical method | Effect size |
| 1 Weight outcomes (standardised and unstandardised end values) Show forest plot | 2 | Mean Difference (IV, Fixed, 95% CI) | Totals not selected | |
| 1.1 6 months | 1 | Mean Difference (IV, Fixed, 95% CI) | 0.0 [0.0, 0.0] | |
| 1.2 > 6 to 12 months | 2 | Mean Difference (IV, Fixed, 95% CI) | 0.0 [0.0, 0.0] | |
| 1.3 > 2 to 5 years | 1 | Mean Difference (IV, Fixed, 95% CI) | 0.0 [0.0, 0.0] | |
| 2 Body mass index (BMI) (kg/m2) (end values) Show forest plot | 2 | Mean Difference (IV, Fixed, 95% CI) | Totals not selected | |
| 2.1 > 6 to 12 months | 1 | Mean Difference (IV, Fixed, 95% CI) | 0.0 [0.0, 0.0] | |
| 2.2 > 1 to 2 years | 1 | Mean Difference (IV, Fixed, 95% CI) | 0.0 [0.0, 0.0] | |
| 2.3 > 2 to 5 years | 1 | Mean Difference (IV, Fixed, 95% CI) | 0.0 [0.0, 0.0] | |
| 2.4 > 5 years | 1 | Mean Difference (IV, Fixed, 95% CI) | 0.0 [0.0, 0.0] | |
| 3 BMI (kg/m2) (end values): sensitivity analysis (longest follow‐up data only) Show forest plot | 2 | Mean Difference (IV, Fixed, 95% CI) | Totals not selected | |
| 3.1 > 1 to 2 years | 1 | Mean Difference (IV, Fixed, 95% CI) | 0.0 [0.0, 0.0] | |
| 3.2 > 5 years | 1 | Mean Difference (IV, Fixed, 95% CI) | 0.0 [0.0, 0.0] | |
| 4 BMI (kg/m2) (end values): sensitivity analysis (shortest follow‐up data only) Show forest plot | 2 | Mean Difference (IV, Fixed, 95% CI) | Totals not selected | |
| 4.1 > 6 to 12 months | 1 | Mean Difference (IV, Fixed, 95% CI) | 0.0 [0.0, 0.0] | |
| 4.2 > 1 to 2 years | 1 | Mean Difference (IV, Fixed, 95% CI) | 0.0 [0.0, 0.0] | |
| 5 Total cholesterol (mmol/L) (end values) Show forest plot | 1 | Mean Difference (IV, Fixed, 95% CI) | Totals not selected | |
| 5.1 > 6 to 12 months | 1 | Mean Difference (IV, Fixed, 95% CI) | 0.0 [0.0, 0.0] | |
| 5.2 > 2 to 5 years | 1 | Mean Difference (IV, Fixed, 95% CI) | 0.0 [0.0, 0.0] | |
| 5.3 > 5 years | 1 | Mean Difference (IV, Fixed, 95% CI) | 0.0 [0.0, 0.0] | |
| 6 Low‐density lipoprotein (LDL) cholesterol (mmol/L) Show forest plot | 1 | Mean Difference (IV, Fixed, 95% CI) | Totals not selected | |
| 6.1 > 6 to 12 months | 1 | Mean Difference (IV, Fixed, 95% CI) | 0.0 [0.0, 0.0] | |
| 6.2 > 2 to 5 years | 1 | Mean Difference (IV, Fixed, 95% CI) | 0.0 [0.0, 0.0] | |
| 6.3 > 5 years | 1 | Mean Difference (IV, Fixed, 95% CI) | 0.0 [0.0, 0.0] | |
| 7 High‐density lipoprotein (HDL)‐cholesterol (mmol) (end values) Show forest plot | 1 | Mean Difference (IV, Fixed, 95% CI) | Totals not selected | |
| 7.1 > 6 to 12 months | 1 | Mean Difference (IV, Fixed, 95% CI) | 0.0 [0.0, 0.0] | |
| 7.2 > 2 to 5 years | 1 | Mean Difference (IV, Fixed, 95% CI) | 0.0 [0.0, 0.0] | |
| 7.3 > 5 years | 1 | Mean Difference (IV, Fixed, 95% CI) | 0.0 [0.0, 0.0] | |
| 8 Triglycerides (mmol/L) (end values) Show forest plot | 1 | Mean Difference (IV, Fixed, 95% CI) | Totals not selected | |
| 8.1 > 6 to 12 months | 1 | Mean Difference (IV, Fixed, 95% CI) | 0.0 [0.0, 0.0] | |
| 8.2 > 2 to 5 years | 1 | Mean Difference (IV, Fixed, 95% CI) | 0.0 [0.0, 0.0] | |
| 8.3 > 5 years | 1 | Mean Difference (IV, Fixed, 95% CI) | 0.0 [0.0, 0.0] | |
| 9 Systolic blood pressure (mmHg) (end values) Show forest plot | 1 | Mean Difference (IV, Fixed, 95% CI) | Totals not selected | |
| 9.1 > 6 to 12 months | 1 | Mean Difference (IV, Fixed, 95% CI) | 0.0 [0.0, 0.0] | |
| 9.2 > 2 to 5 years | 1 | Mean Difference (IV, Fixed, 95% CI) | 0.0 [0.0, 0.0] | |
| 10 Diastolic blood pressure (mmHg) (end values) Show forest plot | 1 | Mean Difference (IV, Fixed, 95% CI) | Totals not selected | |
| 10.1 > 6 to 12 months | 1 | Mean Difference (IV, Fixed, 95% CI) | 0.0 [0.0, 0.0] | |
| 10.2 > 2 to 5 years | 1 | Mean Difference (IV, Fixed, 95% CI) | 0.0 [0.0, 0.0] | |
| 11 Height outcomes (standardised and unstandardised end values) Show forest plot | 2 | Mean Difference (IV, Fixed, 95% CI) | Totals not selected | |
| 11.1 6 months | 1 | Mean Difference (IV, Fixed, 95% CI) | 0.0 [0.0, 0.0] | |
| 11.2 > 6 to 12 months | 2 | Mean Difference (IV, Fixed, 95% CI) | 0.0 [0.0, 0.0] | |
| 11.3 > 2 to 5 years | 1 | Mean Difference (IV, Fixed, 95% CI) | 0.0 [0.0, 0.0] | |
| 11.4 > 5 years | 1 | Mean Difference (IV, Fixed, 95% CI) | 0.0 [0.0, 0.0] | |
| 12 Energy intake (kJ) (end values) Show forest plot | 2 | Mean Difference (IV, Fixed, 95% CI) | Totals not selected | |
| 12.1 > 6 to 12 months | 1 | Mean Difference (IV, Fixed, 95% CI) | 0.0 [0.0, 0.0] | |
| 12.2 > 1 to 2 years | 1 | Mean Difference (IV, Fixed, 95% CI) | 0.0 [0.0, 0.0] | |
| 12.3 > 2 to 5 years | 1 | Mean Difference (IV, Fixed, 95% CI) | 0.0 [0.0, 0.0] | |
| 13 Fat intake (%TE) (end values) Show forest plot | 2 | Mean Difference (IV, Fixed, 95% CI) | Totals not selected | |
| 13.1 > 6 to 12 months | 1 | Mean Difference (IV, Fixed, 95% CI) | 0.0 [0.0, 0.0] | |
| 13.2 > 1 to 2 years | 1 | Mean Difference (IV, Fixed, 95% CI) | 0.0 [0.0, 0.0] | |
| 13.3 > 2 to 5 years | 1 | Mean Difference (IV, Fixed, 95% CI) | 0.0 [0.0, 0.0] | |
| 14 Saturated fat intake (%TE) (end values) Show forest plot | 2 | Mean Difference (IV, Fixed, 95% CI) | Totals not selected | |
| 14.1 > 6 to 12 months | 1 | Mean Difference (IV, Fixed, 95% CI) | 0.0 [0.0, 0.0] | |
| 14.2 > 1 to 2 years | 1 | Mean Difference (IV, Fixed, 95% CI) | 0.0 [0.0, 0.0] | |
| 14.3 > 2 to 5 years | 1 | Mean Difference (IV, Fixed, 95% CI) | 0.0 [0.0, 0.0] | |
| 15 Protein intake (%TE) (end values) Show forest plot | 2 | Mean Difference (IV, Fixed, 95% CI) | Totals not selected | |
| 15.1 > 6 to 12 months | 1 | Mean Difference (IV, Fixed, 95% CI) | 0.0 [0.0, 0.0] | |
| 15.2 > 1 to 2 years | 1 | Mean Difference (IV, Fixed, 95% CI) | 0.0 [0.0, 0.0] | |
| 15.3 > 2 to 5 years | 1 | Mean Difference (IV, Fixed, 95% CI) | 0.0 [0.0, 0.0] | |
| 16 Carbohydrate (%TE) (end values) Show forest plot | 2 | Mean Difference (IV, Fixed, 95% CI) | Totals not selected | |
| 16.1 > 6 to 12 months | 1 | Mean Difference (IV, Fixed, 95% CI) | 0.0 [0.0, 0.0] | |
| 16.2 > 1 to 2 years | 1 | Mean Difference (IV, Fixed, 95% CI) | 0.0 [0.0, 0.0] | |
| 16.3 > 2 to 5 years | 1 | Mean Difference (IV, Fixed, 95% CI) | 0.0 [0.0, 0.0] | |