Efectos de la ingesta total de grasas sobre el peso corporal en niños
Información
- DOI:
- https://doi.org/10.1002/14651858.CD012960Copiar DOI

- Base de datos:
-
- Cochrane Database of Systematic Reviews
- Versión publicada:
-
- 15 febrero 2018see what's new
- Tipo:
-
- Intervention
- Etapa:
-
- Review
- Grupo Editorial Cochrane:
-
Grupo Cochrane de Corazón
- Copyright:
-
- Copyright © 2018 The Cochrane Collaboration. Published by John Wiley & Sons, Ltd.
Cifras del artículo
Altmetric:
Citado por:
Autores
Contributions of authors
The World Health Organization (WHO) Nutrition Guidance Expert Advisory Group (NUGAG) subgroup on diet and health discussed and developed the question for this review. The protocol for the review update in children was drafted by CN and AS, and approved by WHO.
CN and AS developed the search strategy in consultation with the information specialist (VL), who carried out the searches.
CN, AS, MV, KN, SD and SN assessed the eligibility of the studies for inclusion, extracted data and assessed study quality.
CN and AS conducted consensus of trial validity and carried out the GRADE assessment of the trial data.
KN and MV conducted consensus of cohort validity.
CN, AS, MV and KN carried out the GRADE assessments for the cohort studies' data.
CN wrote most sections of the first draft this update, with all other authors contributing drafts of certain sections.
All authors agreed on the final draft of this review.
Sources of support
Internal sources
-
No sources of support supplied
External sources
-
World Health Organization, Other.
The World Health Organization (WHO) provided funding to Stellenbosch University towards the cost of carrying out the update of this systematic review in children
-
Effective Health Care Research Consortium, UK.
CN, MV, SD and AS are partly supported by the Effective Health Care Research Consortium. This Consortium is funded by UK aid from the UK Government for the benefit of developing countries (Grant: 5242). The views expressed in this publication do not necessarily reflect UK government policy
Declarations of interest
The World Health Organization (WHO) provided funding to Stellenbosch University towards the cost of carrying out the update of this systematic review. CN, MV, SD and AS are partly supported by the Effective Health Care Research Consortium. This Consortium is funded by UK aid from the UK Government for the benefit of developing countries (Grant: 5242). The views expressed in this publication do not necessarily reflect UK government policy.
Acknowledgements
We thank the following people:
-
Lee Hooper and coauthors of the previous reviews on total fat intake and bodyweight in both adults and children;
-
Vittoria Lutje for the search strategy and searches conducted;
-
Selvan Naidoo (SN) for assistance with screening and data extraction;
-
Toby Lasserson, Helen Wakeford and Kerry Dwan from the Cochrane Editorial and Methods Department for invaluable assistance throughout the review process;
-
Authors of included studies who provided requested study information;
-
WHO for funding.
Version history
| Published | Title | Stage | Authors | Version |
| 2018 Jul 05 | Effects of total fat intake on bodyweight in children | Review | Celeste E Naude, Marianne E Visser, Kim A Nguyen, Solange Durao, Anel Schoonees | |
| 2018 Feb 15 | Effects of total fat intake on bodyweight in children | Review | Celeste E Naude, Marianne E Visser, Kim A Nguyen, Solange Durao, Anel Schoonees | |
Differences between protocol and review
Differences between review (2015) in adults and children, and this updated review (2018) in children only:
-
Removed quality of life as an outcome.
-
Did not exclude studies based on outcome reporting as a criterion, unless none of our eligible outcomes were reported and we judged that our outcomes were outside of the scope of the study (i.e. one would not expect them to be reported in the particular study).
-
Included only explanatory models and excluded analyses that used baseline data to predict later body fatness without empirical data from the later time point (predictive models).
-
Added extra domains for assessing risk of bias in cohort studies.
Removal of the following intended subgroup analyses:
-
year of first publication of results (1960s, 1970s, 1980s, 1990s, 2000s, 2010s);
-
sex (studies of women only, of men only, of men and women mixed);
-
by total fat goal in the intervention arm (10% energy to less than 15% energy from fat, 15% energy to less than 20% energy from fat, 20% energy to less than 25% energy from fat, 25% energy to less than 30% energy from fat, 30% energy from fat, and no specific goal stated); and
-
mean BMI at baseline (less than 25, 25 to less than 30, greater than 30); state of health at baseline (not recruited on the basis of risk factors or disease, recruited on the basis of risk factors such as lipids, hormonal levels, etc., recruited on the basis of having or having had diseases such as diabetes, myocardial infarction, cancer or polyps.
Keywords
MeSH
Medical Subject Headings (MeSH) Keywords
Medical Subject Headings Check Words
Adolescent; Child; Child, Preschool; Female; Humans; Infant; Male;
PICO
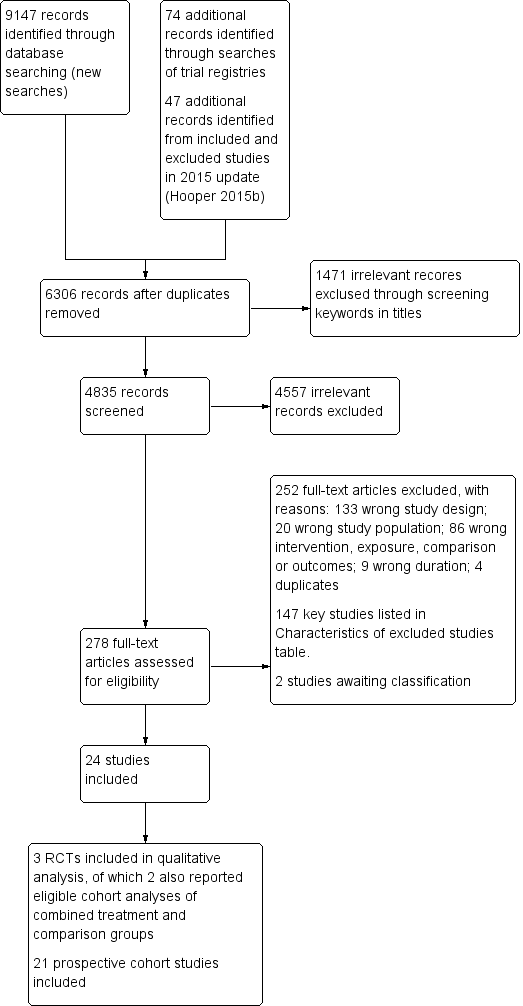
Study flow diagram. RCT: randomised controlled trial.

The bubble‐plot presents the spread of the different ways in which total fat intake estimates were expressed and applied to examine associations with body fatness in the 81 analyses, reporting primary outcomes in the five time point ranges. Combining the many various total fat intake exposure estimates reporting on the same outcome in the same time point range was deemed inappropriate. BMI: body mass index; WC: waist circumference; yr: year.

Risk of bias graph: review authors' judgements about each risk of bias item presented as percentages across all included studies.

Risk of bias summary: review authors' judgements about each risk of bias item for each included study. RCT: randomised controlled trial.

Comparison 1 Lower fat intake (30% or less of total energy (TE)) versus usual/modified fat intake by time point ranges, Outcome 1 Weight outcomes (standardised and unstandardised end values).
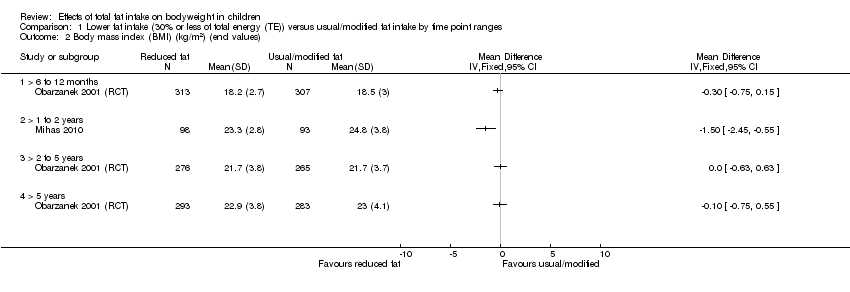
Comparison 1 Lower fat intake (30% or less of total energy (TE)) versus usual/modified fat intake by time point ranges, Outcome 2 Body mass index (BMI) (kg/m2) (end values).

Comparison 1 Lower fat intake (30% or less of total energy (TE)) versus usual/modified fat intake by time point ranges, Outcome 3 BMI (kg/m2) (end values): sensitivity analysis (longest follow‐up data only).

Comparison 1 Lower fat intake (30% or less of total energy (TE)) versus usual/modified fat intake by time point ranges, Outcome 4 BMI (kg/m2) (end values): sensitivity analysis (shortest follow‐up data only).

Comparison 1 Lower fat intake (30% or less of total energy (TE)) versus usual/modified fat intake by time point ranges, Outcome 5 Total cholesterol (mmol/L) (end values).
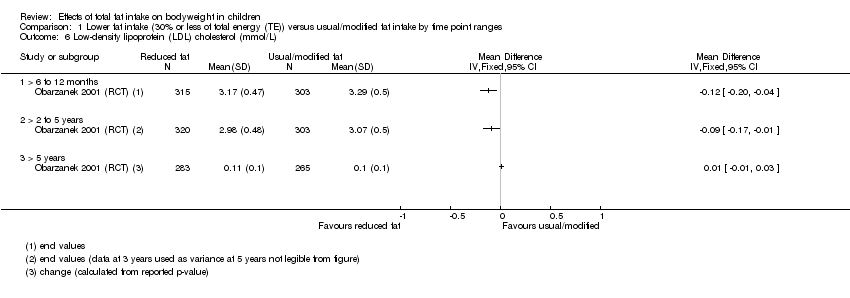
Comparison 1 Lower fat intake (30% or less of total energy (TE)) versus usual/modified fat intake by time point ranges, Outcome 6 Low‐density lipoprotein (LDL) cholesterol (mmol/L).

Comparison 1 Lower fat intake (30% or less of total energy (TE)) versus usual/modified fat intake by time point ranges, Outcome 7 High‐density lipoprotein (HDL)‐cholesterol (mmol) (end values).
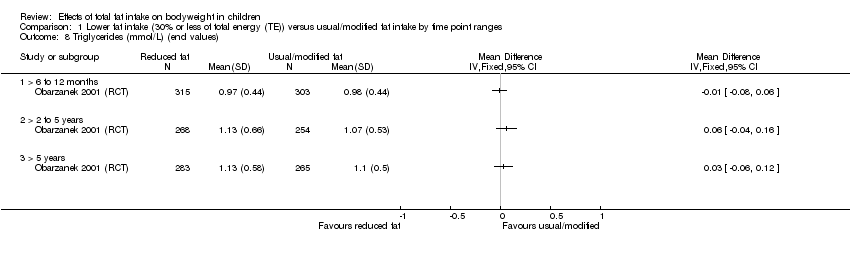
Comparison 1 Lower fat intake (30% or less of total energy (TE)) versus usual/modified fat intake by time point ranges, Outcome 8 Triglycerides (mmol/L) (end values).

Comparison 1 Lower fat intake (30% or less of total energy (TE)) versus usual/modified fat intake by time point ranges, Outcome 9 Systolic blood pressure (mmHg) (end values).

Comparison 1 Lower fat intake (30% or less of total energy (TE)) versus usual/modified fat intake by time point ranges, Outcome 10 Diastolic blood pressure (mmHg) (end values).

Comparison 1 Lower fat intake (30% or less of total energy (TE)) versus usual/modified fat intake by time point ranges, Outcome 11 Height outcomes (standardised and unstandardised end values).

Comparison 1 Lower fat intake (30% or less of total energy (TE)) versus usual/modified fat intake by time point ranges, Outcome 12 Energy intake (kJ) (end values).

Comparison 1 Lower fat intake (30% or less of total energy (TE)) versus usual/modified fat intake by time point ranges, Outcome 13 Fat intake (%TE) (end values).
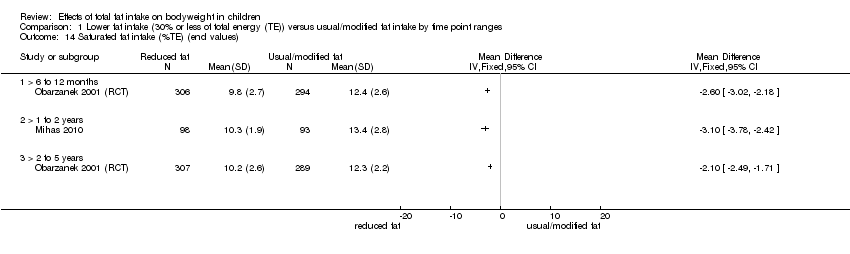
Comparison 1 Lower fat intake (30% or less of total energy (TE)) versus usual/modified fat intake by time point ranges, Outcome 14 Saturated fat intake (%TE) (end values).

Comparison 1 Lower fat intake (30% or less of total energy (TE)) versus usual/modified fat intake by time point ranges, Outcome 15 Protein intake (%TE) (end values).
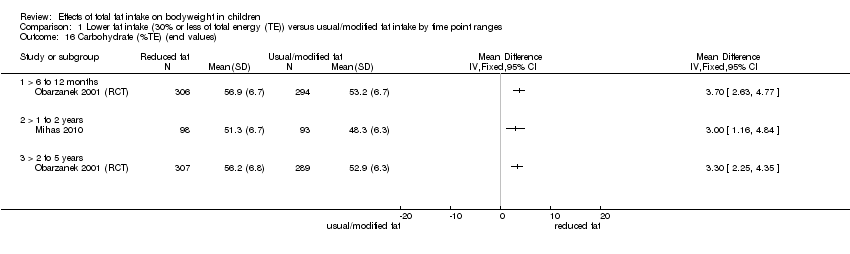
Comparison 1 Lower fat intake (30% or less of total energy (TE)) versus usual/modified fat intake by time point ranges, Outcome 16 Carbohydrate (%TE) (end values).
| Total fat intake ≤ 30% of total energy compared to usual fat intake for bodyweight in children (RCTs) A comprehensive table including data for all time points for each outcome can be found in Appendix 2 | |||||
| Patient or population: boys and girls aged 24 months to 18 years Setting: paediatric practices, schools and health maintenance organisations in high‐income countries Intervention: lower total fat intake ≤ 30%TE Comparison: usual or modified fat intake | |||||
| Outcomes (at time point ranges where data were reported) | No of participants (No of studies) | Illustrated comparative effect (95% CI) | Quality | What happens | |
| Usual fat intake1 | Effect difference with total fat ≤ 30% of total energy2 | ||||
| Weight‐for‐age z‐score Follow‐up: range 6 to 12 months | 151 (1 RCT) | The mean weight‐for‐age z‐score in control group was 0.29 | MD 0.18 lower | ⊕⊝⊝⊝ | We were uncertain whether lower total fat intake (≤ 30%TE) had an effect on weight‐for‐age in children over a 12‐month period (1 study). |
| Weight (kg) | 620 (1 RCT) | The mean weight (kg) in control group was 38.2 | MD 0.5 lower | ⊕⊕⊝⊝ | Lower total fat intake (≤ 30%TE) may have made little or no difference to weight in children over a 5‐year period (1 study). |
| Follow‐up: range 2 to 5 years | 612 (1 RCT) | The mean weight (kg) in control group was 49.5 | MD 0.6 lower | ⊕⊕⊝⊝ | |
| BMI (kg/m2) | 620 (1 RCT) | The mean BMI (kg/m2) in control group was 18.5 | MD 0.3 lower | ⊕⊕⊝⊝ | Lower total fat intake (≤ 30%TE) may have made little or no difference to BMI in children over a 1‐year period (1 study). |
| Follow‐up: range 1 to 2 years | 191 (1 RCT) | The mean BMI (kg/m2) in control group was 24.8 | MD 1.5 lower | ⊕⊕⊕⊝ | Lower total fat intake (≤ 30%TE) probably reduced BMI in children over a period of 1 to 2 years (1 study). |
| Follow‐up: range 2 to 5 years | 541 (1 RCT) | The mean BMI (kg/m2) in control group was 21.7 | MD 0 | ⊕⊕⊝⊝ | Lower total fat intake (≤ 30%TE) may have made little or no difference to BMI in children over a 2 to 5‐year period and > 5‐years (1 study). Please see Appendix 2 for Data for > 5 years. |
| Total cholesterol (mmol/L) | 618 (1 RCT) | The mean total cholesterol (mmol/L) in control group was 5.1 | MD 0.15 lower | ⊕⊕⊕⊝ | Total fat intake ≤ 30%TE probably slightly reduced total cholesterol in children over a 12‐month period (1 study). |
| Follow‐up: range 2 to 5 years | 522 (1 RCT) | The mean total cholesterol (mmol/L) in control group was 4.6 | MD 0.06 lower | ⊕⊕⊝⊝ | Lower total fat intake (≤ 30%TE) may have made little or no difference to total cholesterol in children over a 2 to 5‐year period and > 5‐years (1 study). Please see Appendix 2 for Data for > 5 years. |
| LDL‐C (mmol/L) | 618 (1 RCT) | The mean LDL‐C (mmol/L) in control group was 3.29 | MD 0.12 lower | ⊕⊕⊕⊝ | Lower total fat intake (≤ 30%TE) probably reduced LDL‐C in children over a 12‐month period (1 study) and over a 2 to 5‐year period (1 study). Please see Appendix 2 for Data for > 5 years. |
| Follow‐up: range 2 to 5 years | 623 (1 RCT) | The mean LDL‐C (mmol/L) in control group was 3.07 | MD 0.09 lower | ⊕⊕⊕⊝ | |
| HDL‐C (mmol/L) | 618 (1 RCT) | The mean HDL‐C (mmol/L) in control group was 1.47 | MD 0.03 lower | ⊕⊕⊕⊝ | Lower total fat intake (≤ 30%TE) probably made little or no difference to HDL‐C in children over a 6 to 12‐month period (1 study) and over a 2 to 5‐year period (1 study). Please see Appendix 2 for Data for > 5 years. |
| Follow‐up: range 2 to 5 years | 522 (1 RCT) | The mean HDL‐C (mmol/L) in control group was 1.32 | MD 0.01 lower | ⊕⊕⊕⊝ | |
| Triglycerides (mmol/L) | 618 (1 RCT) | The mean triglycerides (mmol/L) in control group was 0.98 | MD 0.01 lower | ⊕⊕⊕⊝ | Lower total fat intake (≤ 30%TE) probably made little or no difference to triglycerides in children over a 6 to 12‐month period (1 study). Please see Appendix 2 for Data for > 2 years. |
| Height‐for‐age z‐score Follow‐up: range 6 to 12 months | 151 (1 RCT) | The mean height‐for‐age z‐score in control group was 0.05 | MD 0.05 lower | ⊕⊝⊝⊝ | We were uncertain whether lower total fat intake (≤ 30%TE) reduced height‐for‐age in children over a 12‐month period (1 study). |
| Height (cm) | 642 (1 RCT) | The mean height (cm) in control group was 143.1 | MD 0 | ⊕⊕⊝⊝ | Lower total fat intake (≤ 30%TE) may have made little or no difference to height in children over a period > 5 years (1 study). |
| Follow‐up: range 2 to 5 years | 540 (1 RCT) | The mean height (cm) in control group was 167.4 | MD 0.10 lower | ⊕⊕⊝⊝ | |
| %TE: percentage of total energy; BMI: body mass index; CI: confidence interval; HDL‐C: high‐density lipoprotein cholesterol; LDL‐C: low‐density lipoprotein cholesterol; MD: mean difference; RCT: randomised controlled trial. aNotes: For all outcomes, there were too few studies to assess publication bias. | |||||
| GRADE Working Group grades of evidence | |||||
| 1Mean change observed between baseline and follow‐up in the control group. 2Difference in intervention group (and its 95% confidence interval) was based on the assumed change in the comparison group (and its 95% confidence interval). 3Downgraded by 1 for risk of bias: unclear risk of bias across all domains. 4Only 1 study for this outcome, therefore we could not rate for inconsistency. 5Downgraded by 1 for indirectness: participants were children with raised blood lipids, thus results may not be directly generalisable to all children. 6Downgraded by 1 for imprecision: small sample size and confidence interval included no effect and important benefit or harm. 7Not downgraded for serious risk of bias; a well‐conducted trial (methods in place to minimise risk of selection, performance, detection, attrition and reporting bias). 8Downgraded by 1 for imprecision: confidence interval included no effect and important benefit or harm. 9Downgraded by 1 for risk of bias: allocation concealment not reported. 10Not downgraded for serious imprecision: both bounds of the confidence interval indicate benefit, and calculated optimal information size met (158 patients are required to have a 80% chance of detecting, as significant at the 5% level, an important decrease in BMI of 1.7 kg/m2 (the average of the change across the 50th to 97th percentiles in 12.5 year‐olds, as per BMI‐for‐age tables, Centers of Disease Control & Prevention, 2000). 11Not downgraded for serious imprecision: both bounds of the confidence interval indicate benefit. 12Not downgraded for serious imprecision: precise estimate of no effect. 13Downgraded by 1 for imprecision: small sample size (optimal information size not met). | |||||
| Total fat intake and bodyweightin children (cohort studies) A comprehensive table including data for all time points for each outcome can be found in Appendix 3 | ||||
| Patient or population: boys and girls aged 24 months to 18 years Setting: communities, schools, households, healthcare centres in high‐income countries Exposure: total fat intake | ||||
| Outcomes | No of studies (No of participants) | Impact | Quality | What happens |
| Weight (kg) Follow‐up: 2 to 5 years | 4 cohort studies (13,802) | 2 studies that adjusted for TE intake: After 3 years, "Dairy fat was not a stronger predictor of weight gain than other types of fat, and no fat (dairy, vegetable, or other) intake was significantly associated with weight gain after energy adjustment, nor was total fat intake;" no numerical results reported. After 3 years, for every 1% increase in TE intake from total fat of children, weight will decrease by 0.0011 kg. 2 studies that did not adjust for TE intake: After 4 years, weight of children with low‐fat intake (< 30%TE) will increase by 8.1 kg on average, and by 8.9 kg on average in children with high‐fat intake (> 35%TE). After 2 years, children with low‐fat intake (≤ 30%TE) will gain on average 0.2 kg per year more than children with high‐fat intakes (> 30%TE) | ⊕⊝⊝⊝ | When adjusted for TE, we were uncertain whether fat intake was associated with weight in children over 2 to 5 years. When not adjusted for TE, we were uncertain whether lower fat was associated with weight in children over 2 to 5 years. |
| Follow‐up: 5 to 10 years | 1 cohort study (126) | 1 study that did not adjust for TE intake: After 6 years, weight of children with low‐fat intake (< 30%TE) will increase by 16.8 kg on average, and by 13.9 kg on average in children with high‐fat intake (> 35%TE) | ⊕⊝⊝⊝ | We were uncertain whether fat intake was associated with weight over 5 to 10 years (1 study). |
| BMI (kg/m2, kg/m2 per year, z‐score, percentile) Follow‐up: 2 to 5 years | 7 cohort studies (3143) | 4 studies that adjusted for TE intake: After 3 years, for every 1% increase in energy intake from total fat, BMI will decrease by 0.63 z‐score in boys but increase by 0.07 z‐score in girls. "Dietary factors were not associated with BMI across the three study years." After 3 years, for every 1% increase in energy intake from total fat, BMI will decrease by 0.00008 kg/m2. After 4 years, increase in the total fat intake, will increase BMI by 0.087 z‐score. The model explained 48% of variance in the change of BMI z‐score. 2 studies that did not adjust for TE intake: After 2.08 years, low‐fat intake (≤ 30%TE) will result in a 0.02 kg/m2 per year greater increase in BMI on average, compared to high‐fat intake (> 30%TE). After 3 years, for every 1% increase in energy intake from total fat, BMI will decrease by 0.01 percentile in girls. 1 study where TE adjustment was not applicable, as TE was part of exposure: After 3 years, for every 1 z‐score increase in the energy‐dense, high‐fat and low‐fibre dietary pattern, BMI will increase by 0.03 z‐score in boys and by 0.99 z‐score in girls. After 3 years, the ratio of odds for being overweight/obese was 1.04 greater in boys and 1.02 greater in girls with higher dietary pattern z‐scores, compared to the odds in boys and girls with lower dietary pattern z‐scores. | ⊕⊝⊝⊝ Very low6,7,8 | We were uncertain whether fat intake was associated with BMI in children over 2 to 10 years. |
| Follow‐up: 5 to 10 years | 4 cohort studies (1158) | 3 studies that adjusted for TE intake: After 6 years, for every 1% increase in energy intake from total fat, BMI will decrease by 0.011 z‐score in boys but increase by 0.005 z‐score in girls. After 9 years, increase in the total fat intake will increase BMI by 0.122 z‐score. After 10 years, for every 1% increase in energy intake from total fat, BMI will increase by 0.029 kg/m2 in white girls and by 0.012 kg/m2 in black girls. 1 study that did not adjust for TE intake: After 6 years, for every 1 g increases in the fat intake, BMI will increase by 0.01 kg/m2 | ⊕⊝⊝⊝ | |
| LDL‐C (mmol/L) Follow‐up: 2 to 5 years | 1 cohort study (1163) | 1 study where TE adjustment not applicable, as TE was part of exposure: After 3 years, for every 1 z‐score increase in the energy‐dense, high‐fat and low‐fibre dietary pattern, LDL‐C will increase by 0.001 mmol/L in boys and 0.04 mmol/L in girls | ⊕⊝⊝⊝ | We were uncertain whether fat intake was associated with LDL‐C in children over 2 to 5 years (1 study). |
| HDL‐C (mmol/L) Follow‐up: 2 to 5 years | 2 cohort studies (1393) | 1 study that adjusted for TE intake: After 3 years, for every 1% increase in energy intake from total fat, HDL‐C will decrease by 0.21 mmol/L in girls. 1 study where TE adjustment not applicable, as TE was part of exposure: After 3 years, for every 1 z‐score increase in the energy‐dense, high‐fat and low‐fibre dietary pattern, HDL‐C will decrease by 0.002 mmol/L in boys but increase by 0.02 mmol/L in girls. | ⊕⊕⊝⊝ | When adjusted for TE, fat intake may be inversely associated with HDL‐C in girls over 2 to 5 years (1 study). When not adjusted for TE, fat intake may make little or no difference to HDL‐C in girls over 2 to 5 years (1 study). |
| Triglycerides (mmol/L) Follow‐up: 2 to 5 years | 1 cohort study (1163) | 1 study where TE adjustment not applicable, as TE was part of exposure: After 3 years, for every 1 z‐score increase in the energy‐dense, high‐fat and low‐fibre dietary pattern, triglycerides will increase by 1% in either boys or girls. | ⊕⊝⊝⊝ | We were uncertain whether fat intake was associated with triglycerides in children over 2 to 5 years (1 study). |
| Height (cm) Follow‐up: 2 to 5 years | 3 cohort studies (973) | 1 study that adjusted for TE intake: After 3 years, for every 1% increase in energy intake from fat, height in children will decrease by 0.0009 cm on average. 2 studies that did not adjust for TE intake: After 2 years, low‐fat intake (≤ 30%TE) will result in a 0.2 cm per year greater increase in height on average compared to high‐fat intake (> 30%TE). After 4 years, on average children in low‐fat intake (< 30%TE) gain 27.9 cm in height, while children in high‐fat intake (> 35%TE) gain 28.3 cm in height. | ⊕⊝⊝⊝ | We were uncertain whether fat intake was associated with height in children over 2 to 10 years. |
| Follow‐up: 5 to 10 years Age at baseline: 2 years | 1 cohort study (126) | 1 study that did not adjust for TE intake: At 6 years, on average children in low‐fat intake (< 30%TE) gain 44.9 cm in height while children in high‐fat intake (> 35%TE) gain 40.3 cm in height. | ⊕⊝⊝⊝ | |
| BMI: body mass index; HDL‐C: high‐density lipoprotein cholesterol; LDL‐C: low‐density lipoprotein cholesterol; MD: mean difference; TE: total energy. aNotes: Some cohort studies reported more than one eligible analysis for the same outcome (e.g. BMI as continuous or binary outcome) or different measures of exposure (e.g. fat intake as continuous %TE or as binary classification of less‐exposed vs more‐exposed). In these cases, we selected outcomes and exposure measures so as not to use the same study sample of participants more than once per outcome and time point range in the table. For all outcomes, there were too few studies to assess publication bias. | ||||
| GRADE Working Group grades of evidence | ||||
| 1Although, risk of bias was concerning (studies with strong contributions did not adjust for all important prognostic variables), plausible residual confounding would likely reduce the demonstrated effect in the studies that did not adjust for total energy intake; thus we chose not to downgrade for risk of bias. 2Downgraded by 1 for imprecision: in studies reporting variance, the variance included no effect and important benefit or harm. 3Although risk of selection bias (no matching of exposed and non‐exposed groups, or statistical adjustments) and attrition bias (> 50% attrition) was concerning, plausible residual confounding would likely reduce the demonstrated effect as this study did not adjust for total energy; thus we chose not to downgrade for selection bias. 4Only 1 study for this outcome, therefore we could not rate for inconsistency. 5Downgraded by 1 for indirectness: a single study in a high‐income country likely has limited generalisability. 6Imprecision was considered, but we considered a decision would not impact on the rating and thus no judgement was made for imprecision. 7Downgraded by 1 for risk of bias: risk of selection bias: 5 studies did not match exposed and non‐exposed groups or make important statistical adjustments; high risk of detection bias: dietary assessment for 3 studies were not adequately rigorous. 8Downgraded by 1 for inconsistency: some studies reported small to large positive associations between exposure and outcome, while others reported no association or a small to medium inverse association between exposure and outcome. 9Downgraded by 1 for risk of bias: risk of selection bias: 2 studies with strongest contributions, did not adjust for all important prognostic variables; high risk of detection bias: dietary assessment in 1 study was not adequately rigorous. 10Downgraded by 1 for risk of bias: risk of selection bias; no matching of exposed and unexposed groups or adjustment for all important prognostic variables. 11Study was judged to have a lower overall risk of bias; attrition < 50% and satisfactory assessment of exposure. 12Not downgraded for serious imprecision as judged to be precise estimates of no effect in both studies. | ||||
| Recipients | Why | What (materials) | What (procedures) | Who provided | How and where | When and how much | Strategies to improve or maintain intervention fidelity; tailoring and modification | Extent of intervention fidelity |
| 4‐ to 9‐year‐old children with hypercholesterolaemia (plasma total cholesterol > 4.55 mmol/L, fasting plasma LDL‐C 2.77‐4.24 mmol/L for boys and 2.90‐4.24 mmol/L for girls), at ≥ 85% of ideal body weight. | Limited dietary fat was recommended for children aged > 2 years, but there were concerns that lower fat intake of children may affect their growth. Trial evaluated growth of children with hypercholesterolaemia completing an innovative, physician‐initiated, home‐based nutrition education programme or standard nutrition counselling that aimed to lower dietary fat intake. | Nutrition education programme complied with recommendations of the National Cholesterol Education Program Expert Panel on Blood Cholesterol Levels in Children and Adolescents. | Children and ≥ 1 parent (usually mother) attended 45‐ to 60‐minute counselling session with paediatric dietician. Children and parents in at‐risk control and not‐at‐risk control groups were not provided educational information or materials. | 1) Not described; 2) paediatric registered dieticians. | 1) Audiotape stories and picture books and follow‐up paper/pencil activities for children as well as manual for parents. Story and activities to be completed each week; 2) face‐to‐face individual counselling by a dietician. 1) At home; 2) paediatric practice. | 10 weeks with 1) talking‐book lesson; 2) 45‐60 minutes counselling session each week. | Not described Tailoring and modification of intervention during trial were not described. | 1) 71/88; 2) 77/86 completed intervention programmes and returned for evaluation at 3 months after baseline. |
| Prepubertal boys and girls aged 8‐11 years with LDL‐C levels ≥ 80th and < 98th percentiles for age and sex percentiles of the Lipid Research Clinics population. | Aimed to assess feasibility, safety, efficacy and acceptability of lowering dietary intake of total fat, saturated fat and cholesterol to decrease LDL‐C levels. | Intervention group received dietary counselling sessions based on National Cholesterol Education Programme guidelines: 28% of energy from total fat, < 8% from saturated fat, > 9% from polyunsaturated fat, and < 75 mg/1000 kcal of cholesterol per day, not to exceed 150 mg/day. Guidebooks including activities and recipes on diets and food recommendations given to participants and their families. | In first 6 months, 6 weekly and then 5 biweekly group sessions were led by nutritionists and behaviourists, and 2 individual visits were held with nutritionist. Over second 6 months, 4 group and 2 individual sessions were held. During 2nd and 3rd years, group and individual maintenance sessions were held 4‐6 times/year, with monthly telephone contacts between group sessions. During 4th year of follow‐up, 2 group events + 2 individual visits conducted with additional telephone contacts as appropriate. | Nutritionists and behaviourists | 1) Group sessions and 2) individual visits were held, accompanied by telephone contacts in between sessions. 1) At clinics, 2) at home | 6 weekly, 5 biweekly group sessions and 2 individual visits during first 6 months; 4 group and 2 individual sessions during second 6 months; 4‐6 maintenance sessions with telephone contacts between sessions during 2nd and 3rd years; 2 group and 2 individual sessions with telephone contacts as appropriate by 4th year. | By 4th year of follow‐up, individual visits used an individualised approach based on motivational interviewing and stage of change for increasingly busy teenagers. Tailoring and modification of intervention during trial not described. | 295/334 attended the last visit (> 5 years' follow‐up). |
| Students aged 12‐13 years from an urban area in Greece. | Aimed to evaluate the short‐term (15‐day) and long‐term (12‐month) effects of a 12‐week school‐based health and nutrition interventional programme regarding energy and nutrient intake, dietary changes and BMI. | Teaching material for teachers and workbooks for students on nutrition‐dietary habits and physical activity and health based on Social Learning Theory Model were developed and distributed to teacher and each student. | Multicomponent workbooks covering mainly dietary issues, but also dental health hygiene and consumption attitudes, were produced with each student being supplied a workbook. The class home economics teacher implemented 12‐hour‐classroom curriculum incorporating health and nutrition promotion during 12 weeks. 2 meetings were conducted with parents (given screening results of children; presentations given on dietary habits of children to improve health profile of children and prevent development of chronic diseases in the future). Cues and reinforcing messages in the form of posters and displays were provided in the classroom. | Educational intervention (classroom curriculum) delivered by class home economics teachers who were trained and supervised by health visitor or family doctor. | Classroom curriculum; cues and reinforcing messages in the form of posters and displays provided in classroom; nutrition education meetings for parents in group. At school. | 12 hours of classroom material, 2 meetings for parents during a 12‐week period. | Health visitor or family doctor supervised the programme implementation of class home economics teachers who were given 2 × 3‐hour seminars with aims to familiarise teachers about objectives of intervention and their role therein, and to increase their awareness of significance of incorporating health and nutrition in their curriculum before delivering the intervention. Tailoring and modification of intervention during trial not described. | 107/109 participation rates at 15‐days' follow‐up and 98/109 at 12 months' follow‐up. |
| aTIDieR: Template for Intervention Description and Replication, template for this table from Hoffman 2017. BMI: body mass index; LDL‐C: low‐density lipoprotein cholesterol; RCT: randomised controlled trial. | ||||||||
| Outcome Study ID | Follow‐up from baseline | |||||
| Baseline Mean (SD)a | 6 months MD (95% CI) | > 6 to 12 months MD (95% CI) | > 1 to 2 years MD (95% CI) | > 2 to 5 years MD (95% CI) | > 5 years MD (95% CI) | |
| Weight‐for‐age z‐scoreb | ||||||
| 0.04 (1.02); 0.26 (0.93) | ‐0.14 (‐0.45 to 0.17) | ‐0.18b (‐0.51 to 0.15) | ND | ND | ND | |
| Body weight (kg)b | ||||||
| 32.7 (6.8); 33.1 (6.9) | ND | ‐0.50b (‐1.78 to 0.78) | ND | ‐0.60 (‐2.39 to 1.19) | ND | |
| BMI (kg/m2) | ||||||
| 17.5 (2.3); 17.6 (2.4) | ND | ‐0.30 (‐0.75 to 0.15) | ND | 0.00 (‐0.63 to 0.63) | ‐0.10 (‐0.75 to 0.55) | |
| 24 (3.1); 24.3 (3.3) | ND | ND | ‐1.50 (‐2.45 to ‐0.55) | ND | ND | |
| aReduced fat intake group (≤ 30%TE); usual fat intake group. bWeight‐for‐age z‐score and weight (kg) could not be pooled. %TE: percentage of total energy; BMI: body mass index; CI: confidence interval; MD: mean difference; ND: no data in this time point range; SD: standard deviation. | ||||||
| Outcome | Follow‐up from baseline | |||||
| Baseline Mean (SD)a | 6 months MD (95% CI) | > 6 to 12 months MD (95% CI) | > 1 to 2 years MD (95% CI) | > 2 to 5 years MD (95% CI) | > 5 years MD (95% CI) | |
| Total cholesterol (mmol/L) | 5.17 (0.38); 5.17 (0.38) | ND | ‐0.15 (‐0.24 to ‐0.06) | ND | ‐0.06 (‐0.17 to 0.05) | ‐0.02 (‐0.13 to 0.09) |
| LDL‐C (mmol/L) | 3.38 (0.31); 3.38 (0.3) | ND | ‐0.12 (‐0.20 to ‐0.04) | ND | ‐0.09 (‐0.17 to ‐0.01) | 0.01 (‐0.01 to 0.03) |
| HDL‐C (mmol/L) | 1.48 (0.28); 1.47 (0.29) | ND | ‐0.03 (‐0.08 to 0.02) | ND | ‐0.01 (‐0.06 to 0.04) | 0.02 (‐0.03 to 0.07) |
| Triglycerides (mmol/L) | 0.9 (0.33); 0.92 (0.32) | ND | ‐0.01 (‐0.08 to 0.06) | ND | 0.06 (‐0.04 to 0.16) | 0.03 (‐0.06 to 0.12) |
| SBP (mmHg) | 97.31 (9.1); 97.55 (9.4) | ND | ‐0.40 (‐1.70 to 0.90) | ND | ‐0.40 (‐1.84 to 1.04) | ND |
| DBP (mmHg) | 61.97 (9.54); 61.67 (10.23) | ND | ‐0.50 (‐2.00 to 1.00) | ND | ‐0.90 (‐2.30 to 0.50) | ND |
| aReduced fat intake group (≤ 30%TE); usual fat intake group. %TE: percentage of total energy; CI: confidence interval; DBP: diastolic blood pressure; HDL‐C: high‐density lipoprotein cholesterol; LDL‐C: low‐density lipoprotein cholesterol; MD: mean difference; ND: no data in this time point range; SBP: systolic blood pressure; SD: standard deviation. | ||||||
| Outcome Study ID | Follow‐up from baseline | |||||
| Baseline Mean (SD)a | 6 months MD (95% CI) | > 6 to 12 months MD (95% CI) | > 1 to 2 years MD (95% CI) | > 2 to 5 years MD (95% CI) | > 5 years MD (95% CI) | |
| Height‐for‐age z‐scoreb | ||||||
| ‐0.12 (1.02); 0.06 (0.93) | ‐0.02 (‐0.06 to 0.02) | ‐0.05b (‐0.08 to‐0.02) | ND | ND | ND | |
| Height (cm)b | ||||||
| 136.2 (6.8); 136.5 (7) | ND | 0.00b (‐1.11 to 1.11) | ND | ‐0.10 (‐1.54 to 1.34) | ‐0.06 (‐2.06 to 0.86) | |
| aReduced fat intake group (≤ 30%TE); usual fat intake group. bHeight‐for‐age z‐score and height (cm) cannot be pooled. %TE: percentage of total energy; CI: confidence interval; MD: mean difference; ND: no data in this time point range; RCT: randomised controlled trial; SD: standard deviation. | ||||||
| Outcome Study ID | Follow‐up from baseline | |||||
| Baseline Mean (SD)a | 6 months MD (95% CI) | > 6 to 12 months MD (95% CI) | > 1 to 2 years MD (95% CI) | > 2 to 5 years MD (95% CI) | > 5 years MD (95% CI) | |
| Energy (kJ) | ||||||
| 7364 (1832); 7229 (1841) | ND | ‐356.00 (‐655.22 to ‐56.78) | ND | ‐602.00 (‐943.94 to ‐260.06) | ND | |
| 8503.3 (1419.3); 8583.7 (1522.4) | ND | ND | ‐645.50 (‐1075.66 to ‐215.34) | ND | ND | |
| Fat (%TE) | ||||||
| 33.4 (5.5); 34 (4.9) | ND | ‐4.60 (‐5.50 to ‐3.70) | ND | ‐4.40 (‐5.25 to ‐3.55) | ND | |
| 35.4 (4.7); 36.2 (5.2) | ND | ND | ‐5.60 (‐6.91 to ‐4.29) | ND | ND | |
| Saturated fat (%TE) | ||||||
| 12.5 (2.7); 12.7 (2.5) | ND | ‐2.60 (‐3.02 to ‐2.18) | ND | ‐2.10 (‐2.49 to ‐1.71) | ND | |
| 12.4 (2.0); 12.8 (2.3) | ND | ND | ‐3.10 (‐3.78 to ‐2.42) | ND | ND | |
| Protein (%TE) | ||||||
| 14.8 (2.8); 14.6 (2.7) | ND | 1.00 (0.52 to 1.48) | ND | 0.90 (0.38 to 1.42) | ND | |
| 15.3 (1.4); 14.9 (1.8) | ND | ND | 1.30 (0.80 to 1.80) | ND | ND | |
| Carbohydrates (%TE) | ||||||
| 53.0 (6.7); 52.8 (6.2) | ND | 3.70 (2.63 to 4.77) | ND | 3.30 (2.25 to 4.35) | ND | |
| 49.7 (6.2); 48.4 (6.8) | ND | ND | 3.00 (1.16 to 4.84) | ND | ND | |
| aReduced fat intake group (≤ 30%TE); usual fat intake group. %TE: percentage of total energy; MD: mean difference; ND: no data in this time point range; RCT: randomised controlled trial; SD: standard deviation. | ||||||
| Study ID; mean age at baseline; analysis | Outcome | Outcome units | Time point (year) | Exposure | Exposure unit | Results of association (all reported values) | Direction;a energy intake adjusted (yes/no) | Matched groups or adjusted for (or both) | |
| Weight at 1 year: 4 cohort studies; 4 analyses (n ˜ 1949) in boys and girls aged 2‐11 years | |||||||||
| 2 years old; mean end values per group | Relative weightb | % | 1 | Total fat intake (single 4‐day dietary record at baseline, 1.5 and 2 years) | LF (27.7‐28.7 %TE; HF (> 28.7 %TE) | n overall = 740 (LF = 35, HF = 705); mean end values (SD). Baseline: LF = 1 (8); HF = 1 (8). At 1 year: LF = 1 (7); HF = 1 (8); P = 0.81. After 1 year, no difference in relative weight change of children with LF intake compared to children with HF intakes. | 0 No | No matching reported. No adjustment for prognostic variables. | |
| 6.8 years old; regression | Weight | kg | 1 | Total fat intake (single 7‐day weighed dietary record at baseline and 1 year) | g | n overall = 411; regression result. B = 0.09, SE 0.019; P < 0.05. After 1 year, for every 1 g increase in total fat intake of children, weight will increase by 0.09 kg. | + No | Adjusted for age, gender and physical activity. | |
| 11 years old; regression | Weight | kg/year | 1 | Total fat intake (multiple 24‐hour dietary recalls at baseline) | %TE | n overall = 798; regression result. B = 0.044, SE 0.018; P = 0.014. For every 1% increase in energy intake from total fat in children, weight will increase by 0.04 kg/year. | + No | Adjusted for gender, age, age squared, Tanner stage and BMI. | |
| 6.2 years old; mean end values per group | Weight | z‐score | 1 | Total fat intake (multiple 24‐hour dietary recalls at baseline and 1 year) | LF quintile (24 %TE) HF quintile (34%TE) | n overall = NR (LF = NR, HF = NR); mean end values (SD NR). Baseline: LF = ‐0.21; HF = 0.44. At 1 year: LF = ‐0.14; HF = 0.45. After 1 year, weight‐for‐age of children with LF intake will increase by 0.07 z‐scores on average, and by 0.01 z‐scores in children with HF intake. | ‐ No | No matching reported. No adjustment for prognostic variables. | |
| Weight at > 1to 2 years: 1 cohort study; 1 analysis (n = 126) in boys and girls aged 2 years | |||||||||
| 2 years old; mean end values per group | Weight | kg | 2 | Total fat intake (single 3‐day weighed dietary records at baseline and 2 years) | LF < 30%TE; HF > 35%TE | n overall = 126 (LF = 14, HF = 112); mean end values (SD). Baseline: LF = 12.6 (1); HF = 12.8 (1.7). At 2 years: LF (n = 20) 18.4 (2.6); HF (n = 76) 17.9 (2.1); P > 0.05. After 2 years, weight of children with LF intake will increase by 5.8 kg on average, and by 5.1 kg on average in children with HF intake. | ‐ No | No matching reported. No adjustment for prognostic variables. | |
| Weight at > 2to 5 years: 4 cohort studies; 4 analyses (n = 13,802) in boys and girls aged 2‐14 years | |||||||||
| 4.4 years old; mean change per group | Weight | kg/year | 2.1 | Total fat intake (multiple FFQs at baseline) | LF ≤ 30%TE; HF > 30%TE | n overall = 215 (LF = 37, HF = 178); mean change (SD). Baseline: NR. LF = 3 (1.3); HF = 2.8 (1.3); P > 0.05 MD 0.2 (95% CI ‐0.26 to 0.66). After 2 years, children with LF intake will gain on average 0.2 kg/year more than children with HF intakes. | ‐ No | No matching reported. No adjustment for prognostic variables. | |
| 9‐14 years‐old; regression | Weight | kg, 1‐year change | 3 | Total fat intake (single FFQ at baseline, 1, 2 and 3 years) | g | n overall = 12,829; only reported as text. After 3 years, "Dairy fat was not a stronger predictor of weight gain than other types of fat, and no fat (dairy, vegetable, or other) intake was significantly associated with weight gain after energy adjustment, nor was total fat intake." | 0 Yes | Adjusted for age, ethnicity, pubertal stage, annual height growth, baseline BMI and same‐year physical activity. | |
| 9.6 years old; regression | Weight | kg | 3 | Total fat intake (multiple 24‐hour recalls at baseline, 1 and 3 years) | %TE | n overall = 632; regression results. B = ‐0.0011, P = 0.8. After 3 years, for every 1% increase in total energy intake from total fat of children, weight will decrease by 0.0011 kg. | ‐ Yes | Adjusted for gender, physical activity, treatment, visit number, other sources of energy than fat and interactions: fat intake‐by‐treatment, fat intake‐by‐gender, fat intake‐by‐visit number and visit number‐by‐treatment. | |
| 2 years‐old; mean end values per group | Weight | kg | 4 | Total fat intake (single 3‐day weighed dietary record at baseline, 2 and 4 years) | LF < 30%TE; HF > 35%TE | n overall = 126 (LF = 14, HF = 112); mean end values (SD). Baseline: LF = 12.6 (1); HF = 12.8 (1.7). At 4 years: LF (n = 14) 20.7 (3.4); HF (n = 88) 21.7 (3); P > 0.05. After 4 years, weight of children with LF intake will increase by 8.1 kg on average, and by 8.9 kg on average in children with HF intake. | + No | No matching reported. No adjustment for prognostic variables. | |
| Weight at > 5to 10 years: 1 cohort study; 1 analysis (n = 126) in boys and girls aged 2 years | |||||||||
| 2 yrs‐old; mean end values per group | Weight | kg | 6 | Total fat intake (single 3‐day weighed dietary record at baseline, 2 and 4 years; single 4‐day weighed dietary record at 6 years) | LF < 30 %TE; HF > 35 %TE | n overall = 126 (LF = 14, HF = 112); mean end values (SD). Baseline: LF = 12.6 (1); HF = 12.8 (1.7). At 6 years: LF (n = 13) 29.4 (5.9); HF (n = 72) 26.7 (4.3); P > 0.05. After 6 years, weight of children with LF intake will increase by 16.8 kg on average, and by 13.9 kg on average in children with HF intake. | ‐ No | No matching reported. No adjustment for prognostic variables. | |
| aDirection refers to whether there was a positive (+: exposure and outcome moved in the same direction, inverse/negative (‐: exposure and outcome moved in opposite directions) or zero (0: no association) between total fat intake and the outcome. bRelative weight, deviation in percentages from the mean weight of healthy Finnish children of the same height and gender. %TE: percentage of total energy; B: unstandardized beta‐coefficient; BMI: body mass index; CI: confidence interval; FFQ: Food Frequency Questionnaire; LF: low fat; HF: high fat; n: number of participants; NA: not applicable; MD: mean difference; NR: not reported; SD: standard deviation; SE: standard error. | |||||||||
| Study ID; mean age at baseline; analysis | Outcome | Outcome units | Time point (year) | Exposure | Exposure unit | Results of association (all reported values) | Direction;a energy intake adjusted? (yes/no) | Matched groups or adjusted for (or both) |
| BMI at 1 year: 3 cohort studies; 4 analyses (n ˜ 11,180) in boys and girls aged 7‐14 years | ||||||||
| 9‐14 years; regression | BMI | kg/m2, 1‐year change | 1 | Total fat intake (single FFQ at baseline and 1 year) | g | n girls = 6149; regression result. B = 0.0008, SE 0.0016, P = 632. After 1 year, for every 1 g increase in total fat intake, BMI will increase by 0.0008 kg/m2 in girls. | + Yes | Adjusted for total energy intake, age, ethnicity, pubertal stage, annual height growth, baseline BMI and physical activity. |
| 9‐14 years; regression | BMI | kg/m2, 1‐year change | 1 | Total fat intake (single FFQ at baseline and 1 year) | g | n boys = 4620; regression result. B = ‐0.0015, SE 0.0017, P = 0.375. After 1 year, for every 1 g increase in the total fat intake, BMI will decrease by 0.0015 kg/m2 in boys. | ‐ Yes | Adjusted for total energy intake, age, ethnicity, pubertal stage, annual height growth, baseline BMI and physical activity. |
| 8.6 years; regression | BMI | z‐score | 1 | Total fat intake (single 3‐day record at baseline) | %TE | n overall = NR; regression result = NR. "We are unable to demonstrate a positive relation between dietary fat and BMI z‐score change from baseline to 12 months." | 0 NR | Prognostic variables were adjusted for, but not specified which one. |
| 6.8 years; regression | BMI | kg/m2 | 1 | Total fat intake (single 7‐day weighed record at baseline and 1 year) | g | n overall = 411; regression result. B = 0.08, SE 0.007, P = 0.085. After 1 year, for every 1 g increase in the total intake, BMI will increase by 0.08 kg/m2. | + No | Adjusted for age, sex and physical activity. |
| BMI at > 1to 2 years: 7 cohort studies; 10 analyses (n = 3347) in boys and girls aged 2‐13 years | ||||||||
| 3.6 years; mean end values per group | BMI | kg/m2 | 1.5 | Total fat intake (single 3‐day unweighed food record at baseline) | LF quintile (30.4%TE); HF quintile (41.8 %TE) | n boys, at baseline = 438; At 1.5 years = 383 (LF = NR, HF = NR); mean end values (SD). Baseline: LF = 16.6 (95% CI 16.4 to 16.8); HF = 16.3 (95% CI 16.1 to 16.5). At 1.5 years: LF = 16.1 (95% CI 15.8 to 16.3); HF = 15.7 (95% CI 15.5 to 16.0). After 18 months, average BMI decreased by 0.5 kg/m2 among boys in LF intake (30.4%TE) group and by 0.6 kg/m2 in boys in HF intake (41.8%TE) group. | ‐ No | No matching reported. No adjustment for prognostic variables. |
| 3.6 years; mean end values per group | BMI | kg/m2 | 1.5 | Total fat intake (single 3‐day unweighed food record at baseline) | LF quintile (30.4 %TE); HF quintile (41.8 %TE) | n girls, at baseline = 351; at 1.5 years = 323) (LF = NR, HF = NR); mean end values (SD). Baseline: LF = 16.6 (95% CI 16.3 to 16.9); HF = 16.4 (95% CI 16.1 to 16.7). At 1.5 years: LF = 16.1 (95% CI 15.7 to 16.4); HF = 16.1 (95% CI 15.8 to 116.4). After 18 months,average BMI decreased by 0.5 kg/m2 among girls in LF intake group (30.4%TE) and by 0.3 kg/m2 in girls in HF intake group (41.8%TE). | + No | No matching reported. No adjustment for prognostic variables. |
| 5.4 years; regression | BMI | kg/m2, 2‐years change | 2 | Total fat intake (multiple 24‐hour recalls at baseline) | %TE | n overall = 168; regression result. R2 = 0.26, P entry = 0.01, F‐test = 9.27, df = 6, P change = 0.0001. "Percentage of fat intake, baseline BMI, family risk of overweight, mothers’ BMI, fathers’ enjoyment of activity explained 26% of the variance in the change of BMI." | + Yes | Adjusted for age, baseline BMI, family risk of overweight, mothers' change in BMI and fathers' enjoyment of activity. |
| 4.4 years; regression | BMI | kg/m2, 2‐years change | 2 | Change (year 2 to 3 of follow‐up) in total fat intake (single FFQ at baseline, 1 and 2 years) | %TE | n overall = 146; regression result. B = ‐0.04, P = 0.011, t value = 2.58. After 2 years, for every 1% increase in energy intake from total fat from year 2 to 3 of follow‐up, BMI will decrease by 0.04 kg/m2. | ‐ No | Adjusted for age, sex, parental BMI and physical activity. |
| 4.4 years; regression | BMI | kg/m2, 2‐years change | 2 | Baseline dietary fat (single FFQ) | %TE | n overall = 146; regression result. B = 0.034, P = 0.0521, t value = 1.96. After 2 years, for every 1% increase in energy intake from baseline total fat, BMI will increase by 0.034 kg/m2. | + No | Adjusted for age, sex, parental BMI and physical activity. |
| 5 years; mean end values; mean change per groups | BMI | kg/m2 | 2 | Total fat intake (multiple 24‐hour recalls at baseline) | LF ≤ 30%TE; HF > 30%TE | n girls = 192 (LF = 84; HF = 108); mean end values (SD); mean change (SD). Baseline: LF = 15.8 (1.83); HF = 16 (2.08). At 2 years: LF = 16.4 (1.83); HF = 16.9 (3.12); change LF = 0.6 (0.92); change HF = 1.0 (2.08); P < 0.05. MD ‐0.4 (95% CI ‐0.84 to 0.04) After 2 years, LF intake (≤ 30%TE) will result in 0.4 kg/m2 smaller increase in BMI on average compared to HF intake (> 0%TE) in girls. | + No | No matching reported. No adjustment for prognostic variables. |
| 7.3 years; regression | BMI 1st graders | kg/m2, 2‐years change | 2 | Total fat intake (multiple 24‐hour recalls at baseline, 1 and 2 years) | %TE | n overall = 474; regression result. B = 0.021 (95% CI ‐0.004 to 0.046), P = 0.104. After 2 years, for every 1% increase in energy intake from total fat, BMI will increase by 0.021 kg/m2. | + Yes | Adjusted for age, gender, sexual maturation at 6 years' follow‐up, baseline BMI, exercise frequency, screen time, sleep duration, meal skipping and snacking, parental BMI and SES. |
| 10 years; regression | BMI 4th graders | kg/m2, 2‐years change | 2 | Total fat intake (multiple 24‐hour recalls at baseline, 1 and 2 years) | %TE | n overall = 1030; regression result. B = ‐0.007 (95% CI ‐0.024 to 0.012), P = 0.449. After 2 years, for every 1% increase in energy intake from total fat, BMI will decrease by 0.007 kg/m2. | ‐ Yes | Adjusted for age, gender, sexual maturation at 6 years' follow‐up, baseline BMI, exercise frequency, screen time, sleep duration, meal skipping and snacking, parental BMI and SES. |
| 2 years; regression | BMI | z‐score | 2 | Total fat intake (single 3‐day weighed dietary record at baseline and 2 years) | NR | n overall = 155; regression result. β = 0.079, P > 0.1; R2 = 0.493, P < 0.0001. After 2 years, increase in the total fat intake will increase BMI by 0.079 z‐score. | + Yes | Adjusted for baseline BMI‐z score, gender, mother's BMI and father's BMI. |
| 12.5 years; regression | BMI | z‐score | 2 | Total fat intake (single 24‐hour recall at baseline) | per 10 g | n overall = 330; regression result. β = 0.009 (95% CI ‐0.006 to ‐0.02), P = NS. After 2 years, for every 10 g increase in total fat intake, BMI will increase by 0.009 z‐score. | + Yes | Adjusted for baseline BMI z‐score, moderate to vigorous physical activity, vegetables and fruit, fibre, milk, sodium and added sugar intakes. |
| BMI at > 2to 5 years: 7 cohort studies; 11 analyses (n = 4491) in boys and girls aged 2‐14 years | ||||||||
| 4.4 years; mean change per group | BMI | kg/m2 per year | 2.1 | Total fat intake (multiple FFQs at baseline) | LF ≤ 30%TE; HF > 30%TE | n overall = 215 (LF = 37, HF = 178); mean change (SD). LF = 0.2 (0.81), HF = 0.18 (0.68); P > 0.05. MD 0.02 (95% CI ‐0.26 to 0.30). After 25 months, LF intake (≤ 30%TE) will result in a 0.02 kg/m2 per year greater increase in BMI on average, compared to HF intake (> 30%TE). | ‐ No | No matching reported. No adjustment for prognostic variables. |
| 14 years; regression | BMI | z‐score | 3 | Energy‐dense, HF and low‐fibre dietary patternc (single FFQ at baseline and 3 years) | z‐score | n girls = 649; regression result. β = 0.99 (95% CI ‐0.05 to 0.05), P = NR. After 3 years, for every 1 z‐score increase in the energy‐dense, HF and low‐fibre dietary pattern z‐score, BMI will increase by 0.99 z‐score in girls. | + NA; exposure included energy intake | Adjusted for age, dietary misreporting, physical fitness, smoking and BMI z‐score. |
| 14 years; regression | BMI | z‐score | 3 | Energy‐dense, HF and low‐fibre dietary patternc (single FFQ at baseline and 3 years) | z‐score | n boys = 699; regression result. β = 0.03 (95% CI ‐0.01 to 0.08), P = NR. After 3 years, for every 1 z‐score increase in the energy‐dense, HF and low‐fibre dietary pattern, BMI will increase by 0.03 z‐score in boys. | + NA; exposure included energy intake | Adjusted for age, dietary misreporting, physical fitness, smoking and BMI z‐score. |
| 14 years; regression and OR higher vs lower dietary pattern z‐score | BMI | Overweight/obese by IOTF;d odds | 3 | Energy‐dense, HF and low‐fibre dietary patternc (single FFQ at baseline and 3 years) | z‐score | n girls = 649; regression result. OR = 1.02 (95% CI 0.87 to 1.19), P = NR. After 3 years, the ratio of odds for being overweight/obese was 1.02 greater in girls with higher dietary pattern z‐scores compared to the odds in girls with lower dietary pattern z‐scores. | + NA; exposure included energy intake | Adjusted for age, dietary misreporting, physical activity and smoking. |
| 14 years; regression and OR higher vs lower dietary pattern z‐score | BMI | Overweight/obese by IOTF;d odds | 3 | Energy‐dense, HF and low‐fibre dietary patternc(single FFQ) at baseline and 3 years) | z‐score | n boys = 699; regression result. OR = 1.04 (95% CI 0.9 to 1.2), P = NR. After 3 years, the ratio of odds for being overweight/obese is 1.04 greater in boys with higher dietary pattern z‐scores compared to the odds in boys with lower dietary pattern z‐scores. | + NA; exposure includes energy intake | Adjusted for age, dietary misreporting, physical activity and smoking. |
| 9.7 years; regression | BMI | z‐score, 3‐years change | 3 | Dietary fat (single 24‐hour recall at baseline) | %TE | n boys = 181; regression result. β = ‐0.63 (95% CI ‐2.07 to 0.82), P = 0.39. After 3 years, for every 1% increase in energy intake from total fat, BMI will decrease by 0.63 z‐score in boys. | ‐ Yes | Adjusted for age, physical activity level, dietary volume and puberty at baseline. |
| 9.7 years; regression | BMI | z‐score, 3‐years change | 3 | Dietary fat (single 24‐hour recall at baseline) | %TE | n girls = 217; regression result. β = 0.07 (95% CI ‐1.08 to 1.25), P = 0.72. After 3 years, for every 1% increase in energy intake from total fat, BMI will increase by 0.07 z‐score in girls. | + Yes | Adjusted for age, physical activity level, dietary volume and puberty at baseline. |
| 13.9 years; regression | BMI | Percentile, % | 3 | Total fat intake (single FFQ at baseline, 1, 2 and 3 years) | %TE | n girls = 265; regression result. B = ‐0.01, SE = 0.01, P = 0.16. After 3 years, for every 1% increase in energy intake from total fat, BMI will decrease by 0.01 percentile in girls. | ‐ No | Adjusted for age, ethnicity, protein calories, CHO calories, physical activity, physical inactivity and SES. |
| 4.4 years; regression | BMI | kg/m2 | 3 | Total fat intake (observed 4‐day dietary intake at baseline, 1 and 2 years and 3‐day dietary intake at 3 years) | %TE | n overall = 133; regression result. R2 = 0.65, P = NR. "Dietary factors were not associated with BMI across the three study years." | NR Yes | Adjusted for ethnicity, gender, baseline BMI, TV viewing, sedentary behaviour, physical activity, dietary behaviours and interaction terms for variables differing by year. |
| 9.6 years; regression | BMI | kg/m2 | 3 | Total fat intake (multiple 24‐hour recalls at baseline, 1 and 3 years) | %TE | n overall = 632; regression result. B = ‐0.00008, P = 0.9. After 3 years, for every 1% increase in energy intake from total fat, BMI will decrease by 0.00008 kg/m2. | ‐ Yes | Adjusted for gender, physical activity, treatment, visit number, other sources of energy than fat, and for interactions: fat intake‐by‐treatment, fat intake‐by‐gender, fat intake‐by‐visit number and visit number‐by‐treatment. |
| 2 years; regression | BMI | z‐score | 4 | Total fat intake (single 3‐day weighed dietary record at baseline, 2 and 4 years) | NR | n overall = 152; regression result. β = 0.087, P > 0.1; R2 = 0.48, P < 0.0001. After 4 years, increase in the total fat intake, will increase BMI by 0.087 z‐score. The model explained 48% of variance in the change of BMI z‐score. | + Yes | Adjusted for baseline BMI‐z score, gender, mother's BMI and father's BMI. |
| BMI at > 5to 10 years: 4 cohort studies; 6 analyses (n = 1158) in boys and girls aged 2‐10 years | ||||||||
| 9.6 years; regression | BMI | z‐score, 6‐years change | 6 | Dietary fat (single 24‐hour recall at baseline) | %TE | n girls = 177; regression result. β = 0.005, SE 0.008, P = 0.54. After 6 years, for every 1% increase in energy intake from total fat, BMI will increase by 0.005 z‐score in girls. | + Yes | Adjusted for age, puberty status, parent's income level, self‐reported activity, inactivity and number of overweight parents. |
| 9.6 years; regression | BMI | z‐score, 6‐years change | 6 | Dietary fat (single 24‐hour recall at baseline) | %TE | n boys = 147; regression result. β = ‐0.011, SE 0.009, P = 0.2. After 6 years, for every 1% increase in energy intake from total fat, BMI will decrease by 0.011 z‐score in boys. | ‐ Yes | Adjusted for age, puberty status, parent's income level, self‐reported activity, inactivity and number of overweight parents. |
| 2 years; regression | BMI | kg/m2 | 6 | Longitudinal dietary fat (single 24‐hour dietary recall and 2‐day food record at baseline, every 3 months during 1 year, every 6 months during 2 and 3 years, every year during 4, 5 and 6 years) | g | n overall = 70; regression result. B = 0.01, SE 0.01, P = 0.0039, F‐test = 9; R2 = 0.43, P = 0.0001, F‐test = 17.6. After 6 years, for every 1 g increases in the fat intake, BMI will increase by 0.01 kg/m2. | ‐ No | Adjusted for baseline BMI, birthweight, cereal introduction age, breastfeeding duration, dietary variety score 42‐84 months, adiposity rebound, picky eater at age 6 years, sedentary activity at ages 6 and 7 years, foods liked at age 8 years, mother's BMI and father's BMI. |
| 2 years; regression | BMI | z‐score | 9 | Total fat intake (single 3‐day weighed dietary record at baseline, 2 and 4 years, single 4‐day weighed dietary record at 6 and 9 years) | NR | n overall = 243; regression result. β = 0.122, P > 0.1; R2 = 0.38, P < 0.0001. After 9 years, increase in the total fat intake will increase BMI by 0.122 z‐score. | + Yes | Adjusted for baseline BMI‐z score, gender and parental BMI. |
| 10.1 years; regression | BMI | kg/m2, 10‐years change | 10 | Total fat intake (single 3‐day dietary records at 1, 2, 3, 4, 5, 7, 8 and 10 years) × baseline IR | %TE | n white girls = 241; regression result. B = 0.029, SE 0.0028, P < 0.0001, partial R2 = 27. After 10 years, for every 1% increase in energy intake from total fat, BMI will increase by 0.029 kg/m2 in white girls. | + Yes | Adjusted for age, BMI, IR and maturation stage at baseline; change in IR over 10 years' follow‐up; percentage of calories from protein, fat and CHO (mean of interviews) during 10 years' follow‐up; and interaction terms (nutrients × baseline IR). |
| 10.1 years; regression | BMI | kg/m2, 10‐years change | 10 | Total fat intake (single 3‐day dietary records at 1, 2, 3, 4, 5, 7, 8 and 10 years) × baseline IR | %TE | n black girls = 280; regression result. B = 0.012, SE 0.0032, P = 0.0002, partial R2 = 3.6. After 10 years, for every 1% increase in energy intake from total fat, BMI will increase by 0.012 kg/m2 in black girls. | ‐ Yes | Adjusted for age, BMI, IR and maturation stage at baseline; change in IR over 10 years' follow‐up; percentage of calories from protein, fat and CHO (mean of interviews) during 10 years' follow‐up; and interaction terms (nutrients × baseline IR). |
| BMI at > 10 years: 2 cohort studies; 2 analyses (n = 330) in boys and girls aged 2‐3 years | ||||||||
| 2 years; regression | BMI | z‐score | 13 | Total fat intake (single 3‐day weighed dietary record at baseline, 2 and 4 years, single 4‐day weighed dietary record at 6, 9, 11 and 13 years) | NR | n overall = 218; regression result. β = 0.16, 0.05 < P ≤ 0.1; R2 = 0.23, P < 0.0001. After 13 years, increase in the total fat intake will increase BMI by 0.16 z‐score. | + Yes | Adjusted for baseline BMI‐z score, gender, mother's BMI and father's BMI. |
| 3.2 years; mean end values per group | BMI | z‐score | 17 | Total fat intake (single 3‐day weighed dietary record at baseline and each year follow‐up) | LF (32%TE); HF (40%TE) | n overall = 112 (LF = 55; HF = 57); mean end values (SD). Baseline: LF = 0.36 (0.75); HF = 0.07 (0.81). At 17 years: LF = 0.23 (0.9); HF = 0.11 (1.09). After 17 years, on average BMI decrease 0.13 z‐score in the LF (32%TE) group while increase 0.04 z‐score in the HF (40%TE) group. | + No | No matching reported. No adjustments for prognostic variables. |
| aDirection refers to whether there was a positive (+: exposure and outcome moved in the same direction), inverse/negative (‐: exposure and outcome moved in opposite directions) or zero (0: no association) between total fat intake and the outcome. bUnpublished data provided by study authors. c"Energy dense, high fat, low fibre" dietary pattern reflected high intakes of processed meat, chocolate and confectionery, low‐fibre bread, crisps and savoury snacks, fried and roasted potatoes, the high intake of these foods increase the individual’s dietary pattern z‐score. dOverweight/obese was defined by IOTF for children aged 14 years (boys, BMI > 22.62 kg/m2; girls, BMI > 23.34 kg/m2), and aged 17 years (boys, BMI > 24.46 kg/m2; girls, BMI > 24.70 kg/m2). %TE: percentage of total energy; B: unstandardised beta‐coefficient; β: standardised beta‐coefficient; BMI: body mass index; CHO: carbohydrate; CI: confidence interval; df: degrees of freedom; FFQ: Food Frequency Questionnaire; HF: high fat; IR: insulin resistance; IOTF: International Obesity Task Force; LF: low fat; MD: mean difference; n: number of participants; NA: not applicable; NR: not reported; NS: not significant; OR: odds ratio; SD: standard deviation; SE: standard error; SES: socioeconomic status; TV: television. | ||||||||
| Study ID; mean age at baseline; analysis | Outcome | Outcome units | Time point (year) | Exposure | Exposure unit | Results of association (all reported values) | Direction;a energy intake adjusted? (yes/no) | Matched groups or adjusted for (or both) | |
| Waist circumference at > 1to 2 years: 1 cohort study; 1 analysis (n = 310) in boys and girls aged 13 years | |||||||||
| 12.5 years; regression | WC | cm | 2 | Total fat intake (single 24‐hour recall at baseline) | per 10 g | n overall = 310, regression result. B = 0.31 (95% CI 0.08 to 0.58), P ≤ 0.05. After 2 years, for every 10‐g increase in the total fat intake of children, WC will increase by 0.31 cm. | + No | Age, gender, baseline BMI z‐score, baseline WC, moderate to vigorous physical activity, vegetables and fruit, fibre, milk, sodium and added sugar. | |
| Waist circumference at > 2to 5 years: 1 cohort study; 4 analyses (n = 2680) in boys and girls aged 14 years | |||||||||
| 14 years; regression and OR higher vs lower dietary pattern z‐score | WC | WC ≥ 80 cm, odds | 3 | Energy‐dense, high‐fat and low‐fibre dietary patternb (single FFQ at baseline and 3 years) | z‐score | n boys = 697, regression result. OR = 1 (95% CI 0.82 to 1.22). After 3 years, the ratio of odds that WC is ≥ 80 cm is the same in boys with higher dietary pattern z‐scores compared to the odds in boys with lower dietary pattern z‐scores, during the period from 14 to 17 years of age. | 0 NA; exposure includes energy intake | Age, dietary misreporting, physical fitness, smoking and BMI z‐score. | |
| 14 years; regression and OR higher vs lower dietary pattern z‐score | WC | WC ≥ 80 cm, odds | 3 | Energy‐dense, high‐fat and low‐fibre dietary patternb (single FFQ at baseline and 3 years) | z‐score | n girls = 643, regression result. OR = 1.28 (95% CI 1.00 to 1.63). After 3 years, the ratio of odds that WC is ≥ 80 cm is 1.28 greater in girls with higher dietary pattern z‐scores compared to the odds in girls with lower dietary pattern z‐scores, during the period from 14 to 17 years of age. | + NA; exposure includes energy intake | Age, dietary misreporting, physical fitness, smoking and BMI z‐score. | |
| 14 years; regression | WC | z‐score | 3 | Energy‐dense, high‐fat and low‐fibre dietary patternb (single FFQ at baseline and 3 years) | z‐score | n boys = 697, regression result. β = 0.003 (95% CI ‐0.02 to 0.03). After 3 years, for every 1 unit increase in z‐score of the energy‐dense, high‐fat and low‐fibre dietary pattern of boys, WC will increase by 0.003 z‐scores. | + NA; exposure includes energy intake | Age, dietary misreporting, physical fitness, smoking and BMI z‐score. | |
| 14 years; regression | WC | z‐score | 3 | Energy‐dense, high‐fat and low‐fibre dietary patternb (single FFQ at baseline and 3 years) | z‐score | n girls = 643, regression result. β = 0.04 (95% CI 0.01 to 0.07). After 3 years, for every 1 unit increase in z‐score of the energy‐dense, high‐fat and low‐fibre dietary pattern of girls, WC will increase by 0.04 z‐scores. | + NA; exposure includes energy intake | Age, dietary misreporting, physical fitness, smoking and BMI z‐score. | |
| Waist circumference at > 5to 10 years: 1 cohort study; 2 analyses (n = 512) in girls aged 10 years | |||||||||
| 10.1 years; regression | WC | cm, 10‐years change | 10 | Total fat intake (single 3‐day dietary records at 1, 2, 3, 4, 5, 7, 8 and 10 years) × baseline IR | %TE | n white girls = 236. B = 0.053, SE 0.0065, P < 0.0001. After 10 years, for every 1% increase in energy intake from total fat in white girls, WC will increase by 0.053 cm. | + Yes | Age, WC, IR, and maturation stage at baseline; change in IR over 10‐years follow‐up; percentage of calories from protein, fat, and CHO (mean of interviews) during 10‐years follow‐up; and interaction terms (nutrients × baseline IR). | |
| 10.1 years; regression | WC | cm, 10‐years change | 10 | Total fat intake (single 3‐day dietary records at 1, 2, 3, 4, 5, 7, 8 and 10 years) × baseline IR | %TE | n black girls = 276. B = 0.028, SE 0.0056, P < 0.0001. After 10 years, for every 1% increase in energy intake from total fat in black girls, WC will increase by 0.028 cm. | + Yes | "Age, waist circumference, IR, and maturation stage at baseline; change in IR over 10‐y follow‐up; percentage of calories from protein, fat, and CHO (mean of interviews) during 10‐y follow‐up; and interaction terms (nutrients baseline IR)." | |
| aDirection refers to whether there was a positive (+: exposure and outcome moved in the same direction), inverse/negative (‐: exposure and outcome moved in opposite directions) or zero (0: no association) between total fat intake and the outcome. b"Energy dense, high fat, low fibre" dietary pattern reflected high intakes of processed meat, chocolate and confectionery, low‐fibre bread, crisps and savoury snacks, fried and roasted potatoes, the high intake of these foods increase the individual’s dietary pattern z‐score. %TE: percentage of total energy; B: unstandardised beta‐coefficient; β: standardised beta‐coefficient; BMI: body mass index; CHO: carbohydrate; CI: confidence interval; FFQ: Food Frequency Questionnaire; IR: insulin resistance; n: number of participants; NA: not applicable; OR: odds ratio; WC: waist circumference. | |||||||||
| Study ID; mean age at baseline; analysis | Outcome | Outcome units | Time point (years) | Exposure | Exposure unit | Results of association (all reported values) | Direction;a energy intake adjusted (yes/no) | Matched groups or adjusted for (or both) | |||
| Body fat at 1 year: 1 cohort study; 1 analysis (n = 411) in boys and girls aged 7 years | |||||||||||
| 6.8 years; regression | Body fat (skinfold thickness) | % | 1 | Total fat intake (single 7‐day weighed dietary record at baseline and 1 year) | g | n overall = 411, regression result. B = 0.011, SE 0.017, P < 0.05. After 1 year, for every 1 g increase in the total fat intake of children, body fat will increase by 0.01%. | + No | Adjusted for age, gender and physical activity. | |||
| Body fat at > 1to 2 years: 1 cohort study; 1 analysis (n = 625) in boys and girls aged 5 years | |||||||||||
| 5.2 years; regression | Body fat (DEXA) | kg | 2 | Energy‐dense, high‐fat, low‐fibre dietary patternc (single 3‐day dietary record at baseline and 2 years) | z‐score | n overall = 625, regression result. B = 0.28 (95% CI 0.05 to 0.53), P = 0.02. After 2 years, for every 1 unit increase in the dietary pattern z‐score of children, body fat will increase by 0.28 kg. | + NA; exposure includes energy intake | Adjusted for height at age 9 years, gender, misreporting status, maternal BMI, maternal education (5 categories), overweight status (by BMI) at baseline and television watching at 54 months. | |||
| Body fat at > 2to 5 years: 3 cohort studies; 6 analyses (n = 968) in boys and girls aged 2‐14 years | |||||||||||
| 13.9 years; regression | Body fat (skinfold thickness, BIA) | % | 3‐5 | Total fat intake (single FFQ at baseline and once during follow‐up period) | %TE | n girls = 265, regression result. B = ‐0.005, SE 0, P = 0.03. After 3‐5 years, for every 1 % increase in energy intake from total fat of girls, body fat will decrease by 0.005%. | ‐ No | Adjusted for age, ethnicity, protein calories, CHO calories, physical activity, physical inactivity and SES. | |||
| 5.2 years; regression | Body fat (DEXA) | kg | 4 | Energy‐dense, high‐fat, low‐fibre dietary patternc (single 3‐day dietary record at baseline and 2 years) | z‐score | n overall = 483, regression result. B = 0.15 (95 % CI ‐0.15 to 0.45), P = 0.34. After 4 years, for every 1 unit increase in the dietary pattern z‐score of children, body fat will increase by 0.15 kg. | + NA; exposure includes energy intake | Adjusted for height at age 9 years, gender, misreporting status, maternal BMI, maternal education (5 categories), overweight status (by BMI) at baseline and television watching at 54 months. | |||
| 2 years; regression | Body fat (DEXA) | % | 4 | Longitudinal dietary fat (single 24‐hour dietary recall and 2‐day food record at baseline, every 3 months during 1 year, every 6 months during 2 and 3 years, and yearly at 4 years) | NR | n overall = 53, regression result. B = 0.619, SE 0.261, P = 0.02, F‐test = 5.63, R2 = 0.51, p = 0.0001, F‐test = 7.88. After 4 years, for every 1 unit increase in total fat intake of children, body fat will increase by 0.61%. | + No | Adjusted for baseline BMI, parental BMI, gender, protein, calcium and monounsaturated fat. | |||
| 2 years; regression | Body fat (DEXA) | g | 4 | Longitudinal dietary fat (single 24‐hour dietary recall and 2‐day food record at baseline, every 3 months during 1 year, every 6 months during 2 and 3 years, and yearly at 4 years) | NR | n overall = 53, regression result. B = 178.65, SE 70.06, P = 0.01, F‐test = 6.5, R2 = 0.51, P = 0.0001, F‐test = 9.84. After 4 years, for every 1 unit increase in total fat intake of children, body fat will increase by 178 g. | + No | Adjusted for baseline BMI, parental BMI, gender, protein, calcium and monounsaturated fat. | |||
| 2 years; regression | Body fat (DEXA) | % | 4 | Longitudinal dietary fat (single 24‐hour dietary recall and 2‐day food record at baseline, every 3 months during 1 year, every 6 months during 2 and 3 years, and yearly at 4 years). | Number of servings | n overall = 53, regression result. B = 0.465, SE 0.255, P = 0.07, F‐test = 3.34. R2 = 0.47, P = 0.0001, F‐test = 6.93. After 4 years, for every 1 unit increase in the number of fat servings, body fat will increase by 0.47%. | + No | Adjusted for baseline BMI, parental BMI, gender, protein, calcium and monounsaturated fat. | |||
| 2 years; regression | Body fat (DEXA) | g | 4 | Longitudinal dietary fat (single 24‐hour dietary recall and 2‐day food record at baseline, every 3 months during 1 year, every 6 months during 2 and 3 years, and yearly at 4 years). | Number of servings | n overall = 53, regression result. B = 136.48, SE 69.74, P = 0.06, F‐test = 3.83, R2 = 0.47, p = 0.0001, F‐test = 8.31. After 4 years, for every 1 unit increase in the number of fat servings, body fat will increase by 136 g. | + No | Adjusted for baseline BMI, parental BMI, gender, protein, calcium and monounsaturated fat. | |||
| Body fat at > 5to 10 years: 1 cohort study; 3 analyses (n = 156) in boys and girls aged 2 years | |||||||||||
| 2 years; regression | Body fat (DEXA) | % | 6 | Longitudinal dietary fat (single 24‐hour dietary recall and 2‐day food record at baseline, every 3 months during 1 year, every 6 months during 2 and 3 years, every year during 4, 5 and 6 years). | g | n overall = 52, regression result. B = 0.08, partial R2 = 0.06, P = 0.001, F‐test = 4.66, R2 = 0.336, P = 0.002. After 6 years, for every 1 g increase in total fat intake of children, body fat will increase by 0.08%. | + No | Adjusted for gender, sedentary activity, intakes of calcium and polyunsaturated fat. | |||
| 2 years; regression | Body fat (DEXA) | % | 6 | Longitudinal dietary fat (single 24‐hour dietary recall and 2‐day dietary record at baseline, every 3 months during 1 year, every 6 months during 2 and 3 years, every year during 4, 5 and 6 years). | g | n overall = 52, regression result. B = 0.09, partial R2 = 0.02, P = 0.001, F‐test = 4.37, R2 = 0.322, P = 0.002. After 6 years, for every 1 g increase in total fat intake, body fat will increase by 0.09%. | + No | Adjusted for gender, sedentary activity, calcium intake, and polyunsaturated fat intake and father's BMI. | |||
| 2 years; regression | Body fat (DEXA) | kg | 6 | Longitudinal dietary fat (single 24‐hour dietary recall and 2‐day food record at baseline, every 3 months during 1 year, every 6 months during 2 and 3 years, every year during 4, 5 and 6 years) | g | N overall = 52, regression result. B = 0.034, partial R2 = 0.06, P = 0.01, F‐test = 4.19, R2 = 0.26, P = 0.006. After 6 years, for every 1 g increase in total fat intake of children, body fat will increase by 0.03 kg. | + No | Adjusted for sedentary activity, calcium intake and polyunsaturated fat intake. | |||
| aDirection refers to whether there was a positive (+: exposure and outcome moved in the same direction, inverse/negative (‐: exposure and outcome moved in opposite directions) or zero (0: no association between total fat intake and the outcome. bUnpublished data provided by study authors. c"Energy dense, high fat, low fibre" dietary pattern reflected high intakes of processed meat, chocolate and confectionery, low‐fibre bread, crisps and savoury snacks, fried and roasted potatoes, the high intake of these foods increase the individual's dietary pattern z‐score. %TE: percentage of total energy; B: unstandardised beta‐coefficient; BIA: bioelectrical impedance, BMI: body mass index; CHO, carbohydrate; CI: confidence interval; DEXA: dual energy X‐ray absorptiometry; FFQ: food frequency questionnaire; n: number of participants; NA: not applicable; NR: not reported; SD: standard deviation; SE: standard error; SES: socioeconomic status. | |||||||||||
| Study ID; mean age at baseline; analysis | Outcome | Outcome units | Time point (year) | Exposure | Exposure unit | Results of association (all reported values) | Direction;a energy intake adjusted (yes/no) | Matched groups or adjusted for (or both) |
| Fat mass index at > 2to 5 years: 1 cohort study; 1 analysis (n = 4002) in boys and girls aged 8 years | ||||||||
| 7.5 years; regression | Fat mass indexb | z‐score | 4 | Energy‐dense, high‐fat, low‐fibre dietary patternc (single 3‐day dietary records at baseline and 2 years) | z‐score | n overall = 4002, regression result. β = 0.07 (95% CI 0.05 to 0.10), P ≤ 0.0001. After 4 years, for every 1 z‐score increase in the dietary pattern, the fat mass index will increase by 0.07 z‐scores. | + NA; exposure includes energy intake | Adjusted for gender, age at dietary assessment, dietary misreporting, total physical activity at 11 years, maternal prepregnancy BMI and maternal education. |
| Fat mass index at > 5to 10 years: 1 cohort study; 5 analyses (n = 21,542) in boys and girls aged 8 years | ||||||||
| 7.5 years; regression | Fat mass indexb | z‐score | 8 | Energy‐dense, high‐fat, high‐sugar, low‐fibre dietary patternc (single 3‐day dietary record at baseline, 3 and 6 years) | z‐score | n overall = 4729, regression result. β = 0.04 (95% CI 0.01 to 0.08), P = 0.028. After 8 years, for every 1 z‐score increase in the dietary pattern, the fat mass index will increase by 0.04 z‐scores. | + NA; exposure includes energy intake | Adjusted for age, gender, dietary misreporting, physical activity and maternal social class. |
| 7.5 years; regression | Fat mass indexb | z‐score | 8 | Non‐energy‐dense, high‐sugar, LF dietary patternd (single 3‐day dietary record at baseline, 3 and 6 years) | z‐score | n overall = 4729, regression result. β = ‐0.03 (95% CI ‐0.07 to 0.02), P = 0.22. After 8 years, for every 1 z‐score increase in the dietary pattern, the fat mass index will decrease by 0.03 z‐scores. | ‐ NA; exposure includes energy intake | Adjusted for age, gender, dietary misreporting, physical activity and maternal social class. |
| 7.5 years; regression | Fat mass indexb | z‐score | 8 | Energy‐dense, high‐fat, low‐fibre dietary patternc (single 3‐day dietary record at baseline, 3 and 6 years) | z‐score | n overall = 2626, regression result. β = 0.06 (95% CI 0.03 to 0.10), P = 0.0004. After 8 years, for every 1 z‐score increase in the dietary pattern, the fat mass index will increase by 0.06 z‐scores. | + NA; exposure includes energy intake | Adjusted for gender, age at dietary assessment, dietary misreporting, total physical activity at 11 years, maternal pre‐pregnancy BMI and maternal education. |
| 7.5 years; regression | Fat mass indexb | FMI z‐score > 80th percentile; odds | 8 | Energy‐dense, high‐fat, high‐sugar, low‐fibre dietary patternc (single 3‐day dietary record at baseline, 3 and 6 years) | z‐score | n overall = 4729, regression result. OR 1.11 (95% CI 0.97 to 1.28), P = 0.14. After 8 years, the ratio of odds for having FMI z‐score > 80th percentile is 1.11 greater in children with higher dietary pattern z‐scores compared to the odds in children with lower dietary pattern z‐scores. | + NA; exposure includes energy intake | Adjusted for age, gender, dietary misreporting, physical activity and maternal social class. |
| 7.5 years; regression | Fat mass indexb | FMI z‐score > 80th percentile; odds | 8 | Non‐energy‐dense, high‐sugar, LF dietary patternd (single 3‐day dietary record at baseline, 3 and 6 years) | z‐score | n overall = 4729, regression result. OR 0.92 (95% CI 0.78 to 1.09), P = 0.34. After 8 years, the ratio of odds for having FMI z‐score > 80th percentile is 0.92 smaller in children with higher dietary pattern z‐scores compared to the odds in children with lower dietary pattern z‐scores. | ‐ NA; exposure includes energy intake | Adjusted for age, gender, dietary misreporting, physical activity and maternal social class. |
| aDirection refers to whether there was a positive (+: exposure and outcome moved in the same direction), inverse/negative (‐: exposure and outcome moved in opposite directions) or zero (0: no association) between total fat intake and the outcome; bFMI was calculated by dividing fat mass (measured by dual‐energy X‐ray Absorptiometry) (kg) by height (m) raised to the optimum power (calculated by using log‐log regression analysis) to remove any residual correlation between fat mass and height; c"Energy‐dense, high‐fat, low‐fibre" dietary pattern reflected high intakes of processed meat, chocolate and confectionery, low‐fibre bread, crisps and savoury snacks, fried and roasted potatoes, the high intake of these foods increase the individual’s dietary pattern z‐score. dNon‐energy‐dense, high‐sugar, low‐fat dietary pattern reflected higher intakes of sugary foods including sugar‐sweetened beverages, fruit juices, ready‐to‐eat breakfast cereals (low‐fibre breakfast cereals) and low intakes of whole milk, margarines and oils, cheese and crisps. β: standardised beta‐coefficient; BMI: body mass index; FMI: Fat Mass Index ; n: number of participants; NA: not applicable; OR: odds ratio. | ||||||||
| Study ID; mean age at baseline; analysis | Outcome | Outcome units | Time point (year) | Exposure | Exposure unit | Results of association (all reported values) | Direction;a energy intake adjusted (yes/no) | Matched groups or adjusted for (or both) |
| Sum of 4 skinfolds (BC, TC, SC, SI) at 1 year: 1 cohort study; 1 analysis (n = NR) in boys and girls aged 6 years | ||||||||
| 6.2 years; mean end values per group | Sum of skinfolds (BC, TC, SS, SI) | mm | 1 | Total fat intake (multiple 24‐hour recalls at baseline, 3 and 6 months and 1 year) | LF quintile (24%TE); HF quintile (34%TE) | n overall = NR (LF = NR, HF = NR), mean end values (95% CI). Baseline: LF = 24.7 (95% CI 23 to 26.5); HF = 28.8 (95% CI 26.1 to 31.8). At 1 year: (reported in the figure without exact values), LF = lower than baseline; HF = greater than baseline. After 1 year, the sum of skinfolds will decrease in children with a low‐fat intake, and increase in children with high‐fat intake | + No | No matching reported. No adjustment for prognostic variables. |
| Sum of 4 skinfolds (BC, TC, SC, SI) at > 1to 2 years: 1 cohort study; 1 analysis (n = 126) in boys and girls aged 2 years | ||||||||
| 2 years; mean end values per group | Sum of skinfolds (TC, BC, SS, SI) | mm | 2 | Total fat intake (single 3‐day weighed dietary record at baseline and 2 years) | LF < 30%TE; HF > 35%TE | n overall = 126 (LF = 14, HF = 112), mean end values (SD). Baseline: LF = 33.4 (6.8); HF = 32.8 (6.3). At 2 years: LF (n = 20) = 31 (9.2); HF (n = 76) = 31.4 (6.3); P > 0.05. After 2 years, the sum of skinfolds of children with LF intakes will decrease by 2.4 mm on average, and by 1.4 mm in children with HF intake. | + No | No matching reported. No adjustment for prognostic variables. |
| Sum of 4 skinfolds at > 2to 5 years: 1 cohort study; 1 analysis (n ˜ 126) in boys and girls aged 2 years | ||||||||
| 2 years; mean end values per group | Sum of skinfolds (TC, BC, SS, SI) | mm | 4 | Total fat intake (single 3‐day weighed dietary record at baseline, 2 and 4 years) | LF < 30%TE; HF > 35%TE | n overall = 126 (LF = 14, HF = 112), mean end values (SD). Baseline: LF = 33.4 (6.8); HF = 32.8 (6.3); P > 0.05. At 4 years: LF (n = 14) = 27.2 (8); HF (n = 88) = 29.2 (8.9); P > 0.05. After 4 years, the sum of skinfolds of children with LF intakes will decrease by 6.2 mm on average, and by 3.6 mm in children with HF intake | + Yes | No matching reported. No adjustment for prognostic variables. |
| Sum of 4 skinfolds at > 5to 10 years: 1 cohort study; 1 analysis (n = 126) in boys and girls aged 2 years | ||||||||
| 2 years; mean end values per group | Sum of skinfolds (TC, BC, SS, SI) | mm | 6 | Total fat intake (single 3‐day weighed dietary record at baseline, 2 and 4 years, single 4‐day weighed dietary record at 6 years) | LF < 30%TE; HF > 35%TE | n overall = 126 (LF=14, HF=112), mean end values (SD). Baseline LF = 33.4 (6.8); HF = 32.8 (6.3), P > 0.05. At 6 years: LF (n = 13) = 32.8 (13.3); HF (n = 72) = 31.8 (12.8), P > 0.05. After 6 years, the sum of skinfolds of children with LF intakes will decrease by 0.6 mm on average, and by 1 mm in children with HF intake. | ‐ No | No matching reported. No adjustment for prognostic variables. |
| Sum of 3 skinfolds at > 2to 5 years: 1 cohort study; 1 analysis (n = NR) in boys and girls aged 10 years | ||||||||
| 9.6 years; regression | Sum of skinfolds (TC, SS, SI) | mm | 3 | Total fat intake (multiple 24‐hour recalls at baseline, 1 and 3 years) | %TE | n overall = NR; regression result. B = ‐0.005, P = 0.2. After 3 years, for every 1% increase in energy intake from total fat of children, the sum of skinfolds will decrease by 0.005 mm | ‐ Yes | Adjusted for gender, physical activity, treatment, visit number, other sources of energy than fat, and for interactions: fat intake‐by‐treatment, fat intake‐by‐sex, fat intake‐by‐visit number and visit number‐by‐treatment. |
| Sum of 2 skinfolds at > 1to 2 years: 1 cohort study; 1 analysis (n = 192) in girls aged 5 years | ||||||||
| 5 years; mean change per group | Sum of skinfolds (TC, SS) | mm | 2 | Total fat intake (multiple 24‐hour recall at baseline) | LF ≤ 30%TE, HF > 30%TE | n girls = 192 (LF = 84; HF = 108); mean change (SD). Baseline: NR. LF = 0.9 (3.67), HF = 2.1 (5.2); P < 0.05. MD ‐1.2 (95% CI ‐2.46 to 0.06). After 2 years, the sum of skinfolds of girls with LF intake will increase on average by 1.2 mm less than girls with HF intake. | + No | No matching reported. No adjustment for prognostic variables. |
| aDirection refers to whether there was a positive (+: exposure and outcome moved in the same direction, inverse/negative (‐: exposure and outcome moved in opposite directions) or zero (0: no association) between total fat intake and the outcome. %TE: percentage of total energy; BC: biceps; CI: confidence interval; HF: high fat; LF: low fat; MD: mean difference; n: number of participants; NA: not applicable; NR: not reported; SD: standard deviation; SI: supra‐ileac; SS: subscapular; TC: triceps. | ||||||||
| Study ID; mean age at baseline; analysis | Outcome | Outcome units | Time point (year) | Exposure | Exposure unit | Results of association (all reported values) | Direction;a energy intake adjusted (yes/no) | Matched groups or adjusted for (or both) |
| Subscapular skinfold at > 1to 2 years: 1 cohort study; 1 analysis (n = 155) in boys and girls aged 2 years | ||||||||
| 2 years; regression | Subscapular skinfold | z‐score | 2 | Total fat intake (single 3‐day weighed dietary record at baseline and 2 years) | NR | n overall = 155; regression result. β = 0.081, P > 0.1, R2 = 0.47, P < 0.001. After 2 years, increase in the total fat intake will increase subscapular skinfold by 0.081 z‐score | + Yes | Adjusted for subscapular z‐score at baseline, energy intake, gender, mother' subscapular and father' subscapular. |
| Subscapular skinfold at > 2to 5 years: 1 cohort study; 1 analysis (n = 152) in boys and girls aged 2 years | ||||||||
| 2 years; regression | Subscapular skinfold | z‐score | 4 | Total fat intake (single 3‐day weighed dietary record at baseline, 2 and 4 years) | NR | n overall = 152; regression result. β = 0.072, P > 0.1, R2 = 0.38, P < 0.001. After 4 years, increase in the total fat intake will increase subscapular skinfold by 0.072 z‐score. | + Yes | Adjusted for subscapular z‐score at baseline, energy intake, gender, mother' subscapular and father' subscapular. |
| Subscapular skinfold at > 5to 10 years: 1 cohort study; 1 analysis (n = 243) in boys and girls aged 2 years | ||||||||
| 2 years; regression | Subscapular skinfold | z‐score | 9 | Total fat intake (single 3‐day weighed dietary record at baseline, 2 and 4 years, single 4‐day weighed dietary record at 6 and 9 years) | NR | n overall = 243; regression result. β = 0.069, P > 0.1, R2 = 0.26, P < 0.001. After 9 years, increase in the total fat intake will increase subscapular skinfold by 0.069 z‐score. | + Yes | Adjusted for subscapular z‐score at baseline, energy intake, gender, mother' subscapular and father' subscapular. |
| Subscapular skinfold at > 10 years: 1 cohort study; 1 analysis (n = 218) in boys and girls aged 2 years | ||||||||
| 2 years; regression | Subscapular skinfold | z‐score | 13 | Total fat intake (single 3‐day weighed dietary record at baseline, 2 and 4 years, single 4‐day weighed dietary record at 6, 9, 11 and 13 years) | NR | n overall = 218; regression result. β = 0.233, P ≤ 0.01. After 13 years, increase in the total fat intake will increase subscapular skinfold by 0.233 z‐score. | + Yes | Adjusted for subscapular z‐score at baseline, energy intake, gender, mother' subscapular and father' subscapular. |
| Triceps skinfold at > 1to 2 years: 1 cohort study; 1 analysis (n = 155) in boys and girls aged 2 years | ||||||||
| 2 years; regression | Triceps skinfold | z‐score | 2 | Total fat intake (single 3‐day weighed dietary record at baseline and 2 years) | NR | n overall = 155; regression result. β = 0.038, P > 0.1, R2 = 0.27, P ≤ 0.001. After 2 years, increase in the total fat intake will increase triceps skinfold by 0.038 z‐score. | + Yes | Adjusted for triceps z‐score at baseline, gender, mother's triceps and father's triceps. |
| Triceps skinfold at > 2to 5 years: 1 cohort study; 1 analysis (n = 152) in boys and girls aged 2 years | ||||||||
| 2 years; regression | Triceps skinfold | z‐score | 4 | Total fat intake (single 3‐day weighed dietary record at baseline, 2 and 4 years) | NR | n overall = 152; regression result. Β = 0.11, P > 0.1, R2 = 0.043, P > 0.01. After 4 years, increase in the total fat intake will increase triceps skinfold by 0.11 z‐score | + Yes | Adjusted for triceps z‐score at baseline, gender, mother's triceps and father's triceps. |
| Triceps skinfold at > 5to 10 years: 1 cohort study; 1 analysis (n = 243) in boys and girls aged 2 years | ||||||||
| 2 years; regression | Triceps skinfold | z‐score | 9 | Total fat intake (single 3‐day weighed dietary record at baseline, 2 and 4 years, single 4‐day weighed dietary record at 6 and 9 years) | NR | n overall = 243; regression result. β = 0.059, P > 0.1; R2 = 0.12, P ≤ 0.01. After 9 years, increase in the total fat intake will increase triceps skinfold by 0.059 z‐score | + Yes | Adjusted for triceps z‐score at baseline, gender, mother's triceps and father's triceps. |
| Triceps skinfold at > 10 years: 1 cohort study; 1 analysis (n = 218) in boys and girls aged 2 years | ||||||||
| 2 years; regression | Triceps skinfold | z‐score | 13 | Total fat intake (single 3‐day weighed dietary record at baseline, 2 and 4 years, single 4‐day weighed dietary record at 6, 9, 11 and 13 years) | NR | n overall = 218; regression result. β = 0.164; 0.05 < P ≤ 0.1. After 13 years, increase in the total fat intake will increase triceps skinfold by 0.164 z‐score | + Yes | Adjusted for triceps z‐score at baseline, gender, mother's triceps and father's triceps. |
| aDirection refers to whether there was a positive (+: exposure and outcome moved in the same direction), inverse/negative (‐: exposure and outcome moved in opposite directions) or zero (0: no association) between total fat intake and the outcome; B: unstandardised beta‐coefficient; β: standardised beta‐coefficient; n: number of participants; NR: not reported. | ||||||||
| Study ID; mean age at baseline; analysis | Outcome | Outcome units | Time point (year) | Exposure | Exposure unit | Results of association (all reported values) | Direction;a energy intake adjusted (yes/no) | Matched groups or adjusted for (or both) |
| LDL‐C at > 2to 5 years: 1 cohort study; 2 analyses (n = 1163) in boys and girls aged 14 years | ||||||||
| 14 years; regression | LDL‐C | mmol/L | 3 | Energy‐dense, high‐fat and low‐fibre dietary patternb (single FFQ at baseline and 3 years) | z‐score | n girls = 558, regression result. B = 0.04 (95% CI ‐0.01 to 0.08). After 3 years, for every 1 z‐score increase in the dietary pattern, LDL‐C will increase by 0.04 mmol/L in girls. | + NA; exposure includes energy intake | Adjusted for age, dietary misreporting, physical fitness, smoking and BMI z‐score. |
| 14 years; regression | LDL‐C | mmol/L | 3 | Energy‐dense, high‐fat and low‐fibre dietary patternb (single FFQ at baseline and 3 years) | z‐score | n boys = 605, regression result. B = 0.001 (95% CI ‐0.04 to 0.03). After 3 years, for every 1 z‐score increase in the dietary pattern, LDL‐C will increase by 0.001 mmol/L in boys. | + NA; exposure includes energy intake | Adjusted for age, dietary misreporting, physical fitness, smoking and BMI z‐score. |
| HDL‐C at > 2to 5 years: 2 cohort studies; 3 analyses (n = 1393) in boys and girls aged 13 and 14 years | ||||||||
| 14 years; regression; | HDL‐C | mmol/L | 3 | Energy‐dense, high‐fat and low‐fibre dietary patternb (single FFQ at baseline and 3 years) | z‐score | n girls = 558, regression result. B = 0.02 (95% CI 0.002 to 0.04). After 3 years, for every 1 z‐score increase in the dietary pattern HDL‐C will increase by 0.02 mmol/L in girls. | + NA; exposure includes energy intake | Adjusted for age, dietary misreporting, physical fitness, smoking and BMI z‐score. |
| 14 years; regression; | HDL‐C | mmol/L | 3 | Energy‐dense, high‐fat and low‐fibre dietary patternb (single FFQ at baseline and 3 years) | z‐score | n boys = 605, regression result. B = ‐0.002 (95% CI ‐0.02 to 0.01). After 3 years, for every 1 z‐score increase in the dietary pattern HDL‐C will decrease by 0.002 mmol/L in boys. | ‐ NA; exposure includes energy intake | Adjusted for age, dietary misreporting, physical fitness, smoking and BMI z‐score. |
| 12.5 years; regression; | HDL‐C | mmol/L | 3 | Total fat intake (dietary history at baseline and 3 years) | %TE | n girls = 230, regression result. β = ‐0.21, SE 0.1, P = 0.031. After 3 years, for every 1% increase in energy intake from total fat, HDL‐C will decrease by 0.21 mmol/L in girls. | ‐ Yes | Adjusted for sexual maturation, SES, cholesterol intake, CHO intake, cigarette smoking |
| Triglycerides at > 2to 5 years: 1 cohort study; 2 analyses (n = 1163) in boys and girls aged 14 years | ||||||||
| 14 years; regression | Triglycerides | % | 3 | Energy‐dense, high‐fat and low‐fibre dietary patternb (multiple FFQs at baseline and 3 years) | z‐score | n girls = 558, regression result. B = 1 (95% CI 0 to 3). After 3 years, for every 1 z‐score increase in the dietary pattern, triglycerides will increase by 1% in girls. | + NA; exposure includes energy intake | Adjusted for age, dietary misreporting, physical fitness, smoking and BMI z‐score. |
| 14 years; regression | Triglycerides | % | 3 | Energy‐dense, high‐fat and low‐fibre dietary patternb (multiple FFQs at baseline and 3 years) | z‐score | n boys = 605, regression result. B = 1 (95% CI 0 to 3). After 3 years, for every 1 z‐score increase in the dietary pattern, triglycerides will increase by 1% in boys | + NA; exposure includes energy intake | Adjusted for age, dietary misreporting, physical fitness, smoking and BMI z‐score. |
| aDirection refers to whether there was a positive (+: exposure and outcome moved in the same direction), inverse/negative (‐: exposure and outcome moved in opposite directions) or zero (0: no association) between total fat intake and the outcome. b"Energy dense, high fat, low fibre" dietary pattern was defined as high intakes of processed meat, chocolate and confectionery, low‐fibre bread, crisps and savoury snacks, fried and roasted potatoes, the high intake of these foods increase the individual’s dietary pattern z‐score. %TE: percentage of total energy; B: unstandardised beta‐coefficient; BMI: body mass index; CHO: carbohydrate; FFQ: food frequency questionnaire; LDL‐C: low‐density lipoprotein cholesterol; HDL‐C: high‐density lipoprotein cholesterol; NA: not applicable; SE: standard error; SES: socioeconomic status. | ||||||||
| Study ID; mean age at baseline; analysis | Outcome | Outcome units | Time point (year) | Exposure | Exposure unit | Results of association (all reported values) | Direction;a energy intake adjusted (yes/no) | Matched groups or adjusted for (or both) |
| SBP at > 1to 2 years: 1 cohort study; 1 analysis (n = 310) in boys and girls aged 13 years | ||||||||
| 12.5 years; regression | SBP | z‐score | 2 | Total fat intake (single 24‐hour recall at baseline) | per 10 g | n overall = 310; regression result. β = 0.03 (95% CI 0.00004 to 0.06), P < 0.05. After 2 years, for every 10 g increase in total fat intake, SBP will increase by 0.03 z‐score | + No | Adjusted for baseline BMI z‐score, baseline SBP and DBP, moderate to vigorous physical activity, vegetables and fruit, fibre, milk, sodium and added sugar. |
| SBP at > 2to 5 years: 1 cohort study; 1 analysis (n = NR) in boys and girls aged 10 years | ||||||||
| 9.6 years; regression | SBP | mmHg | 3 | Total fat intake (multiple 24‐hour recalls at baseline, 1 and 3 years) | g | n overall = NR; regression result. B = 0.4, P < 0.1. After 3 years, for every 1 g increase in total fat intake, SBP will increase by 0.4 mmHg | + Yes | Adjusted for height, weight and gender, with all sources of calories in the model. |
| DBP at > 1to 2 years: 1 cohort study; 1 analysis (n = 310) in boys and girls aged 13 years | ||||||||
| 12.5 years; regression | DBP | z‐score | 2 | Total fat intake (single 24‐hour recall at baseline) | per 10 g | n overall = 310. β = 0.03 (95% CI 0.003 to 0.05), P < 0.05. After 2 years, for every 10 g increase in total fat intake, DBP will increase by 0.03 z‐scores | + No | Adjusted for baseline BMI z‐score, baseline SBP and DBP, moderate to vigorous physical activity, vegetables and fruit, fibre, milk, sodium and added sugar. |
| DBP at > 2to 5 years: 1 cohort study; 1 analysis (n = NR) in boys and girls aged 10 years | ||||||||
| 9.6 years; regression | DBP | mmHg | 3 | Total fat intake (multiple 24‐hour recalls at baseline, 1 and 3 years) | g | n overall = NR. B = 0.43, 0.01 < P < 0.06. After 3 years, for every 1 g increase in total fat intake, DBP will increase by 0.43 mmHg | + Yes | Adjusted for height, weight and gender, with all sources of calories in the model. |
| aDirection refers to whether there was a positive (+: exposure and outcome moved in the same direction), inverse/negative (‐: exposure and outcome moved in opposite directions) or zero (0: no association) between total fat intake and the outcome. B: unstandardised beta coefficient; β: standardised beta‐coefficient; BMI: body mass index; CI: confidence interval; DBP: diastolic blood pressure; NR: not reported; SBP: systolic blood pressure. | ||||||||
| Study ID; mean age at baseline; analysis | Outcome | Outcome units | Time point (year) | Exposure | Exposure unit | Results of association (all reported values) | Direction;a energy intake adjusted (yes/no) | Matched groups or adjusted for (or both) |
| Height at 1 year: 2 cohort studies; 2 analyses (n ˜ 740) in children aged 2‐6 years | ||||||||
| 2 years; mean end values per group | Relative heightb | % | 1 | Total fat intake (single 4‐day dietary record at baseline, 1.5 and 2 years) | LF (27.7‐28.7 %TE); HF (> 28.7 %TE) | n overall = 740 (LF = 35, HF = 705); mean end values (SD). Baseline: LF = 0.30 (0.9); HF = 0.32 (0.9). At 1 year: LF = 0.18 (1.0); HF = 0.16 (0.9); P = 0.93. After 1 year, on average children with LF intake (27.7‐28.7 %TE) have a relative height change of 0.12% compared to 0.16% for children with HF intake (> 28.7 %TE). | ‐ No | No matching reported. No adjustment for prognostic variables. |
| 6.2 years; mean end values per group | Height | z‐score | 1 | Total fat intake (multiple 24‐hour dietary recalls at baseline and 1 year) | LF quintile (24%TE) HF quintile (34%TE) | n overall = NR (LF = NR, HF = NR); mean end values (SD NR). Baseline: LF = ‐0.23; HF = 0.17. At 1 year: LF = ‐0.11; HF = 0.22. After 1 year, on average children in LF intake (24%TE) quintile gain 0.12 z‐score in height while children in HF intake (34%TE) quintile gain 0.05 z‐score in height. | + No | No matching reported. No adjustment for prognostic variables. |
| Height at > 1to 2 years: 2 cohort study; 3 analysis (n = 836) in boys and girls aged 2‐4 years | ||||||||
| 3.6 years; mean end values per group | Height | cm | 1.5 | Total fat intake (single 3‐day unweighed food record at baseline) | LF quintile (30.4%TE) HF quintile (41.8%TE) | n boys, at baseline = 439; at 1.5 years = 387 (LF = NR, HF = NR); mean end values (SD). Baseline: LF = 99.9 (95% CI 99.2 to 100.5); HF = 99.3 (95% CI 98.7 to 99.9). At 1.5 years: LF = 110.7 (95% CI 109.9 to 111.5); HF = 109.9 (95% CI 109.1 to 110.7). After 1.5 years, on average boys with LF intake (30.4%TE) quintile gain 10.8 cm in height while boys with HF intake (41.8%TE) quintile gain 10.6 cm in height. | ‐ No | No matching reported. No adjustment for prognostic variables. |
| 3.6 years; mean end values per group | Height | cm | 1.5 | Total fat intake (single 3‐day unweighed food record at baseline) | LF quintile (30.4%TE) HF quintile (41.8%TE) | n girls, at baseline = 351; at 1.5 years = 323) (LF = NR, HF = NR); mean end values (SD). Baseline: LF = 99.9 (95% CI 98.0 to 99.8). HF = 98.3 (95% CI 97.6 to 99.1). At 1.5 years: LF = 110.0 (95% CI 108.9 to 111.1); HF = 109.3 (95% CI 108.3 to 110.3). After 1.5 years, on average girls in LF intake (30.4%TE) quintile will gain10.1 cm in height while girls in HF intake (41.8%TE) quintile will gain 11 cm in height. | + No | No matching reported. No adjustment for prognostic variables. |
| 2 years; mean end values per group | Height | cm | 2 | Total fat intake (single 3‐day weighed dietary records at baseline and 2 years) | LF < 30%TE HF > 35%TE | n overall = 126 (LF = 14, HF = 112); mean end values (SD). Baseline: LF = 86.1 (2.6); HF = 87.7 (3.3). At 2 years: LF (n = 20) = 107 (5.5); HF (n = 76) = 106 (3.9); P = NS. After 2 years, on average children with LF intake (< 30%TE) gain 20.9 cm in height, while children with HF intake > 35%TE) gain 18.3 cm in height. | ‐ No | No matching reported. No adjustment for prognostic variables. |
| Height at > 2to 5 years: 3 cohort studies; 3 analyses (n = 973) in boys and girls aged 2‐10 years | ||||||||
| 4.4 years; mean change per group | Height | cm/year | 2.1 | Total fat intake (multiple FFQs at baseline) | LF ≤ 30%TE HF > 30%TE | n overall = 215 (LF = 37, HF = 178), mean change (SD). Baseline: LF = 6.8 (1.4); HF = 6.4 (0.8); P > 0.05. MD 0.2 (95% CI ‐0.24 to 0.64). After 2 years, LF intake (≤ 30%TE) will result in a 0.2 cm/year greater increase in height on average compared to HF intake (> 30%TE). | ‐ No | No matching reported. No adjustment for prognostic variables. |
| 9.6 years regression | Height | cm | 3 | Total fat intake (multiple 24‐hour recalls at baseline, 1 and 3 years) | %TE | n overall = 632; regression results. B = ‐0.0009, P = 0.6. After 3 years, for every 1% increase in energy intake from fat, height in children will decrease by 0.0009 cm on average. | ‐ Yes | Adjusted for gender, physical activity, treatment, visit number, other sources of energy than fat, and for interactions: fat intake‐by‐treatment, fat intake‐by‐gender, fat intake‐by‐visit number and visit number‐by‐treatment. |
| 2 years; mean end values per group | Height | cm | 4 | Total fat intake (single 3‐day weighed dietary record at baseline, 2 and 4 years) | LF < 30%TE HF > 35%TE | n overall = 126 (LF = 14, HF = 112); mean end values (SD). Baseline: LF = 86.1 (2.6); HF = 87.7 (3.3). At 4 years: LF (n = 14) = 114 (5.5); HF (n = 88) = 116 (4.3); P > 0.05. After 4 years, on average children with LF intake (< 30%TE) gain 27.9 cm in height, while children with HF intake (> 35%TE) gain 28.3 cm in height. | + No | No matching reported. No adjustment for prognostic variables. |
| Height at > 5to 10 years: 1 cohort study; 1 analysis (n = 126) in boys and girls aged 2 years | ||||||||
| 2 years; mean end values per group | Height | cm | 6 | Total fat intake (single 3‐day weighed dietary record at baseline, 2 and 4 years; single 4‐day weighed dietary record at 6 years) | LF < 30%TE HF > 35%TE | n overall = 126 (LF = 14, HF = 112); mean end values (SD). Baseline: LF = 86.1 (2.6); HF = 87.7 (3.3). At 6 years: LF (n = 13) = 131 (7.7); HF (n = 72) = 128 (5.2); P > 0.05. At 6 years, on average children in LF intake (< 30%TE) gain 44.9 cm in height while children in HF intake (> 35%TE) gain 40.3 cm in height. | ‐ No | No matching reported. No adjustment for prognostic variables. |
| aDirection refers to whether there was a positive (+: exposure and outcome moved in the same direction), inverse/negative (‐: exposure and outcome moved in opposite directions) or zero (0: no association) between total fat intake and the outcome. bRelative height, deviation in percentages from the mean height of healthy Finnish children of the same height and gender. %TE: percentage of total energy; FFQ: Food Frequency Questionnaire; LF: low fat; HF: high fat; MD: mean difference; NA: not applicable; NR: not reported; SD: standard deviation. | ||||||||
| Outcome or subgroup title | No. of studies | No. of participants | Statistical method | Effect size |
| 1 Weight outcomes (standardised and unstandardised end values) Show forest plot | 2 | Mean Difference (IV, Fixed, 95% CI) | Totals not selected | |
| 1.1 6 months | 1 | Mean Difference (IV, Fixed, 95% CI) | 0.0 [0.0, 0.0] | |
| 1.2 > 6 to 12 months | 2 | Mean Difference (IV, Fixed, 95% CI) | 0.0 [0.0, 0.0] | |
| 1.3 > 2 to 5 years | 1 | Mean Difference (IV, Fixed, 95% CI) | 0.0 [0.0, 0.0] | |
| 2 Body mass index (BMI) (kg/m2) (end values) Show forest plot | 2 | Mean Difference (IV, Fixed, 95% CI) | Totals not selected | |
| 2.1 > 6 to 12 months | 1 | Mean Difference (IV, Fixed, 95% CI) | 0.0 [0.0, 0.0] | |
| 2.2 > 1 to 2 years | 1 | Mean Difference (IV, Fixed, 95% CI) | 0.0 [0.0, 0.0] | |
| 2.3 > 2 to 5 years | 1 | Mean Difference (IV, Fixed, 95% CI) | 0.0 [0.0, 0.0] | |
| 2.4 > 5 years | 1 | Mean Difference (IV, Fixed, 95% CI) | 0.0 [0.0, 0.0] | |
| 3 BMI (kg/m2) (end values): sensitivity analysis (longest follow‐up data only) Show forest plot | 2 | Mean Difference (IV, Fixed, 95% CI) | Totals not selected | |
| 3.1 > 1 to 2 years | 1 | Mean Difference (IV, Fixed, 95% CI) | 0.0 [0.0, 0.0] | |
| 3.2 > 5 years | 1 | Mean Difference (IV, Fixed, 95% CI) | 0.0 [0.0, 0.0] | |
| 4 BMI (kg/m2) (end values): sensitivity analysis (shortest follow‐up data only) Show forest plot | 2 | Mean Difference (IV, Fixed, 95% CI) | Totals not selected | |
| 4.1 > 6 to 12 months | 1 | Mean Difference (IV, Fixed, 95% CI) | 0.0 [0.0, 0.0] | |
| 4.2 > 1 to 2 years | 1 | Mean Difference (IV, Fixed, 95% CI) | 0.0 [0.0, 0.0] | |
| 5 Total cholesterol (mmol/L) (end values) Show forest plot | 1 | Mean Difference (IV, Fixed, 95% CI) | Totals not selected | |
| 5.1 > 6 to 12 months | 1 | Mean Difference (IV, Fixed, 95% CI) | 0.0 [0.0, 0.0] | |
| 5.2 > 2 to 5 years | 1 | Mean Difference (IV, Fixed, 95% CI) | 0.0 [0.0, 0.0] | |
| 5.3 > 5 years | 1 | Mean Difference (IV, Fixed, 95% CI) | 0.0 [0.0, 0.0] | |
| 6 Low‐density lipoprotein (LDL) cholesterol (mmol/L) Show forest plot | 1 | Mean Difference (IV, Fixed, 95% CI) | Totals not selected | |
| 6.1 > 6 to 12 months | 1 | Mean Difference (IV, Fixed, 95% CI) | 0.0 [0.0, 0.0] | |
| 6.2 > 2 to 5 years | 1 | Mean Difference (IV, Fixed, 95% CI) | 0.0 [0.0, 0.0] | |
| 6.3 > 5 years | 1 | Mean Difference (IV, Fixed, 95% CI) | 0.0 [0.0, 0.0] | |
| 7 High‐density lipoprotein (HDL)‐cholesterol (mmol) (end values) Show forest plot | 1 | Mean Difference (IV, Fixed, 95% CI) | Totals not selected | |
| 7.1 > 6 to 12 months | 1 | Mean Difference (IV, Fixed, 95% CI) | 0.0 [0.0, 0.0] | |
| 7.2 > 2 to 5 years | 1 | Mean Difference (IV, Fixed, 95% CI) | 0.0 [0.0, 0.0] | |
| 7.3 > 5 years | 1 | Mean Difference (IV, Fixed, 95% CI) | 0.0 [0.0, 0.0] | |
| 8 Triglycerides (mmol/L) (end values) Show forest plot | 1 | Mean Difference (IV, Fixed, 95% CI) | Totals not selected | |
| 8.1 > 6 to 12 months | 1 | Mean Difference (IV, Fixed, 95% CI) | 0.0 [0.0, 0.0] | |
| 8.2 > 2 to 5 years | 1 | Mean Difference (IV, Fixed, 95% CI) | 0.0 [0.0, 0.0] | |
| 8.3 > 5 years | 1 | Mean Difference (IV, Fixed, 95% CI) | 0.0 [0.0, 0.0] | |
| 9 Systolic blood pressure (mmHg) (end values) Show forest plot | 1 | Mean Difference (IV, Fixed, 95% CI) | Totals not selected | |
| 9.1 > 6 to 12 months | 1 | Mean Difference (IV, Fixed, 95% CI) | 0.0 [0.0, 0.0] | |
| 9.2 > 2 to 5 years | 1 | Mean Difference (IV, Fixed, 95% CI) | 0.0 [0.0, 0.0] | |
| 10 Diastolic blood pressure (mmHg) (end values) Show forest plot | 1 | Mean Difference (IV, Fixed, 95% CI) | Totals not selected | |
| 10.1 > 6 to 12 months | 1 | Mean Difference (IV, Fixed, 95% CI) | 0.0 [0.0, 0.0] | |
| 10.2 > 2 to 5 years | 1 | Mean Difference (IV, Fixed, 95% CI) | 0.0 [0.0, 0.0] | |
| 11 Height outcomes (standardised and unstandardised end values) Show forest plot | 2 | Mean Difference (IV, Fixed, 95% CI) | Totals not selected | |
| 11.1 6 months | 1 | Mean Difference (IV, Fixed, 95% CI) | 0.0 [0.0, 0.0] | |
| 11.2 > 6 to 12 months | 2 | Mean Difference (IV, Fixed, 95% CI) | 0.0 [0.0, 0.0] | |
| 11.3 > 2 to 5 years | 1 | Mean Difference (IV, Fixed, 95% CI) | 0.0 [0.0, 0.0] | |
| 11.4 > 5 years | 1 | Mean Difference (IV, Fixed, 95% CI) | 0.0 [0.0, 0.0] | |
| 12 Energy intake (kJ) (end values) Show forest plot | 2 | Mean Difference (IV, Fixed, 95% CI) | Totals not selected | |
| 12.1 > 6 to 12 months | 1 | Mean Difference (IV, Fixed, 95% CI) | 0.0 [0.0, 0.0] | |
| 12.2 > 1 to 2 years | 1 | Mean Difference (IV, Fixed, 95% CI) | 0.0 [0.0, 0.0] | |
| 12.3 > 2 to 5 years | 1 | Mean Difference (IV, Fixed, 95% CI) | 0.0 [0.0, 0.0] | |
| 13 Fat intake (%TE) (end values) Show forest plot | 2 | Mean Difference (IV, Fixed, 95% CI) | Totals not selected | |
| 13.1 > 6 to 12 months | 1 | Mean Difference (IV, Fixed, 95% CI) | 0.0 [0.0, 0.0] | |
| 13.2 > 1 to 2 years | 1 | Mean Difference (IV, Fixed, 95% CI) | 0.0 [0.0, 0.0] | |
| 13.3 > 2 to 5 years | 1 | Mean Difference (IV, Fixed, 95% CI) | 0.0 [0.0, 0.0] | |
| 14 Saturated fat intake (%TE) (end values) Show forest plot | 2 | Mean Difference (IV, Fixed, 95% CI) | Totals not selected | |
| 14.1 > 6 to 12 months | 1 | Mean Difference (IV, Fixed, 95% CI) | 0.0 [0.0, 0.0] | |
| 14.2 > 1 to 2 years | 1 | Mean Difference (IV, Fixed, 95% CI) | 0.0 [0.0, 0.0] | |
| 14.3 > 2 to 5 years | 1 | Mean Difference (IV, Fixed, 95% CI) | 0.0 [0.0, 0.0] | |
| 15 Protein intake (%TE) (end values) Show forest plot | 2 | Mean Difference (IV, Fixed, 95% CI) | Totals not selected | |
| 15.1 > 6 to 12 months | 1 | Mean Difference (IV, Fixed, 95% CI) | 0.0 [0.0, 0.0] | |
| 15.2 > 1 to 2 years | 1 | Mean Difference (IV, Fixed, 95% CI) | 0.0 [0.0, 0.0] | |
| 15.3 > 2 to 5 years | 1 | Mean Difference (IV, Fixed, 95% CI) | 0.0 [0.0, 0.0] | |
| 16 Carbohydrate (%TE) (end values) Show forest plot | 2 | Mean Difference (IV, Fixed, 95% CI) | Totals not selected | |
| 16.1 > 6 to 12 months | 1 | Mean Difference (IV, Fixed, 95% CI) | 0.0 [0.0, 0.0] | |
| 16.2 > 1 to 2 years | 1 | Mean Difference (IV, Fixed, 95% CI) | 0.0 [0.0, 0.0] | |
| 16.3 > 2 to 5 years | 1 | Mean Difference (IV, Fixed, 95% CI) | 0.0 [0.0, 0.0] | |