Terapias psicológicas para pacientes con trastorno límite de la personalidad
Resumen
Antecedentes
A lo largo de las décadas, se han desarrollado diversas intervenciones psicológicas para el trastorno límite de la personalidad (TLP). Esta revisión actualiza y reemplaza una revisión anterior (Stoffers‐Winterling 2012).
Objetivos
Evaluar los efectos beneficiosos y perjudiciales de las terapias psicológicas para los personas con TLP.
Métodos de búsqueda
En marzo 2019 se hicieron búsquedas en CENTRAL, MEDLINE, Embase, otras 14 bases de datos y cuatro registros de ensayos. Se estableció contacto con los investigadores que trabajan en el área para solicitar datos adicionales de ensayos publicados y no publicados, y se realizaron búsquedas manuales en revistas relevantes. No se restringió la búsqueda por año de publicación, idioma ni tipo de publicación.
Criterios de selección
Ensayos controlados aleatorizados que compararan diferentes intervenciones psicoterapéuticas con el tratamiento habitual (TH; que incluía varios tipos de psicoterapia), lista de espera, ningún tratamiento o tratamientos activos en muestras de todas las edades, en cualquier entorno, con un diagnóstico formal de TLP. Los desenlaces principales fueron la gravedad de los síntomas del TLP, el daño autoinfligido, los desenlaces relacionados con el suicidio y la funcionalidad psicosocial. Hubo 11 desenlaces secundarios, que incluyeron los síntomas individuales del TLP, así como la deserción y los efectos adversos.
Obtención y análisis de los datos
Al menos dos autores de la revisión seleccionaron los ensayos, extrajeron los datos, evaluaron el riesgo de sesgo mediante la herramienta del «Riesgo de sesgo» de Cochrane y evaluaron la certeza de la evidencia mediante los criterios GRADE de forma independiente. Se realizó el análisis de los datos utilizando Review Manager 5 y se cuantificó la fiabilidad estadística de los datos mediante el análisis secuencial de ensayos.
Resultados principales
Se incluyeron 75 ensayos controlados aleatorizados (4507 participantes), en los que predominaban las mujeres con una media de edad que oscilaba entre 14,8 y 45,7 años. Se incluyeron más de 16 tipos diferentes de psicoterapia, principalmente la terapia dialéctica conductual (TDC) y la terapia basada en la mentalización (TBM). Las intervenciones de comparación incluyeron el tratamiento habitual (TH), la lista de espera y otros tratamientos activos. La duración del tratamiento varió de uno a 36 meses.
Psicoterapia versus TH
La psicoterapia redujo la gravedad de los síntomas del TLP, en comparación con el TH; diferencia de medias estandarizada (DME) ‐0,52; intervalo de confianza (IC) del 95%: ‐0,70 a ‐0,33; 22 ensayos, 1244 participantes; evidencia de calidad moderada. Estas cifras corresponden a una diferencia de medias (DM) de ‐3,6 (IC del 95%: ‐4,4 a ‐2,08) en la Zanarini Rating Scale para el TLP (rango de 0 a 36), una reducción clínicamente relevante de la gravedad de los síntomas del TLP (la diferencia mínima clínicamente relevante [MIREDIF] en esta escala es de ‐3,0 puntos).
La psicoterapia puede ser más efectiva para reducir el daño autoinfligido en comparación con el TH (DME ‐0,32; IC del 95%: ‐0,49 a ‐0,14; 13 ensayos, 616 participantes; evidencia de calidad baja), lo que corresponde a una DM de ‐0,82 (IC del 95%: ‐1,25 a 0,35) en la Deliberate Self‐Harm Inventory Scale (rango de 0 a 34). No se logró la MIREDIF de ‐1,25 puntos.
Los desenlaces relacionados con el suicidio mejoraron en comparación con el TH (DME ‐0,34; IC del 95%: ‐0,57 a ‐0,11; 13 ensayos, 666 participantes; evidencia de calidad baja), lo que corresponde a una DM de ‐0,11 (IC del 95%: ‐0,19 a ‐0,034) en la Suicidal Attempt Self Injury Interview. No se logró la MIREDIF de ‐0,17 puntos.
En comparación con el TH, la psicoterapia puede dar lugar a una mejoría de la funcionalidad psicosocial (DME ‐0,45; IC del 95%: ‐0,68 a ‐0,22; 22 ensayos, 1314 participantes; evidencia de calidad baja), lo que corresponde a una DM de ‐2,8 (IC del 95%: ‐4,25 a ‐1,38), en la Global Assessment of Functioning Scale (rango de 0 a 100). No se logró la MIREDIF de ‐4,0 puntos.
El análisis secuencial de ensayos adicional sobre todos los desenlaces principales que lograron significación encontró que se alcanzó el tamaño de información requerido en todos los casos.
Un análisis de subgrupos que comparó los diferentes tipos de psicoterapia versus TH no mostró evidencia clara de una diferencia en la gravedad del TLP y la funcionalidad psicosocial.
La psicoterapia puede reducir los síntomas depresivos en comparación con el TH, pero la evidencia es muy incierta (DME ‐0,39; IC del 95%: ‐0,61 a ‐0,17; 22 ensayos, 1568 participantes; evidencia de calidad muy baja), lo que corresponde a una DM de ‐2,45 puntos en la Hamilton Depression Scale (rango de 0 a 50). No se logró la MIREDIF de ‐3,0 puntos.
La psicoterapia específica para el TLP no redujo la deserción en comparación con el TH. Los efectos adversos no estaban claros debido a la escasez de datos.
Psicoterapia versus lista de espera o ningún tratamiento
Se observaron mejorías mayores en la gravedad de los síntomas del TLP (DME ‐0,49; IC del 95%: ‐0,93 a ‐0,05; 3 ensayos, 161 participantes), la funcionalidad psicosocial (DME ‐0,56; IC del 95%: ‐1,01 a ‐0,11; 5 ensayos, 219 participantes) y la depresión (DME ‐1,28; IC del 95%: ‐2,21 a ‐0,34; 6 ensayos, 239 participantes) en los participantes que recibieron psicoterapia versus lista de espera o ningún tratamiento (evidencia de calidad baja para todas las comparaciones). No se encontró evidencia de una diferencia entre los desenlaces del daño autoinfligido y los relacionados con el suicidio.
Enfoques terapéuticos individuales
La TDC y la TBM tienen el mayor número de ensayos primarios; la TDC es el tema de un tercio de todos los ensayos incluidos, seguida por la TBM con siete ECA.
En comparación con el TH, la TDC fue más efectiva para reducir la gravedad del TLP (DME ‐0,60; IC del 95%: ‐1,05 a ‐0,14; 3 ensayos, 149 participantes) y el daño autoinfligido (DME ‐0,28; IC del 95%: ‐0,48 a ‐0,07; 7 ensayos, 376 participantes) y para mejorar la funcionalidad psicosocial (DME ‐0,36; IC del 95%: ‐0,69 a ‐0,03; 6 ensayos, 225 participantes). La TBM parece ser más efectiva que el TH para reducir el daño autoinfligido (RR 0,62; IC del 95%: 0,49 a 0,80; 3 ensayos, 252 participantes), la tendencia suicida (RR 0,10; IC del 95%: 0,04, 0,30; 3 ensayos, 218 participantes) y la depresión (DME ‐0,58; IC del 95%: ‐1,22 a 0,05; 4 ensayos, 333 participantes). Todos los hallazgos se basan en evidencia de calidad baja. Para los desenlaces secundarios, véase el texto de la revisión.
Conclusiones de los autores
Las evaluaciones mostraron efectos beneficiosos en todos los desenlaces principales a favor de la psicoterapia adaptada al TLP en comparación con el TH. Sin embargo, solo el desenlace de la gravedad del TLP logró el límite definido por la MIREDIF para una mejoría clínicamente significativa. Los análisis de subgrupos no encontraron evidencia de una diferencia en las estimaciones de los efectos entre los diferentes tipos de terapias (en comparación con el TH) .
El análisis agrupado de la psicoterapia versus lista de espera o ningún tratamiento encontró una mejoría significativa en la gravedad del TLP, la funcionalidad psicosocial y la depresión al final del tratamiento, pero estos hallazgos se basaron en evidencia de calidad baja, y no se conoce la verdadera magnitud de estos efectos. No se encontró evidencia clara de diferencias en cuanto a los desenlaces del daño autoinfligido y los relacionados con el suicidio.
Sin embargo, en comparación con el TH, se observaron efectos a favor de la TDC para la gravedad del TLP, el daño autoinfligido y la funcionalidad psicosocial y, en el caso de la TBM, para el daño autoinfligido y la tendencia suicida al final del tratamiento, aunque todos se basaron en evidencia de calidad baja. Por lo tanto, no existe seguridad en cuanto a que estos efectos sean alterados al agregar datos adicionales.
PICO
Resumen en términos sencillos
Terapias psicológicas para pacientes con trastorno límite de la personalidad
Antecedentes
Los pacientes afectados por el trastorno límite de la personalidad (TLP) suelen tener dificultades para controlar sus impulsos y emociones. Pueden tener una mala imagen de sí mismos, experimentar cambios rápidos de humor, pueden dañarse a sí mismos y tener dificultades para entablar relaciones interpersonales armoniosas. Se han desarrollado diferentes tipos de tratamientos psicológicos («tratamientos de conversación») para ayudar a los pacientes con TLP. Los efectos de estos tratamientos deben ser investigados para decidir qué tan bien funcionan y si pueden ser perjudiciales.
Objetivo
Esta revisión resume el conocimiento actual sobre el efecto de la psicoterapia en los pacientes con TLP.
Métodos
Se compararon los efectos de los tratamientos psicológicos en pacientes afectados por el TLP que no recibieron tratamiento o que continuaron su tratamiento habitual, estaban en lista de espera o recibieron tratamiento activo.
Hallazgos
Se buscaron artículos de investigación pertinentes y se encontraron 75 ensayos (4507 participantes, en su mayoría mujeres, con una media de edad que oscilaba entre 14,8 y 45,7 años). Los ensayos examinaron una amplia variedad de tratamientos psicológicos (más de 16 tipos diferentes). La mayoría de las veces se realizaron en entornos ambulatorios y duraron entre uno y 36 meses. La terapia dialéctica conductual (TDC) y la terapia basada en la mentalización (TBM) fueron las terapias más estudiadas.
Psicoterapia en comparación con el tratamiento habitual
La psicoterapia redujo la gravedad de los síntomas del TLP y la tendencia suicida y puede reducir el daño autoinfligido y la depresión, mientras que también mejora la funcionalidad psicológica en comparación con el tratamiento habitual. La TDC puede ser mejor que el tratamiento habitual para reducir la gravedad del TLP y el daño autoinfligido y mejorar la funcionalidad psicosocial. Del mismo modo, la TBM parece ser más efectiva que el tratamiento habitual para reducir el daño autoinfligido, la tendencia suicida y la depresión. Sin embargo, todos estos hallazgos se basaron en evidencia de calidad baja y, por lo tanto, no se sabe con certeza si estos resultados cambiarían al añadir más ensayos. La mayoría de los ensayos no informó sobre los efectos adversos, y los que lo hicieron no encontraron ninguna reacción no deseada evidente después del tratamiento psicológico. La mayoría de los ensayos (64 de 75) fueron financiados por subvenciones de universidades, autoridades o fundaciones de investigación. Cuatro ensayos informaron de que no recibieron financiación. Para los ensayos restantes (7), no se especificó la financiación.
Psicoterapia versus lista de espera o ningún tratamiento
La psicoterapia fue más efectiva que la lista de espera para mejorar los síntomas del TLP, la funcionalidad psicosocial y la depresión, pero no hubo una diferencia clara entre la psicoterapia y la lista de espera para los desenlaces del daño autoinfligido y los relacionados con el suicidio.
Conclusiones
En general, la psicoterapia puede ser más efectiva que el tratamiento habitual para reducir la gravedad de los síntomas del TLP, el daño autoinfligido, los desenlaces relacionados con el suicidio y la depresión, mientras que mejora la funcionalidad psicosocial. Sin embargo, solo se encontró que la disminución de la gravedad de los síntomas del TLP estuvo a un nivel clínicamente importante. La TDC parece ser mejor para reducir la gravedad del TLP, y el daño autoinfligido y mejorar la funcionalidad psicosocial en comparación con el tratamiento habitual y la TBM parece ser más efectiva que el tratamiento habitual para reducir el daño autoinfligido y la tendencia suicida. Sin embargo, todavía no existe seguridad en cuanto a estos hallazgos ya que la calidad de la evidencia es baja.
Authors' conclusions
Summary of findings
| Psychotherapy versus treatment‐as‐usual | ||||||
| Patient or population: borderline personality disorder Settings: inpatient and outpatient Intervention: psychotherapy Comparison: treatment‐as‐usual (TAU) | ||||||
| Outcomes | Illustrative comparative risks* (95% CI) | Relative effect(95% CI) | Number of participants (RCTs) | Quality of the evidence (GRADE) | Comments | |
|---|---|---|---|---|---|---|
| Assumed risk | Corresponding risk | |||||
| TAU | Psychotherapy | |||||
| BPD symptom severity Measured by: clinicians and self‐rated Timing of outcome assessment: end of treatment | ‐ | The mean score in the intervention groups was 0.52 SD lower (0.70 lower to 0.33 lower) | ‐ | 1244 (22 RCTs) | ⊕⊕⊕⊝ Moderatea | The SMD of −0.52 corresponds to −3.6 on the Zanarini BPD scale. The MIREDIF on this scale is 3.0 points TSA adjusted Cl = −5.49 to −1.90 on the Zanarini BPD scale TSA RIS = 901 |
| Self‐harm (frequency) Measured by: clinicians and self‐rated Timing of outcome assessment: end of treatment | ‐ | The mean score in the intervention groups was 0.32 SD lower (0.49 lower to 0.14 lower) | ‐ | 616 (13 RCTs) | ⊕⊕⊝⊝ | The SMD of −0. 32 corresponds to −0.82 on the DSHI. The MIREDIF on this scale is −1.25 points (½ SD) TSA adjusted CI = −0.59 to −0.08 on the DSHI TSA RIS = 97 |
| Suicide‐related outcomes (suicidality) Measured by: clinicians and self‐rated Timing of outcome assessment: end of treatment | ‐ | The mean score in the intervention groups was 0.34 SD lower (0.57 lower to 0.11 lower) | ‐ | 666 (13 RCTs) | ⊕⊕⊝⊝ Lowa,b | The SMD of −0. 34 corresponds to −0.11 on the SASII. The MIREDIF on this scale is −0.17 points (½ SD) TSA adjusted CI = −0.18 to −0.04 on the SASII TSA RIS = 253 |
| Psychosocial functioning Measured by: clinicians and self‐rated Timing of outcome assessment: end of treatment | ‐ | The mean score in the intervention groups was 0.45 SD lower (0.68 lower to 0.22 lower) | ‐ | 1314 (22 RCTs) | ⊕⊕⊝⊝ | The SMD of −0.45 corresponds to −2.8 on the GAF. The MIREDIF on this scale is −4.0 points TSA adjusted CI = −3.97 to −1.94 on the GAF TSA RIS = 947 |
| Depression Measured by: clinicians and self‐rated Timing of outcome assessment: end of treatment | ‐ | The mean score in the intervention groups was 0.39 SD lower (0.61 lower to 0.17 lower) | ‐ | 1568 (22 RCTs) | ⊕⊝⊝⊝ | The SMD of ‐0.45 corresponds to −2.45 on the Hamilton Depression Scale. The MIREDIF on this scale is 3.0 points TSA adjusted CI = −3.34 to −1.72 on the Hamilton Depression Scale TSA RIS = 2274 |
| Attrition Timing of outcome assessment: end of treatment | 328 per 1000 | 328 per 1000 (95% CI 56 fewer to 66 higher) | RR 1.00 (95% CI 0.83 to 1.20) | 2225 (32 RCTs) | ⊕⊕⊝⊝ | ‐ |
| Adverse effects Timing of outcome assessment: end of treatment | 74 per 1000 | 6 per 1000 (95% CI 41 fewer to 65 higher) | RR 0.92 (95% CI 0.45 to 1.88) | 381 (2 RCTs) | ⊕⊕⊝⊝ | ‐ |
| *The basis for the assumed risk (e.g. the median control group risk across studies) is provided in footnotes. The corresponding risk (and its 95% CI) is based on the assumed risk in the comparison group and the relative effect of the intervention (and its 95% CI). CI: Confidence interval; DSHI: Deliberate Self‐Harm Inventory; GAF: Global Assessment of Functioning scale; MIREDIF: Minimum relevant difference; RCTs: Randomised controlled trials; RIS: Required information size; RR: Risk Ratio; SASII: Suicide Attempt Self‐Injury Interview; SD: Standard deviation; SMD: Standardised mean difference; TAU: treatment‐as‐usual; TSA: Trial Sequential Analysis | ||||||
| GRADE Working Group grades of evidence | ||||||
| aWe downgraded the quality of this evidence by one level due to risk of bias (other bias). | ||||||
| Psychotherapy versus waiting list or no treatment | ||||||
| Patient or population: borderline personality disorder Settings: inpatient and outpatient Intervention: psychotherapy Comparison: waiting list or no treatment | ||||||
| Outcomes | Illustrative comparative risks* (95% CI) | Relative effect (95% CI) | Number of participants (RCTs) | Quality of the evidence (GRADE) | Comments | |
|---|---|---|---|---|---|---|
| Assumed risk | Corresponding risk | |||||
| Waiting list or no treatment | Psychotherapy | |||||
| BPD symptom severity Measured by: clinicians and self‐rated Timing of outcome assessment: end of treatment | ‐ | The mean score in the intervention groups was 0.49 SD lower (0.93 lower to 0.05 lower) | ‐ | 161 (3 RCTs) | ⊕⊕⊝⊝ | An SMD of 0.49 represents a moderate effect. |
| Self‐harm Measured by: clinicians and self‐rated Timing of outcome assessment: end of treatment | ‐ | The mean score in the intervention groups was0.17 SD lower (0.52 lower to 0.18 higher) | ‐ | 128 (2 RCTs) | ⊕⊕⊝⊝ | An SMD of 0.17 represents a small effect. |
| Suicide‐related outcomes Measured by: self‐rated Timing of outcome assessment: end of treatment | ‐ | The mean score in the intervention groups was 5.62 SD lower (16.39 lower to 5.16 higher) | ‐ | 108 (2 RCTs) | ⊕⊝⊝⊝ Verylowa,b,c | An SMD of 5.62 represents a large effect. |
| Psychosocial functioning Measured by: clinicians and self‐rated Timing of outcome assessment: end of treatment | ‐ | The mean score in the intervention groups was 0.56 SD lower (1.01 lower to 0.11 lower) | ‐ | 219 (5 RCTs) | ⊕⊕⊝⊝ | An SMD of 0.56 represents a moderate effect. |
| Depression Measured by: clinicians and self‐rated Timing of outcome assessment: end of treatment | ‐ | The mean score in the intervention groups was 1.28 SD lower (2.21 lower to 0.34 lower) | ‐ | 239 (6 RCTs) | ⊕⊕⊝⊝ | An effect size of 1.28 represents a large effect. |
| Attrition Timing of outcome assessment: end of treatment | 81 per 1000 | 147 per 1000 (95% CI 118 fewer to 74 higher) | RR 0.55 (95% CI 0.20 to 1.50) | 144 (3 RCTs) | ⊕⊝⊝⊝ | ‐ |
| Adverse effects (not measured | See comments | See comments | ‐ | ‐ | ‐ | No studies were found that assessed this outcome |
| *The basis for the assumed risk (e.g. the median control group risk across studies) is provided in footnotes. The corresponding risk (and its 95% CI) is based on the assumed risk in the comparison group and the relative effect of the intervention (and its 95% CI). CI: Confidence interval; RCTs: Randomised controlled trials; RR: Risk ratio; SMD: Standardized mean difference | ||||||
| GRADE Working Group grades of evidence | ||||||
| aWe downgraded the quality of this evidence by one level due to risk of bias. | ||||||
| Dialectical behavioural therapy or mentalisation‐based therapy versus treatment‐as‐usual | ||||||
| Patient or population: borderline personality disorder Settings: inpatient and outpatient Intervention: dialectical behavioural therapy (DBT) or mentalisation‐based therapy (MBT) Comparison: treatment‐as‐usual (TAU) | ||||||
| Outcomes | Illustrative comparative risks* (95% CI) | Relative effect (95% CI) | Number of participants (RCTs) | Quality of the evidence (GRADE) | Comments | |
|---|---|---|---|---|---|---|
| Assumed risk | Corresponding risk | |||||
| TAU | DBT or MBT | |||||
| DBT | ||||||
| BPD severity Measured by: clinicians Timing of outcome assessment: end of treatment | ‐ | The mean score in the intervention groups was 0.60 SD lower (1.05 lower to 0.14 lower) | ‐ | 149 (3 RCTs) | ⊕⊕⊝⊝ | An SMD of 0.60 represents a moderate effect. |
| Self‐harm Measured by: clinicians Timing of outcome assessment: end of treatment | ‐ | The mean score in the intervention groups was | ‐ | 376 (7 RCTs) | ⊕⊕⊝⊝ | An SMD of 0.28 represents a small effect. |
| Psychosocial functioning Measured by: clinicians and self‐rated Timing of outcome assessment: end of treatment | ‐ | The mean score in the intervention groups was 0.36 SD lower (0.69 lower to 0.03 lower) | ‐ | 225 (6 RCTs) | ⊕⊕⊝⊝ | An SMD of 0.36 represents a small effect. |
| MBT | ||||||
| Self‐harm Measured by: clinicians Timing of outcome assessment: end of treatment | 631 per 1000 | 240 per 1000 (95% CI 334 fewer to 126 fewer) | RR 0.62 (95% CI 0.49 to 0.80) | 252 (3 RCTs) | ⊕⊕⊝⊝ | ‐ |
| Suicide‐related outcomes Measured by: clinicians Timing of outcome assessment: end of treatment | 298 per 1000 | 268 per 1000 (95% CI 286 fewer to 209 fewer) | RR 0.10 (95% CI 0.04 to 0.30) | 218 (3 RCTs) | ⊕⊕⊝⊝ | ‐ |
| *The basis for the assumed risk (e.g. the median control group risk across studies) is provided in footnotes. The corresponding risk (and its 95% CI) is based on the assumed risk in the comparison group and the relative effect of the intervention (and its 95% CI). CI: Confidence interval; DBT: Dialectical behavioural therapy; MBT: Mentalisation‐based therapy; RCTs: Randomised controlled trials; RR: Risk ratio; SMD: Standardized mean difference; TAU: Treatment‐as‐usual | ||||||
| GRADE Working Group grades of evidence | ||||||
| aWe downgraded the quality of this evidence by one level due to risk of bias. | ||||||
Background
Description of the condition
Borderline personality disorder (BPD) is a condition first formally described in the 20th century (Gunderson 2009). Historically, the term BPD was coined by Adolph Stern to describe a condition in the 'borderland' between psychosis and neurosis (Stern 1938). Subsequent psychoanalytic contributions (especially that of Kernberg 1975) have reaffirmed this distinction, emphasising that the capacity to test reality remains grossly intact but is subject to subtle distortions, especially under stress. The current evidence supports a biopsychological model of the aetiological factors in BPD, all of which may contribute. It is assumed that there is an interaction between the experience of adverse effects during childhood (like neglect, emotional or sexual abuse), and genetic or biological factors. Relevant biological factors include neurobiological structures, such as reduced aymgdala volume, increased volume of the pituitary gland, reduced grey matter volume in the anterior cingulate gyrus, posterior cingulate gyrus or hippocampus, and reduction in size of the right parietal cortex (Leichsenring 2011; Lieb 2004), and neurobiological dysfunctions (especially of the serotonergic system). In combination with psychosocial factors, personality traits (e.g. neuroticisms), personality functioning (self and interpersonal) and proneness to react highly emotionally may contribute to the core components of BPD, like affective and behavioural dysregulation, and disturbed relatedness (Leichsenring 2011; Lieb 2004).
According to current diagnostic criteria, BPD is characterised by a pervasive pattern of instability in affect regulation, impulse control, interpersonal relationships and self‐image (APA 2013; WHO 1993). Clinical hallmarks include, amongst other things, emotional dysregulation, impulsivity, anger, repeated self‐injury and chronic suicidal tendencies, together with inner emptiness and fear of abandonment (Dimaggio 2007; Fonagy 2009; Gunderson 2018; Karterud 2019; Lieb 2004). Despite the difficulties and controversies in defining and delimiting the condition, BPD is being vigorously researched still, not only in adults but also in childhood and adolescence (Chanen 2017), and is the only specific personality disorder to be carried over to the new, eleventh edition of the International Classification of Diseases (ICD‐11) (Bach 2018; WHO 2018). The importance of effective treatments for BPD stems from the considerable psychological suffering of the persons concerned (Stiglmayr 2005; Zanarini 1998), the burden incurred on their families and significant others (Bailey 2014; Bateman 2019a), the significant impact on mental health services (Cailhol 2015; Hörz 2010; Soeteman 2008a; Tyrer 2015; Zanarini 2004; Zanarini 2012), and not least the association of BPD with debilitating functional impairments and premature death (Fok 2012; Gunderson 2011a; Gunderson 2011b; Kjær 2018; Niesten 2016; Skodol 2002; Soeteman 2008b).
The definition of BPD in the Diagnostic and Statistical Manual of Mental Disorders (DSM), Fifth Edition (DSM‐5; APA 2013), Fourth Edition (DMS‐IV; APA 1994) and Fourth Edition Text Revision (DSM‐IV‐TR; APA 2000) comprises nine criteria that cover the features mentioned above. At least five criteria should be met for a definitive, categorical diagnosis of BPD to be made, and four criteria for a probable diagnosis (see Appendix 1). In the alternative diagnostic classification system of the World Health Organization (WHO), the ICD, which is currently in its tenth edition (ICD‐10; WHO 1993), the relating condition is referred to as "Emotionally unstable personality disorder (F60.3)", of which there is an impulsive type (F60.30) and a borderline type (F60.31; see Appendix 2). The latter essentially overlaps with the DSM‐IV definition and DSM‐5 criteria (Ottosen 2002).
In addition to categorical classification systems, the DSM‐5 also includes an alternative model for personality disorders (Section III: "Emerging Measures and Models"). This hybrid model is made up of two dimensions: 1) the severity of impairment in personality (self and interpersonal); and 2) the domains of personality traits (i.e. negative affectivity, detachment, antagonism, disinhibition, psychoticism; APA 2013, Section III). The ICD‐11 (which will be in effect from 2022; WHO 2018) is also moving towards a dimensional approach, where the different types of personality disorders are being replaced with a model that focuses on the severity of core personality functioning instead. However, a specifier relating to a "Borderline pattern" will be retained. Preliminary studies have found that there is a substantial overlap between the current categorical and alternative models found in the DSM‐5 (Bach 2016; Bach 2018; Sellbom 2014), as well as overlap between the dimensional models of the DSM‐5 and ICD‐11 (Bach 2018). Therefore, sufficient continuity between current categorical and upcoming dimensional models is warranted. The findings of this review will be applicable also to populations diagnosed with the DSM‐5 Section III Hybrid BPD type and ICD‐11 Borderline pattern qualifier.
The prevalence of BPD in the general population is estimated to be 1.8 % (95% CI 1.2% to 2.5%) (Winsper 2020). In clinical populations, BPD occurs frequently (Munk‐Jørgensen 2010), with trials reporting a prevalence ranging from 9.3% to 46.3% and a mean point prevalence across studies of 28.5% (Torgersen 2012). BPD usually has its onset in childhood and adolescence, and younger people are affected as much as or even more often than adults (Neacsiu 2017). BPD has been found to peak around 14 to 17 years of age with a linearly decline into adulthood; however, it continues throughout the lifespan and can also be found in older people (Chanen 2007; Newton‐Howes 2015; Sharp 2018; Videler 2019). Though BPD is predominantly diagnosed in women (75%; APA 2000; APA 2013), it is estimated to be almost equally frequent in men in epidemiological studies (Lenzenweger 2007; Ten Have 2016; Torgersen 2001; Torgersen 2012). Moreover, BPD commonly co‐occurs with mood disorders, substance use disorder, eating disorders, post‐traumatic stress disorder (PTSD), attention‐deficit hyperactivity disorder (ADHD), and other specific personality disorders (Coid 2006; Lenzenweger 2007; Stepp 2012; Storebø 2014; Tomko 2014). Suicidal behaviour is reported to occur in up to 84% of people diagnosed with BPD (Goodman 2012; Soloff 2002), and it is estimated that up to 10% of those affected by BPD will die from suicide (Paris 2019). Comorbid mood disorders or substance use disorders are the most common risk factors associated with successful suicide attempts (Black 2004; Doyle 2016; Yen 2004).
Although the short‐ to medium‐term social functioning of people with BPD is poor, diagnostic remission is around 85% within 10 years (Gunderson 2011b; Zanarini 2007). Here, however, remission only means that diagnostic criteria are not fulfilled; it does not indicate the absence of any symptoms. Indeed, whereas acute symptoms — such as self‐mutilation, help‐seeking suicide threats or attempts and impulsivity — decrease with time in most cases, affective symptoms reflecting areas of chronic dysphoria, such as chronic feelings of emptiness, intense anger or profound feelings of abandonment, largely remain (Zanarini 2007). Therefore, the majority of people with BPD still have significant levels of symptoms and experience severe and persistent impairment in social functioning over time (Kongerslev 2015; Ng 2016). Risk factors for poor, long‐term outcomes are comorbid substance use disorders, PTSD, and anxiety cluster disorders (Zanarini 2005; Zanarini 2007), as well as a family history of psychiatric disorder (especially mood disorders and substance use disorders), demographic issues such as older age, longer treatment history, pathological childhood experiences, temperament issues and adult psychosocial functioning (Chanen 2012; De Fruyt 2014; Kongerslev 2015; Zanarini 2007).
People with BPD have severe difficulties in achieving and maintaining vocational and social functioning over time (Hastrup 2019a; Paris 2014; Zanarini 2010). Furthermore, treatment‐seeking people with personality disorders, such as BPD, pose a high economic burden on society (Hastrup 2019b; Van Asselt 2007). Effective treatments could potentially decrease the high costs associated with the condition (Soeteman 2008a). The problem of deliberate self‐harm is also a particular issue within this group (Ayodeji 2015; Kongerslev 2015; Linehan 1997; Rossouw 2012b). In medical settings, people diagnosed with BPD often present after self‐harming behaviour or in suicidal crisis and are treated in emergency settings, often involving repeated psychiatric hospitalisations (Cailhol 2015).
In summary, BPD is a condition that has been studied extensively. It has a major impact on health facilities as those affected often present in crisis. Recovery from symptoms or functional impairment (or both) was previously considered likely for only a small percentage of people diagnosed with BPD. However, the long‐term course, in terms of symptomatic recovery, is favourable (Gunderson 2011b; Zanarini 2007; Zanarini 2012). Nonetheless, people diagnosed with BPD continue to have considerable interpersonal and functional problems, and sustainable recovery appears difficult to attain (Biskin 2015; Kongerslev 2015; Rossouw 2012b).
Description of the intervention
About three‐quarters of people with BPD present to mental healthcare professionals (Tomko 2014), and they are even more likely to do so than people with mood, anxiety, or other personality disorders (Ansell 2007). Most will receive psychological interventions, because drugs are not effective for the BPD core symptoms (Goodman 2010; Tomko 2014), and these psychosocial interventions will often be provided for a relatively long periods of time (e.g. for a period of one year or longer) (Ansell 2007; Zanarini 2015).
A broad range of psychotherapies exist for BPD. The therapy can be delivered in individual or group formats, or a combination of these two treatment modalities. As for most other mental disorders, psychological interventions can be based on the traditional, major psychotherapeutic schools such as psychodynamic psychotherapy, cognitive behaviour therapy (CBT) or client‐centred/humanistic therapy. In addition, several specific treatment approaches have been developed within recent decades to meet the particular challenges of treating BPD. These disorder‐specific approaches are usually precisely structured and manualised (De Groot 2008; Levy 2006; Weinberg 2011). Strategies are provided for addressing interpersonal challenges, such as emotional dysregulation and impulsivity, which are core problems for people diagnosed with BPD and could lead to difficulties in forming a therapeutic alliance. Most BPD‐specific psychological interventions involve multimodal therapy, treatment contracts, actively taking measures to minimise premature non‐completion of treatment, providing a crisis intervention protocol and encouraging the affected one's sense of agency (Bateman 2018; Clarkin 2012; De Groot 2008; Kongerslev 2015; Livesley 2012; Weinberg 2011). They are typically highly focused on affect and the therapeutic relationship, with a relatively active therapist implementing interventions within a supportive and validating atmosphere (Bateman 2018; Clarkin 2012; De Groot 2008; Kongerslev 2015; Livesley 2012; Weinberg 2011). Eclectic therapy is an open, integrative form of psychotherapy, which adapts to the unique needs of each specific client, depending on the problem, the treatment goals and the person’s expectations and motivation (Sansone 2006). Eclectic therapies integrate elements from different forms of psychotherapy.
Among the specific psychological interventions for people diagnosed with BPD, the most commonly used are: transference‐focused therapy (Clarkin 1999; Yeomans 2015); mentalisation‐based treatment (Bateman 2004; Bateman 2006; Bateman 2016); dialectical behaviour therapy (Linehan 1993a; Linehan 2015b); cognitive analytic therapy (Chanen 2014; Ryle 1997); schema‐focused therapy (Arntz 2009; Young 2003); and the systems training for emotional predictability and problem‐solving (STEPPS) (Black 2009). Most of these treatments are designed as outpatient treatments of six to 24 months duration, with once or twice weekly individual sessions. Some also include additional group therapy sessions, inpatient or day‐hospital therapeutic community treatment and psychoeducation. Other potential therapies for BPD include the likes of CBT (Beck 2003), acceptance and commitment therapy (ACT; Gratz 2006), interpersonal psychotherapy (IPT; Markowitz 2006), and psychodynamic psychotherapy (e.g. psychoanalytic‐interactional therapy; Streeck 2009). Broadly speaking, psychodynamic therapies aim to help people understand and reflect on their inner mental processes and make links between their past and current difficulties. Treatments based on CBT place emphasis on self‐directed learning processes: people are encouraged to identify their core beliefs; evaluate and modify their behaviour accordingly; and gain new experiences. Psychotherapy is defined as the "treatment of mental illness or emotional disturbances primarily by verbal or nonverbal communication" (quote; NLM 2009).
Dialectical behavioural therapy (DBT; Linehan 1993a) is a highly structured and complex psychological therapy that was developed using some of the principles of CBT in combination with mindfulness‐based and Zen‐Buddhistic and dialectical thinking strategies. It aims to change behaviour and enhance the ability to tolerate difficult or painful feelings by focusing on improving skills in stress tolerance, emotion regulation, interpersonal behaviour, and mindfulness.
Mentalisation‐based therapy (Bateman 2004; Bateman 2016) is a complex psychodynamic and attachment‐based psychological therapy programme that aims to increase the reflective functioning or mentalising capacity of the individual, helping the person to understand and recognise the feelings they evoke in others and the feelings they experience themselves, as well as improving the capacity for emotion regulation in interpersonal relations.
Schema‐focused therapy (SFT; Young 2003) draws from both cognitive‐behavioural and psychoanalytic theories and helps people with BPD to identify their self‐defeating core themes arising from unmet emotional needs in childhood and presenting as maladaptive coping styles in adulthood. The goal of SFT is to aid people affected by BPD in getting their needs met in adaptive ways.
Transference‐focused psychotherapy (TFP; Clarkin 1999) strives to achieve integrated representations of self and others, modification of primitive defence operations, and resolution of identity diffusion by analysis of the transference within the therapeutic relationship. Primitive object relations, which can be polarised and split, may be transformed to advanced or mature object relations characterised by more integrated object relations. TFP relies on techniques of clarification, confrontation and transference interpretation within the relationship between patient and therapist.
Cognitive analytic therapy (CAT; Ryle 1997) assumes that people with BPD typically experience rapid switching from one self‐state to another in a dissociate manner. The aim is to work with the patient cognitively, to identify procedural sequences, chains of events, emotions, thoughts and motivations, in order to understand how a target problem (like self‐harm) is established and maintained, and to identify reciprocal roles (i.e. how early experiences are replayed later in life).
Systems training for emotional predictability and problem‐solving (STEPPS; Black 2009) combines group‐based psychoeducation with skills training, and targets biased social cognition driven by cognitive filters or schemas.
Dynamic deconstructive psychotherapy (DDP) is a manualised, 12‐ to 18‐month treatment for adults diagnosed with BPD and other complex co‐occurring disorders such as substance use disorders, additional personality disorders or eating disorders (Gregory 2008; Gregory 2010). The DDP model of BPD pathology draws on and combines elements of translational neuroscience, object relations theory, and the philosophy of deconstruction. The aim of DDP is to help people with BPD to connect with and verbalise their experience better, as well as to foster better interpersonal relations and self‐acceptance. DDP was used in a randomised controlled trial (RCT) conducted by its developer (Gregory 2008).
Relaxation techniques and patient education programmes will be considered their own intervention class (i.e. not CBT or psychoanalytically based), as long as they are not explicitly grounded in or taken from a specific treatment approach (such as psychoeducation according to the DBT approach, CBT, or the SFT approach, etc.).
How the intervention might work
Evidence‐based psychological therapies are based on assumptions about causality, core symptoms, and maintenance of the disorder (Kazdin 2004; Livesley 2003; Livesley 2004). The various psychotherapeutic approaches to BPD claim different mechanisms of action according to their respective models of causation (Gunderson 2018; Huprich 2015; Livesley 2004; Livesley 2016). However, they also contain a number of common elements that can account for why a number of seemingly different approaches appear to be effective in ameliorating BPD symptoms (Bateman 2015; Fonagy 2014; Kongerslev 2015; Weinberg 2011), including: a clear and highly structured treatment framework; an explicit model of BPD symptomatology; a consistent focus on the therapeutic relationship, affect regulation, tolerance of emotional states, and biases in social cognition; a high priority given to self‐harm and suicidal behaviour; active therapists who deliver both support and validation as well as explorative and change‐oriented interventions; mix of treatment formats (e.g. includes both individual and group therapy); and therapist support in the form of supervision and regular meetings. The symptoms of BPD are addressed using the following therapeutic approaches. Following Weinberg 2011:
-
'emotional dysregulation' (e.g. intense anger and affective instability) is addressed through attention to affect, including raising awareness of emotional states, their triggers, and enhancing tolerance and regulative strategies;
-
'behavioural dysregulation' (e.g. impulsivity, self‐harm and suicidal behaviours) is addressed through change‐oriented interventions, including, for example, challenging negative thoughts, skills training, behavioural experiments, praise, and limit setting; and
-
'interpersonal dysfunction' (e.g. unstable relationships and stress‐related paranoid ideation) is treated using interventions that enhance the social‐cognitive (or mentalising) capacities of the BPD patient, through making basic and often negatively biased automatic assumptions explicit and more realistic or adaptive, and through paying attention to the establishment and maintenance of a safe and sound working alliance within the therapy sessions.
There is a risk that psychological therapies might not be helpful for all people affected by BPD, either due to the interventions delivered or through factors in the therapeutic relationship (Kongerslev 2015; Lilienfeld 2007; Parry 2016), and very little research has been done on this in people with BPD. The effectiveness of the therapy depends on the skills of the therapist to create the possibility for change with each patient. There is, therefore, the added complexity that the relationship or working alliance between the therapist and the patient itself is an ‘active ingredient’ of the therapy and that the quality of this relationship is an important predictor of outcome (Horvath 2011; Norcross 2011). There is no guarantee that the therapy will deliver what was specified in the manual or what was investigated in a randomised clinical trial (Parry 2016).
Why it is important to do this review
People with BPD and their family and friends experience high levels of psychological suffering. BPD is associated with considerable social costs in terms of service use (e.g. presentation to emergency clinics due to self‐harm or suicidal crises and repeated hospitalisations) and poor psychosocial functioning (e.g. inability to complete education or get/maintain a job). Consequently, identification of effective psychological therapies for BPD is important (Stoffers‐Winterling 2012).
Our review aims to provide a systematic summary of the evidence from randomised controlled trials (RCTs) in order to help people with BPD, their family and friends, mental healthcare workers, and policy and decision managers in general, to make informed decisions about evidence‐based treatment for BPD.
This review is an update of two previous Cochrane Reviews on psychological therapies for BPD (Binks 2006; Stoffers‐Winterling 2012). In addition to updating the two former Cochrane Reviews, our study also seeks to address some of the methodological limitations of both past and current reviews (Bateman 2015; Cristea 2017; Kliem 2010), by using updated methods, including a more comprehensive search strategy. We also had a new protocol published prior to conducting this review (Storebø 2018).
Objectives
To assess the beneficial and harmful effects of psychological therapies for people with BPD.
Methods
Criteria for considering studies for this review
Types of studies
Randomised controlled trials (RCTs).
Types of participants
Persons of all ages, in any setting, with a formal, categorical diagnosis of BPD according to the Diagnostic and Statistical Manual of Mental Disorders (DSM) Third Edition (DSM‐III; APA 1980), Third Edition Revised (DSM‐III‐R; APA 1987), Fourth Edition (DSM‐IV; APA 1994), Fourth Edition Text Revision (DSM‐IV‐TR; APA 2000), and Fifth Edition (DSM‐5; APA 2013), and the International Classification of Diseases and Related Health Problems (ICD) 10th version (WHO 1993), with or without comorbid conditions.
To meet our inclusion criteria, at least 70% of participants of a respective trial had to have a formal diagnosis of BPD. We included trials involving subsamples of people with BPD when data on those with BPD were provided separately (we asked for separate data from trials including less than 70% BPD participants). We did not include trials that focused on people with mental impairment, organic brain disorder, dementia or other severe neurologic/neurodevelopmental diseases.
Types of interventions
Any defined psychological intervention regardless of theoretical orientation (e.g. psychodynamic therapy, CBT, systemic therapy or eclectic therapies designed for BPD treatment), in any kind of treatment setting (e.g. inpatient, outpatient or day clinic), compared to:
-
control interventions, such as standard care, treatment‐as‐usual (TAU), waiting list or no treatment; and
-
specific psychotherapeutic interventions (that were well defined and theory driven).
We divided control interventions into two categories: The first category was “waiting list/no treatment”: participants did not receive any treatment or support from the study centre (like, e.g. clinical management, regular medical review, or support/encouragement to find a therapist outside the study centre). The second category, “TAU” included any other kinds of controls: participants were either free to use any treatment except from the respective experiential treatment (optional TAU), or they received usual community treatment, or standardised usual care (obligatory TAU).
We pooled the different types of TAU into one comparison in our main analyses, and compared the effects between the two types of TAU as well as the effect observed by comparison to TAU controls to the effects of comparisons to waiting‐list/no treatment controls (see Subgroup analysis and investigation of heterogeneity).
We allowed concomitant treatments provided they were applied to both treatment conditions.
We accepted trials with active controls, including relaxation techniques such as autogenic training or meditation regimens, or patient education programmes such as self‐management and community‐based education programmes.
Types of outcome measures
Outcomes were either self‐rated by the persons with BPD or observer‐rated by clinicians, with clinician‐rated outcomes being preferred. We included only adequately validated measures (plus spontaneous reporting of adverse effects).
We analysed all outcomes at post‐treatment and at six months follow‐up or longer.
Primary outcomes
-
BPD symptom severity, assessed by, for example, the Zanarini Rating Scale for Borderline Personality Disorder (Zan‐BPD; Zanarini 2003a); the Borderline Personality Disorder Severity Index, Fourth version (BPDSI‐IV; Arntz 2003) or the Clinical Global Impression Scale for people with Borderline Personality Disorder (CGI‐BPD; Perez 2007).
-
Self‐harm, in terms of the proportion of participants with self‐harming behaviour, or assessed by, for example, the Deliberate Self‐harm Inventory (DSHI; Gratz 2001) or the Self‐harm behaviour Questionnaire (SHBQ; Guttierez 2001).
-
Suicide‐related outcomes, assessed by, for example, the Suicidal Behaviours Questionnaire (SBQ; Osman 2001) or the Beck Scale for Suicidal Ideation (BSSI; Beck 1979), or in terms of the proportion of participants with suicidal acts.
-
Psychosocial functioning, assessed by, for example, the Global Assessment Scale (GAS; Endicott 1976), the Global Assessment of Functioning Scale (GAF; APA 1987) or the Social Functioning Questionnaire (SFQ; Tyrer 2005).
Secondary outcomes
-
Anger, assessed by, for example, the Hostility subscale of the Symptom Checklist ‐ 90 ‐ Revised (SCL‐90‐R; Derogatis 1994) or the State‐Trait Anger Expression Inventory (STAXI; Spielberger 1988).
-
Affective instability, assessed by, for example, the relevant item or subscale on the Zan‐BPD (Zanarini 2003a), CGI‐BPD (Perez 2007) or BPDSI‐IV (Arntz 2003).
-
Chronic feelings of emptiness, assessed by, for example, the relevant item or subscale on the Zan‐BPD (Zanarini 2003a), CGI‐BPD (Perez 2007) or BPDSI‐IV (Arntz 2003).
-
Impulsivity, assessed by, for example, the Barrett Impulsiveness Scale (BIS; Barrett 1995), or the Anger, Irritability and Assault Questionnaire (AIAQ; Coccaro 1991).
-
Interpersonal problems, assessed by, for example, the Inventory of Interpersonal Problems (IIP; Horowitz 1988), or the relevant item or subscale on the Zan‐BPD (Zanarini 2003a), CGI‐BPD (Perez 2007), BPDSI‐IV (Arntz 2003), or SCL‐90‐R (Derogatis 1994).
-
Abandonment, assessed by, for example, the relevant item or subscale on the Zan‐BPD (Zanarini 2003a), CGI‐BPD (Perez 2007) or BPDSI‐IV (Arntz 2003).
-
Identity disturbance, assessed by, for example, the relevant item or subscale on the Zan‐BPD (Zanarini 2003a), CGI‐BPD (Perez 2007) or BPDSI‐IV (Arntz 2003).
-
Dissociation and psychotic‐like symptoms, assessed by, for example, the Dissociative Experience Scale (DES; Bernstein 1986), or the Brief Psychiatric Rating Scale (BPRS; Overall 1962).
-
Depression, assessed by, for example, the Beck Depression Inventory (BDI; Beck 1961) or the Montgomery Åsberg Depression Rating Scale (MADRS; Montgomery 1979).
-
Attrition, in terms of participants lost after randomisation in each group.
-
Adverse effects, measured by the use of standardised psychometric rating scales, such as the Systematic Assessment for Treatment Emergent Events (SAFTEE; Levine 1986), or by laboratory values or spontaneous reporting. We defined adverse effects as unfavourable outcomes that occurred during or after psychotherapy but that were not necessarily caused by it (see Chapter 19 in the Cochrane Handbook for Systematic Reviews of Interventions; Peryer 2019. We divided any reported adverse effects into severe and non‐severe, according to the International Committee of Harmonization guidelines (ICH 1996). We defined serious adverse effects as any event that led to death, was life‐threatening, required inpatient hospitalisation or prolongation of existing hospitalisation, resulted in persistent or significant disability, or any important medical event that may have jeopardised the participant’s health or required intervention to prevent one of the aforementioned outcomes occurring. We considered all other adverse effects to be non‐serious.
Search methods for identification of studies
Electronic searches
We searched the electronic databases and trials registers listed below up to March 2019.
-
Cochrane Central Register of Controlled trials (CENTRAL; 2019, Issue 3), in the Cochrane Library, which includes the Cochrane Developmental, Psychosocial and Learning Problems Specialised Register (searched 20 March 2019).
-
MEDLINE Ovid (1948 to 20 March 2019).
-
Embase Ovid (1980 to 20 March 2019).
-
CINAHL EBSCOhost (Cumulative Index to Nursing and Allied Health Literature; 1980 to 20 March 2019).
-
PsycINFO Ovid (1806 to 20 March 2019).
-
ERIC EBSCOhost (Education Resources Information Center; 1966 to 20 March 2019).
-
BIOSIS Previews Web of Science Clarivate Analytics (1969 to 20 March 2019).
-
Web of Science Core Collection Clarivate Analytics (1900 to 20 March 2019).
-
Sociological Abstracts ProQuest (1952 to 20 March 2019).
-
LILACS (Latin American and Caribbean Health Science Information database; lilacs.bvsalud.org/en; searched 20 August 2019).
-
OpenGrey (www.opengrey.eu; searched 20 August 2019).
-
Library Hub Discover,previously COPAC (Library Hub Discover; searched 20 August 2019).
-
ProQuest Dissertations and Theses A&I (1743 to 20 March 2019).
-
DART Europe E‐Theses Portal (www.dart-europe.eu/basic-search.php; searched 20 August 2019).
-
Networked Digital Library of Theses and Dissertations (NDLTD; www.ndltd.org; searched 20 August 2019).
-
Australian New Zealand Clinical trials Registry (ANZCTR; www.anzctr.org.au/BasicSearch.aspx; searched 20 August 2019).
-
Clinicaltrials.gov (clinicaltrials.gov; searched 20 March 2019).
-
EU Clinical trials Register (www.clinicaltrialsregister.eu/ctr-search/search; searched 20 August 2019).
-
ISRCTN Registry (www.isrctn.com; searched 20 August 2019).
-
Be Part of research (www.ukctg.nihr.ac.uk/#popoverSearchDivId; searched 20 August 2019).
-
WHO International Clinical trials Registry Platform (ICTRP; who.int/ictrp/en; searched 20 March 2019).
The search strategies for all databases can be found in Appendix 3. We did not limit our searches by language, year of publication, or type of publication. We sought translation of the relevant sections of non‐English language articles.
Searching other resources
We handsearched relevant journals, including: Journal of Personality Disorders; American Journal of Psychiatry; JAMA Psychiatry; British Journal of Psychiatry; ACTA Psychiatrica Scandinavica; Journal of the American Academy of Child and Adolescent Psychiatry; Personality Disorders: Theory, Research and Treatment; and Journal of Clinical Psychiatry. Additionally, we emailed researchers working in the field, to ask for unpublished data. We also checked abstracts of key conferences for BPD (congresses of the European and the International Society for the Study of Personality Disorders; ESSPD and ISSPD, respectively) and asked for any relevant unpublished data. We traced cross‐references from relevant literature. On 13 December 2019, we ran searches to make sure that none of our included trials had been retracted due to error or fraud. In the next update of this review, we will handsearch additional journal titles for relevant trials, (see Differences between protocol and review).
Data collection and analysis
We conducted this review in accordance with the guidelines set out in the Cochrane Handbook for Systematic Reviews of Interventions (Higgins 2019), and performed analyses using the latest version of Review Manager 5 (RevMan 5), Cochrane's statistical software (Review Manager 2014).
We report only the methods used in successive sections below. Planned but unused methods can be found in the protocol, Storebø 2018, and additional Table 1.
| Section | Protocol (Storebø 2018) | Review |
|---|---|---|
| Unit of analysis issues | Cross‐over trials We would have included cross‐over trials. We planned to include data up to the point of first cross‐over (first period only; Curtin 2002). We did not intend to use data from subsequent periods due to the likelihood of carry‐over effects from the preceding treatment(s). We planned not to combine repeated participant interventions in one meta‐analysis. | We did not include any cross‐over trial. |
| Cluster‐randomised trials Had trials used cluster randomisation, we would have anticipated that investigators would have presented their results after appropriately controlling for clustering effects (robust standard errors or hierarchical linear models). If it had been unclear whether a cluster‐randomised trial had used appropriate controls for clustering, we would have contacted the investigators for further information. We would have requested and re‐analysed individual patient data using multilevel models that controlled for clustering, if appropriate controls had not been used. Following this, we would have analysed effect sizes and standard errors in RevMan 5 (Review Manager 2014), using the generic inverse method (Higgins 2011). If there had been insufficient information to control for clustering, we would have entered outcome data using individuals as the units of analysis, and then conducted a sensitivity analysis to assess the potential biasing effects of inadequately controlled cluster‐randomised trials (Donner 2002). If individual participant data had not been available, we would have looked for information on intra‐class correlation coefficients to adjust for the potential clustering effects. | We did not include any cluster‐randomised trial. | |
| Adjustment for multiplicity We planned to adjust the P values and CIs for multiplicity due to the many secondary outcome comparisons following the method described by Jakobsen 2014. | We only adjusted the primary outcomes and one secondary outcomes for multiplicity, i.e. those outcomes presented in the SoF table. | |
| Dealing with missing data | Had dichotomous data not been presented on the basis of ITT data, we would have added the number of participants lost in each group to the participants with unfavourable results, acting on the assumption that most people with BPD do not get lost at random. | We were unable to perform this analysis due to insufficient information |
| Subgroup analysis and investigation of heterogeneity | We intended to conduct subgroup analyses to make hypotheses about the subgroups mentioned below.
| We did not conduct these preplanned analyses because of lack of data. |
| Sensitivity analysis | We intended to assess the impact of heterogeneity on the overall pooled effect estimate by removing studies ('outliers') that contributed to heterogeneity. We intended to remove outliers one by one and assess the impact on the overall outcome.
| We were not able to perform these analyses, due to a lack of sufficient data. |
| TSA | We intended to calculate post hoc, low bias, risk diversity‐adjusted required information size TSA analyses for the primary outcomes. | We were not able to perform these analyses with low risk of bias trials. |
BPD: borderline personality disorder; CI: confidence interval;ITT: intention to treat; TAU: treatment‐as‐usual
Selection of studies
Twelve review authors (OJS, JMSW, BAV, JTM, HEC, AT, CPS, MTK, SSN, MLK, MSJ, EF) worked in six pairs and independently screened titles and abstracts of all records retrieved by the searches. For any record that could have been an eligible RCT, we obtained the full‐text report and assessed it for eligibility against the inclusion criteria (see Criteria for considering studies for this review). During all stages of study selection, we resolved uncertainty or disagreement by consensus. When agreement could not be reached, the review authors discussed disagreements and consulted a third review author (KL, OJS, JMSW or ES).
We list apparently relevant RCTs that did not fulfil the inclusion criteria, along with reasons for their exclusion, in the Characteristics of excluded studies tables. We used Covidence software to keep track of appraised trials and decisions. To ensure transparency of study selection, we provided flow charts according to the QUOROM statement, showing how many records have been excluded for a certain reason (Moher 1999).
Data extraction and management
We developed data extraction forms to facilitate standardisation of data extraction. The form was piloted by OJS, SSN, MTK.
Working in pairs, all review authors extracted data independently using the data collection form to ensure accuracy. We resolved disagreements by discussion or by using an arbiter (ES), if required.
OJS, HEC, AT, EF, and JMSW entered data into RevMan 5 (Review Manager 2014). After all data had been entered, another reviewer (JMSW, OJS) re‐checked the data for completeness and accuracy, to make sure the data were complete, correct and appropriately categorised. Any entered data were verified against the original publication, and we updated the list of outcomes (Appendix 4), if necessary.
Assessment of risk of bias in included studies
Using Cochrane's tool for assessing risk of bias (Higgins 2011), all review authors assessed the risk of bias in each included trial across the following domains: random sequence generation; allocation concealment; blinding of outcome assessment; incomplete outcome data, selective outcome reporting; and other potential sources of bias. Data extractors independently assigned each trial to one of three categories (low risk of bias, unclear (uncertain) risk of bias or high risk of bias), according to guidelines provided in the Cochrane Handbook for Systematic Reviews of Interventions (Higgins 2011), using the criteria set out in Appendix 5. We called upon a third review author (ES) to resolve any ongoing disagreements, when needed.
Considering bias due to a lack of blinding is undoubtedly of importance, but it remains unclear how best to deal with this issue in research practice (Boutron 2008). We decided not to judge the likelihood of detection bias due to inadequate blinding of participants and personnel, as it is almost impossible to blind therapists and people receiving treatment in psychological therapy outcome research. However, we assessed the likelihood of detection bias due to inadequate blinding of outcome assessors.
In accordance with Cochrane’s guidelines (Higgins 2011), we also included other potential sources of bias as a final bias component. Here, we included: the likelihood of performance bias due to inadequate treatment adherence; the likelihood of bias due to different amounts of attention given to the treatment groups (attention bias); and other potential sources of bias, such as allegiance bias. We defined allegiance bias as a therapist’s personal belief both in the superiority and the efficacy of a particular treatment. This belief can be based on an education in that particular treatment. This bias is especially strong if the inventor of a treatment is investigating the effects of the particular treatment he/she has invented.
We considered trials with one or more unclear or high risk of bias domains as trials at high risk of bias overall, due to the risk of overestimating beneficial effects and underestimating harmful effects in RCTs with unclear or inadequate methodological quality (Kjaergard 2001; Lundh 2012; Moher 1998; Savović 2012a; Savović 2012b; Schulz 1995; Wood 2008). We defined trials with a low risk of bias in all domains to be at low risk of bias overall.
Measures of treatment effect
Continuous data
For continuous data, we compared the mean score between the two groups to give a mean difference (MD) and presented this with 95% confidence intervals (CIs). We used the overall MD, where possible, to combine the same outcome measures from trials. If two or more different instruments were used to measure the same construct, we reported the effect sizes as standardised mean differences (SMD) in the meta‐analysis. We calculated SMDs on the basis of post‐treatment results and, in separate analyses, follow‐up data. We grouped follow‐up data in six‐month intervals (zero to six months, six to 12 months and 12 months and over). Where the direction of a scale was opposite to most of the other scales, we multiplied the corresponding mean values by −1 to ensure adjusted values. If the trials did not report means and standard deviations (SDs) but reported other values like t‐tests and P values, we tried to transform these into SDs.
To identify the minimum relevant clinical difference (MIREDIF), we transformed the SMD to MD, using the scale with the best validity and reliability for the given outcome. For the analyses of the four primary outcomes in the comparison of psychotherapy versus TAU, we transformed SMDs into MDs on the following scales, to assess whether results exceeded the MIREDIF: ZAN‐BPD Scale, Delibarate Self‐Harm Inventory (DSHI), Suicidal Attempt Self Injury Interview (SASII), Global Assessment of Functioning (GAF), and the Hamilton Depression scale. We identified a MIREDIF of −3.0 points on the ZAN‐BPD, ranging from 0 to 36 points, based on a trial by Crawford 2018a; a MIREDIF of −1.25 points on the DSHI, ranging from 0 to 34 points, which corresponds to ½ SD based on a trial by Farivar 2004; a MIREDIF of −0.17 points on the Suicidal Attempt Self Injury Interview, ranging from 0 to 4 points, which corresponds to ½ SD based on a trial by Farivar 2004; and a MIREDIF of −4.0 on the GAF scale, ranging from 0 to 100, based on a trial by Amri 2014. The MIREDIF of the Hamilton Depression scale is 3.0 points (NICE CG90). For other outcomes, we provided an interpretation of the effect size using Cohen's D, considering 0.2 as a small effect, 0.5 as a medium effect size, and 0.8 as a large effect size (Cohen 1988).
Dichotomous data
We summarised dichotomous data as risk ratios (RRs) with 95% CIs. The RR is the ratio of the risk of an event in the two groups. We decided to use the RR as it may be easier to interpret than odds ratios (ORs).
Unit of analysis issues
Repeated observations
We calculated trial estimates on the basis of post‐treatment group results. We conducted separate analyses for data from different points of measurement (i.e. post‐treatment, follow‐up data of 0‐ to 6‐month, 6‐ to 12‐month, and above 12‐month intervals, where we used the last measurement within these intervals). If a trial reported data at both 7‐month and 11‐month follow‐up periods, we included both; however, we categorised cases like the 11‐month follow‐up as above 12‐month follow‐up. We did not use interim observations (Thalheimer 2002).
Adjustment for multiplicity
Multiplicity reflects the concern that performing multiple comparisons increases the risk of falsely rejecting the null hypothesis. Multiplicity, therefore, may affect the results found within a systematic review and, as a result, needs to be adjusted for. We adjusted the P values and CIs of the primary outcomes and one secondary outcome (depression) for multiplicity using the method described by (Jakobsen 2014).
Dealing with missing data
We tried to obtain any missing data, including incomplete outcome data, by contacting trial authors. We report this information in the 'Risk of bias' tables.
We evaluated the methods used to handle the missing data in the publications and to what extent it was likely that the missing data had influenced the results of outcomes of interest. We calculated effect sizes on the basis of intention‐to‐treat data, if that was possible. If only available case analysis data were reported, we calculated effect sizes on this basis.
We consulted a statistician if data were not reported in an immediately usable way and if data required processing before being analysed. We assessed results derived from statistically processed data in sensitivity analyses. See Sensitivity analysis.
Assessment of heterogeneity
We assessed trials for clinical homogeneity with respect to type of therapy, therapy setting and control group. We evaluated methodological heterogeneity by comparing the designs of trials. For any trials judged as homogeneous and adequate for pooling, we investigated statistical heterogeneity by both visual inspection of the graphs and the I2 statistic (Higgins 2003). We considered I2 values between 0% and 40% as indication of little heterogeneity, between 30% and 60% as indication of moderate heterogeneity, between 50% and 90% as indication of substantial heterogeneity, and between 75% and 100% as indication of considerable heterogeneity (Higgins 2019). Along with the size of the I2 scores, we also took into account the P value, CI and the overall number of included trials in the respective analysis when interpreting the values (Deeks 2019).
Assessment of reporting biases
We drew funnel plots (estimated differences in treatment effects against their standard error) and performed Egger's statistical test for small‐study effects for the primary outcomes; asymmetry in the funnel plot could be due to publication bias or could indicate genuine heterogeneity between small and large trials (Higgins 2019). It is important to assess the funnel axis in the funnel plot as a significant Egger's test could also indicate publication bias or be due to genuine small treatment effects. We did not visually inspect the funnel plot if fewer than 10 trials were included in the meta‐analysis, in accordance with the recommendations of the Cochrane Handbook for Systematic Reviews of Interventions (Higgins 2019; Egger 1997; Sterne 2017).
Data synthesis
We performed the statistical analyses in accordance with the recommendations in the latest version of the Cochrane Handbook for Systematic Reviews of Interventions (Higgins 2019).
In carrying out meta‐analyses, we used the inverse‐variance method, to give more weight to more precise estimates from trials with less variance (mostly larger trials). This minimises the imprecision of the pooled effect estimate, and is a common and simple approach to conducting meta‐analyses (Higgins 2019). We used the random‐effects model for our meta‐analyses, since we expected some degree of clinical heterogeneity to be present in most cases, though not too substantial to prevent pooling in principle. Where only one trial was included in an analysis, we used the fixed‐effect model, and where different models led to different results (Sensitivity analysis), we reported the results of both models.
For trials with a high level of statistical heterogeneity, and where the amount of clinical heterogeneity made it inappropriate to use these trials in meta‐analyses, we provide a narrative description of the trial results. If data pooling seemed feasible, we pooled the primary trials' effects and calculated their 95% CIs.
If a trial reported data for a particular outcome using two or more assessment instruments (e.g. several questionnaires for the assessment of depression), we selected the one used most often in the whole pool of included trials for effect size calculation, in order to minimise heterogeneity of outcomes in form and content. If a trial reported data of two assessment instruments that were equally frequently used, two review authors discussed the issue and chose the one that was, in its content, the most appropriate for the assessment of people affected by BPD.
We divided the doses and the controls into the different comparisons, ensuring that the treatment comparisons were comparable and homogeneous.
We have two main overarching comparisons. In the first comparison, we pooled all of the different types of psychotherapy together and compared them with the different types of TAU pooled together. In the second comparison, we pooled all of the different types of psychotherapy and compared them with waiting list or no treatment. Within in each comparison, we broke down the interventions by therapeutic category compared with different types of TAU, waiting list, no treatment or with another psychotherapy (active control).
Subgroup analysis and investigation of heterogeneity
We conducted the following prespecified subgroup analyses for two primary outcomes (BPD symptom severity and psychosocial functioning), where data were sufficient, in order to make hypotheses.
-
Therapeutic approaches: specific therapies versus each other (only analyses with two or more trials were included in this subgroup)
-
Age: mean age of 15 to 18 years versus older than 18 years
-
Duration: less than six months versus six to 12 months versus over 12 months
-
Mode of therapy: individual therapy versus group therapy and with the combination of individual and group therapy
-
Setting: inpatient versus outpatient and the combination of inpatient and outpatient
In addition, we added the following four subgroup analyses post hoc, for the primary outcomes of BPD symptom severity and psychosocial functioning.
-
Type of raters: self‐rated versus clinician‐rated
-
Types of TAU: obligatory TAU versus unspecified TAU
-
Type of comparison group: trials comparing psychotherapy plus TAU versus trials comparing psychotherapy with waiting list or no treatment
-
Types of scales: different measuring scales versus each other
Trial Sequential Analysis
Trial Sequential Analysis (TSA) is a methodology that combines a required information size (RIS) calculation for a meta‐analysis with the threshold for statistical significance (Brok 2008; Brok 2009; Thorlund 2009; Wetterslev 2008). TSA is a tool for quantifying the statistical reliability of the data in a cumulative meta‐analysis, adjusting P values for sparse data and for repetitive testing on accumulating data (Brok 2008; Brok 2009; Thorlund 2009; Wetterslev 2008).
Comparable to the a priori sample size estimation in a single randomised trial, a meta‐analysis should include an RIS calculation at least as large as the sample size of an adequately powered single trial to reduce the risk of random error. TSA calculates the RIS in a meta‐analysis and provides an alpha‐spending boundary to adjust the significance level for sparse data and repetitive testing on accumulating data (CTU 2011; Wetterslev 2008); hence, the risk of random error can be assessed. Multiple analyses of accumulating data when new trials emerge leads to repeated significant testing and introduces multiplicity. Thus, use of a conventional P value is prone to exacerbate the risk of random error (Berkey 1996; Lau 1995). Meta‐analyses not reaching the RIS are analysed with trial sequential alpha‐spending monitoring boundaries analogous to interim monitoring boundaries in a single trial (Wetterslev 2008). This approach will be crucial in coming updates of the review.
If a TSA does not reveal significant findings (no crossing of the alpha‐spending boundary and no crossing of the conventional boundary of P = 0.05) before the RIS has been reached, then the conclusion should either be that more trials are needed to reject or accept an intervention effect that was used for calculation of the required sample size or — in case the cumulated Z‐curve enters the futility area — the anticipated effect can be rejected.
We used a MIREDIF from studies defining this or, where we could not find this, we used an assumption that the minimal relevant clinical intervention effect was approximately ½ SD on the used scale, which can be used as a MIREDIF (Norman 2003).
We calculated the diversity‐adjusted required information size (DARIS; that is the number of participants required to detect or reject a specific intervention effect in a meta‐analysis), and performed a TSA for the primary outcomes at the end of treatment for the main comparison versus TAU, based on the following a priori assumptions:
-
the SD of the primary outcomes;
-
an anticipated MIREDIF defined in a trial reporting on this or we used a ½ SD on the used scale;
-
a maximum type I error of 2.0% (due to four primary outcomes; Jakobsen 2014);
-
a maximum type II error of 10% (minimum 90% power; Castellini 2018); and
-
the diversity observed in the meta‐analysis.
We furthermore performed a TSA for the three secondary outcomes (for the main comparison versus TAU) not closely connected to the BPD core symptoms (depression, attrition and adverse effects) based on the following priori assumptions:
-
the SD of the primary outcomes;
-
an anticipated MIREDIF defined in a trial reporting on this or we used a ½ SD on the used scale;
-
a maximum type I error of 0.8% (due to 11 secondary outcomes; Jakobsen 2014);
-
a maximum type II error of 10% (minimum 90% power; Castellini 2018); and
-
the diversity observed in the meta‐analysis.
We only performed a TSA for depression as this was the only significant finding.
Sensitivity analysis
We conducted sensitivity analyses to determine whether findings were sensitive to:
-
imprecision, as assessed by GRADE, by conducting TSA analyses on all primary outcomes and for the three secondary outcomes (for the main comparison versus TAU) not closely connected to the BPD core symptoms (depression, attrition and adverse effects) with significant findings.
-
random‐effects or fixed‐effect models.
Summary of findings and assessment of the certainty of the evidence
We used the GRADE approach to construct 'Summary of findings' tables in which to document the results of review outcomes. Two reviewers (HEC and JSW) , working independently, assessed the quality of the evidence. Any conflicts were resolved by consulting a third author (OJS). The GRADE approach appraises the quality of a body of evidence based on the extent to which one can be confident that an estimate of effect or association reflects the item being assessed. Considerations are due to: within‐trial risk of bias; directness of the evidence; heterogeneity of the data; precision of effect estimates; and risk of publication bias (Andrews 2013a; Andrews 2013b; Balshem 2011; Brunetti 2013; Guyatt 2011a; Guyatt 2011b; Guyatt 2011c; Guyatt 2011d; Guyatt 2011e; Guyatt 2011f; Guyatt 2011g; Guyatt 2013a; Guyatt 2013b; Guyatt 2013c; Mustafa 2013). When possible, we reported the MD or the RR, and we used TSA to rate imprecision (Jakobsen 2014). TSA can be used as a secondary analysis in Cochrane Reviews, to provide an additional interpretation of the data from a specific perspective, and can be used for testing imprecision (Thomas 2019).
We report the four primary outcomes (BPD severity, self‐harm, suicide‐related outcomes and psychosocial functioning) and three secondary outcomes not closely connected to the BPD core symptoms (depression, attrition and adverse effects) in 'Summary of findings' tables for our two main comparisons (Atkins 2004): psychotherapy versus treatment‐as‐usual (summary of findings Table 1); and psychotherapy versus waiting list or no treatment (summary of findings Table 2). We also created a third 'Summary of findings' table in which we report data from the DBT and MBT treatments with the highest numbers of primary trials, with DBT being the subject of roughly one‐third of all included trials, followed by MBT with seven RCTs. In this table, we report only the primary outcomes (see summary of findings Table 3).
Results
Description of studies
See Characteristics of included studies, Characteristics of excluded studies, Characteristics of studies awaiting classification and Characteristics of ongoing studies tables.
Results of the search
All electronic databases and search periods are listed in the Methods section (see Electronic searches). There were no language, date or document format restrictions. This current review is part of a series of reviews on interventions for BPD. Therefore, we used a very comprehensive search strategy, covering all psychotherapeutic or pharmacological treatment (or both) of BPD.
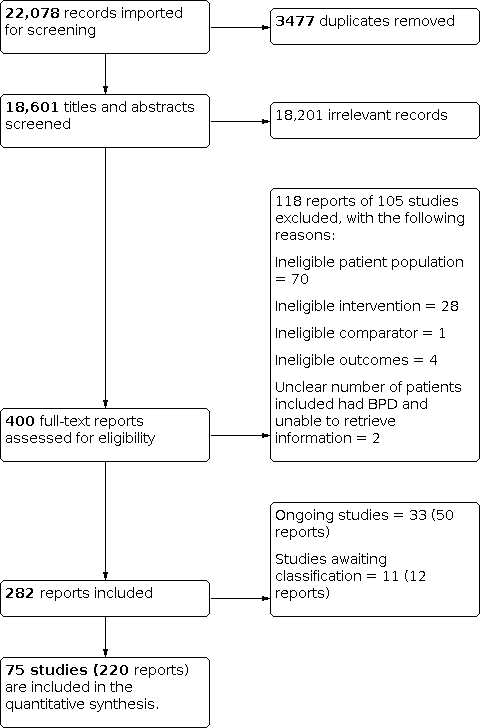
Altogether, the searches generated 22,078 records, of which 3477 were duplicates. Following screening of titles and abstracts, 400 citations merited closer inspection. An assessment of full texts for possible inclusion into this review led to the exclusion of 118 reports. This left 282 reports included. Of these, 50 reports referred to 33 different ongoing trials (see Ongoing studies). Another 12 reports related to 11 different trials that we were unable to classify definitively as included or excluded at this point of time, despite our best efforts to retrieve further information from the trial authors (see Studies awaiting classification). This finally left 220 reports relating to 75 different included trials (see Included studies, and Figure 1).
Study flow diagram
Included studies
Below, we summarise the key characteristics of the included trials. For information about which trials correspond to which characteristics for certain categories below, please see Table 2. Further detail can also be found in the Characteristics of included studies tables.
Design
We included 75 randomised, parallel‐arm trials.
Sample sizes
There was considerable variation in sample sizes between the trials, as the total number of participants with BPD ranged from 16 (Gleeson 2012) to 190 participants (McMain 2009). Five trials had a sample size of more than 100 participants (Table 2).
Setting
Sixty‐three trials were conducted in outpatient settings, five in inpatient settings, and seven in both inpatient and outpatient settings (see Table 2).
Participants
The 75 trials included a total of 4507 participants with BPD; the mean age ranged from 14.8 to 45.7 years. Seventeen trials included only female participants and two trials included only males (see Table 2). All remaining trials included participants of both genders, predominantly females.
Diagnostic criteria
Participants were diagnosed as having BPD according to DSM‐III, DSM‐III‐R, DSM‐IV, DSM‐IV‐TR, or ICD‐10 criteria (see Table 2). The diagnosis was confirmed by standardised means of assessment. The most frequently used assessment instruments were the Structured Clinical Interviews for DSM‐III‐R or DSM‐IV Axis II Personality Disorders (SCID‐II) (First 1997; Spitzer 1989) in 47 trials. Eleven trials applied the Diagnostic Interview for Borderline Personality Disorder patients (DIB; Gunderson 1981) or the Diagnostic Interview for Borderline Personality Disorder Patients ‐ revised (DIB‐R; Zanarini 1989). Six trials made use of the International Personality Disorder Examination (IPDE; Loranger 1995). All assessment instruments used in the included trials are listed in Table 2.
Participants exclusion criteria of primary studies
In 39 trials, people with evident mental impairment, organic brain disorder and neurological conditions were not eligible for participation. In addition, with the exception of Bos 2010 and Kredlow 2017a, schizophrenia, schizoaffective and other psychotic disorders were reasons for exclusion in all trials. Participants with substance abuse or dependence were not eligible for inclusion in 43 trials. Four trials included participants with alcohol or substance abuse/dependence (Davidson 2014; Gregory 2008b; Robinson 2016; Santisteban 2015). Comorbid personality disorders were not a reason for exclusion in 71 trials. Nine trials excluded participants with antisocial features or full antisocial personality disorders. See Table 2 for a list of the trials.
Interventions
Durations of interventions
The duration of the trials ranged from one month (Jahangard 2012) to 36 months (Giesen‐Bloo 2006). Thirty‐six trials had a duration of less than six months. Thirty‐two trials lasted between six months and 12 months. See Table 2.
Formats of interventions
Most of the trials applied individual treatment, with a total of 33 trials investigating the effects of individual therapy. Twenty‐two trials investigated the effects of group therapy whereas 16 trials assessed a combination of individual and group therapy (see Table 2).
Types of interventions
We included any defined, psychological intervention. The following provides a brief overview and description of the interventions investigated in the individual trials. For a more elaborate description, see the relevant references.
Dialectical behaviour therapy (DBT) and modified DBT‐related treatments (DBT; Linehan 1993a; Linehan 1993b). Twenty‐four trials investigated the effect of DBT and DBT‐related treatments (Bohus 2013; Bianchini 2019; Carter 2010; Elices 2016; Feigenbaum 2012; Feliu‐Soler 2017; Gratz 2014; Harned 2014; Kamalabadi 2012; Koons 2001a; Kramer 2016; Lin 2019; Linehan 1991; Linehan 1994; Linehan 2006; Linehan 2015a; McMain 2009; McMain 2017; Mohamadizadeh 2017; Priebe 2012; Soler 2009; Stanley 2017; Turner 2000; Van den Bosch 2005).
Cognitive behavioural therapy (CBT) and CBT‐ related treatments. Eleven trials investigated the effect of CBT and CBT‐related treatments (Bellino 2007; Cottraux 2009; Davidson 2006; Davidson 2014; Jahangard 2012; Kramer 2011; Kramer 2014; Kredlow 2017a; Kredlow 2017b; McMurran 2016; Schilling 2018).
Psychoeducation. One trial investigated a generic form of psychoeducation in which the first step (awareness of BPD) of the STEPPS programme was taught (Pascual 2015), and one trial included a once‐only workshop (Zanarini 2008).
Cognitive analytic therapy (CAT) and CAT‐related treatments. One trial investigated the effect of CAT (Gleeson 2012).
Psychodynamic psychotherapy and related treatments were investigated by three trials: psychic representation‐focused psychotherapy in Reneses 2013; psychoanalytic‐interactional therapy in Leichsenring 2016; and sequential brief Adlerian psychodynamic psychotherapy in Amianto 2011.
Dynamic deconstructive psychotherapy (DDP). One trial investigated the effect of DDP (Gregory 2008b).
Schema‐focused therapy (SFT) and SFT‐related treatments. Four trials investigated the effect of SFT and SFT‐related treatment (Farrell 2009; Giesen‐Bloo 2006; Mohamadizadeh 2017; Nadort 2009).
Acceptance and commitment therapy (ACT) employs mindfulness and acceptance strategies. One trial investigated the effect of ACT (Morton 2012).
Mentalisation‐based treatment (MBT) and MBT‐related treatments. Six trials investigated the effect of MBT and MBT‐related treatments (Bateman 1999; Bateman 2009; Jørgensen 2013; Philips 2018; Robinson 2016; Rossouw 2012b).
Interpersonal psychotherapy (IPT) and IPT‐related treatments. Four trials investigated the effect of IPT (Bellino 2006; Bellino 2007; Bellino 2010; Smith 2012).
Client‐centred therapy (CCT) and related treatments aim to encourage the patient to find solutions to their own problems and to help them decide how they need to change. Two trials investigated the effect of CCT (Cottraux 2009; Turner 2000).
Manual‐assisted cognitive treatment (MACT) is used to treat people who are acutely self‐harming. The treatment is structured around a self‐help book. Two trials investigated the effect of MACT (Morey 2010; Weinberg 2006).
Systems training for emotional predictability and problem‐solving for borderline personality disorder (STEPPS) is a seminar‐like, group treatment programme that combines cognitive‐behavioural elements and skills training. Two trials investigated the effect of STEPPS (Blum 2008; Bos 2010).
Eclectic treatments included art therapy (Haeyen 2018), abandonment psychotherapy and intensive community treatment (Andreoli 2016), a combination of individual SFT and group DBT (Leppänen 2016), combined inpatient and outpatient psychotherapy (Antonsen 2017), integrative BPD‐oriented adolescent family therapy (Santisteban 2015), joint crises plan (Borschmann 2013), web‐based psychoeducation (Zanarini 2018), and motivation feedback (Jochems 2015). Eight trials investigated eclectic treatments.
Concomitant treatment
Medication use was not allowed in three trials (Lin 2019; Mohamadizadeh 2017; Zanarini 2018). The majority of trials allowed participants to continue their respective drug treatments if initiated before the start of the trial (59 trials). Only four out of 75 RCTs gave the same medication to all participants (fluoxetine in the first three trials, selective serotonin reuptake inhibitors not further specified in the latter) (Bellino 2006; Bellino 2007; Bellino 2010; Jahangard 2012). One trial, Stanley 2017, included four treatment groups, which we integrated into two groups of DBT and supportive treatment. Fifty percent of each of these two groups additionally received either fluoxetine or placebo. Concomitant drug use was not specified in nine trials (Bianchini 2019; Carter 2010; Davidson 2014; Haeyen 2018; Kamalabadi 2012; Leppänen 2016; Philips 2018; Robinson 2016; Santisteban 2015). Two trials included medication‐free participants only (Lin 2019; Mohamadizadeh 2017; see Table 2).
Comparisons
The review includes 25 different comparisons.
Control interventions
The kinds of control interventions varied widely and included, for example, treatment‐as‐usual (TAU), waiting list, no treatment or an active treatment. The composition of the control interventions used in the individual trials differed as to whether TAU was obligatory or optional.
The majority of trials (42 trials) included a control intervention with an obligatory TAU. Thirteen trials included a control intervention with optional TAU. See Table 2.
Active treatment
Twenty‐two trials included an active head‐to‐head comparison.
-
Antonsen 2017: inpatient plus outpatient psychotherapy versus outpatient psychotherapy
-
Bellino 2007: cognitive therapy versus interpersonal therapy
-
Carmona í Farrés 2019: dialectical behaviour therapy (DBT) mindfulness versus DBT interpersonal effectiveness
-
Cottraux 2009: cognitive therapy versus client‐centred therapy (CCT)
-
Elices 2016: DBT mindfulness versus DBT interpersonal effectiveness
-
Feliu‐Soler 2017: DBT mindfulness versus loving‐kindness and compassion meditation
-
Giesen‐Bloo 2006: schema‐focused therapy (SFT) versus transference‐focused therapy
-
Harned 2014: standard DBT versus DBT prolonged exposure (PE)
-
Kramer 2011 and Kramer 2014: motive‐oriented therapeutic relationship (MOTR) versus general psychiatric management (GPM)
-
Kredlow 2017b: cognitive behavioural therapy (CBT) versus trauma‐related plus anxiety‐related psychoeducation
-
Lin 2019: DBT skills training versus cognitive therapy
-
Linehan 2015a: standard DBT versus DBT skills plus case management versus DBT individual therapy plus activity
-
McMain 2009: DBT versus general psychiatric management (GPM)
-
Mohamadizadeh 2017: DBT versus SFT
-
Morey 2010: manual‐assisted cognitive therapy (MACT) versus MACT plus therapeutic assessment (TA)
-
Nadort 2009: SFT versus SFT plus therapist telephone crisis support outside office hours
-
Pascual 2015: pseudoeducation versus neurocognitive rehabilitation group
-
Santisteban 2015: BPD‐oriented adolescent family therapy versus individual drug counselling
-
Schilling 2018: meta‐cognitive training for borderline personality disorder (B‐MCT) versus progressive muscle relaxation training (PMR)
-
Sinnaeve 2018: standard DBT (outpatient) versus step‐down DBT (combined inpatient and outpatient DBT)
-
Turner 2000: DBT versus CCT
-
Kramer 2016: DBT informed and individual treatment versus TAU
Outcomes
When several measures were available for the same outcome, we chose the measure that was used most often, in order to reduce heterogeneity of outcomes in form and content. Outcomes could be either self‐reported by people treated or observer‐rated by clinicians, with clinician‐rated outcomes being preferred. We included outcomes reported at the end of treatment and at ≥ six months follow‐up. trials used a variety of scales to assess both primary and secondary outcomes. The table of outcomes in Appendix 4 presents the list of scales used to assess the outcomes in the individual trials. The list refers to the measurement scales described in the original reports.
Adverse effects
Data on adverse effects were available from five trials (Andreoli 2016; Davidson 2014; McMurran 2016; Robinson 2016; Stanley 2017). Two more trials reported to have recorded adverse effects, but we could not use the data for effect size calculation, either because the final results were not reported (Pascual 2015) or it was unclear in which treatment group the events occurred (Leichsenring 2016). Adverse effects were either recorded as and when people reported them, or the exact method of assessment was not specified.
We categorised adverse effects as serious (life‐threatening, resulting in death or requiring inpatient hospitalisation; available from Andreoli 2016; Davidson 2014; McMurran 2016; Robinson 2016; Stanley 2017) or non‐serious (any other adverse effects; available from McMurran 2016; Stanley 2017).
Funding source
The majority of trials (k = 62) were funded by grants from universities, authorities or research foundations (see Table 2). Four trials reported that no funding was received (Bellino 2006; Bellino 2007; Bellino 2010; Jahangard 2012). The nine remaining trials did not specify funding (Andreoli 2016; Bianchini 2019; Carter 2010; Kamalabadi 2012; Koons 2001a; Leppänen 2016; Mohamadizadeh 2017; Morton 2012; Turner 2000).
Excluded studies
In total, we excluded 105 trials from 118 full‐text reports (see Characteristics of excluded studies tables). Of these, 70 trials included an ineligible patient population, 28 assessed ineligible interventions, 1 included an ineligible comparator, 2 had unclear numbers of participants with BPD included (we were unable to retrieve information), and 4 did not include any relevant outcomes (see Figure 1).
Studies awaiting classification
We included 11 trials as awaiting classification, of which we were unable to retrieve four trials, two of the trials were conference abstracts, two of the trials need to be translated, and three trials did not provide subsample data for people affected by BPD (see Characteristics of studies awaiting classification tables for an elaborated description). All trials investigated different types of psychotherapeutic treatments for people affected by BPD or individuals with PTSD or suicidal behaviour.
Three trials involved CBT treatments for BPD (Akbari 2009; Dorrepaal 2012; Johnson 2017) and five trials involved DBT treatments (Abdelkarim 2016; Cowperthwait 2017; McCauley 2018; Ostermeier 2017; Santamarina 2017). One trial apiece investigated ACT (Ducasse 2018), MBT (Einy 2018) and the STEPPS programme (Isaia 2017).
Three trials involved adolescents (Cowperthwait 2017; McCauley 2018; Santamarina 2017), whereas the rest involved adults.
Ongoing studies
We included 33 ongoing trials assessing different types of psychological interventions for the treatment of BPD, for which the outcome data are not yet available (see Characteristics of ongoing studies tables).
The majority of trials investigated the effect of CBT, DBT or related treatment for individuals with BPD displaying self‐harm or suicidal behaviour. More specifically, nine trials investigated DBT (ACTRN12612001187831; ACTRN12616000236493; NCT02134223; NCT02387736; NCT02517723; NCT02991586; NCT03191565; NCT03297840; NCT03833453), five trials investigated MBT (ACTRN12612000951853; NCT02068326; NCT02771691; NCT03677037; NL2168/NTR2292), three trials investigated cognitive behavioural treatments (DRKS00003605; ISRCTN21802136; NCT01531634), three trials investigated SFT (DRKS00011534; NL1144/NTR1186; NL2266/NTR2392), two trials investigated STEPPS programmes (NCT03092271; NL3856/NTR4016), two trials investigated self‐help or psychoeducation interventions (NCT03185026; NCT03376113), one investigated a meditation‐based treatment (NCT02125942), one investigated internet‐based treatment (NCT03418142), and one an emotional regulation treatment (NCT03011190). Five trials investigated other interventions like early interventions and general care (ACTRN12610000100099; NCT00603421; NCT01823120; NCT02685943; NCT02985047).
One trial investigated adolescents (NCT02771691) whereas the other trials investigated adults.
Risk of bias in included studies
Figure 2 and Figure 3 shows the review authors´ judgements concerning the risk of bias across the included trials and for each individual trial, respectively. Further information for the individual trials can be found in Characteristics of included studies tables.

Risk of bias graph: review authors' judgements about each risk of bias item presented as percentages across all included studies.

Risk of bias summary: review authors' judgements about each risk of bias item for each included study.
Allocation
Sequence generation
There is evidence that poor reporting of randomisation increases the odds of presenting significant outcomes (Chalmers 1983; Schulz 1995). The trials provided further information on how the randomisation sequence had been achieved, or that a stratification was used. We judged 56 trials, where a randomisation method was reported, as having low risk of bias (Amianto 2011; Andreoli 2016; Bateman 2009; Bellino 2006; Bellino 2007; Bellino 2010; Blum 2008; Bohus 2013; Borschmann 2013; Bos 2010; Carmona í Farrés 2019; Carter 2010; Cottraux 2009; Davidson 2006; Davidson 2014; Doering 2010; Elices 2016; Farrell 2009; Feigenbaum 2012; Giesen‐Bloo 2006; Gleeson 2012; Gratz 2006; Gregory 2008b; Harned 2014; Jahangard 2012; Jochems 2015; Kramer 2011; Kramer 2014; Kramer 2016; Kredlow 2017a; Kredlow 2017b; Laurenssen 2018; Leichsenring 2016; Leppänen 2016; Lin 2019; Linehan 1991; Linehan 1994; Linehan 2006; Linehan 2015a; McMain 2009; McMain 2017; McMurran 2016; Mehlum 2014; Morton 2012; Pascual 2015; Philips 2018; Priebe 2012; Reneses 2013; Robinson 2016; Rossouw 2012b; Santisteban 2015; Schuppert 2012; Sinnaeve 2018; Soler 2009; Van den Bosch 2005; Zanarini 2018). The 19 remaining trials did not describe exactly how treatment allocation had been achieved, so we rated these trials at unclear risk of bias (Antonsen 2017; Bateman 1999; Bianchini 2019; Feliu‐Soler 2017; Gratz 2014; Haeyen 2018; Jørgensen 2013; Kamalabadi 2012; Koons 2001a; Mohamadizadeh 2017; Morey 2010; Nadort 2009; Salzer 2014; Schilling 2018; Smith 2012; Stanley 2017; Turner 2000; Weinberg 2006; Zanarini 2008)
Allocation concealment
Thirty‐seven trials, reporting off‐site randomisation or notification of assignment by research coordinators not involved in delivering the therapy, were rated as having a low risk of bias (Amianto 2011; Andreoli 2016; Bateman 1999; Bateman 2009; Bellino 2006; Bellino 2007; Bohus 2013; Borschmann 2013; Bos 2010; Carmona í Farrés 2019; Carter 2010; Cottraux 2009; Davidson 2006; Doering 2010, Feigenbaum 2012; Giesen‐Bloo 2006; Gregory 2008b; Jahangard 2012; Jochems 2015; Kramer 2011; Kramer 2014; Kramer 2016; Kredlow 2017a; Kredlow 2017b; Laurenssen 2018; Leichsenring 2016; Linehan 2006; McMain 2009; McMain 2017; McMurran 2016; Mehlum 2014; Nadort 2009; Philips 2018; Priebe 2012; Rossouw 2012b; Schuppert 2012; Sinnaeve 2018). Thirty‐five trials that did not provide enough information to enable a judgement to be made about adequacy of allocation concealment were rated as having an unclear risk of bias (Antonsen 2017; Bellino 2010; Bianchini 2019; Blum 2008; Davidson 2014; Farrell 2009; Feliu‐Soler 2017; Gratz 2006; Gratz 2014; Haeyen 2018; Harned 2014; Jørgensen 2013; Kamalabadi 2012; Koons 2001a; Leppänen 2016; Lin 2019; Linehan 1991; Linehan 1994; Linehan 2015a; Mohamadizadeh 2017; Morey 2010; Pascual 2015; Reneses 2013; Robinson 2016; Salzer 2014; Santisteban 2015; Schilling 2018; Smith 2012; Soler 2009; Stanley 2017; Turner 2000; Van den Bosch 2005; Weinberg 2006; Zanarini 2008; Zanarini 2018). We rated three trials as being at high risk of bias due to explicit inadequate allocation concealment (Elices 2016; Gleeson 2012; Morton 2012). One example can be found in Gleeson 2012, where the following was stated: "Outcome ratings were made by the trial research assistant who was independent of the treatment, but not blind to treatment allocation because of limited resources" (quote). This could potentially have induced bias.
Blinding
The majority of trials (50 trials) reported that outcome assessors were kept blind to treatment allocation and, for this reason, were considered to be at low risk of bias (Amianto 2011; Andreoli 2016; Bateman 1999; Bateman 2009; Bellino 2006; Bellino 2007; Bellino 2010; Bianchini 2019; Bohus 2013; Borschmann 2013; Carmona í Farrés 2019; Carter 2010; Cottraux 2009; Davidson 2006; Davidson 2014: Doering 2010; Elices 2016; Giesen‐Bloo 2006; Gleeson 2012; Gratz 2006; Gratz 2014; Gregory 2008b; Harned 2014; Jahangard 2012; Jochems 2015; Koons 2001a; Kramer 2011; Kramer 2016; Kredlow 2017a; Kredlow 2017b; Laurenssen 2018; Leichsenring 2016; Leppänen 2016; Linehan 1991; Linehan 1994; Linehan 2006; Linehan 2015a; McMain 2009; McMain 2017; Mehlum 2014; Pascual 2015; Robinson 2016; Rossouw 2012b; Salzer 2014; Schuppert 2012; Soler 2009; Stanley 2017; Turner 2000; Van den Bosch 2005; Weinberg 2006). Fourteen trials did not have an adequate description of the blinding of the outcome assessors and thus were judged to be at unclear risk of bias (Antonsen 2017; Feigenbaum 2012; Feliu‐Soler 2017; Kamalabadi 2012; Kramer 2014; Lin 2019; Mohamadizadeh 2017; Morey 2010; Nadort 2009; Philips 2018; Priebe 2012; Reneses 2013; Schilling 2018; Zanarini 2008). Eleven trials reported inadequate blinding of outcome assessors and thus were considered to be at high risk of bias (Blum 2008; Bos 2010; Farrell 2009; Haeyen 2018; Jørgensen 2013; McMurran 2016; Morton 2012; Santisteban 2015; Sinnaeve 2018; Smith 2012; Zanarini 2018).
Incomplete outcome data
The majority of trials either did not adequately describe the possible reasons for missing data, and therefore were considered to be at unclear risk of bias (30 trials: Bianchini 2019; Blum 2008; Bohus 2013; Davidson 2014; Feliu‐Soler 2017; Jochems 2015; Kamalabadi 2012; Kramer 2016; Leichsenring 2016; Linehan 1991; Linehan 2015a; McMain 2009; Mohamadizadeh 2017; Morey 2010; Morton 2012; Nadort 2009; Pascual 2015; Priebe 2012; Reneses 2013; Robinson 2016; Santisteban 2015; Schilling 2018; Schuppert 2012; Smith 2012; Soler 2009; Stanley 2017; Turner 2000; Van den Bosch 2005; Weinberg 2006; Zanarini 2008), or did not explicitly address obvious missing data and therefore were considered to be at high risk of bias (26 trials: Andreoli 2016; Bateman 1999; Bellino 2006; Bellino 2007; Bellino 2010; Bos 2010; Carmona í Farrés 2019; Carter 2010; Cottraux 2009; Elices 2016; Farrell 2009; Feigenbaum 2012; Gleeson 2012; Gratz 2006; Gregory 2008b; Haeyen 2018; Jørgensen 2013; Koons 2001a; Kramer 2011; Kramer 2014; Laurenssen 2018; Leppänen 2016; Linehan 1994; Philips 2018; Rossouw 2012b; Sinnaeve 2018). Nineteen trials showed no indication of incomplete outcome reporting, and thus were considered to be at low risk of bias (Amianto 2011; Antonsen 2017; Bateman 2009; Borschmann 2013; Davidson 2006; Doering 2010; Giesen‐Bloo 2006; Gratz 2014; Harned 2014; Jahangard 2012; Kredlow 2017a; Kredlow 2017b; Lin 2019; Linehan 2006: McMain 2017; McMurran 2016; Mehlum 2014; Salzer 2014; Zanarini 2018).
Selective reporting
The majority of trials (39 trials) either did not have a published protocol prior to initiating the trials or did not provide sufficient information in the report to judge the extent of reporting bias. We considered these trials to be at unclear risk of bias (Bateman 1999; Bellino 2006; Bellino 2007; Bellino 2010; Bianchini 2019; Bos 2010; Carter 2010; Davidson 2014; Farrell 2009; Feigenbaum 2012; Feliu‐Soler 2017; Giesen‐Bloo 2006; Gratz 2006; Gratz 2014; Jahangard 2012; Jørgensen 2013; Kamalabadi 2012; Koons 2001a; Kramer 2016; Kredlow 2017a; Kredlow 2017b; Leppänen 2016; Linehan 1991; Linehan 1994; Linehan 2006; Mehlum 2014; Mohamadizadeh 2017; Morey 2010; Morton 2012; Pascual 2015; Priebe 2012; Reneses 2013; Salzer 2014; Santisteban 2015; Schilling 2018; Soler 2009; Turner 2000; Van den Bosch 2005; Zanarini 2008). Seventeen trials did not explicitly report data for prespecified outcomes even though they initially had planned to report them. We considered these trials to be at high risk of bias (Andreoli 2016; Antonsen 2017; Blum 2008; Gleeson 2012; Haeyen 2018; Kramer 2011; Kramer 2014; Laurenssen 2018; Leichsenring 2016; Lin 2019; Linehan 2015a; Philips 2018; Rossouw 2012b; Schuppert 2012; Sinnaeve 2018; Smith 2012; Zanarini 2018). We rated 19 trials at low risk of bias due to the fact that they had published a protocol or registered the trial before conducting the trial, and reported all prespecified outcomes (Amianto 2011; Bateman 2009; Bohus 2013; Borschmann 2013; Carmona í Farrés 2019; Cottraux 2009; Davidson 2006; Doering 2010; Elices 2016; Gregory 2008b; Harned 2014; Jochems 2015; McMain 2009; McMain 2017; McMurran 2016; Nadort 2009; Robinson 2016; Stanley 2017; Weinberg 2006).
Other potential sources of bias
Other sources of bias included insufficient treatment adherence, allegiance bias and attention bias. The total score for this outcome was based on the highest score of bias. A detailed description of which domains are critical for the individual trials can be found in the Characteristics of included studies tables.
Most trials (48 trials) exhibited high risk of bias in one or more of the assessed domains (Amianto 2011; Andreoli 2016; Antonsen 2017; Bateman 1999; Bateman 2009; Bellino 2006; Bellino 2010; Bianchini 2019; Blum 2008; Borschmann 2013; Bohus 2013; Bos 2010; Carter 2010; Davidson 2006; Davidson 2014; Farrell 2009; Feliu‐Soler 2017; Gratz 2006; Gratz 2014; Gregory 2008b; Haeyen 2018; Harned 2014; Jørgensen 2013; Kamalabadi 2012; Kramer 2011; Kramer 2014; Kredlow 2017a; Kredlow 2017b; Laurenssen 2018; Leichsenring 2016Leppänen 2016; Linehan 1994; Linehan 2006; Linehan 2015a; McMurran 2016; Mehlum 2014; Morton 2012; Pascual 2015; Philips 2018; Reneses 2013; Robinson 2016; Rossouw 2012b; Salzer 2014; Santisteban 2015; Schilling 2018; Schuppert 2012; Sinnaeve 2018; Smith 2012). Twenty‐two trials had at least one domain that was not adequately described in the trials and therefore were considered to be at unclear risk of bias (Doering 2010; Elices 2016; Feigenbaum 2012; Giesen‐Bloo 2006; Gleeson 2012; Jahangard 2012; Jochems 2015; Kramer 2016; Lin 2019; Linehan 1991; McMain 2009; McMain 2017; Mohamadizadeh 2017; Nadort 2009; Priebe 2012; Soler 2009; Stanley 2017; Turner 2000; Van den Bosch 2005; Weinberg 2006; Zanarini 2008; Zanarini 2018). Only five trials had an overall low risk of bias for all the domains assessed as other potential sources of bias (Bellino 2007; Carmona í Farrés 2019; Cottraux 2009; Koons 2001a; Morey 2010).
Effects of interventions
See: Summary of findings 1 Psychotherapy versus treatment‐as‐usual; Summary of findings 2 Psychotherapy versus waiting list or no treatment; Summary of findings 3 Dialectical behavioural therapy or mentalisation‐based therapy versus treatment‐as‐usual
We present the results for each of the primary and secondary outcomes connected to the 25 comparisons below. Where a meta‐analysis involved two or more different instruments to measure the same construct, we reported effect sizes as SMD, otherwise we reported the MD. To identify the MIREDIF, we transformed the SMD to MD for the scale with best validity and reliability for that outcome. For the analyses of the four primary outcomes in the comparison of psychotherapy versus TAU, we transformed the SMD into MD on the following scales, to assess whether results exceeded the minimum clinically important difference: ZAN BPD Scale, DSHI, Suicidal Attempt Self Injury Interview, GAF scale, and the Hamilton Depression scale.
We contacted the authors of 44 trials with unclear or missing data and requested the necessary information. Twenty‐four trial authors replied with answers (Amianto 2011; Bateman 1999; Bellino 2006; Blum 2008; Borschmann 2013; Carmona í Farrés 2019; Carter 2010; Doering 2010; Elices 2016; Farrell 2009; Gleeson 2012; Gratz 2006; Kredlow 2017a; Kredlow 2017b; Leppänen 2016; Mehlum 2014; Morton 2012; Priebe 2012; Robinson 2016; Salzer 2014; Schilling 2018; Sinnaeve 2018; Smith 2012; Soler 2009).
We performed TSA on all primary outcomes and for the secondary outcome depression.at end of treatment for the main comparison versus TSA in our 'Summary of findings' tables, adjusting for multiplicity and sparse data.
We considered all trials as being at high risk of bias overall. However, we used all eligible trials in the meta‐analyses, as the Cochrane Handbook for Systematic Reviews of Interventions recommends doing so when all trials are assigned the same risk of bias. We took account of our 'Risk of bias' assessment when considering the quality of the evidence using the GRADE approach, to ensure that judgements about risk of bias and other factors affecting the quality of the evidence were taken into account when interpreting the results of the review (Higgins 2011; Higgins 2019).
1. Psychotherapy versus treatment‐as‐usual (TAU)
Primary outcomes
1.1 BPD symptom severity (continuous)
Twenty‐three trials reported continuous data on BPD symptom severity (in total for all time points) (Amianto 2011; Blum 2008; Bateman 1999; Bos 2010; Doering 2010; Farrell 2009; Gratz 2006; Gratz 2014; Gregory 2008b; Jørgensen 2013; Koons 2001a; Kredlow 2017a; Laurenssen 2018; Leichsenring 2016; Leppänen 2016; Morton 2012; Philips 2018; Priebe 2012; Reneses 2013; Robinson 2016; Rossouw 2012b; Schuppert 2012; Soler 2009).
Generally, psychotherapy improved BPD symptom severity at end of treatment compared with TAU (SMD −0.52, 95% CI −0.70 to −0.33; 22 trials, 1244 participants; I2 = 57%; P < 0.001; Analysis 1.1.1; moderate‐quality evidence, summary of findings Table 1). This corresponds to a MD of −3.6 (95% CI −4.4 to ‐2.08) on the ZAN‐BPD scale, which ranges from 0 to 36. This represents a clinical relevant improvement in BPD symptoms. The MIREDIF on this scale is −3.0 points (Crawford 2018a). The TSA analysis showed that the RIS was reached (n = 907), and that there was no risk of type 1 error (TSA adjusted confidence interval −5.49 to −1.90) (see figure 4 in Appendix 6).
Inspection of the funnel plot (see figure 5 in Appendix 6) suggested potential bias (very small asymmetry), and we found evidence of possible significant publication bias: Egger’s regression intercept (bias) 2.234 (two tailed, P = 0.043). Analysis 1.1.1. might be more difficult to understand as we found asymmetry in the funnel plot and also a significant Egger's test. All effect estimates spread unequivocally at the left‐hand side of the zero line, clearly favouring experimental treatments over controls. However, identifying smaller sample size trials with insignificant results would be unlikely to change our pooled estimate substantially because these smaller trials would only contribute lesser weights to the pooled estimates. Hence, we concluded that our findings were not essentially influenced by publication bias.
Generally, psychotherapy did not reduce BPD symptom severity at zero to six months follow‐up compared with TAU (SMD −0.59, 95% CI −1.23 to 0.05; 2 trials, 41 participants; I2 = 0%; P = 0.17; Analysis 1.1.2).
Generally, psychotherapy did not reduce BPD symptom severity at six to 12 months follow‐up compared with TAU (SMD −0.04, 95% CI −0.36 to 0.27; 2 trials, 157 participants; I2 = 0%; P = 0.79; Analysis 1.1.3).
Generally, psychotherapy did not reduce BPD symptom severity at above 12 months follow‐up compared with TAU (SMD −0.94, 95% CI −2.58 to 0.70; 2 trials, 97 participants; I2 = 92%; P = 0.26; Analysis 1.1.4).
1.2 BPD symptom severity (dichotomous)
One trial reported dichotomous data on BPD symptom severity (Davidson 2006).
Generally, psychotherapy did not reduce BPD symptom severity at above 12 months follow‐up compared with TAU (RR 0.91, 95% CI 0.56 to 1.48; 1 trial, 76 participants; P = 0.71; Analysis 1.2).
No data were available for end of treatment, zero to six months and six to 12 months follow‐up.
1.3 Self‐harm (continuous)
Thirteen trials reported continuous data on self‐harm (Amianto 2011; Borschmann 2013; Carter 2010; Feigenbaum 2012; Gratz 2006; Gratz 2014; Koons 2001a; Linehan 1991; Linehan 2006; Philips 2018; Priebe 2012; Van den Bosch 2005; Weinberg 2006).
Generally, psychotherapy improved self‐harm at end of treatment compared with TAU (SMD −0.32, 95% CI −0.49 to −0.14; 13 trials, 616 participants; I2 = 16%; P = 0.0004; low‐quality evidence, summary of findings Table 1). This corresponds to a MD of −0.82 (95% CI −1.25 to 0.35), on the DSHI, which ranges from 0 to 34. The MIREDIF on this scale is −1.25 points, which corresponds to ½ SD (Farivar 2004). Clinically, this represents no clinically important reduction in self‐harm for people with BPD. The TSA analysis showed that the RIS was reached (n = 97). However, we cannot exclude the potential risk of type 1 error (TSA adjusted confidence interval −0.59 to −0.08) (see figure 6 in Appendix 6).
Inspection of the funnel plot (see figure 7 in Appendix 6) suggested no potential bias (asymmetry), and we found no evidence of possible significant publication bias: Egger’s regression intercept (bias) 1.524 (two tailed, P = 0.237).
Generally, psychotherapy did not reduce self‐harm at zero to six months follow‐up compared with TAU (SMD −0.52, 95% CI −1.28 to 0.23; 1 trial, 28 participants; P = 0.18; Analysis 1.3.2); MD −4.71, 95% CI −11.60 to 2.18; 1 trial, 28 participants; P = 0.18; Analysis 1.3.2).
Generally, psychotherapy did not reduce self‐harm at six to 12 months follow‐up compared with TAU (SMD −0.18, 95% CI −0.48 to 0.12; 3 trials, 174 participants; I2 = 0%; P = 0.64; Analysis 1.3.3).
No data were available for 12 months and over follow‐up.
1.4 Self‐harm (dichotomous)
Six trials reported dichotomous data on self‐harm (Bateman 1999; Bateman 2009; Bos 2010; Davidson 2006; Doering 2010; Rossouw 2012b).
Generally, psychotherapy did not reduce self‐harm at end of treatment compared with TAU (RR 0.85, 95% CI 0.63 to 1.14; 6 trials, 513 participants; I2 = 73%; P = 0.28; Analysis 1.4.1).
Generally, psychotherapy reduced self‐harm at zero to six months follow‐up compared with TAU (RR 0.14, 95% CI 0.04 to 0.56; 1 trial; P = 0.005; Analysis 1.4.2).
Generally, psychotherapy reduced self‐harm at six to 12 months follow‐up compared with TAU (RR 0.27, 95% CI 0.10 to 0.68; 1 trial; P = 0.006; Analysis 1.4.3).
Generally, psychotherapy reduced self‐harm at above 12 months follow‐up compared with TAU (RR 0.33, 95% CI 0.15 to 0.76; 1 trial, 41 participants; P = 0.009; Analysis 1.4.4).
1.5 Suicide‐related outcomes (continuous)
Thirteen trials reported continuous data on suicide‐related outcomes (Amianto 2011; Andreoli 2016; Davidson 2006; Feigenbaum 2012; Gleeson 2012; Gregory 2008b; Koons 2001a; Leppänen 2016; Linehan 2006; Mehlum 2014; Reneses 2013; Soler 2009; Weinberg 2006).
Generally, psychotherapy reduced suicide‐related outcomes at end of treatment compared with TAU (SMD −0.34, 95% CI −0.57 to −0.11; 13 trials, 666 participants; I2 = 43%; P = 0.004; Analysis 1.5.1; low‐quality evidence, summary of findings Table 1). The improvement corresponded to a clinical effect MD of −0.11 (95% CI −0.19 to −0.034), on the Suicidal Attempt Self Injury Interview. The MIREDIF on this scale is −0.17 points, which corresponds to ½ SD (Farivar 2004). Clinically, this represents no reduction in suicide‐related outcomes for people with BPD. The TSA analysis showed that the required information size was reached (n = 253). However, we cannot exclude the potential risk of type 1 error, and that there was no risk of type 1 error (TSA adjusted confidence interval −0.18 to −0.04) (see figure 8 in Appendix 6).
Inspection of the funnel plot (see figure 9 in Appendix 6) suggested potential bias (asymmetry), and we found no evidence of possible significant publication bias: Egger’s regression intercept (bias) 0.405 (two tailed, P = 0.735).
Generally, psychotherapy did not reduce suicide‐related outcomes at zero to six months follow‐up compared with TAU (SMD −0.43, 95% CI −1.10 to 0.23; 2 trials, 36 participants; I2 = 0%; P = 0.20; Analysis 1.5.2).
Generally, psychotherapy reduced suicide‐related outcomes at six to 12 months follow‐up compared with TAU (SMD −0.42, 95% CI −0.80 to −0.04; 2 trials, 109 participants; I2 = 0%; P = 0.03; Analysis 1.5.3).
Generally, psychotherapy did not reduce suicide‐related outcomes at above 12 months follow‐up compared with TAU (SMD −0.31, 95% CI −0.77 to 0.14; 1 trial, 76 participants; P = 0.18; MD −1.15, 95% CI −2.86 to 0.56; 1 trial, 76 participants; P = 0.19; Analysis 1.5.4).
1.6 Suicide‐related outcomes (dichotomous)
Five trials reported dichotomous data on suicide‐related outcomes (Bateman 1999; Bateman 2009; Doering 2010; Philips 2018; Stanley 2017).
Generally, psychotherapy reduced suicide‐related outcomes at end of treatment compared with TAU (RR 0.27, 95% CI 0.11 to 0.67; 5 trials, 396 participants; I2 = 45%; P = 0.005; Analysis 1.6.1).
Generally, psychotherapy did not reduce suicide‐related outcomes at zero to six months follow‐up compared with TAU (RR 0.25, 95% CI 0.06 to 1.05; 1 trial, 41 participants; P = 0.06; Analysis 1.6.2).
Generally, psychotherapy reduced suicide‐related outcomes at above 12 months follow‐up compared with TAU (RR 0.29, 95% CI 0.11 to 0.74; 1 trial, 41 participants; P = 0.01; Analysis 1.6.3).
No data were available for six to 12 months follow‐up.
1.7 Psychosocial functioning
Twenty‐two trials reported continuous data on psychosocial functioning (Amianto 2011; Andreoli 2016; Bateman 1999; Bateman 2009; Blum 2008; Borschmann 2013; Carter 2010; Davidson 2006; Doering 2010; Farrell 2009; Feigenbaum 2012; Gleeson 2012; Gratz 2014; Gregory 2008b; Jochems 2015; Jørgensen 2013; Kramer 2016; Linehan 1994; Mehlum 2014; Reneses 2013; Salzer 2014; Soler 2009).
Generally, psychotherapy improved psychosocial functioning at end of treatment compared with TAU (SMD −0.45, 95% CI −0.68 to −0.22; 22 trials, 1314 participants; I2 = 72%; P = 0.0001; Analysis 1.7.1; low‐quality evidence, summary of findings Table 1). This corresponds to a MD of −2.8 (95% CI −4.25 to −1.38), on the GAF scale, which ranges from 0 to 100. The MIREDIF on this scale is −4.0 points (Amri 2014). This finding does not represent a clinically important improvement in psychosocial functioning for people with BPD. The TSA analysis showed that the RIS was reached (n = 947), and that there was no risk of type 1 error (TSA adjusted confidence interval −3.97 to −1.94) (see figure 10 in Appendix 6).
Inspection of the funnel plot in (see figure 11 in Appendix 6) suggested potential bias (asymmetry), and we found no evidence of possible significant publication bias: Egger’s regression intercept (bias) 1.50 (two tailed, P = 0.241).
Generally, psychotherapy did not improve psychosocial functioning at zero to six months follow‐up compared with TAU (SMD −1.23, 95% CI −2.74 to 0.29; 1 trial, 9 participants; P = 0.11; MD −15.80, 95% CI −2.74 to 0.29; 1 trial, 9 participants; P = 0.11; Analysis 1.7.2).
Generally, psychotherapy did not improve psychosocial functioning at six to 12 months follow‐up compared with TAU (SMD −0.09, 95% CI −0.40 to 0.23; 3 trials, 247 participants; I2 = 30%; P = 0.59; Analysis 1.7.3).
Generally, psychotherapy did not improve psychosocial functioning at above 12 months follow‐up compared with TAU (SMD −0.27, 95% CI −0.60 to 0.05; 6 trials, 499 participants; I2 = 60%; P = 0.10; Analysis 1.7.4).
Secondary outcomes
1.8 Anger
Eight trials reported continuous data on anger (Amianto 2011; Feigenbaum 2012; Gleeson 2012; Koons 2001a; Leppänen 2016; Linehan 1994; Linehan 2006; Soler 2009)
Generally, psychotherapy reduced anger at end of treatment compared with TAU (SMD −0.38, 95% CI −0.64 to −0.12; 8 trials, 323 participants; I2 = 21%; P = 0.005; Analysis 1.8.1).
Generally, psychotherapy did not reduce anger at zero to six months follow‐up compared with TAU (SMD −1.20, 95% CI −2.82 to 0.41; 1 trial, 8 participants; P = 0.14; MD −4.50, 95% CI −9.01 to 0.01; 1 trial, 8 participants; P = 0.05; Analysis 1.8.2).
Generally, psychotherapy did not reduce anger at six to 12 months follow‐up compared with TAU (SMD −0.12, 95% CI −0.50 to 0.25; 2 trials, 111 participants; I2 = 0%; P = 0.52; Analysis 1.8.3).
Generally, psychotherapy did not reduce anger at above 12 months follow‐up compared with TAU (SMD 0.02, 95% CI −0.42 to 0.46; 1 trial, 80 participants; P = 0.93; MD 0.01, 95% CI −0.20 to 0.22; 1 trial, 80 participants; P = 0.93; Analysis 1.8.4).
1.9 Affective instability
Twelve trials reported continuous data on affective instability (Amianto 2011; Bianchini 2019; Blum 2008; Farrell 2009; Gratz 2006; Gratz 2014; Leppänen 2016; Morton 2012; Reneses 2013; Salzer 2014; Schuppert 2012; Soler 2009).
Generally, psychotherapy improved affective instability at end of treatment compared with TAU (SMD −0.68, 95% CI −0.98 to −0.39; 12 trials, 620 participants; I2 = 65%; P < 0.001; (Analysis 1.9.1).
Generally, psychotherapy did not improve affective instability at six to 12 months follow‐up compared with TAU (SMD −0.52, 95% CI −1.21 to 0.18; 1 trial, 33 participants; P = 0.15; MD −0.70, 95% CI −1.59 to 0.19; 1 trial, 33 participants; P = 0.12; Analysis 1.9.2).
No data were available for zero to six months and above 12 months follow‐up.
1.10 Chronic feelings of emptiness
Four trials reported continuous data on chronic feelings of emptiness (Amianto 2011; Leppänen 2016; Reneses 2013; Soler 2009).
Generally, psychotherapy improved chronic feelings of emptiness at end of treatment compared with TAU (SMD −0.39, 95% CI −0.69 to −0.10; 4 trials, 187 participants; I2 = 0%; P = 0.009; Analysis 1.10.1).
Generally, psychotherapy did not improve chronic feelings of emptiness at six to 12 months follow‐up compared with TAU (SMD −0.58, 95% CI −1.28 to 0.11; 1 trial, 37 participants; P = 0.10; MD −0.60, 95% CI −1.39 to 0.09; 1 trial, 33 participants; P = 0.09; Analysis 1.10.2).
No data were available for zero to six months and above 12 months follow‐up.
1.11 Impulsivity (continuous)
Ten studiies reported continuous data on impulsivity (Amianto 2011; Bianchini 2019; Blum 2008; Farrell 2009; Gratz 2006; Gratz 2014; Leppänen 2016; Reneses 2013; Soler 2009; Van den Bosch 2005).
Generally, psychotherapy improved impulsivity at end of treatment compared with TAU (SMD −0.54, 95% CI −0.84 to −0.25; 10 trials, 491 participants; I2 = 58%; P = 0.0003; Analysis 1.11.1).
Generally, psychotherapy did not improve impulsivity at six to 12 months follow‐up compared with TAU (SMD 0.32, 95% CI −0.13 to 0.77; 2 trials, 77 participants; I2 = 0%; P = 0.16; Analysis 1.11.2).
No data were available for zero to six months and above 12 months follow‐up.
1.12 Impulsivity (dichotomous)
One trial reported dichotomous data on impulsivity (Bos 2010).
Generally, psychotherapy did not improve impulsivity at end of treatment compared with TAU (RR 0.93, 95% CI 0.66 to 1.29; 1 trial, 58 participants; P = 0.65; Analysis 1.12).
No data were available for zero to six months, six to 12 months, and above 12 months follow‐up.
1.13 Interpersonal problems
Eighteen trials reported continuous data on interpersonal problems (Amianto 2011; Bateman 1999; Bateman 2009; Blum 2008; Bos 2010; Carter 2010; Davidson 2006; Farrell 2009; Gratz 2014; Jørgensen 2013; Kramer 2016; Laurenssen 2018; Leichsenring 2016; Leppänen 2016; Philips 2018; Reneses 2013; Salzer 2014; Soler 2009).
Generally, psychotherapy improved interpersonal problems at end of treatment compared with TAU (SMD −0.42, 95% CI −0.68 to −0.16; 18 trials, 1159 participants; I2 = 77%; P = 0.002; Analysis 1.13.1).
Generally, psychotherapy did not improve interpersonal problems at zero to six months follow‐up compared with TAU (SMD −0.41, 95% CI −1.01 to 0.20; 1 trial, 53 participants; P = 0.19; MD −0.30, 95% CI −0.76 to 0.16; 1 trial, 53 participants; P = 0.20; Analysis 1.13.2).
Generally, psychotherapy did not improve interpersonal problems at six to 12 months follow‐up compared with TAU (SMD −0.17, 95% CI −0.65 to 0.32; 1 trial, 132 participants; I2 = 39%; P = 0.50; Analysis 1.13.3).
Generally, psychotherapy did not improve interpersonal problems at above 12 months follow‐up compared with TAU (SMD 0.00, 95% CI −0.54 to 0.54; 2 trials, 172 participants; I2 = 65%; P = 1.00; Analysis 1.13.4).
1.14 Abandonment
Two trials reported continuous data on abandonment (Amianto 2011; Leppänen 2016).
Generally, psychotherapy did not improve abandonment at end of treatment compared with TAU (SMD −0.22, 95% CI −0.66 to 0.21; 2 trials, 84 participants; I2 = 0%; P = 0.32; Analysis 1.14.1).
Generally, psychotherapy did not improve abandonment at six to 12 months follow‐up compared with TAU (SMD −0.39, 95% CI −1.08 to 0.30; 1 trial, 33 participants; P = 0.27; MD ‐−0.39, 95% CI −1.08 to 0.30; 1 trial, 33 participants; P = 0.25; Analysis 1.14.2).
No data were available for zero to six months and above 12 months follow‐up.
1.15 Identity disturbance
Four trials reported continuous data on identity disturbance (Amianto 2011; Leichsenring 2016; Leppänen 2016; Reneses 2013).
Generally, psychotherapy did not improve identity disturbance at end of treatment compared with TAU (SMD −0.37, 95% CI −0.84 to 0.10; 4 trials, 250 participants; I2 = 65%; P = 0.12; Analysis 1.15.1).
Generally, psychotherapy improved identity disturbance at six to 12 months follow‐up compared with TAU (SMD −1.09, 95% CI −1.83 to −0.35; 1 trial, 33 participants; P = 0.004; MD −1.40, 95% CI −2.25 to −0.55; 1 trial, 33 participants; P = 0.001; Analysis 1.15.2).
No data were available for zero to six months and above 12 months follow‐up.
1.16 Dissociation and psychotic‐like symptoms
Six trials reported continuous data on dissociation and psychotic‐like symptoms (Amianto 2011; Blum 2008; Farrell 2009; Gleeson 2012; Gregory 2008b; Kredlow 2017a).
Generally, psychotherapy improved dissociation and psychotic‐like symptoms at end of treatment compared with TAU (SMD −0.47, 95% CI −0.85 to −0.10; 6 trials, 244 participants; I2 = 38%; P = 0.01; Analysis 1.16.1).
Generally, psychotherapy improved dissociation and psychotic‐like symptoms at zero to six months follow‐up compared with TAU (SMD 0.97, 95% CI −1.69 to −0.26; 2 trials, 35 participants; I2 = 0%; P = 0.008; Analysis 1.16.2).
Generally, psychotherapy did not improve dissociation and psychotic‐like symptoms at six to 12 months follow‐up compared with TAU (SMD −0.59, 95% CI −1.29 to 0.11; 1 trial, 33 participants; P = 0.10; MD −0.70, 95% CI −1.59 to 0.09; 1 trial, 33 participants; P = 0.08; Analysis 1.16.3).
Generally, psychotherapy did not improve dissociation and psychotic‐like symptoms at above 12 months follow‐up compared with TAU (SMD −0.01, 95% CI −0.81 to 0.79; 1 trial, 24 participants; P = 0.98; MD ‐−0.20, 95% CI −20.07 to 19.67; 1 trial, 24 participants; P = 0.98; Analysis 1.16.4).
1.17 Depression (continuous)
Twenty‐two trials reported continuous data on depression (Andreoli 2016; Bateman 1999; Bateman 2009; Blum 2008; Borschmann 2013; Davidson 2006; Davidson 2014; Doering 2010; Gleeson 2012; Gratz 2006; Gratz 2014; Gregory 2008b; Jahangard 2012; Jørgensen 2013; Kredlow 2017a; Laurenssen 2018; Leichsenring 2016; Leppänen 2016; McMurran 2016; Morton 2012; Reneses 2013; Zanarini 2018).
Generally, psychotherapy improved depression at end of treatment compared to TAU (SMD −0.39, 95% CI −0.61 to −0.17; 22 trials, 1568 participants; I2 = 75%; P = 0.0006; Analysis 1.17.1; very low‐quality evidence, summary of findings Table 1). This corresponds to −2.45 on the Hamilton Depression Scale. The MIREDIF on this scale is 3.0 points (NICE CG90). However, the TSA analysis showed that the RIS was not reached (n = 2274), and that there was a potential risk of type 1 error (TSA adjusted confidence interval −3.34 to −1.72) (see figure 12 in Appendix 6).
Generally, psychotherapy improved depression at zero to six months follow‐up compared with TAU (SMD −0.80, 95% CI −1.26 to −0.34; 4 trials, 125 participants; I2 = 23%; P = 0.0006; Analysis 1.17.2).
Generally, psychotherapy did not improve depression at six to 12 months follow‐up compared with TAU (SMD −0.40, 95% CI −0.95 to 0.16; 3 trials, 260 participants; I2 = 77%; P = 0.16; Analysis 1.17.3).
Generally, psychotherapy improved depression at above 12 months follow‐up compared with TAU (SMD −0.40, 95% CI ‐0.74 to −0.06; 5 trials, 311 participants; I2 = 47%; P = 0.02; Analysis 1.17.4).
1.18 Depression (dichotomous)
One trial reported dichotomous data on depression (Rossouw 2012b).
Generally, psychotherapy did not improve depression at end of treatment compared with TAU (RR 0.71, 95% CI 0.49 to 1.03; 1 trial, 80 participants; P = 0.08; Analysis 1.18).
No data were available for zero to six months, six to 12 months and above 12 months follow‐up.
1.19 Attrition
Thirty‐two trials reported dichotomous data on attrition (Amianto 2011; Andreoli 2016; Bateman 1999; Bateman 2009; Borschmann 2013; Bos 2010; Carter 2010; Davidson 2006; Doering 2010; Farrell 2009; Feigenbaum 2012; Gleeson 2012; Gratz 2006; Gratz 2014; Jørgensen 2013; Koons 2001a; Kramer 2016; Laurenssen 2018; Leichsenring 2016; Leppänen 2016; Linehan 1991; Linehan 1994; Linehan 2006; Morton 2012; Philips 2018; Priebe 2012; Reneses 2013; Robinson 2016; Rossouw 2012b; Stanley 2017; Van den Bosch 2005; Zanarini 2018).
Generally, psychotherapy did not reduce attrition at end of treatment compared with TAU (RR 1.00, 95% CI 0.83 to 1.20; 32 trials, 2225 participants; I2 = 50%; P = 0.98; Analysis 1.19.1; low‐quality evidence, summary of findings Table 1).
Generally, psychotherapy reduced attrition at zero to six months follow‐up compared with TAU (RR 0.58, 95% CI 0.34 to 1.00; 1 trial, 60 participants; P = 0.05; Analysis 19.2.2).
No data were available for six to 12 months and above 12 months follow‐up.
1.20 Non‐serious adverse effects
Two trials reported dichotomous data on non‐adverse effects (McMurran 2016; Stanley 2017).
There was no clear difference in the number of serious adverse effects between psychotherapy and TAU at end of treatment (RR 0.92, 95% CI 0.45 to 1.88; 2 trials, 381 participants, P = 0.81; Analysis 1.20.1; low‐quality evidence, summary of findings Table 1).
There was no clear difference in the number of adverse effects between psychotherapy and TAU at zero to six months follow‐up (RR 1.40, 95% CI 0.06 to 30.23; 1 trial, 20 participants; P = 0.83; Analysis 1.20.2).
TAU reduced adverse effects compared with psychotherapy at above 12 months follow‐up (RR 1.68, 95% CI 1.34 to 2.10; 1 trial, 183 participants; P < 0.001; Analysis 1.20.3).
No data were available for six to 12 months follow‐up.
1.21 Serious adverse effects
Five trials reported dichotomous data on serious adverse effects (Andreoli 2016; Davidson 2014; McMurran 2016; Robinson 2016; Stanley 2017).
There was no clear difference in the number of serious adverse effects between psychotherapy and TAU at end of treatment ( RR 0.86, 95% CI 0.14 to 5.09; 4 trials, 571 participants, I2 = 46%, P = 0.86; Analysis 1.21).
No data were available for zero to six months, six to 12 months and above 12 months.
2. Acceptance and commitment therapy (ACT) versus treatment‐as‐usual (TAU)
2.1 Primary outcome: BPD symptom severity
One trial reported continuous data on BPD symptom severity (Morton 2012).
ACT reduced BPD symptom severity at end of treatment compared with TAU (MD −14.66, 95% CI −21.85 to −7.47; 1 trial, 41 participants; P < 0.001; Analysis 2.1).
No data were available for zero to six months, six to 12 months and above 12 months follow‐up.
No data were available at any time point for self‐harm, suicide‐related outcomes, and psychosocial functioning.
Secondary outcomes
2.2 Affective instability
One trial reported continuous data on affective instability (Morton 2012).
ACT reduced affective instability at end of treatment compared with TAU (MD −27.00, 95% CI −38.86 to −15.14; 1 trial, 41 participants; P < 0.001; Analysis 2.2).
No data were available for zero to six months, six to 12 months and above 12 months follow‐up.
2.3 Depression
One trial reported continuous data on depression (Morton 2012).
ACT reduced depression at end of treatment compared with TAU (MD −8.33, 95% CI −15.65 to −1.01; 1 trial, 41 participants; P = 0.03; Analysis 2.3).
No data were available for zero to six months, six to 12 months and above 12 months follow‐up.
2.4 Attrition
One trial reported dichotomous data on attrition (Morton 2012).
ACT did not reduce attrition at end of treatment compared with TAU (RR 1.11, 95% CI 0.45 to 2.74; 1 trial, 41 participants; P = 0.82; Analysis 2.4).
No data were available for zero to months, six to 12 months and above 12 months follow‐up.
No data were available on any time point for anger, chronic feelings of emptiness, impulsivity, interpersonal problems, identity disturbance, dissociation and psychotic‐like symptoms and adverse effects.
3. Dialectical behaviour therapy (DBT) versus treatment‐as‐usual (TAU)
Primary outcomes
3.1 BPD symptom severity
Three trials reported continuous data on BPD symptom severity (Koons 2001a; Priebe 2012; Soler 2009).
DBT reduced BPD symptom severity at end of treatment compared with TAU (SMD −0.60, 95% CI −1.05 to −0.14; 3 trials, 149 participants; I2 = 42%; P = 0.01; Analysis 3.1; low‐quality evidence, summary of findings Table 3).
No data were available for zero to six months, six to 12 months and above 12 months follow‐up.
3.2 Self‐harm
Seven trials reported continuous data on self‐harm (Carter 2010; Feigenbaum 2012; Koons 2001a; Linehan 1991; Linehan 2006; Priebe 2012; Van den Bosch 2005).
DBT reduced self‐harm at end of treatment compared with TAU (SMD −0.28, 95% CI −0.48 to −0.07; 7 trials, 376 participants; I2 = 0%; P = 0.008; Analysis 3.2.1; low‐quality evidence, summary of findings Table 3).
DBT did not reduce self‐harm at six to 12 months follow‐up compared with TAU (SMD −0.26, 95% CI −0.59 to 0.07; 2 trials, 141 participants; I2 = 0%; P = 0.13; Analysis 3.2.2).
No data were available for zero to six months and above 12 months follow‐up.
3.3 Suicide‐related outcomes
Five trials reported continuous data on suicide‐related outcomes (Feigenbaum 2012; Koons 2001a; Linehan 2006; Mehlum 2014; Soler 2009).
DBT did not reduce suicide‐related outcomes at end of treatment compared with TAU (SMD −0.23, 95% CI −0.68 to 0.23; 5 trials, 231 participants; I2 = 58%; P = 0.33; Analysis 3.3).
No data were available for zero to six months, six to 12 months and above 12 months follow‐up.
3.4 Suicide‐related outcomes, attempts
One trial reported dichotomous data on suicide‐related outcomes (Stanley 2017).
DBT did not reduce suicide‐related outcomes at end of treatment compared with TAU (RR 0.51, 95% CI 0.14 to 1.90; 1 trial, 75 participants; P = 0.32; Analysis 3.4).
No data were available for zero to six months, six to 12 months and above 12 months follow‐up.
3.5 Psychosocial functioning
Six trials reported continuous data on psychosocial functioning (Carter 2010; Feigenbaum 2012; Kramer 2016; Linehan 1994; Mehlum 2014; Soler 2009).
DBT improved psychosocial functioning at end of treatment compared with TAU (SMD −0.36, 95% CI −0.69 to −0.03; 6 trials, 225 participants; I2 = 31%; P = 0.03; Analysis 3.5; low‐quality evidence, summary of findings Table 3).
No data were available for zero to six months, six to 12 months and above 12 months follow‐up.
Secondary outcomes
3.6 Anger
Five trials reported continuous data on anger (Feigenbaum 2012; Koons 2001a; Linehan 1994; Linehan 2006; Soler 2009).
DBT reduced anger at end of treatment compared with TAU (SMD −0.47, 95% CI −0.86 to −0.09; 5 trials, 230 participants; I2 = 46%; P = 0.02; Analysis 3.6.1).
DBT did not reduce anger at six to 12 months follow‐up compared with TAU (SMD −0.17, 95% CI −0.62 to 0.27; 1 trial, 78 participants; P = 0.44; MD −0.10, 95% CI −0.36 to 0.16; 1 trial, 78 participants; P = 0.45; Analysis 3.6.2).
DBT did not reduce anger at above 12 months follow‐up compared with TAU (SMD 0.02, 95% CI −0.42 to 0.46; 1 trial, 80 participants; P = 0.93; MD 0.01, 95% CI −0.20 to 0.22; 1 trial, 79 participants; P = 0.93; Analysis 3.6.3).
No data were available for zero to six months follow‐up.
3.7 Affective instability
Two trials reported continuous data on affective instability (Bianchini 2019; Soler 2009).
DBT did not reduce affective instability at end of treatment compared with TAU (SMD −0.57, 95% CI −1.64 to 0.51; 2 trials, 80 participants; I2 = 78%; P = 0.30; Analysis 3.7; random‐effects model).
DBT reduced affective instability at end of treatment compared with TAU (SMD ‐0.75, 95% CI−1.21 to −0.28; 2 trials, 80 participants; I2 = 78%; P = 0.002; analysis not shown; fixed‐effect model).
No data were available for zero to six months, six to 12 months and above 12 months follow‐up.
3.8 Chronic feelings of emptiness
One trial reported continuous data on chronic feelings of emptiness (Soler 2009).
DBT did not reduce chronic feelings of emptiness at end of treatment compared with TAU (MD −0.67, 95% CI −1.45 to 0.11; 1 trial, 59 participants; P = 0.09; Analysis 3.8).
No data were available for zero to six months, six to 12 months and above 12 months follow‐up.
3.9 Impulsivity
Three trials reported continuous data on impulsivity (Bianchini 2019; Soler 2009; Van den Bosch 2005).
DBT reduced impulsivity at end of treatment compared with TAU (SMD −0.35, 95% CI −0.71 to −0.00; 3 trials, 128 participants; I2 = 0%; P = 0.05; Analysis 3.9.1).
DBT did not reduce impulsivity at six to 12 months follow‐up compared with TAU (SMD 0.30, 95% CI −0.30 to 0.90; 1 trial, 44 participants; P = 0.33; MD 0.23, 95% CI −0.24 to 0.70; 1 trial, 454 participants; P = 0.33; Van den Bosch 2005; Analysis 3.9.2).
No data were available for zero to six months and above 12 months follow‐up.
3.10 Interpersonal problems
Three trials reported continuous data on interpersonal problems (Carter 2010; Kramer 2016; Soler 2009).
DBT did not reduce interpersonal problems at end of treatment compared with TAU (SMD −0.12, 95% CI −0.45 to 0.20; 3 trials, 148 participants; I2 = 0%; P = 0.45; Analysis 3.10).
No data were available for zero to six months, six to 12 months and above 12 months follow‐up.
3.11 Dissociation and psychotic‐like symptoms
Four trials reported continuous data on dissociation and psychotic‐like symptoms (Feigenbaum 2012; Koons 2001a; Priebe 2012; Soler 2009).
DBT reduced dissociation and psychotic‐like symptoms at end of treatment compared with TAU (SMD −0.45, 95% CI −0.73 to −0.16; 4 trials, 194 participants; I2 = 0%; P = 0.002; Analysis 3.11).
No data were available for zero to six months, six to 12 months and above 12 months follow‐up.
3.12 Depression
Five trials reported continuous data on depression (Feigenbaum 2012; Koons 2001a; Linehan 2006; Mehlum 2014; Soler 2009).
DBT did not reduce depression at end of treatment compared with TAU (SMD −0.47, 95% CI −0.98 to 0.03; 5 trials, 219 participants; I2 = 64%; P = 0.07; Analysis 3.12.1; random‐effects model).
DBT reduced depression at end of treatment compared with TAU (SMD −0.46, 95% CI −0.73 to −0.18; 5 trials, 219 participants; I2 = 64%; P = 0.001; analysis not shown; fixed‐effect model).
DBT did not reduce depression at six to 12 months follow‐up compared with TAU (SMD −0.23, 95% CI −0.67 to 0.21; 1 trial, 81 participants; P = 0.31; MD −1.80, 95% CI −5.40 to 1.80; 1 trial, 81 participants; P = 0.33; Analysis 3.12.2).
No data were available for zero to six months and above 12 months follow‐up.
3.13 Attrition
Eleven trials reported dichotomous data on attrition (Carter 2010; Feigenbaum 2012; Koons 2001a; Kramer 2016; Linehan 1991; Linehan 1994; Linehan 2006; Priebe 2012; Soler 2009; Stanley 2017; Van den Bosch 2005).
DBT did not reduce attrition at end of treatment compared with TAU (RR 1.27, 95% CI 0.70 to 2.31; 10 trials, 217 participants; I2 = 81%; P = 0.42; Analysis 3.13.1).
DBT reduced attrition at zero to six months follow‐up compared with TAU (RR 0.58, 95% CI 0.34 to 1.00; 1 trial, 60 participants; P = 0.05; Analysis 3.13.2).
No data were available for six to 12 months and above 12 months follow‐up.
3.14 Adverse effects
One trial reported dichotomous data on adverse effects (Stanley 2017).
There were no adverse effects at end of treatment in any of the groups (effect not estimable; 1 trial, 75 participants; Analysis 3.14).
No data were available for zero to six months, six to 12 months and above 12 months follow‐up.
3.15 Serious adverse effects
One trial reported dichotomous data on serious adverse effects (Stanley 2017).
There was no clear difference in the number of serious adverse effects at end of treatment (RR 0.51, 95% CI 0.05 to 5.42; 1 trial, 75 participants; P = 0.58; Analysis 3.15).
No data were available for zero to six months, six to 12 months and above 12 months follow‐up.
No data were available on any time point for abandonment and identity disturbance.
4. Mentalisation‐based therapy (MBT) versus treatment‐as‐usual (TAU)
Primary outcomes
4.1 BPD symptom severity
Six trials reported continuous data on BPD symptom severity (Bateman 1999; Jørgensen 2013; Laurenssen 2018; Philips 2018; Robinson 2016; Rossouw 2012b).
MBT did not reduce BPD symptom severity at end of treatment compared with TAU (SMD −0.13, 95% CI −0.38 to 0.11; 5 trials, 267 participants; I2 = 0%; P = 0.28; Analysis 4.1.1).
MBT did not reduce BPD symptom severity at zero to six months follow‐up compared with TAU (SMD −0.40, 95% CI −1.49 to 0.68; 1 trial, 15 participants; P = 0.47; MD −2.90, 95% CI −10.87 to 5.07; 1 trial, 15 participants; P = 0.48; Analysis 4.1.2).
Above 12 months follow‐up: MBT did not reduce BPD symptom severity at above 12 months follow‐up compared with TAU (SMD −0.94, 95% CI −2.58 to 0.70; 2 trials, 97 participants; I2 = 92%; P = 0.26; Analysis 4.1.3; random‐effects model).
Above 12 months follow‐up: MBT reduced BPD symptom severity at above 12 months follow‐up compared with TAU (SMD −0.76, 95% CI −1.22 to −0.30; 2 trials, 97 participants; I2 = 92%; P = 0.001; analysis not shown; fixed‐effect model).
No data were available for six to 12 months follow‐up.
4.2 Self‐harm (continuous)
One trial reported continuous data on self‐harm (Philips 2018).
MBT did not reduce self‐harm at end of treatment compared with TAU (MD 0.10, 95% CI −4.02 to 4.22; 1 trial, 24 participants; P = 0.96; Analysis 4.2.1).
4.3 Self‐harm (dichotomous)
Three trials reported dichotomous data on self‐harm (Bateman 1999; Bateman 2009; Rossouw 2012b).
MBT reduced self‐harm at end of treatment compared with TAU (RR 0.62, 95% CI 0.49 to 0.80; 3 trials, 252 participants; I2 = 7%; P = 0.0002; Analysis 4.3.1; low‐quality evidence, summary of findings Table 3).
MBT reduced self‐harm at zero to six months follow‐up compared with TAU (RR 0.14, 95% CI 0.04 to 0.56; 1 trial, 41 participants; P = 0.005; Analysis 4.3.2).
MBT reduced self‐harm at six to 12 months follow‐up compared with TAU (RR 0.27, 95% CI 0.10 to 0.68; 1 trial, 41 participants; P = 0.006; Analysis 4.3.3).
MBT reduced self‐harm at above 12 months follow‐up compared with TAU (RR 0.33, 95% CI 0.15 to 0.76; 1 trial, 41 participants; P = 0.009; Analysis 4.3.4).
4.4 Suicide‐related outcomes
Three trials reported dichotomous data on suicide‐related outcomes (Bateman 1999; Bateman 2009; Philips 2018).
MBT reduced suicide‐related outcomes at end of treatment compared with TAU (RR 0.10, 95% CI 0.04 to 0.30; 3 trials, 218 participants; I2 = 0%; P < 0.001; Analysis 4.4.1; low‐quality evidence, summary of findings Table 3).
MBT did not reduce suicide‐related outcomes at zero to six months follow‐up compared with TAU (RR 0.25, 95% CI 0.06 to 1.05; 1 trial, 41 participants; P = 0.06; Analysis 4.4.2).
MBT reduced suicide‐related outcomes at above 12 months follow‐up compared with TAU (RR 0.29, 95% CI 0.11 to 0.74; 1 trial, 41 participants; P < 0.001; Analysis 4.4.3).
No data were available for six to 12 months follow‐up.
4.5 Psychosocial functioning
Three trials reported continuous data on psychosocial functioning (Bateman 1999; Bateman 2009; Jørgensen 2013).
MBT did not improve psychosocial functioning at end of treatment compared with TAU (SMD −0.54, 95% CI −1.24 to 0.16; 3 trials, 239 participants; I2 = 83%; P = 0.13; Analysis 4.5.1; random‐effects model).
MBT improved psychosocial functioning at end of treatment compared with TAU (SMD −0.53, 95% CI −0.79 to −0.27; 3 trials, 239 participants; I2 = 83%; P < 0.0001; analysis not shown; fixed‐effect model).
MBT did not improve psychosocial functioning at above 12 months follow‐up compared with TAU (SMD −0.41, 95% CI −0.97 to 0.15; 2 trials, 104 participants; I2 = 47%; P = 0.1507; Analysis 4.5.2).
No data were available for zero to six months and six to 12 months follow‐up.
Secondary outcomes
4.6 Interpersonal problems
Five trials reported continuous data on interpersonal problems (Bateman 1999; Bateman 2009; Jørgensen 2013; Jørgensen 2013; Philips 2018).
MBT reduced interpersonal problems at end of treatment compared with TAU (SMD −0.68, 95% CI −1.33 to −0.02; 5 trials, 357 participants; I2 = 87%; P = 0.04; Analysis 4.6.1).
MBT did not reduce interpersonal problems at zero to six months follow‐up compared with TAU (SMD −0.41, 95% CI −1.01 to 0.20; 1 trial, 53 participants; P = 0.19; MD −0.30, 95% CI −0.76 to 0.16; 1 trial, 53 participants; P = 0.20; Analysis 4.6.2).
MBT did not reduce interpersonal problems at above 12 months follow‐up compared with TAU (SMD −0.28, 95% CI −0.71 to 0.14; 2 trials, 96 participants; I2 = 0%; P = 0.19; Analysis 4.6.3).
No data were available for six to 12 months follow‐up.
4.7 Depression (continuous)
Four trials reported continuous data on depression (Bateman 1999; Bateman 2009; Jørgensen 2013; Laurenssen 2018).
MBT did not reduce depression at end of treatment compared with TAU (SMD −0.58, 95% CI −1.22 to 0.05; 4 trials, 333 participants; I2 = 86%; P = 0.07; Analysis 4.7.1; random‐effects model).
MBT reduced depression at end of treatment compared with TAU (SMD −0.38, 95% CI − 0.60 to −0.16; 4 trials, 333 participants; I2 = 86%; P = 0.0009; analysis not shown; fixed‐effect model).
MBT did not reduce depression at zero to six months follow‐up compared with TAU (SMD −0.81, 95% CI −1.69 to 0.07; 2 trials, 91 participants; I2 = 72%; P = 0.07; Analysis 4.7.2; random‐effects model).
MBT reduced depression at zero to six months follow‐up compared with TAU (SMD −0.76, 95% CI −1.22 to − 0.30; 2 trials, 91 participants; I2 = 72%; P = 0.001; analysis not shown; fixed‐effect model).
MBT reduced depression at six to 12 months follow‐up compared with TAU (SMD −1.17, 95% CI −1.88 to −0.45; 1 trial, 37 participants; P = 0.001; MD −8.20, 95% CI ‐12.96 to −3.44; 1 trial, 37 participants; P = 0.0007; Analysis 4.7.3).
MBT did not reduce depression at above 12 months follow‐up compared with TAU (SMD −0.72, 95% CI −1.55 to 0.10; 2 trials, 90 participants; I2 = 68%; P = 0.08; Analysis 4.7.4; random‐effects model).
MBT reduced depression at above 12 months follow‐up compared with TAU (SMD −0.68, 95% CI −1.14 to − 0.22; 2 trials, 90 participants; I2 = 68%; P = 0.004; analysis not shown; fixed‐effect model).
4.8 Depression (dichotomous)
One trial reported dichotomous data on depression (Rossouw 2012b).
MBT did not reduce depression at end of treatment compared with TAU (RR 0.71, 95% CI 0.49 to 1.03; 1 trial, 80 participants; P = 0.08; Analysis 4.8.1).
No data were available for zero to six months, six to 12 months, and above 12 months follow‐up.
4.9 Attrition
Seven trials reported dichotomous data on attrition (Bateman 1999; Bateman 2009; Jørgensen 2013; Laurenssen 2018; Philips 2018; Robinson 2016; Rossouw 2012b).
MBT did not reduce attrition at end of treatment compared with TAU (RR 0.99, 95% CI 0.79 to 1.25; 7 trials, 552 participants; I2 = 0%; P = 0.96; Analysis 4.9.1).
No data were available for zero to six months, six to 12 months, and above 12 months follow‐up.
4.10 Adverse effects
One trial reported dichotomous data on serious adverse effects (Robinson 2016).
There was no clear difference in terms of severe adverse effects at end of treatment (RR 3.00, 95% CI 0.13 to 71.15; 1 trial, P = 0.50; Analysis 4.10).
No data were available for zero to six months, six to 12 months, and above 12 months follow‐up.
* No data were available on any time point for anger, affective instability, chronic feelings of emptiness, impulsivity, abandonment, identity disturbance, dissociation and psychotic‐like symptoms.
4.11 Mentalisation‐based treatment for eating disorders (MBT‐ED) versus specialist supportive clinical management (SSCM‐ED) (generic inverse variance)
Primary outcome: psychosocial functioning
One trial reported continuous data on psychosocial functioning (Robinson 2016).
MBT‐ED did not improve psychosocial functioning at end of treatment compared with SSCM‐ED (MD −0.07, 95% CI −0.86 to 0.72; 1 trial, 23 participants; P = 0.86; Analysis 4.11.1).
MBT‐ED did not improve psychosocial functioning at zero to six months follow‐up compared with SSCM‐ED (MD −0.44, 95% CI −1.52 to 0.64; 1 trial, 15 participants; P = 0.42 Analysis 4.11.2).
No data were available for six to 12 months and above 12 months follow‐up.
No data were available on any time point for BPD symptom severity, self‐harm and suicide‐related outcomes.
Secondary outcomes
Interpersonal problems
One trial reported continuous data on interpersonal problems (Robinson 2016).
MBT‐ED did not reduce interpersonal problems at end of treatment compared with SSCM‐ED (MD −0.10, 95% CI −0.89 to 0.69; 1 trial, 23 participants; P = 0.80; Analysis 4.11.3).
MBT‐ED did not reduce interpersonal problems at zero to six months follow‐up compared with SSCM‐ED (MD −0.06, 95% CI −1.15 to 1.03; 1 trial, 15 participants; P = 0.91; Analysis 4.11.4).
No data were available for six to 12 months and above 12 months follow‐up.
Depression
One trial reported continuous data on depression (Robinson 2016).
MBT‐ED did not reduce depression at end of treatment compared with SSCM‐ED (MD 0.19, 95% CI −0.60 to 0.98; 1 trial, 23 participants; P = 0.64; Analysis 4.11.5).
MBT‐ED did not reduce depression at zero to six months follow‐up compared with SSCM‐ED (MD 0.51, 95% CI −0.62 to 1.64; 1 trial, 15 participants; P = 0.38; Analysis 4.11.6).
No data were available for six to 12 months and above 12 months follow‐up.
No data were available on any time point for anger, affective instability, chronic feelings of emptiness, impulsivity, abandonment, identity disturbance, dissociation and psychotic‐like symptoms, attrition and adverse effects.
5. Cognitive behaviour therapy (CBT) versus treatment‐as‐usual (TAU)
Primary outcomes
5.1 BPD symptom severity (continuous)
One trial reported continuous data on BPD symptom severity (Kredlow 2017a).
CBT reduced BPD symptom severity at end of treatment compared with TAU (MD −3.08, 95% CI −4.99 to −1.17; 1 trial, 26 participants; P = 0.002; Analysis 5.1.1) (random‐effects model analysis).
CBT did not reduce BPD symptom severity at zero to six months follow‐up compared with TAU (MD −2.02, 95% CI −4.23 to 0.19; 1 trial, 26 participants; P = 0.07; Analysis 5.1.2) (fixed‐effect model analysis).
No data were available for six to 12 months and above 12 months follow‐up.
5.2 BPD symptom severity (dichotomous)
One trial reported dichotomous data on BPD symptom severity (Davidson 2006).
CBT did not reduce BPD symptom severity at above 12 months follow‐up compared with TAU (RR 0.91, 95% CI 0.56 to 1.48; 1 trial, 76 participants; P = 0.71; Analysis 5.2).
No data were available for end of treatment, zero to six months and six to 12 months follow‐up.
5.3 Self‐harm (continuous)
One trial reported continuous data on self‐harm (Weinberg 2006).
CBT reduced self‐harm at end of treatment compared with TAU (MD −3.03, 95% CI −5.68 to −0.38; 1 trial, 28 participants; P = 0.03; Analysis 5.3.1).
CBT did not reduce self‐harm at zero to six months follow‐up compared with TAU (MD −4.71, 95% CI −11.60 to 2.18; 1 trial, 28 participants; P = 0.18; Analysis 5.3.2).
No data were available for six to 12 months and above 12 months follow‐up.
5.4 Self‐harm (dichotomous)
One trial reported dichotomous data on self‐harm (Davidson 2006).
CBT did not reduce self‐harm at end of treatment compared with TAU (RR 1.17, 95% CI 0.86 to 1.60; 1 trial, 99 participants; P = 0.32; Analysis 5.4).
No data were available for zero to six months, six to 12 months and above 12 months follow‐up.
5.5 Suicide‐related outcomes
Two trials reported continuous data on suicide‐related outcomes (Davidson 2006; Weinberg 2006).
CBT did not reduce suicide‐related outcomes at end of treatment compared with TAU (SMD −0.47, 95% CI −1.02 to 0.08; 2 trials, 104 participants; P = 0.09; Analysis 5.5.1; random‐effects model).
CBT reduced suicide‐related outcomes at end of treatment compared with TAU (SMD −0.42, 95% −0.81, −0.02; 2 trials, 104 participants; P = 0.04; analysis not shown; fixed‐effect model).
CBT did not reduce suicide‐related outcomes at zero to six months follow‐up compared with TAU (SMD −0.45, 95% CI −1.20 to 0.31; 1 trial, 28 participants; P = 0.25; MD −7.73, 95% CI −20.00 to 4.54; 1 trial, 28 participants; P = 0.22; Analysis 5.5.2).
CBT did not reduce suicide‐related outcomes at six to 12 months follow‐up compared with TAU (SMD −0.44, 95% CI −0.89 to 0.02; 1 trial, 76 participants; P = 0.06; MD −1.16, 95% CI −2.47 to 0.15; 1 trial, 76 participants; P = 0.08; Analysis 5.5.3).
CBT did not reduce suicide‐related outcomes at above 12 months follow‐up compared with TAU (SMD −0.31, 95% CI −0.77 to 0.14; 1 trial, 76 participants; P = 0.18; MD −1.15, 95% CI −2.86 to 0.07; 1 trial, 76 participants; P = 0.19; Analysis 5.5.4).
5.6 Psychosocial functioning
Two trials reported continuous data on psychosocial functioning (Davidson 2006; McMurran 2016).
CBT did not improve psychosocial functioning at end of treatment compared with TAU (SMD 0.00, 95% CI −0.39 to 0.39; 1 trial, 99 participants; P = 1.00; MD 0.00, 95% CI −1.78 to 1.78; 1 trial, 99 participants; P = 1.00; Analysis 5.6.1).
CBT did not improve psychosocial functioning at six to 12 months follow‐up compared with TAU (SMD 0.13, 95% CI −0.28 to 0.55; 1 trial, 90 participants; P = 0.52; MD 0.70, 95% CI −1.43 to 2.83; 1 trial, 90 participants; P = 0.52; Analysis 5.6.2).
CBT did not improve psychosocial functioning at above 12 months follow‐up compared with TAU (SMD 0.04, 95% CI −0.36 to 0.43; 2 trials, 209 participants; I2 = 51%; P = 0.86; Analysis 5.6.3.
No data were available for zero to six months follow‐up.
Secondary outcomes
5.7 Interpersonal problems
One trial reported continuous data on interpersonal problems (Davidson 2006).
CBT did not reduce interpersonal problems at end of treatment compared with TAU (MD 5.40, 95% CI −3.70 to 14.50; 1 trial, 99 participants; P = 0.24; Analysis 5.7.1).
CBT did not reduce interpersonal problems at six to 12 months follow‐up compared with TAU (MD 0.30, 95% CI −9.17 to 9.77; 1 trial, 99 participants; P = 0.95; Analysis 5.7.2).
TAU reduced interpersonal problems at above 12 months follow‐up compared with CBT (MD 11.70, 95% CI 0.72 to 22.68; 1 trial, 76 participants; P = 0.04; Analysis 5.7.3).
No data were available for zero to six months follow‐up.
5.8 Dissociation and psychotic‐like symptoms
One trial reported continuous data on dissociation and psychotic‐like symptoms (Kredlow 2017a).
CBT did not reduce dissociation and psychotic‐like symptoms at end of treatment compared with TAU (MD −2.30, 95% CI −8.84 to 4.24; 1 trial, 26 participants; P = 0.49; Analysis 5.8.1).
CBT reduced dissociation and psychotic‐like symptoms at zero to six months follow‐up compared with TAU (MD −13.40, 95% CI −24.49 to −2.31; 1 trial, 26 participants; P = 0.02; Analysis 5.8.2).
No data were available for six to 12 months and above 12 months follow‐up.
5.9 Depression
Five trials reported continuous data on depression (Davidson 2006; Davidson 2014; Jahangard 2012; Kredlow 2017a; McMurran 2016).
CBT did not reduce depression at end of treatment compared with TAU (SMD −0.21, 95% CI −0.77 to 0.35; 5 trials, 314 participants; I2 = 77%; P = 0.47; Analysis 5.9.1).
CBT reduced depression at zero to six months follow‐up compared with TAU (SMD −0.96, 95% CI −1.78 to −0.14; 1 trial, 26 participants; P = 0.02; MD −12.70, 95% CI −22.62 to −2.78; 1 trial, 26 participants; P = 0.01; Analysis 5.9.2).
CBT did not reduce depression at six to 12 months follow‐up compared with TAU (SMD −0.29, 95% CI −0.69 to 0.11; 1 trial, 99 participants; P = 0.15; MD −4.60, 95% CI −10.82 to 1.62; 1 trial, 99 participants; P = 0.15; Analysis 5.9.3).
CBT did not reduce depression at above 12 months follow‐up compared with TAU (SMD −0.15, 95% CI −0.43 to 0.13; 2 trials, 197 participants; I2 = 0%; P = 0.30; Analysis 5.9.4).
5.10 Attrition
One trial reported dichotomous data on attrition (Davidson 2006).
CBT did not reduce attrition at end of treatment compared with TAU (RR 0.48, 95% CI 0.09 to 2.52; 1 trial, 106 participants; P = 0.39; Analysis 5.10).
No data were available for zero to six months, six to 12 months and above 12 months follow‐up.
5.11 Adverse effects
Two trials reported dichotomous data on non‐serious and serious adverse effects (Davidson 2014McMurran 2016).
There was no clear difference in the number of non‐serious adverse effects at end of treatment (RR 0.92, 95% CI 0.45 to 1.88; 1 trial, 306 participants; P = 0.81; Analysis 5.11.1).
There was no clear difference in the number of serious adverse effects at end of treatment (RR 2.65, 95% CI 0.31 to 22.93; 2 trials, 326 participants; I2= 0%, P = 0.56; Analysis 5.11.2).
No data were available on any time point for anger, affective instability, chronic feelings of emptiness, impulsivity, abandonment and identity disturbance.
6. Psychodynamic psychotherapy versus treatment‐as‐usual (TAU)
Primary outcomes
6.1 BPD symptom severity
Four trials reported continuous data on BPD symptom severity (Amianto 2011; Gregory 2008b; Leichsenring 2016; Reneses 2013).
Psychodynamic psychotherapy did not reduce BPD symptom severity at end of treatment compared with TAU (SMD −0.29, 95% CI −0.66 to 0.09; 4 trials, 222 participants; I2 = 38%; P = 0.13; Analysis 6.1.1).
Psychodynamic psychotherapy did not reduce BPD symptom severity at six to 12 months follow‐up compared with TAU (SMD −0.31, 95% CI −1.00 to 0.38; 1 trial, 33 participants; P = 0.38; MD −0.30, 95% CI −0.95 to 0.35; 1 trial, 33 participants; P = 0.37; Analysis 6.1.2).
No data were available for zero to six months and above 12 months follow‐up.
6.2 Self‐harm
Two trials reported continuous data on self‐harm (Amianto 2011; Gregory 2008b).
Psychodynamic psychotherapy did not reduce self‐harm at end of treatment compared with TAU (MD 0.12, 95% CI −0.56 to 0.80; 1 trial, 33 participants; P = 0.73; Analysis 6.2.1).
Psychodynamic psychotherapy did not reduce self‐harm at six to 12 months follow‐up compared with TAU (MD 0.14, 95% CI −0.55 to 0.82; 1 trial, 33 participants; P = 0.69; Analysis 6.2.2).
No data were available for zero to six months and above 12 months follow‐up.
6.3 Suicide‐related outcomes
Three trials reported continuous data on suicide‐related outcomes (Amianto 2011; Gregory 2008b; Reneses 2013).
Psychodynamic psychotherapy did not reduce suicide‐related outcomes at end of treatment compared with TAU (SMD −0.22, 95% CI −0.62 to 0.17; 3 trials, 101 participants; I2 = 27%; P = 0.27; Analysis 6.3.1).
Psychodynamic psychotherapy did not reduce suicide‐related outcomes at six to 12 months follow‐up compared with TAU (SMD −0.38, 95% CI −1.07 to 0.31; 1 trial, 33 participants; P = 0.28; MD −0.30, 95% CI −0.82 to 0.2; 1 trial, 33 participants; P = 0.26; Analysis 6.3.2).
No data were available for zero to six months and above 12 months follow‐up.
6.4 Psychosocial functioning
Four trials reported continuous data on psychosocial functioning (Amianto 2011; Gregory 2008b; Reneses 2013; Salzer 2014).
Psychodynamic psychotherapy did not improve psychosocial functioning at end of treatment compared with TAU (SMD −0.69, 95% CI −1.98 to 0.59; 4 trials, 140 participants; I2 = 92%; P = 0.29; Analysis 6.4.1; random‐effects model).
Psychodynamic psychotherapy improved psychosocial functioning at end of treatment compared with TAU (SMD −0.38, 95% CI −0.75 to −0.02; 4 trials, 140 participants; I2 = 92%; P = 0.04; analysis not shown; fixed‐effect model).
Psychodynamic psychotherapy did not improve psychosocial functioning at six to 12 months follow‐up compared with TAU (SMD 0.05, 95% CI −0.64 to 0.73; 1 trial, 33 participants; P = 0.89; MD 0.60, 95% CI −8.07 to 9.27; 1 trial, 33 participants; P = 0.89; Analysis 6.4.2).
Psychodynamic psychotherapy did not improve psychosocial functioning at above 12 months follow‐up compared with TAU (SMD −0.40, 95% CI −1.39 to 0.60; 1 trial, 16 participants; P = 0.44; MD −3.70, 95% CI −12.37 to 4.97; 1 trial, 16 participants; P = 0.40; Analysis 6.4.3).
No data were available for zero to six months.
Secondary outcomes
6.5 Anger
One trial reported continuous data on anger (Amianto 2011).
Psychodynamic psychotherapy did not reduce anger at end of treatment compared with TAU (MD 0.00, 95% CI −0.86 to 0.86; 1 trial, 33 participants; P = 1.00; Analysis 6.5.1).
Psychodynamic psychotherapy did not reduce anger at six to 12 months follow‐up compared with TAU (MD 0.00, 95% CI −0.89 to 0.89; 1 trial, 33 participants; P = 1.00; Analysis 6.5.2).
No data were available for zero to six months and above 12 months follow‐up.
6.6 Affective instability
Three trials reported continuous data on affective instability (Amianto 2011; Reneses 2013; Salzer 2014).
Psychodynamic psychotherapy reduced affective instability at end of treatment compared with TAU (SMD −0.50, 95% CI −0.87 to −0.13; 3 trials, 116 participants; I2 = 0%; P = 0.009; Analysis 6.6.1).
Psychodynamic psychotherapy did not reduce affective instability at six to 12 months follow‐up compared with TAU (SMD −0.52, 95% CI −1.21 to 0.18; 1 trial, 33 participants; P = 0.15; MD −0.70, 95% CI −1.59 to 0.19; 1 trial, 33 participants; P = 0.12; Analysis 6.6.2).
No data were available for zero to six months and above 12 months follow‐up.
6.7 Chronic feelings of emptiness
Two trials reported continuous data on chronic feelings of emptiness (Amianto 2011; Reneses 2013).
Psychodynamic psychotherapy did not reduce chronic feelings of emptiness at end of treatment compared with TAU (SMD −0.49, 95% CI −1.02 to 0.04; 2 trials, 77 participants; I2 = 24%; P = 0.07; Analysis 6.7.1; random‐effects model).
Psychodynamic psychotherapy reduced chronic feelings of emptiness at end of treatment compared with TAU (SMD −0.50, 95% CI −0.96 to −0.04; 2 trials, 77 participants; I2 = 24%; P = 0.03; analysis not shown; fixed‐effect model).
Psychodynamic psychotherapy did not reduce chronic feelings of emptiness at six to 12 months follow‐up compared with TAU (SMD −0.58, 95% CI −1.28 to 0.11; 1 trial, 33 participants; P = 0.10; MD −0.60, 95% CI −1.29 to 0.09; 1 trial, 33 participants; P = 0.09; Analysis 6.7.2).
No data were available for six to 12 months and above 12 months follow‐up.
6.8 Impulsivity
Two trials reported continuous data on impulsivity (Amianto 2011; Reneses 2013).
Psychodynamic psychotherapy did not reduce impulsivity at end of treatment compared with TAU (SMD −0.39, 95% CI −0.85 to 0.07; 2 trials, 77 participants; I2 = 0%; P = 0.09; Analysis 6.8.1).
Psychodynamic psychotherapy did not reduce impulsivity at six to 12 months follow‐up compared with TAU (SMD 0.35, 95% CI −0.34 to 1.04; 1 trial, 33 participants; P = 0.32; MD 0.20, 95% CI −0.18 to 0.58; 1 trial, 33 participants; P = 0.30; Analysis 6.8.2).
No data were available for zero to six months and above 12 months follow‐up.
6.9 Interpersonal problems
Four trials reported continuous data on interpersonal problems (Amianto 2011; Leichsenring 2016; Reneses 2013; Salzer 2014).
Psychodynamic psychotherapy did not reduce interpersonal problems at end of treatment compared with TAU (SMD −0.21, 95% CI −0.71 to 0.29; 4 trials, 238 participants; I2 = 68%; P = 0.41; Analysis 6.9.1).
Psychodynamic psychotherapy did not reduce interpersonal problems at six to 12 months follow‐up compared with TAU (SMD −0.51, 95% CI −1.20 to 0.19; 1 trial, 33 participants; P = 0.15; MD −0.60, 95% CI −1.38 to 0.18; 1 trial, 33 participants; P = 0.13; Analysis 6.9.2).
No data were available for zero to six months and above 12 months follow‐up.
6.10 Abandonment
One trial reported continuous data on abandonment (Amianto 2011).
Psychodynamic psychotherapy did not reduce abandonment at end of treatment compared with TAU (MD −0.20, 95% CI −0.95 to 0.55; 1 trial, 33 participants; P = 0.60; Analysis 6.10.1).
Psychodynamic psychotherapy did not reduce abandonment at six to 12 months follow‐up compared with TAU (MD −0.40, 95% CI −1.08 to 0.28; 1 trial, 33 participants; P = 0.25; Analysis 6.10.2).
No data were available for zero to six months and above 12 months follow‐up.
6.11 Identity disturbance
Three trials reported continuous data on identity disturbance (Amianto 2011; Leichsenring 2016; Reneses 2013).
Psychodynamic psychotherapy did not reduce identity disturbance at end of treatment compared with TAU (SMD −0.38, 95% CI −1.02 to 0.27; 3 trials, 199 participants; I2 = 75%; P = 0.25; Analysis 6.11.1).
Psychodynamic psychotherapy reduced identity disturbance at six to 12 months follow‐up compared with TAU (SMD −1.09, 95% CI −1.83 to −0.35; 1 trial, 33 participants; P = 0.004; MD −1.40, 95% CI −2.25 to −0.55; 1 trial, 33 participants; P = 0.001; Analysis 6.11.2).
No data were available for zero to six months and above 12 months follow‐up.
6.12 Dissociation and psychotic‐like symptoms
Two trials reported continuous data on dissociation and psychotic‐like symptoms (Amianto 2011; Gregory 2008b).
Psychodynamic psychotherapy did not reduce dissociation and psychotic‐like symptoms at end of treatment compared with TAU (SMD −0.18, 95% CI −0.96 to 0.60; 2 trials, 57 participants; I2 = 53%; P = 0.66; Analysis 6.12.1).
Psychodynamic psychotherapy did not reduce dissociation and psychotic‐like symptoms at six to 12 months follow‐up compared with TAU (SMD −0.59, 95% CI −1.29 to 0.11; 1 trial, 33 participants; P = 0.10; MD −0.70, 95% CI −1.49 to 0.09; 1 trial, 33 participants; P = 0.08; Analysis 6.12.2).
Psychodynamic psychotherapy did not reduce dissociation and psychotic‐like symptoms at above 12 months follow‐up compared with TAU (SMD −0.01, 95% CI −0.81 to 0.79; 1 trial, 24 participants; P = 0.98; MD −0.20, 95% CI −20.07 to 19.67; 1 trial, 24 participants; P = 0.98; Analysis 6.12.3).
No data were available for zero to six months follow‐up.
6.13 Depression
Three trials reported continuous data on depression (Amianto 2011; Leichsenring 2016; Reneses 2013).
Psychodynamic psychotherapy did not reduce depression at end of treatment compared with TAU (SMD −0.17, 95% CI −0.81 to 0.47; 3 trials, 190 participants; I2 = 73%; P = 0.61; Analysis 6.13.1).
Psychodynamic psychotherapy did not reduce depression at above 12 months follow‐up compared with TAU (SMD −0.68, 95% CI −1.51 to 0.15; 1 trial, 24 participants; P = 0.11; MD −7.80, 95% CI −16.71 to 1.11; 1 trial, 24 participants; P = 0.09; Analysis 6.13.2).
No data were available for zero to six months and six to 12 months follow‐up.
6.14 Attrition
Three trials reported dichotomous data on attrition (Amianto 2011; Leichsenring 2016; Reneses 2013).
Psychodynamic psychotherapy did not reduce attrition at end of treatment compared with TAU (RR 0.90, 95% CI 0.56 to 1.47; 3 trials, 210 participants; I2 = 0%; P = 0.68; Analysis 6.14).
No data were available for zero to six months, six to 12 months and above 12 months follow‐up.
No data were available on any time point for adverse effects.
7. Schema‐focused therapy (SFT) versus treatment‐as‐usual (TAU)
Primary outcomes
7.1 BPD symptom severity
One trial reported continuous data on BPD symptom severity (Farrell 2009).
SFT reduced BPD symptom severity at end of treatment compared with TAU (MD −13.94, 95% CI −19.66 to −8.22; 1 trial, 28 participants; P < 0.001; Analysis 7.1).
No data were available for zero to six months, six to 12 months and above 12 months follow‐up.
7.2 Psychosocial functioning
One trial reported continuous data on psychosocial functioning (Farrell 2009).
SFT improved psychosocial functioning at end of treatment compared with TAU (MD −10.42, 95% CI −16.17 to −4.67; 1 trial, 28 participants; P < 0.001; Analysis 7.2).
No data were available for zero to six months, six to 12 months and above 12 months follow‐up.
No data were available on any time point for self‐harm and suicide‐related outcomes.
Secondary outcomes
7.3 Affective instability
One trial reported continuous data on affective instability (Farrell 2009).
SFT reduced affective instability at end of treatment compared with TAU (MD −3.95, 95% CI −5.75 to −2.15; 1 trial, 28 participants; P < 0.001; Analysis 7.3).
No data were available for zero to six months, six to 12 months and above 12 months follow‐up.
7.4 Impulsivity
One trial reported continuous data on impulsivity (Farrell 2009).
SFT reduced impulsivity at end of treatment compared with TAU (MD −4.02, 95% CI −5.68 to −2.36; 1 trial, 28 participants; P < 0.001; Analysis 7.4).
No data were available for zero to six months, six to 12 months and above 12 months follow‐up.
7.5 Interpersonal problems
One trial reported continuous data on interpersonal problems (Farrell 2009).
SFT reduced interpersonal problems at end of treatment compared with TAU (MD −7.12, 95% CI −9.65 to −4.59; 1 trial, 28 participants; P < 0.001; Analysis 7.5).
No data were available for zero to six months, six to 12 months and above 12 months follow‐up.
7.6 Dissociation and psychotic‐like symptoms
One trial reported continuous data on dissociation and psychotic‐like symptoms (Farrell 2009).
SFT reduced dissociation and psychotic‐like symptoms at end of treatment compared with TAU (MD −2.56, 95% CI −3.86 to −1.26; 1 trial, 28 participants; P < 0.001; Analysis 7.6).
No data were available for zero to six months, six to 12 months and above 12 months follow‐up..
7.7 Attrition
One trial reported dichotomous data on attrition (Farrell 2009).
SFT did not reduce attrition at end of treatment compared with TAU (RR 0.11, 95% CI 0.01 to 1.91; 1 trial, 32 participants; P = 0.13; Analysis 7.7).
No data were available for zero to six months, six to 12 months and above 12 months follow‐up.
* No data were available on any time point for anger, chronic feelings of emptiness, abandonment, identity disturbance, depression, and adverse effects
8. Systems training for emotional predictability and problem solving (STEPPS) versus treatment‐as‐usual (TAU)
Primary outcomes
8.1 BPD symptom severity
Three trials reported continuous data on BPD symptom severity (Blum 2008; Bos 2010; Schuppert 2012).
STEPPS reduced BPD symptom severity at end of treatment compared with TAU (SMD −0.39, 95% CI −0.63 to −0.15; 3 trials, 273 participants; I2 = 0%; P = 0.001; Analysis 8.1.1).
STEPPS did not reduce BPD symptom severity at six to 12 months follow‐up compared with TAU (SMD 0.03, 95% CI −0.33 to 0.38; 1 trial, 124 participants; P = 0.88; MD 0.60, 95% CI −7.45 to 8.65; 1 trial, 124 participants; P = 0.88; Analysis 8.1.2).
No data were available for zero to six months and above 12 months follow‐up.
8.2 Self‐harm
One trial reported dichotomous data on self‐harm (Bos 2010).
STEPPS did not reduce self‐harm at end of treatment compared with TAU (RR 1.32, 95% CI 0.78 to 2.22; 1 trial, 58 participants; P = 0.30; Analysis 8.2).
No data were available for zero to six months, six to 12 months and above 12 months follow‐up.
8.3 Psychosocial functioning
One trial reported continuous data on psychosocial functioning (Blum 2008).
STEPPS improved psychosocial functioning at end of treatment compared with TAU (MD −7.00, 95% CI −11.43 to −2.57; 1 trial, 124 participants; P = 0.002; Analysis 8.3.1).
STEPPS did not improve psychosocial functioning at six to 12 months follow‐up compared with TAU (MD −5.90, 95% CI −12.49 to 0.69; 1 trial, 124 participants; P = 0.08; Analysis 8.3.2).
No data were available for zero to six months and above 12 months follow‐up.
No data were available on any time point for suicide‐related outcomes.
Secondary outcomes
8.4 Affective instability
Two trials reported continuous data on affective instability (Blum 2008; Schuppert 2012).
STEPPS did not reduce affective instability at end of treatment compared with TAU (SMD −0.25, 95% CI −0.52 to 0.02; 2 trials, 221 participants; P = 0.06; Analysis 8.4).
No data were available for zero to six months, six to 12 months and above 12 months follow‐up.
8.5 Impulsivity (continuous)
One trial reported continuous data on impulsivity (Blum 2008).
STEPPS did not reduce impulsivity at end of treatment compared with TAU (MD −0.40, 95% CI −1.23 to 0.43; 1 trial, 124 participants; P = 0.35; Analysis 8.5).
8.6 Impulsivity (dichotomous)
One trial reported dichotomous data on impulsivity (Bos 2010).
STEPPS did not reduce impulsivity at end of treatment compared with TAU (RR 0.93, 95% CI 0.66 to 1.29; 1 trial, 58 participants; P = 0.65; Analysis 8.6).
No data were available for zero to six months, six to 12 months and above 12 months follow‐up.
8.7 Interpersonal problems
Two trials reported continuous data on interpersonal problems (Blum 2008; Bos 2010).
STEPPS reduced interpersonal problems at end of treatment compared with TAU (SMD −0.38, 95% CI −0.67 to −0.08; 2 trials, 177 participants; I2 = 0%; P = 0.01; Analysis 8.7).
No data were available for zero to six months, six to 12 months and above 12 months follow‐up.
8.8 Dissociation and psychotic‐like symptoms
One trial reported continuous data on dissociation and psychotic‐like symptoms (Blum 2008).
STEPPS reduced dissociation and psychotic‐like symptoms at end of treatment compared with TAU (MD −1.00, 95% CI −1.83 to −0.17; 1 trial, 124 participants; P = 0.02; Analysis 8.8).
No data were available for zero to six months, six to 12 months and above 12 months follow‐up.
8.9 Depression
One trial reported continuous data on depression (Blum 2008).
STEPPS did not reduce depression at end of treatment compared with TAU (MD −3.80, 95% CI −9.34 to 1.74; 1 trial, 124 participants; P = 0.18; Analysis 8.9.1).
STEPPS did not reduce depression at six to 12 months follow‐up compared with TAU (MD −0.60, 95% CI −8.42 to 9.62; 1 trial, 124 participants; P = 0.90; Analysis 8.9.2).
No data were available for zero to six months and above 12 months follow‐up.
8.10 Attrition
One trial reported dichotomous data on attrition (Bos 2010).
STEPPS did not reduce attrition at end of treatment compared with TAU (RR 1.47, 95% CI 0.59 to 3.65; 1 trial, 79 participants; P = 0.41; Analysis 8.10).
No data were available for zero to six months, six to 12 months and above 12 months follow‐up.
No data were available on any time point for anger, chronic feelings of emptiness, abandonment, identity disturbance, and adverse effects.
9. Cognitive analytic therapy (CAT) versus treatment‐as‐usual (TAU)
Primary outcomes
9.1 Suicide‐related outcomes
One trial reported continuous data on suicide‐related outcomes (Gleeson 2012).
CAT did not reduce suicide‐related outcomes at end of treatment compared with TAU (MD −1.40, 95% CI −4.21 to 1.41; 1 trial, 9 participants; P = 0.33; Analysis 9.1.1).
CAT did not reduce suicide‐related outcomes at zero to six months follow‐up compared with TAU (MD −0.50, 95% CI −2.05 to 1.05; 1 trial, 8 participants; P = 0.53; Analysis 9.1.2).
No data were available for six to 12 months and above 12 months follow‐up.
9.2 Psychosocial functioning
One trial reported continuous data on psychosocial functioning (Gleeson 2012).
CAT improved psychosocial functioning at end of treatment compared with TAU (MD −16.40, 95% CI −31.20 to −1.60; 1 trial, 9 participants; P = 0.03; Analysis 9.2.1).
CAT improved psychosocial functioning at zero to six months follow‐up compared with TAU (MD −15.80, 95% CI −29.36 to −2.24; 1 trial, 9 participants; P = 0.02; Analysis 9.2.2).
No data were available for six to 12 months and above 12 months follow‐up.
No data were available on any time point for BPD symptom severity, and self‐harm.
Secondary outcomes
9.3 Anger
One trial reported continuous data on anger (Gleeson 2012).
CAT did not reduce anger at end of treatment compared with TAU (MD −1.90, 95% CI −7.97 to 4.17; 1 trial, 9 participants; P = 0.54; Analysis 9.3.1).
CAT did not reduce anger at zero to six months follow‐up compared with TAU (MD −4.50, 95% CI −9.01 to 0.01; 1 trial, 8 participants; P = 0.05; Analysis 9.3.2).
No data were available for six to 12 months and above 12 months follow‐up.
9.4 Dissociation and psychotic‐like symptoms
One trial reported continuous data on dissociation and psychotic‐like symptoms (Gleeson 2012).
CAT did not reduce dissociation and psychotic‐like symptoms at end of treatment compared with TAU (MD −6.10, 95% CI −15.01 to 2.81; 1 trial, 9 participants; P = 0.18; Analysis 9.4.1).
CAT did not reduce dissociation and psychotic‐like symptoms at zero to six months follow‐up compared with TAU (MD −11.70, 95% CI −24.02 to 0.62; 1 trial, 8 participants; P = 0.06; Analysis 9.4.2).
No data were available for six to 12 months and above 12 months follow‐up.
9.5 Depression
One trial reported continuous data on depression (Gleeson 2012).
CAT did not reduce depression at end of treatment compared with TAU (MD −9.70, 95% CI −20.10 to 0.70; 1 trial, 9 participants; P = 0.07; Analysis 9.5.1).
CAT did not reduce depression at zero to six months follow‐up compared with TAU (MD −3.70, 95% CI −11.99 to 4.59; 1 trial, 8 participants; P = 0.38; Analysis 9.5.2).
No data were available for six to 12 months and above 12 months follow‐up.
9.6 Attrition
One trial reported dichotomous data on attrition (Gleeson 2012).
CAT did not reduce attrition at end of treatment compared with TAU (RR 1.33, 95% CI 0.43 to 4.13; 1 trial, 16 participants; P = 0.62; Analysis 9.6).
No data were available for zero to six months, six to 12 months and above 12 months follow‐up.
No data were available on any time point for affective instability, chronic feelings of emptiness, impulsivity, interpersonal problems, abandonment, identity disturbance, and adverse effects.
10. Motivation feedback (MF) versus treatment‐as‐usual (TAU)
10.1 Primary outcome: psychosocial functioning
One trial reported continuous data on psychosocial functioning (Jochems 2015).
MF did not improve psychosocial functioning at end of treatment compared with TAU (MD −0.42, 95% CI −4.23 to 3.39; 1 trial, 43 participants; P = 0.83; Analysis 10.1).
No data were available for zero to six months, six to 12 months and above 12 months follow‐up.
No data were available on any time point for BPD symptom severity, self‐harm, and suicide‐related outcomes.
Secondary outcomes
No data were available on any time point for anger, affective instability, chronic feelings of emptiness, impulsivity, interpersonal problems, abandonment, identity disturbance, dissociation and psychotic‐like symptoms, depression, attrition and adverse effects
11. Psychoeducation versus treatment‐as‐usual (TAU)
Primary outcomes
No data were available on any time point for BPD symptom severity, self‐harm, suicide‐related outcomes, and psychosocial functioning.
Secondary outcomes
11.1 Depression
One trial reported continuous data on depression (Zanarini 2018).
Psychoeducation did not reduce depression at end of treatment compared with TAU (MD −7.03, 95% CI −14.35 to 0.29; 1 trial, 77 participants; P = 0.06; Analysis 11.1).
No data were available for zero to six months, six to 12 months and above 12 months follow‐up.
11.2 Attrition
One trial reported continuous data on attrition (Zanarini 2018).
Psychoeducation did not reduce attrition at end of treatment compared with TAU (RR 0.49, 95% CI 0.04 to 5.60; 1 trial, 80 participants; P = 0.56; Analysis 11.2).
No data were available for zero to six months, six to 12 months and above 12 months follow‐up.
No data were available on any time point for anger, affective instability, chronic feelings of emptiness, impulsivity, interpersonal problems, abandonment, identity disturbance, dissociation and psychotic‐like symptoms, and adverse effects
12. Transference‐focused psychotherapy (TFP) versus treatment‐as‐usual (TAU)
Primary outcomes
12.1 BPD symptom severity
One trial reported continuous data on BPD symptom severity (Doering 2010).
TFP reduced BPD symptom severity at end of treatment compared with TAU (MD −0.84, 95% CI −1.42 to −0.26; 1 trial, 104 participants; P = 0.004; Analysis 12.1).
No data were available for zero to six months, six to 12 months and above 12 months follow‐up.
12.2 Self‐harm
One trial reported dichotomous data on self‐harm (Doering 2010).
TFP did not reduce self‐harm at end of treatment compared with TAU (RR 1.09, 95% CI 0.84 to 1.40; 1 trial, 104 participants; P = 0.52; Analysis 12.2).
No data were available for zero to six months, six to 12 months and above 12 months follow‐up.
12.3 Suicide‐related outcomes
One trial reported dichotomous data on suicide‐related outcomes (Doering 2010).
TFP did not reduce suicide‐related outcomes at end of treatment compared with TAU (RR 0.65, 95% CI 0.27 to 1.54; 1 trial, 104 participants; P = 0.33; Analysis 12.3).
No data were available for zero to six months, six to 12 months and above 12 months follow‐up.
12.4 Psychosocial functioning
One trial reported continuous data on psychosocial functioning (Doering 2010).
TFP did not improve psychosocial functioning at end of treatment compared with TAU (MD −2.56, 95% CI −5.43 to 0.31; 1 trial, 104 participants; P = 0.08; Analysis 12.4).
No data were available for zero to six months, six to 12 months and above 12 months follow‐up.
Secondary outcomes
12.5 Depression
One trial reported continuous data on depression (Doering 2010).
TFP did not reduce depression at end of treatment compared with TAU (MD 1.65, 95% CI −3.44 to 6.74; 1 trial, 104 participants; P = 0.52; Analysis 12.5).
No data were available for zero to six months, six to 12 months and above 12 months follow‐up.
12.6 Attrition
One trial reported dichotomous data on attrition (Doering 2010).
TFP reduced attrition at end of treatment compared with TAU (RR 0.57, 95% CI 0.39 to 0.85; 1 trial, 104 participants; P = 0.005; Analysis 12.6).
No data were available for zero to six months, six to 12 months and above 12 months follow‐up.
No data were available on any time point for anger, affective instability, chronic feelings of emptiness, impulsivity, interpersonal problems, abandonment, identity disturbance, dissociation and psychotic‐like symptoms, and adverse effects.
13. Once‐only interventions (individual setting) versus treatment‐as‐usual (TAU)
Primary outcomes
13.1 Self‐harm
One trial reported continuous data on self‐harm (Borschmann 2013).
Once‐only interventions did not reduce self‐harm at end of treatment compared with TAU (MD 0.60, 95% CI −33.88 to 35.08; 1 trial, 72 participants; P = 0.97; Analysis 13.1).
No data were available for zero to six months, six to 12 months and above 12 months follow‐up.
13.2 Psychosocial functioning
One trial reported continuous data on psychosocial functioning (Borschmann 2013).
Once‐only interventions did not improve psychosocial functioning at end of treatment compared with TAU (MD 0.25, 95% CI −3.66 to 4.16; 1 trial, 72 participants; P = 0.90; Analysis 13.2).
No data were available for zero to six months, six to 12 months and above 12 months follow‐up.
No data were available on any time point for BPD symptom severity, and suicide‐related outcomes.
Secondary outcomes
13.3 Depression
One trial reported continuous data on depression (Borschmann 2013).
Once‐only interventions did not improve depression at end of treatment compared with TAU (MD 0.27, 95% CI −1.72 to 2.26; 1 trial, 72 participants; P = 0.79; Analysis 13.3).
No data were available for zero to six months, six to 12 months and above 12 months follow‐up.
13.4 Attrition
One trial reported dichotomous data on attrition (Borschmann 2013).
Once‐only interventions did not reduce attrition at end of treatment compared with TAU (RR 1.37, 95% CI 0.53 to 3.52; 1 trial, 88 participants; P = 0.51; Analysis 13.4).
No data were available for zero to six months, six to 12 months and above 12 months follow‐up.
No data were available on any time point for anger, affective instability, chronic feelings of emptiness, impulsivity, interpersonal problems, abandonment, identity disturbance, dissociation and psychotic‐like symptoms, and adverse effects.
14. Eclectic treatments versus treatment‐as‐usual (TAU)
Primary outcomes
14.1 BPD symptom severity
Three trials reported continuous data on BPD symptom severity (Gratz 2006; Gratz 2014; Leppänen 2016).
Eclectic treatments reduced BPD symptom severity at end of treatment compared with TAU (SMD −0.90, 95% CI −1.57 to −0.23; 3 trials, 134 participants; I2 = 67%; P = 0.008; Analysis 14.1).
No data were available for zero to six months, six to 12 months and above 12 months follow‐up.
14.2 Self‐harm
Two trials reported continuous data on self‐harm (Gratz 2006; Gratz 2014).
Eclectic treatments reduced self‐harm at end of treatment compared with TAU (SMD −0.84, 95% CI −1.29 to −0.39; 2 trials, 83 participants; I2 = 0%; P = 0.0003; Analysis 14.2).
No data were available for zero to six months, six to 12 months and above 12 months follow‐up.
14.3 Suicide‐related outcomes
Two trials reported continuous data on suicide‐related outcomes (Andreoli 2016; Leppänen 2016).
Eclectic treatments did not reduce suicide‐related outcomes at end of treatment compared with TAU (SMD −0.55, 95% CI −1.29 to 0.19; 2 trials, 221 participants; I2 = 78%; P = 0.14; Analysis 14.3; random‐effects model).
Eclectic treatments reduced suicide‐related outcomes at end of treatment compared with TAU (SMD −0.65, 95% CI −0.98 to − 0.32; 2 trials, 221 participants; I2 = 78%; P = 0.0001; analysis not shown; fixed‐effect model).
No data were available for zero to six months, six to 12 months and above 12 months follow‐up.
14.4 Psychosocial functioning
Two trials reported continuous data on psychosocial functioning (Andreoli 2016; Gratz 2014).
Eclectic treatments improved psychosocial functioning at end of treatment compared with TAU (SMD −0.57, 95% CI −1.10 to −0.04; 2 trials, 231 participants; I2 = 63%; P = 0.03; Analysis 14.4.1).
Eclectic treatments improved psychosocial functioning at above 12 months follow‐up compared with TAU (SMD −0.64, 95% CI −1.04 to −0.24; 1 trial, 170 participants; P = 0.002; MD −7.50, 95% CI −12.30 to −2.70; 1 trial, 170 participants; P = 0.002; Analysis 14.4.2).
No data were available for zero to months and six to 12 months.
Secondary outcomes
14.5 Anger
One trial reported continuous data on anger (Leppänen 2016).
Eclectic treatments did not reduce anger at end of treatment compared with TAU (MD −0.47, 95% CI −1.26 to 0.32; 1 trial, 51 participants; P = 0.24; Analysis 14.5).
No data were available for zero to six months, six to 12 months and above 12 months follow‐up.
14.6 Affective instability
Three trials reported continuous data on affective instability (Gratz 2006; Gratz 2014; Leppänen 2016).
Eclectic treatments reduced affective instability at end of treatment compared with TAU (SMD −0.95, 95% CI −1.74 to −0.15; 3 trials, 134 participants; I2 = 76%; P = 0.02; Analysis 14.6).
No data were available for zero to six months, six to 12 months and above 12 months follow‐up.
14.7 Chronic feelings of emptiness
One trial reported continuous data on chronic feelings of emptiness (Leppänen 2016).
Eclectic treatments did not reduce chronic feelings of emptiness at end of treatment compared with TAU (MD −0.59, 95% CI −2.44 to 1.26; 1 trial, 51 participants; P = 0.53; Analysis 14.7).
No data were available for zero to months, six to 12 months and above 12 months follow‐up.
14.8 Impulsivity
Three trials reported continuous data on impulsivity (Gratz 2006; Gratz 2014; Leppänen 2016).
Eclectic treatments reduced impulsivity at end of treatment compared with TAU (SMD −0.76, 95% CI −1.30 to −0.22; 3 trials, 134 participants; I2 = 52%; P = 0.006; Analysis 14.8).
No data were available for zero to six months, six to 12 months and above 12 months follow‐up.
14.9 Interpersonal problems
Two trials reported continuous data on interpersonal problems (Gratz 2014; Leppänen 2016).
Eclectic treatments reduced interpersonal problems at end of treatment compared with TAU (SMD −0.62, 95% CI −1.09 to −0.15; 2 trials, 112 participants; I2 = 32%; P = 0.01; Analysis 14.9).
No data were available for zero to six months, six to 12 months and above 12 months follow‐up.
14.10 Abandonment
One trial reported continuous data on abandonment (Leppänen 2016).
Eclectic treatments did not reduce abandonment at end of treatment compared with TAU (MD −0.46, 95% CI −1.39 to 0.47; 1 trial, 51 participants; P = 0.33; Analysis 14.10).
No data were available for zero to six months, six to 12 months and above 12 months follow‐up.
14.11 Identity disturbance
One trial reported continuous data on identity disturbance (Leppänen 2016).
Eclectic treatments did not reduce identity disturbance at end of treatment compared with TAU (MD −0.85, 95% CI −1.92 to 0.22; 1 trial, 51 participants; P = 0.12; Analysis 14.11).
No data were available for zero to six months, six to 12 months and above 12 months follow‐up.
14.14 Depression
Four trials reported continuous data on depression (Andreoli 2016; Gratz 2006; Gratz 2014; Leppänen 2016).
Eclectic treatments reduced depression at end of treatment compared with TAU (SMD −0.82, 95% CI −1.38 to −0.26; 4 trials, 304 participants; I2 = 73%; P = 0.004; Analysis 14.12).
No data were available for zero to six months, six to 12 months and above 12 months follow‐up.
14.13 Attrition
Four trials reported dichotomous data on attrition (Andreoli 2016; Gratz 2006; Gratz 2014; Leppänen 2016).
Eclectic treatments did not reduce attrition at end of treatment compared with TAU (RR 1.10, 95% CI 0.91 to 1.33; 4 trials, 326 participants; I2 = 25%; P = 0.31; Analysis 14.13).
No data were available for zero to six months, six to 12 months and above 12 months follow‐up.
14.14 Adverse effects
One trial reported dichotomous data on adverse effects (Andreoli 2016).
Eclectic treatments did not reduce adverse effects at end of treatment compared with TAU (RR 0.66, 95% CI 0.03 to 15.81; 1 trial, 170 participants; P = 0.80; Analysis 14.14).
No data were available for zero to six months, six to 12 months and above 12 months follow‐up.
No data were available on any time point for dissociation and psychotic‐like symptoms.
15. Psychotherapy versus waiting list or no treatment
Primary outcomes
15.1 BPD symptom severity
Three trials reported continuous data on BPD symptom severity (Bellino 2010; Bohus 2013; McMain 2017).
Psychotherapy reduced BPD symptom severity at end of treatment compared with waiting list (SMD −0.49, 95% CI −0.93 to −0.5; 3 trials, 161 participants; I2 = 44%; P = 0.03; Analysis 15.1; low‐quality evidence, summary of findings Table 2).
No data were available for zero to six months, six to 12 months and above 12 months follow‐up.
15.2 Self‐harm
Two trials reported continuous data on self‐harm (Bellino 2010; McMain 2017).
Psychotherapy did not reduce self‐harm at end of treatment compared with waiting list (SMD −0.17, 95% CI −0.52 to 0.18; 2 trials, 128 participants; I2 = 0%; P = 0.34; Analysis 15.2; low‐quality evidence, summary of findings Table 2).
No data were available for zero to six months, six to 12 months and above 12 months follow‐up.
15.3 Suicide‐related outcomes
Two trials reported continuous data on suicide‐related outcomes (McMain 2017; Mohamadizadeh 2017).
Psychotherapy did not reduce suicide‐related outcomes at end of treatment compared with waiting list or no treatment (SMD −5.62, 95% CI −16.39 to 5.16; 2 trials, 108 participants; I2 = 97%; P = 0.31; Analysis 15.3; very low‐quality evidence, summary of findings Table 2).
No data were available for zero to six months, six to 12 months and above 12 months follow‐up.
15.4 Psychosocial functioning
Five trials reported continuous data on psychosocial functioning (Bellino 2006; Bellino 2007; Bohus 2013; Haeyen 2018; McMain 2017).
Psychotherapy improved psychosocial functioning at end of treatment compared with waiting list (SMD −0.56, 95% CI −1.01 to −0.11; 5 trials, 219 participants; I2 = 59%; P = 0.01; Analysis 15.4.1; low‐quality evidence, summary of findings Table 2).
Psychotherapy improved psychosocial functioning at zero to six months follow‐up compared with waiting list (SMD −0.89, 95% CI −1.65 to −0.13; 1 trial, 30 participants; P = 0.02; MD −12.39, 95% CI −22.00 to −2.78; 1 trial, 30 participants; P = 0.01; Analysis 15.4.2).
Psychotherapy improved psychosocial functioning at six to 12 months follow‐up compared with waiting list (SMD −1.04, 95% CI −1.81 to −0.27; 1 trial, 30 participants; P = 0.008: MD −13.59, 95% CI −22.65 to −4.53; 1 trial, 30 participants; P = 0.003; Analysis 15.4.3).
Psychotherapy did not improve psychosocial functioning at above 12 months follow‐up compared with waiting list (SMD −0.38, 95% CI −1.14 to 0.37; 1 trial, 28 participants; P = 0.32; MD −14.68, 95% CI −46.63 to 17.27; 1 trial, 28 participants; P = 0.37; Analysis 15.4.4).
Secondary outcomes
15.5 Anger
Two trials reported continuous data on anger (Bellino 2010; McMain 2017).
Psychotherapy did not reduce anger at end of treatment compared with waiting list (SMD −0.58, 95% CI −1.70 to 0.55; 2 trials, 128 participants; I2 = 89%; P = 0.32; Analysis 15.5, random‐effects model).
Psychotherapy reduced anger at end of treatment compared with waiting list (SMD −0.70, 95% CI −1.06 to −0.33; 2 trials, 128 participants; I2 = 89%; P = 0.0002; analysis not shown; fixed‐effect model).
No data were available for zero to six months, six to 12 months and above 12 months follow‐up.
15.6 Affective instability
Two trials reported continuous data on affective instability (Bellino 2010; McMain 2017).
Psychotherapy reduced affective instability at end of treatment compared with waiting list (SMD −0.99, 95% CI −1.36 to −0.62; 2 trials, 128 participants; I2 = 0%; P < 0.001; Analysis 15.6.1).
Psychotherapy did not reduce affective instability at zero to six months follow‐up compared with waiting list (SMD −0.47, 95% CI −1.20 to 0.26; 1 trial, 30 participants; P = 0.21; MD −0.46, 95% CI −1.15 to 0.23; 1 trial, 30 participants; P = 0.19; Analysis 15.6.2).
Psychotherapy did not reduce affective instability at six to 12 months follow‐up compared with waiting list (SMD −0.38, 95% CI −1.10 to 0.34; 1 trial, 30 participants; P = 0.30; MD −0.39, 95% CI −1.12 to 0.34; 1 trial, 30 participants; P = 0.29; Analysis 15.6.3).
Psychotherapy did not reduce affective instability at above 12 months follow‐up compared with waiting list (SMD −0.28, 95% CI −1.01 to 0.44; 1 trial, 30 participants; P = 0.44; MD −0.34, 95% CI −1.17 to 0.49; 1 trial, 30 participants; P = 0.42; Analysis 15.6.4).
15.7 Chronic feelings of emptiness
One trial reported continuous data on chronic feelings of emptiness (Bellino 2010).
Psychotherapy did not reduce chronic feelings of emptiness at end of treatment compared with waiting list (MD 0.04, 95% CI −0.21 to 0.29; 1 trial, 44 participants; P = 0.75; Analysis 15.7).
No data were available for zero to six months, six to 12 months and above 12 months follow‐up.
15.8 Impulsivity
Three trials reported continuous data on impulsivity (Bellino 2010; McMain 2017; Zanarini 2008).
Psychotherapy reduced impulsivity at end of treatment compared with waiting list (SMD −0.52, 95% CI −0.82 to ‐0.22; 3 trials, 178 participants; I2 = 0%; P = 0.0007; Analysis 15.8.1).
Psychotherapy reduced impulsivity at zero to six months follow‐up compared with waiting list (SMD −0.90, 95% CI −1.66 to −0.14; 1 trial, 30 participants; P = 0.02; MD −1.10, 95% CI −1.95 to −0.25; 1 trial, 30 participants; P = 0.01; Analysis 15.8.2).
Psychotherapy reduced impulsivity at six to 12 months follow‐up compared with waiting list (SMD −0.79, 95% CI −1.54 to −0.04; 1 trial, 30 participants; P = 0.04; MD −1.10, 95% CI −2.06 to −0.14; 1 trial, 30 participants; P = 0.02; Analysis 15.8.3).
Psychotherapy reduced impulsivity at above 12 months follow‐up compared with waiting list (SMD −0.75, 95% CI −1.50 to −0.01; 1 trial, 30 participants; P = 0.05; MD −1.09, 95% CI −2.09 to ‐0.09; 1 trial, 30 participants; P = 0.03; Analysis 15.8.4).
15.9 Interpersonal problems
Three trials reported continuous data on interpersonal problems (Bellino 2010; Haeyen 2018; Zanarini 2008).
Psychotherapy reduced interpersonal problems at end of treatment compared with waiting list (SMD −0.85, 95% CI −1.23 to −0.47; 3 trials, 120 participants; I2 = 0%; P < 0.001; Analysis 15.9.1).
Psychotherapy reduced interpersonal problems at zero to six months follow‐up compared with waiting list (SMD −1.40, 95% CI −2.21 to −0.59; 1 trial, 30 participants; P = 0.0007; MD −2.00, 95% CI −2.98 to −1.02; 1 trial, 30 participants; P < 0.001; Analysis 15.9.2).
Psychotherapy reduced interpersonal problems at six to 12 months follow‐up compared with waiting list (SMD −0.90, 95% CI −1.66 to −0.14; 1 trial, 30 participants; P = 0.02; MD −1.56, 95% CI −2.74 to −0.38; 1 trial, 30 participants; P = 0.009; Analysis 15.9.3).
Psychotherapy reduced interpersonal problems at above 12 months follow‐up compared with waiting list (SMD −0.86, 95% CI −1.62 to −0.11; 1 trial, 30 participants; P = 0.02; MD −1.48, 95% CI −2.63 to −0.33; 1 trial, 30 participants; P = 0.01; Analysis 15.9.4).
15.10 Abandonment
One trial reported continuous data on abandonment (Bellino 2010).
Psychotherapy did not reduce abandonment at end of treatment compared with waiting list (MD 0.01, 95% CI −0.90 to 0.92; 1 trial, 44 participants; P = 0.98; Analysis 15.10).
No data were available for zero to six months, six to 12 months and above 12 months follow‐up.
15.11 Identity disturbance
One trial reported continuous data on identity disturbance (Bellino 2010).
Psychotherapy did not reduce identity disturbance at end of treatment compared with waiting list (MD −0.03, 95% CI −0.56 to 0.50; 1 trial, 44 participants; P = 0.91; Analysis 15.11).
No data were available for zero to six months, six to 12 months and above 12 months follow‐up.
15.12 Dissociation and psychotic‐like
Two trials reported continuous data on dissociation and psychotic‐like symptoms (Bellino 2010; Bohus 2013).
Psychotherapy did not reduce dissociation and psychotic‐like symptoms at end of treatment compared with waiting list (SMD −0.13, 95% CI −0.65 to 0.39; 2 trials, 77 participants; I2 = 24%; P = 0.62; Analysis 15.12).
No data were available for zero to six months, six to 12 months and above 12 months follow‐up.
15.13 Depression
Six trials reported continuous data on depression (Bellino 2006; Bellino 2007; Bohus 2013; McMain 2017; Mohamadizadeh 2017; Smith 2012).
Psychotherapy reduced depression at end of treatment compared with waiting list or no treatment (SMD −1.28, 95% CI −2.21 to −0.34; 6 trials, 239 participants; I2 = 89%; P = 0.007; Analysis 15.13; low‐quality evidence, summary of findings Table 2).
No data were available for zero to six months, six to 12 months and above 12 months follow‐up.
15.14 Attrition
Three trials reported dichotomous data on attrition (Bellino 2006; Bellino 2010; Zanarini 2008).
Psychotherapy did not reduce attrition at end of treatment compared with waiting list (RR 0.55, 95% CI 0.20 to 1.50; 3 trials, 144 participants; I2 = 0%; P = 0.24; Analysis 15.14; very low‐quality evidence, summary of findings Table 2).
No data were available for zero to six months, six to 12 months and above 12 months follow‐up.
No data were available on any time point for adverse effects.
16. Dialectical behaviour therapy (DBT) versus waiting list or no treatment
Primary outcomes
16.1 BPD symptom severity
Two trials reported continuous data on BPD symptom severity (Bohus 2013; McMain 2017).
DBT reduced BPD symptom severity at end of treatment compared with waiting list (SMD −0.71, 95% CI −1.08 to −0.33; 2 trials, 117 participants; I2 = 0%; P = 0.0002; Analysis 16.1).
No data were available for zero to six months, six to 12 months and above 12 months follow‐up.
16.2 Self‐harm
One trial reported continuous data on self‐harm (McMain 2017).
DBT did not reduce self‐harm at end of treatment compared with waiting list (MD −1.45, 95% CI −3.76 to 0.86; 1 trial, 84 participants; P = 0.22; Analysis 16.2).
No data were available for zero to six months, six to 12 months and above 12 months follow‐up.
16.3 Suicide‐related outcomes
Two trials reported continuous data on suicide‐related outcomes (McMain 2017; Mohamadizadeh 2017).
Psychotherapy did not reduce suicide‐related outcomes at end of treatment compared with waiting list or no treatment (SMD −5.62, 95% CI −16.39 to 5.16; 2 trials, 108 participants; I2 = 97%; P = 0.30; Analysis 16.3).
No data were available for zero to six months, six to 12 months and above 12 months follow‐up.
16.4 Psychosocial functioning
Two trials reported continuous data on psychosocial functioning (Bohus 2013; McMain 2017).
DBT reduced psychosocial functioning at end of treatment compared with waiting list (SMD −0.73, 95% CI −1.11 to −0.36; 2 trials, 117 participants; I2 = 0%; P = 0.0001; Analysis 16.4).
No data were available for zero to six months, six to 12 months and above 12 months follow‐up.
Secondary outcomes
16.5 Anger
One trial reported continuous data on anger (McMain 2017).
DBT reduced anger at end of treatment compared with waiting list (MD −11.45, 95% CI −15.73 to −7.17; 1 trial, 84 participants; P < 0.001; Analysis 16.5).
No data were available for zero to six months, six to 12 months and above 12 months follow‐up.
16.6 Affective instability
One trial reported continuous data on affective instability (McMain 2017).
DBT reduced affective instability at end of treatment compared with waiting list (MD −20.15, 95% CI −28.49 to −11.81; 1 trial, 84 participants; P < 0.001; Analysis 16.6).
No data were available for zero to six months, six to 12 months and above 12 months follow‐up.
16.7 Impulsivity
One trial reported continuous data on impulsivity (McMain 2017).
DBT did not reduce impulsivity at end of treatment compared with waiting list (MD −3.41, 95% CI −7.32 to 0.50; 1 trial, 84 participants; P = 0.09; Analysis 16.7).
No data were available for zero to six months, six to 12 months and above 12 months follow‐up.
16.8 Dissociation and psychotic‐like symptoms
One trial reported continuous data on dissociation and psychotic‐like symptoms (Bohus 2013).
DBT did not reduce dissociation and psychotic‐like symptoms at end of treatment compared with waiting list (MD −6.45, 95% CI −16.51 to 3.61; 1 trial, 33 participants; P = 0.21; Analysis 16.8).
No data were available for zero to six months, six to 12 months and above 12 months follow‐up.
16.9 Depression
Three trials reported continuous data on depression (Bohus 2013; McMain 2017; Mohamadizadeh 2017).
DBT reduced depression at end of treatment compared with waiting list or no treatment (SMD −3.20, 95% CI −5.57 to −0.83; 3 trials, 141 participants; P = 0.008; Analysis 16.9).
No data were available for zero to six months, six to 12 months and above 12 months follow‐up.
No data were available on any time point for chronic feelings of emptiness, interpersonal problems, abandonment, identity disturbance, attrition and adverse effects.
16.10. DBT couple therapy (CDBT) versus waiting list (generic inverse variance)
Primary outcomes
BPD symptom severity
One trial reported continuous data on BPD symptom severity (Kamalabadi 2012).
End of treatment: CDBT reduced BPD symptom severity at end of treatment compared with waiting list (MD −27.15, 95% CI −31.59 to −22.71; 1 trial, 30 participants; P < 0.001; Analysis 16.10.1).
No data were available for zero to six months, six to 12 months and above 12 months follow‐up.
Suicide‐related outcomes
One trial reported continuous data on suicide‐related outcomes (Kamalabadi 2012).
CDBT reduced suicide‐related outcomes at end of treatment compared with waiting list (MD −0.94, 95% CI −1.24 to −0.64; 1 trial, 30 participants; P < 0.001; Analysis 16.10.2).
No data were available for zero to six months, six to 12 months and above 12 months follow‐up.
Psychosocial functioning
One trial reported continuous data on psychosocial functioning (Kamalabadi 2012).
CDBT improved psychosocial functioning at end of treatment compared with waiting list (MD −10.70, 95% CI −12.31 to −9.09; 1 trial, 30 participants; P < 0.001; Analysis 16.10.3).
No data were available for zero to six months, six to 12 months and above 12 months follow‐up.
No data were available on any time point for self‐harm.
Secondary outcomes
Anger
One trial reported continuous data on anger (Kamalabadi 2012).
CDBT reduced anger at end of treatment compared with waiting list (MD −1.42, 95% CI −1.72 to −1.12; 1 trial, 30 participants; P < 0.001; Analysis 16.10.4).
No data were available for zero to six months, six to 12 months and above 12 months follow‐up.
Affective instability
One trial reported continuous data on affective instability (Kamalabadi 2012).
CDBT reduced affective instability at end of treatment compared with waiting list (MD −4.01, 95% CI −5.44 to −2.58; 1 trial, 30 participants; P < 0.001; Analysis 16.10.5).
No data were available for zero to six months, six to 12 months and above 12 months follow‐up.
Chronic feelings of emptiness
One trial reported continuous data on chronic feelings of emptiness (Kamalabadi 2012).
CDBT reduced chronic feelings of emptiness at end of treatment compared with waiting list (MD −3.54, 95% CI −4.81 to −2.27; 1 trial, 30 participants; P < 0.001; Analysis 16.10.6).
No data were available for zero to six months, six to 12 months and above 12 months follow‐up.
Impulsivity
One trial reported continuous data on impulsivity (Kamalabadi 2012).
CDBT reduced impulsivity at end of treatment compared with waiting list (MD −0.51, 95% CI −0.72 to −0.30; 1 trial, 30 participants; P < 0.001; Analysis 16.10.7).
No data were available for zero to six months, six to 12 months and above 12 months follow‐up.
Interpersonal problems
One trial reported continuous data on interpersonal problems (Kamalabadi 2012).
CDBT reduced interpersonal problems at end of treatment compared with waiting list (MD −1.98, 95% CI −2.47 to −1.49; 1 trial, 30 participants;, P < 0.001; Analysis 16.10.8).
No data were available for zero to six months, six to 12 months and above 12 months follow‐up.
Abandonment
One trial reported continuous data on abandonment (Kamalabadi 2012).
CDBT reduced abandonment at end of treatment compared with waiting list (MD −0.86, 95% CI −1.09 to ‐0.63; 1 trial, 30 participants; P < 0.001; Analysis 16.10.9).
No data were available for zero to six months, six to 12 months and above 12 months follow‐up.
Identity disturbance
One trial reported continuous data on identity disturbance (Kamalabadi 2012).
CDBT reduced identity disturbance at end of treatment compared with waiting list (MD −2.44, 95% CI −2.77 to −2.11; 1 trial, 30 participants; P < 0.001; Analysis 16.10.10).
No data were available for zero to six months, six to 12 months and above 12 months follow‐up.
Dissociation and psychotic‐like symptoms
One trial reported continuous data on dissociation and psychotic‐like symptoms (Kamalabadi 2012).
CDBT reduced dissociation or psychotic‐like symptoms at end of treatment compared with waiting list (MD −1.92, 95% CI −2.46 to −1.38; 1 trial, 30 participants; P < 0.001; Analysis 16.10.11).
No data were available for zero to six months, six to 12 months and above 12 months follow‐up.
Depression
One trial reported continuous data on depression (Kamalabadi 2012).
CDBT reduced depression at end of treatment compared with waiting list (MD −10.43, 95% CI −11.86 to −9.00; 1 trial, number of participants = 30, P < 0.001; Analysis 16.10.12).
No data were available for zero to six months, six to 12 months and above 12 months follow‐up.
No data were available on any time point for attrition and adverse effects.
17. Schema‐focused therapy (SFT) versus no treatment
17.1 Primary outcome: suicide‐related outcomes
One trial reported continuous data on suicide‐related outcomes (Mohamadizadeh 2017).
SFT reduced suicide‐related outcomes at end of treatment compared with no treatment (MD −16.67, 95% CI −17.70 to −15.64; 1 trial, 24 participants; P < 0.001; Analysis 17.1).
No data were available for zero to six months, six to 12 months and above 12 months follow‐up.
No data were available on any time point for BPD symptom severity, self‐harm, and psychosocial functioning.
17.2 Secondary outcome: depression
One trial reported continuous data on depression (Mohamadizadeh 2017).
SFT reduced depression at end of treatment compared with no treatment (MD −33.92, 95% CI −35.40 to −32.44; 1 trial, 24 participants; P < 0.001; Analysis 17.2).
No data were available for zero to six months, six to 12 months and above 12 months follow‐up.
No data were available on any time point for anger, affective instability, chronic feelings of emptiness, impulsivity, interpersonal problems, abandonment, identity disturbance, dissociation and psychotic‐like symptoms, attrition and adverse effects.
18. Interpersonal psychotherapy (IPT) versus waiting list
Primary outcomes
18.1 BPD symptom severity
One trial reported continuous data on BPD symptom severity (Bellino 2010).
IPT did not reduce BPD symptom severity at end of treatment compared with waiting list (MD −0.19, 95% CI −3.71 to 3.33; 1 trial, 44 participants; P = 0.92; Analysis 18.1).
No data were available for zero to six months, six to 12 months and above 12 months follow‐up.
18.2 Self‐harm
One trial reported continuous data on self‐harm (Bellino 2010).
IPT did not reduce self‐harm at end of treatment compared with waiting list (MD 0.03, 95% CI −1.09 to 1.15; 1 trial, 44 participants; P = 0.96; Analysis 18.2).
No data were available for zero to six months, six to 12 months and above 12 months follow‐up.
18.3 Psychosocial functioning
Two trials reported continuous data on psychosocial functioning (Bellino 2006; Bellino 2010).
IPT did not improve psychosocial functioning at end of treatment compared with waiting list (SMD −0.03, 95% CI −0.48 to 0.42; 2 trials, 76 participants; I2 = 0%; P = 0.91; Analysis 18.3.1).
IPT improved psychosocial functioning at zero to six months follow‐up compared with waiting list (SMD −0.89, 95% CI −1.65 to −0.13; 1 trial, 30 participants; P = 0.02; MD −12.39, 95% CI −22.00 to −2.78; 1 trial, 30 participants; P = 0.01; Analysis 18.3.2).
IPT improved psychosocial functioning at six to 12 months follow‐up compared with waiting list (SMD −1.04, 95% CI −1.81 to −0.27; 1 trial, 30 participants; P = 0.008; MD −13.59, 95% CI −22.65 to −4.53; 1 trial, 30 participants; P = 0.003; Analysis 18.3.3).
IPT did not improve psychosocial functioning at above 12 months follow‐up compared with waiting list (SMD −0.38, 95% CI −1.14 to 0.37; 1 trial, 30 participants; P = 0.32; MD −14.68, 95% CI −46.63 to 17.27; 1 trial, 30 participants; P = 0.37; Analysis 18.3.4).
No data were available on any time point for suicide‐related outcomes.
Secondary outcomes
18.4 Anger
One trial reported continuous data on anger (Bellino 2010).
IPT did not reduce anger at end of treatment compared with waiting list (MD 0.01, 95% CI −0.40 to 0.42; 1 trial, 44 participants; P = 0.96; Analysis 18.4).
No data were available for zero to six months, six to 12 months and above 12 months follow‐up.
18.5 Affective instability
One trial reported continuous data on affective instability (Bellino 2010).
IPT reduced affective instability at end of treatment compared with waiting list (MD −1.02, 95% CI −1.66 to −0.38; 1 trial, 44 participants; P = 0.002; Analysis 18.5.1).
IPT did not reduce affective instability at zero to six months follow‐up compared with waiting list (MD −0.46, 95% CI −1.15 to 0.23; 1 trial, 30 participants; P = 0.19; Analysis 18.5.2).
IPT did not reduce affective instability at six to 12 months follow‐up compared with waiting list (MD −0.39, 95% CI −1.12 to 0.34; 1 trial, 30 participants; P = 0.29; Analysis 18.5.3).
IPT did not reduce affective instability at above 12 months follow‐up compared with waiting list (MD −0.34, 95% CI −1.17 to 0.49; 1 trial, 30 participants; P = 0.42; Analysis 18.5.4).
18.6 Chronic feelings of emptiness
One trial reported continuous data on chronic feelings of emptiness (Bellino 2010).
IPT did not reduce chronic feelings of emptiness at end of treatment compared with waiting list (MD 0.04, 95% CI −0.21 to 0.29; 1 trial, 44 participants; P = 0.75; Analysis 18.6).
No data were available for zero to six months, six to 12 months and above 12 months follow‐up.
18.7 Impulsivity
One trial reported continuous data on impulsivity (Bellino 2010).
IPT reduced impulsivity at end of treatment compared with waiting list (MD −1.03, 95% CI −1.69 to −0.37; 1 trial, 44 participants; P = 0.002; Analysis 18.7.1).
IPT reduced impulsivity at zero to six months follow‐up compared with waiting list (MD −1.10, 95% CI −1.95 to −0.25; 1 trial, 30 participants; P = 0.01; Analysis 18.7.2).
IPT reduced impulsivity at six to 12 months compared with waiting list (MD −1.10, 95% CI −2.06 to −0.14; 1 trial, 30 participants; P = 0.02; Analysis 18.7.3).
IPT reduced impulsivity at above 12 months follow‐up compared with waiting list (MD −1.09, 95% CI −2.09 to −0.09; 1 trial, 30 participants; P = 0.03; Analysis 18.7.4).
18.8 Interpersonal problems
One trial reported continuous data on interpersonal problems (Bellino 2010).
IPT reduced interpersonal problems at end of treatment compared with waiting list (MD −1.14, 95% CI −1.94 to −0.34; 1 trial, 44 participants; P = 0.005; Analysis 18.8.1).
IPT reduced interpersonal problems at zero to six months follow‐up compared with waiting list (MD −2.00, 95% CI −2.98 to −1.02; 1 trial, 30 participants; P < 0.001; Analysis 18.8.2).
IPT reduced interpersonal problems at six to 12 months follow‐up compared with waiting list (MD −1.56, 95% CI −2.74 to −0.38; 1 trial, 30 participants; P = 0.009; Analysis 18.8.3).
IPT reduced interpersonal problems above 12 months follow‐up compared with waiting list (MD −1.48, 95% CI −2.63 to −0.33; 1 trial, 30 participants; P = 0.01; Analysis 18.8.4).
18.9 Abandonment
One trial reported continuous data on abandonment (Bellino 2010).
IPT did not reduce abandonment at end of treatment compared with waiting list (MD 0.01, 95% CI −0.90 to 0.92; 1 trial, 44 participants; P = 0.98; Analysis 18.9).
No data were available for zero to six months, six to 12 months and above 12 months follow‐up.
18.10 Identity disturbance
One trial reported continuous data on identity disturbance (Bellino 2010).
IPT did not reduce identity disturbance at end of treatment compared with waiting list (MD −0.03, 95% CI −0.56 to 0.50; 1 trial, 44 participants; P = 0.91; Analysis 18.10).
No data were available for zero to six months, six to 12 months and above 12 months follow‐up.
18.11 Dissociation and psychotic‐like symptoms
One trial reported continuous data on dissociation and psychotic‐like symptoms (Bellino 2010).
IPT did not reduce dissociation and psychotic‐like symptoms at end of treatment compared with waiting list (MD 0.23, 95% CI −1.06 to 1.52; 1 trial, 44 participants; P = 0.73; Analysis 18.11).
No data were available for zero to six months, six to 12 months and above 12 months follow‐up.
18.12 Depression
Three trials reported continuous data on depression (Bellino 2006; Bellino 2010; Smith 2012).
IPT did not reduce depression at end of treatment compared with waiting list (SMD −0.52, 95% CI −1.11 to 0.06; 3 trials, 98 participants; P = 0.08; Analysis 18.12; random‐effects model).
IPT reduced depression at end of treatment compared with waiting list (SMD −0.46, 95% CI − 0.88 to −0.05; 3 trials, 98 participants; P = 0.03; analysis not shown; fixed‐effect model).
No data were available for zero to six months, six to 12 months and above 12 months follow‐up.
18.13 Attrition
Two trials reported dichotomous data on attrition (Bellino 2006; Bellino 2010).
IPT did not reduce attrition at end of treatment compared with waiting list (RR 0.55, 95% CI 0.20 to 1.50; 2 trials, 94 participants; P = 0.24; Analysis 18.13).
No data were available for zero to six months, six to 12 months and above 12 months follow‐up.
No data were available on any time point for adverse effects.
19. Once‐only interventions (individual setting) versus waiting list
Primary outcomes
No data were available on any time point for BPD symptom severity, self‐harm, suicide‐related outcomes and psychosocial functioning.
Secondary outcomes
19.1 Impulsivity
One trial reported continuous data on impulsivity (Zanarini 2008).
Once‐only interventions did not reduce impulsivity at end of treatment compared with waiting list (MD −0.48, 95% CI −1.07 to 0.11; 1 trial, 50 participants; P = 0.11; Analysis 19.1).
No data were available for zero to six months, six to 12 months and above 12 months follow‐up.
19.2 Interpersonal problems
One trial reported continuous data on interpersonal problems (Zanarini 2008).
Once‐only interventions reduced interpersonal problems at end of treatment compared with waiting list (MD −0.88, 95% CI −1.59 to −0.17; 1 trial, 50 participants; P = 0.02; Analysis 19.2).
No data were available for zero to six months, six to 12 months and above 12 months follow‐up.
19.3 Attrition
One trial reported dichotomous data on attrition (Zanarini 2008).
There was no attrition at end of treatment in any of the groups (effect not estimable; one trial, 50 participants; Analysis 19.3).
No data were available on any time point for anger, affective instability, chronic feelings of emptiness, abandonment, identity disturbance, dissociation and psychotic‐like symptoms, depression and adverse effects.
20. Eclectic treatments versus waiting list
20.1 Primary outcome: psychosocial functioning
One trial reported continuous data on psychosocial functioning (Haeyen 2018).
Eclectic treatments improved psychosocial functioning at end of treatment compared with waiting list (MD −18.64, 95% CI −30.06 to −7.22; 1 trial, 16 participants; P = 0.001; Analysis 20.1).
No data were available for zero to six months, six to 12 months and above 12 months follow‐up.
No data were available on any time point for BPD symptom severity, self‐harm, and suicide‐related outcomes.
20.2 Secondary outcome: interpersonal problems
One trial reported continuous data on interpersonal problems (Haeyen 2018).
Eclectic treatments reduced interpersonal problems at end of treatment compared with waiting list (MD −4.89, 95% CI −8.49 to −1.29; 1 trial, 16 participants; P = 0.008; Analysis 20.2).
No data were available for zero to six months, six to 12 months and above 12 months follow‐up.
No data were available on any time point for anger, affective instability, chronic feelings of emptiness, impulsivity, abandonment, identity disturbance, dissociation and psychotic‐like symptoms, depression, attrition and adverse effects.
21. Dialectical behaviour therapy (DBT) and related treatments versus active treatment
21.1 Standard DBT (DBT) versus client‐centred therapy (CCT) (continuous)
Primary outcomes
Self‐harm
One trial reported continuous data on self‐harm (Turner 2000).
DBT reduced self‐harm at end of treatment compared with CCT (MD −2.75, 95% CI −4.42 to −1.08; 1 trial, 24 participants; P = 0.001; Analysis 21.1.1).
No data were available for zero to six months, six to 12 months and above 12 months follow‐up.
Suicide‐related outcomes
One trial reported continuous data on suicide‐related outcomes (Turner 2000).
DBT reduced suicide‐related outcomes at end of treatment compared with CCT (MD −7.75, 95% CI −14.66 to −0.84; 1 trial, 24 participants; P = 0.03; Analysis 21.1.2).
No data were available for zero to six months, six to 12 months and above 12 months follow‐up.
No data were available on any time point for BPD symptom severity and psychosocial functioning.
Secondary outcomes
Anger
One trial reported continuous data on anger (Turner 2000).
DBT reduced anger at end of treatment compared with CCT (MD −1.00, 95% CI −1.98 to −0.02; 1 trial, 24 participants; P = 0.05, Analysis 21.1.3).
No data were available for zero to six months, six to 12 months and above 12 months follow‐up.
Impulsivity
One trial reported continuous data on impulsivity (Turner 2000).
DBT reduced impulsivity at end of treatment compared with CCT (MD −1.50, 95% CI −2.60 to −0.40; 1 trial, 24 participants; P = 0.008; Analysis 21.1.4).
No data were available for zero to six months, six to 12 months and above 12 months follow‐up.
Dissociation and psychotic‐like symptoms
One trial reported continuous data on dissociation and psychotic‐like symptoms (Turner 2000).
DBT reduced dissociation and psychotic‐like symptoms at end of treatment compared with CCT (MD −7.16, 95% CI −12.15 to −2.17; 1 trial, 24 participants; P = 0.005; Analysis 21.1.5).
No data were available for zero to six months, six to 12 months and above 12 months follow‐up.
Depression
One trial reported continuous data on depression (Turner 2000).
DBT reduced depression at end of treatment compared with CCT (MD −9.16, 95% CI −14.79 to −3.53; 1 trial, 24 participants; P = 0.001; Analysis 21.1.6).
No data were available for zero to six months, six to 12 months and above 12 months follow‐up.
No data were available on any time point for affective instability, chronic feelings of emptiness, interpersonal problems, abandonment, identity disturbance, attrition, and adverse effects.
21.2 DBT versus CCT (dichotomous)
Primary outcomes
No data were available on any time point for BPD symptom severity, self‐harm, suicide‐related outcomes, and psychosocial functioning.
Secondary outcome: attrition
One trial reported dichotomous data on attrition (Turner 2000).
DBT did not reduce attrition at end of treatment compared with CCT (RR 0.50, 95% CI 0.16 to 1.55; 1 trial, 24 participants; P = 0.23; Analysis 21.2).
No data were available for zero to six months, six to 12 months and above 12 months follow‐up.
No data were available on any time point for anger, affective instability, chronic feelings of emptiness, impulsivity, interpersonal problems, abandonment, identity disturbance, dissociation and psychotic‐like symptoms. depression, and adverse effects.
21.3 Standard DBT (DBT) versus good psychiatric management (GPM) (continuous)
Primary outcomes
BPD symptom severity
One trial reported continuous data on BPD symptom severity (McMain 2009).
DBT did not reduce BPD symptom severity at end of treatment compared with GPM (MD −0.23, 95% CI −1.97 to 1.51; 1 trial, 180 participants; P = 0.80; Analysis 21.3.1).
No data were available for zero to six months, six to 12 months and above 12 months follow‐up.
Self‐harm
One trial reported continuous data on self‐harm (McMain 2009).
DBT did not reduce self‐harm at end of treatment compared with GPM (MD −8.58, 95% CI −19.38 to 2.22; 1 trial, 180 participants; P = 0.12; Analysis 21.3.2).
No data were available for zero to six months, six to 12 months and above 12 months follow‐up.
No data were available on any time point for suicide‐related outcomes and psychosocial functioning.
Secondary outcomes
Anger
One trial reported continuous data on anger (McMain 2009).
DBT did not reduce anger at end of treatment compared with GPM (MD −0.15, 95% CI −1.65 to 1.35; 1 trial, 180 participants; P = 0.85; Analysis 21.3.3).
No data were available for zero to six months, six to 12 months and above 12 months follow‐up.
Interpersonal problems
One trial reported continuous data on interpersonal problems (McMain 2009).
DBT did not reduce interpersonal problems at end of treatment compared with GPM (MD −1.34, 95% CI −15.36 to 12.68; 1 trial, 180 participants; P = 0.85; Analysis 21.3.4).
No data were available for zero to six months, six to 12 months and above 12 months follow‐up.
Depression
One trial reported continuous data on depression (McMain 2009).
DBT did not reduce depression at end of treatment compared with GPM (MD −2.65, 95% CI −7.18 to 1.88; 1 trial, 180 participants; P = 0.25; Analysis 21.3.5).
No data were available for zero to six months, six to 12 months and above 12 months follow‐up.
No data were available on any time point for affective instability, chronic feelings of emptiness, impulsivity, abandonment, identity disturbance, dissociation and psychotic‐like symptoms, attrition, and adverse effects.
21.4 DBT versus GPM (dichotomous)
Primary outcomes
No data were available on any time point for BPD symptom severity, self‐harm, suicide‐related outcomes, and psychosocial functioning.
Secondary outcome: attrition
One trial reported dichotomous data on attrition (McMain 2009).
DBT did not reduce attrition at end of treatment compared with GPM (RR 1.03, 95% CI 0.71 to 1.49; 1 trial, 180 participants; P = 0.88; Analysis 21.4).
No data were available for zero to six months, six to 12 months and above 12 months follow‐up.
No data were available on any time point for anger, affective instability, chronic feelings of emptiness, impulsivity, interpersonal problems, abandonment, identity disturbance, dissociation and psychotic‐like symptoms, depression, and adverse effects.
21.5 Standard DBT (DBT) versus individual DBT therapy + activities group (DBT‐I) (continuous)
Primary outcomes
Self‐harm
One trial reported continuous data on self‐harm (Linehan 2015a).
DBT did not reduce self‐harm at end of treatment compared with DBT‐I (MD −10.40, 95% CI −22.99 to 2.19; 1 trial, 66 participants; P = 0.11; Analysis 21.5.1).
DBT did not reduce self‐harm at six to 12 months compared with DBT‐I (MD −8.10, 95% CI −19.59 to 3.39; 1 trial, 66 participants; P = 0.17; Analysis 21.5.2).
No data were available for zero to six months and above 12 months follow‐up.
Suicide‐related outcomes
One trial reported continuous data on suicide‐related outcomes (Linehan 2015a).
DBT did not reduce suicide‐related outcomes at end of treatment compared with DBT‐I (MD 0.50, 95% CI −1.37 to 2.37; 1 trial, 66 participants; P = 0.60; Analysis 21.5.3).
DBT reduced suicide‐related outcomes at six to 12 months follow‐up compared with DBT‐I (MD −1.60, 95% CI −2.79 to −0.41; 1 trial, 66 participants; P = 0.009; Analysis 21.5.4).
No data were available for zero to six months and above 12 months follow‐up.
No data were available on any time point for BPD symptom severity and psychosocial functioning.
Secondary outcomes: depression
One trial reported continuous data on depression (Linehan 2015a).
DBT reduced depression at end of treatment compared with DBT‐I (MD −5.90, 95% CI −9.74 to −2.06; 1 trial, 66 participants; P = 0.003, Analysis 21.5.5).
DBT did not reduce depression at six to 12 months follow‐up compared with DBT‐I (MD 1.30, 95% CI −3.10 to 5.70; 1 trial, 66 participants; P = 0.56; Analysis 21.5.6).
No data were available for zero to six months and above 12 months follow‐up.
No data were available on any time point for anger, affective instability, chronic feelings of emptiness, impulsivity, interpersonal problems, abandonment, identity disturbance, dissociation and psychotic‐like symptoms, attrition, and adverse effects.
21.6 DBT versus GPM (dichotomous)
Primary outcomes
No data were available on any time point for BPD symptom severity, self‐harm, suicide‐related outcomes, and psychosocial functioning.
Secondary outcome: attrition
One trial reported dichotomous data on attrition (Linehan 2015a).
DBT did not reduce attrition at end of treatment compared with DBT‐I (RR 0.50, 95% CI 0.25 to 1.01; 1 trial, 66 participants; P = 0.05; Analysis 21.6).
No data were available for zero to six months, six to 12 months and above 12 months follow‐up.
No data were available on any time point for anger, affective instability, chronic feelings of emptiness, impulsivity, interpersonal problems, abandonment, identity disturbance, dissociation and psychotic‐like symptoms, depression, and adverse effects.
21.7 Standard DBT (DBT) versus skills training group + individual case management (DBT‐S) (continuous)
Primary outcomes
Self‐harm
One trial reported continuous data on self‐harm (Linehan 2015a).
DBT did not reduce self‐harm at end of treatment compared with DBT‐S (MD 0.30, 95% CI −8.42 to 9.02; 1 trial, 66 participants, P = 0.95; Analysis 21.7.1).
DBT did not reduce self‐harm at six to 12 months follow‐up compared with DBT‐S (MD −1.50, 95% CI −9.04 to 6.04, 1 trial, 66 participants; P = 0.70; Analysis 21.7.2).
No data were available for zero to six months and above 12 months follow‐up.
Suicide‐related outcomes
One trial reported continuous data on suicide‐related outcomes (Linehan 2015a).
DBT did not reduce suicide‐related outcomes at end of treatment compared with DBT‐S (MD 0.80, 95% CI −1.06 to 2.66; 1 trial, 66 participants; P = 0.40; Analysis 21.7.3).
DBT reduced suicide‐related outcomes at six to 12 months follow‐up compared with DBT‐S (MD 0.50, 95% CI −0.02 to 1.02; 1 trial, 66 participants; P = 0.06; Analysis 21.7.4).
No data were available for zero to six months and above 12 months follow‐up.
No data were available on any time point for BPD symptom severity and psychosocial functioning.
Secondary outcomes: depression
One trial reported continuous data on depression (Linehan 2015a).
DBT did not reduce depression at end of treatment compared with DBT‐S (MD 1.90, 95% CI −1.60 to 5.40; 1 trial, 66 participants; P = 0.29; Analysis 21.7.5).
DBT did not reduce depression at six to 12 months follow‐up compared with DBT‐S (MD 3.30, 95% CI −0.90 to 7.50; 1 trial, 66 participants; P = 0.12; Analysis 21.7.6).
No data were available for zero to six months, and above 12 months follow‐up.
No data were available on any time point for anger, affective instability, chronic feelings of emptiness, impulsivity, interpersonal problems, abandonment, identity disturbance, dissociation and psychotic‐like symptoms, attrition, and adverse effects.
21.8 DBT versus DBT‐S (dichotomous)
Primary outcomes
No data were available on any time point for BPD symptom severity, self‐harm, suicide‐related outcomes and psychosocial functioning.
Secondary outcome: attrition
One trial reported dichotomous data on attrition (Linehan 2015a).
DBT did not reduce attrition at six to 12 months follow‐up compared with DBT‐S (RR 0.62, 95% CI 0.29 to 1.29; 1 trial, 66 participants; P = 0.20; Analysis 21.8).
No data were available for end of treatment, zero to six months and above 12 months follow‐up.
No data were available on any time point for anger, affective instability, chronic feelings of emptiness, impulsivity, interpersonal problems, abandonment, identity disturbance, dissociation and psychotic‐like symptoms, depression, and adverse effects.
21.9 Standard DBT (DBT) versus step‐down DBT (DBT‐SD) (continuous)
Primary outcomes
BPD symptom severity
One trial reported continuous data on BPD symptom severity (Sinnaeve 2018).
DBT did not reduce BPD severity at end of treatment compared with DBT‐SD (MD −2.83, 95% CI −11.21 to 5.55; 1 trial, 38 participants; P = 0.51; Analysis 21.9.1).
No data were available for zero to six months, six to 12 months and above 12 months follow‐up.
Self‐harm
One trial reported continuous data on self‐harm (Sinnaeve 2018).
DBT did not reduce self‐harm at end of treatment compared with DBT‐SD (MD 4.10, 95% CI −4.07 to 12.27; 1 trial, 38 participants; P = 0.33; Analysis 21.9.2).
No data were available for zero to six months, six to 12 months and above 12 months follow‐up.
Suicide‐related outcomes
One trial reported continuous data on suicide‐related outcomes (Sinnaeve 2018).
DBT did not reduce suicide‐related outcomes at end of treatment compared with DBT‐SD (MD 0.30, 95% CI −0.73 to 1.33; 1 trial, 38 participants; P = 0.57; Analysis 21.9.3).
No data were available for zero to six months, six to 12 months and above 12 months follow‐up.
No data were available on any time point for psychosocial functioning.
Secondary outcomes
Anger
One trial reported continuous data on anger (Sinnaeve 2018).
DBT did not reduce anger symptoms at end of treatment compared with DBT‐SD (MD −0.53, 95% CI −1.48 to 0.43; 1 trial, 41 participants; P = 0.28; Analysis 21.9.4).
No data were available for zero to six months, six to 12 months and above 12 months follow‐up.
Affective instability
One trial reported continuous data on affective instability (Sinnaeve 2018).
DBT did not reduce affective instability at end of treatment compared with DBT‐SD (MD −0.71, 95% CI −2.51 to 1.09; 1 trial, 41 participants; P = 0.44; Analysis 21.9.5).
No data were available for zero to six months, six to 12 months and above 12 months follow‐up.
Chronic feelings of emptiness
One trial reported continuous data on chronic feelings of emptiness (Sinnaeve 2018).
DBT did not reduce chronic feelings of emptiness at end of treatment compared with DBT‐SD (MD 0.18, 95% CI −1.68 to 2.04; 1 trial, 41 participants; P = 0.85; Analysis 21.9.6).
No data were available for zero to six months, six to 12 months and above 12 months follow‐up.
Impulsivity
One trial reported continuous data on impulsivity (Sinnaeve 2018).
DBT did not reduce impulsivity at end of treatment compared with DBT‐SD (MD 0.24, 95% CI −0.26 to 0.75; 1 trial, 41 participants; P = 0.34; Analysis 21.9.7).
No data were available for zero to six months, six to 12 months and above 12 months follow‐up.
Interpersonal problems
One trial reported continuous data on interpersonal problems (Sinnaeve 2018).
DBT reduced interpersonal at end of treatment problems compared with DBT‐SD (MD −1.31, 95% CI −2.05 to −0.57; 1 trial, 41 participants; P = 0.005; Analysis 21.9.8).
No data were available for zero to six months, six to 12 months and above 12 months follow‐up.
Abandonment
One trial reported continuous data on abandonment (Sinnaeve 2018).
DBT reduced abandonment at end of treatment compared with DBT‐SD (MD −1.11, 95% CI −2.14 to −0.08; 1 trial, 41 participants; P = 0.03; Analysis 21.9.9).
No data were available for zero to six months, six to 12 months and above 12 months follow‐up.
Dissociation and psychotic‐like symptoms
One trial reported continuous data on dissociation and psychotic‐like symptoms (Sinnaeve 2018).
DBT did not reduce dissociation and psychotic‐like symptoms at end of treatment compared with DBT‐SD (MD −0.44, 95% CI −1.56 to 0.68; 1 trial, 41 participants; P = 0.44; Analysis 21.9.10).
No data were available for zero to six months, six to 12 months and above 12 months follow‐up.
No data were available on any time point for identity disturbance, depression, attrition, and adverse effects.
21.10 DBT versus DBT‐SD (dichotomous)
Primary outcomes
No data were available on any time point for BPD symptom severity, self‐harm, suicide‐related outcomes, and psychosocial functioning.
Secondary outcome: attrition
One trial reported dichotomous data on attrition (Sinnaeve 2018).0.37 [0.17, 0.78]
DBT reduced attrition at end of treatment compared with DBT‐SD (RR 0.37, 95% CI 0.17 to 0.78; 1 trial, 84 participants; P = 0.009; Analysis 21.10).
No data were available on any time point for anger, affective instability, chronic feelings of emptiness, impulsivity, interpersonal problems, abandonment, identity disturbance, dissociation and psychotic‐like symptoms, depression, and adverse effects.
21.11 Standard DBT (DBT) versus DBT prolonged exposure (DBT‐PE) (continuous)
Primary outcomes
Self‐harm
One trial reported continuous data on self‐harm (Harned 2014).
DBT did not reduce self‐harm at end of treatment compared with DBT‐PE (MD 0.10, 95% CI −1.86 to 2.06; 1 trial, 18 participants; P = 0.92; Analysis 21.11.1).
DBT did not reduce self‐harm at zero to six months follow‐up compared with DBT‐PE (MD −0.30, 95% CI −1.09 to 0.49; 1 trial, 18 participants; P = 0.46; Analysis 21.11.2).
No data were available for six to 12 months and above 12 months follow‐up.
Suicide‐related outcomes
One trial reported continuous data on suicide‐related outcomes (Harned 2014).
There were no suicide attempts in DBT‐PE group at end of treatment (effect not estimable; 1 trial, 18 participants; Analysis 21.11.3).
There were no suicide attempts in DBT group at zero to six months follow‐up (effect not estimable; 1 trial, 18 participants; Analysis 21.11.4).
No data were available for six to 12 months and above 12 months follow‐up.
Psychosocial functioning
One trial reported continuous data on psychosocial functioning (Harned 2014).
DBT did not improve psychosocial functioning at end of treatment compared with DBT‐PE (MD 5.27, 95% CI −2.06 to 12.60; 1 trial, 18 participants; P = 0.16, Analysis 21.11.5).
DBT did not improve psychosocial functioning at zero to six months follow‐up compared with DBT‐PE (MD 2.00, 95% CI −6.27 to 10.27; 1 trial, 18 participants; P = 0.64; Analysis 21.11.6).
No data were available for six to 12 months and above 12 months follow‐up.
No data were available on any time point for BPD symptom severity.
Secondary outcomes
Interpersonal problems
One trial reported continuous data on interpersonal problems (Harned 2014).
DBT did not reduce interpersonal problems at end of treatment compared with DBT‐PE (MD 0.14, 95% CI −0.42 to 0.70; 1 trial, 18 participants; P = 0.62; Analysis 21.11.7).
DBT did not reduce interpersonal problems at zero to six months follow‐up compared with DBT‐PE (MD 0.19, 95% CI −0.48 to 0.86; 1 trial, 18 participants; P = 0.58; Analysis 21.11.8).
No data were available for six to 12 months and above 12 months follow‐up.
Dissociation and psychotic‐like symptoms
One trial reported continuous data on dissociation and psychotic‐like symptoms (Harned 2014).
DBT did not reduce dissociation and psychotic‐like symptoms at end of treatment compared with DBT‐PE (MD 4.60, 95% CI −9.24 to 18.44; 1 trial, 18 participants; P = 0.51; Analysis 21.11.9).
DBT did not reduce dissociation and psychotic‐like symptoms at zero to six months follow‐up compared with DBT‐PE (MD 6.00, 95% CI −9.46 to 21.46; 1 trial, 18 participants; P = 0.45; Analysis 21.11.10).
No data were available for six to 12 months and above 12 months follow‐up.
Depression
One trial reported continuous data on depression (Harned 2014).
DBT did not reduce depression at end of treatment compared with DBT‐PE (MD 3.70, 95% CI −3.19 to 10.59; 1 trial, 18 participants; P = 0.29; Analysis 21.11.11).
DBT did not reduce depression at zero to six months follow‐up compared to DBT‐PE (MD 4.30, 95% CI −1.08 to 9.68; 1 trial, 18 participants; P = 0.12; Analysis 21.11.12).
No data were available for six to 12 months and above 12 months follow‐up.
No data were available on any time point for anger, affective instability, chronic feelings of emptiness, impulsivity, abandonment, identity disturbance, attrition, and adverse effects.
21.12 Standard DBT (DBT) versus DBT prolonged exposure (DBT‐PE) (dichotomous)
Primary outcomes
No data were available on any time point for BPD symptom severity, self‐harm, suicide‐related outcomes, and psychosocial functioning.
Secondary outcome: attrition
One trial reported dichotomous data on attrition Harned 2014).
DBT did not reduce attrition at zero to six months follow‐up compared with DBT‐PE (RR 0.88, 95% CI 0.27 to 2.88; 1 trial, 28 participants; P = 0.84; Analysis 21.12).
No data were available for end of treatment, six to 12 months and above 12 months follow‐up.
No data were available on any time point for anger, affective instability, chronic feelings of emptiness, impulsivity, interpersonal problems, abandonment, identity disturbance, dissociation and psychotic‐like symptoms, depression,and adverse effects.
21.13 DBT skills group plus case management (DBT‐S) versus DBT individual therapy plus activity group (DBT‐I) (continuous)
Primary outcomes
Self‐harm
One trial reported continuous data on self‐harm (Linehan 2015a).
DBT‐S did not reduce self harm at end of treatment compared with DBT‐I (MD −10.70, 95% CI −22.47 to 1.07; 1 trial, 66 participants; P = 0.07; Analysis 21.13.1).
DBT‐S did not reduce self harm at six to 12 months follow‐up compared with DBT‐I (MD −6.60, 95% CI −19.72 to 6.52; 1 trial, 66 participants; P = 0.32; Analysis 21.13.2).
No data were available for six to 12 months and above 12 months follow‐up.
Suicide‐related outcomes
One trial reported continuous data on suicide‐related outcomes (Linehan 2015a).
DBT‐S did not reduce suicide‐related outcomes at end of treatment compared with DBT‐I (MD −0.30, 95% CI −1.72 to 1.12; 1 trial, 66 participants: P = 0.68; Analysis 21.13.3).
DBT‐S reduced suicide‐related outcomes at six to 12 months follow‐up compared with DBT‐I (MD −2.10, 95% CI −3.21 to −0.99; 1 trial, 66 participants; P = 0.0002; Analysis 21.13.4).
No data were available for six to 12 months and above 12 months follow‐up.
No data were available on any time point for BPD symptom severity and psychosocial functioning.
Secondary outcomes: depression
One trial reported continuous data on depression (Linehan 2015a).
DBT‐S reduced depression at end of treatment compared with DBT‐I (MD −7.80, 95% CI −11.27 to −4.33; 1 trial, 66 participants; P < 0.001; Analysis 21.13.5).
DBT‐S did not reduce depression at six to 12 months follow‐up compared with DBT‐I (MD −2.00, 95% CI −6.44 to 2.44; 1 trial, 66 participants; P = 0.38; Analysis 21.13.6).
No data were available for six to 12 months and above 12 months follow‐up.
No data were available on any time point for anger, affective instability, chronic feelings of emptiness, impulsivity, interpersonal problems, abandonment, identity disturbance, dissociation and psychotic‐like symptoms, attrition, and adverse effects.
21.14 DBT‐S versus DBT‐I (dichotomous)
Primary outcomes
No data were available on any time point for BPD symptom severity, self‐harm, suicide‐related outcomes, and psychosocial functioning.
Secondary outcome: attrition
One trial reported dichotomous data on attrition (Linehan 2015a).
DBT‐S did not reduce attrition at six to 12 months follow‐up compared with DBT‐I (RR 0.81, 95% CI 0.61 to 1.09; 1 trial, 66 participants; P = 0.17; Analysis 21.14).
No data were available for end of treatment, zero to six months and above 12 months follow‐up.
No data were available on any time point for anger, affective instability, chronic feelings of emptiness, impulsivity, interpersonal problems, abandonment, identity disturbance, dissociation and psychotic‐like symptoms, depression, and adverse effects.
21.15 DBT skills group (DBT‐S) versus cognitive therapy group (CT‐G) (continuous)
Primary outcomes
BPD symptom severity
One trial reported continuous data on BPD symptom severity (Lin 2019).
DBT‐S did not reduce BPD symptom severity at end of treatment compared with CT‐G (MD 0.26, 95% CI −0.13 to 0.65; 1 trial, 82 participants; P = 0.19; Analysis 21.15.1).
DBT‐S reduced BPD symptom severity at zero to six months follow‐up compared with CT‐G (MD −0.96, 95% CI −1.15 to −0.77; 1 trial, 82 participants = 82; P < 0.001; Analysis 21.15.2).
No data were available for six to 12 months and above 12 months follow‐up.
Suicide‐related outcomes
One trial reported continuous data on suicide‐related outcomes (Lin 2019).
DBT‐S did not reduce suicide‐related outcomes at end of treatment compared with CT‐G (MD 0.46, 95% CI −2.47 to 3.39; 1 trial, 82 participants; P = 0.76; Analysis 21.15.3).
DBT‐S reduced suicide‐related outcomes at zero to six months follow‐up compared with CT‐G (MD −2.69, 95% CI −4.89 to −0.49; 1 trial, 82 participants; P = 0.02; Analysis 21.15.4).
No data were available for six to 12 months and above 12 months follow‐up.
No data were available on any time point for self‐harm and psychosocial functioning.
Secondary outcomes: depression
One trial reported continuous data on depression (Lin 2019).
DBT‐S did not reduce depression at end of treatment compared with CT‐G (MD −2.12, 95% CI −5.25 to 1.01; 1 trial, 82 participants; P = 0.18, Analysis 21.15.5).
DBT‐S did not reduce depression at zero to six months follow‐up compared with CT‐G (MD −1.60, 95% CI −5.07 to 1.87; 1 trial, 82 participants, P = 0.37 Analysis 21.15.6).
No data were available for six to 12 months and above 12 months follow‐up.
No data were available on any time point for anger, affective instability, chronic feelings of emptiness, impulsivity, interpersonal problems, abandonment, identity disturbance, dissociation and psychotic‐like symptoms, attrition, and adverse effects.
21.16 DBT‐S versus CT‐G (dichotomous)
Primary outcomes
No data were available on any time point for BPD symptom severity, self‐harm, suicide‐related outcomes, and psychosocial functioning.
Secondary outcome: attrition
One trial reported dichotomous data on attrition (Lin 2019).
DBT‐S did not reduce attrition at end of treatment compared with CT‐G (RR 0.71, 95% CI 0.27 to 1.88; 1 trial, 82 participants; P = 0.49; Analysis 21.16).
No data were available for zero to six months, six to 12 months and above 12 months follow‐up.
No data were available on any time point for anger, affective instability, chronic feelings of emptiness, impulsivity, interpersonal problems, abandonment, identity disturbance, dissociation and psychotic‐like symptoms, depression, and adverse effects.
21.17 DBT skills group (DBT‐S) versus schema‐focused therapy group (SFT‐G) (continuous)
Primary outcomes: suicide‐related outcomes
One trial reported continuous data on suicide‐related outcomes (Mohamadizadeh 2017).
DBT‐S did not reduce suicide‐related outcomes at end of treatment compared with SFT‐G (MD 0.92, 95% CI −0.36 to 2.20; 1 trial, 24 participants; P = 0.16; Analysis 21.17.1).
No data were available for zero to six months, six to 12 months and above 12 months follow‐up.
No data were available on any time point for BPD symptom severity, self‐harm, and psychosocial functioning.
Secondary outcomes: depression
One trial reported continuous data on depression (Mohamadizadeh 2017).
SFT‐G reduced depression at end of treatment compared with DBT‐S (MD 4.33, 95% CI 2.57 to 6.09; 1 trial, 24 participants; P < 0.001; Analysis 21.17.2).
No data were available for zero to six months, six to 12 months and above 12 months follow‐up.
No data were available on any time point for anger, affective instability, chronic feelings of emptiness, impulsivity, interpersonal problems, abandonment, identity disturbance, dissociation and psychotic‐like symptoms, attrition and adverse effects.
21.18 DBT mindfulness group (DBT‐M) versus DBT interpersonal effectiveness group (DBT‐IE) (continuous)
Primary outcomes: BPD symptom severity
Two trials reported continuous data on BPD symptom severity (Carmona í Farrés 2019; Elices 2016).
DBT‐M did not reduce BPD symptom severity at end of treatment compared with DBT‐IE (SMD −0.45, 95% CI −1.47 to 0.58, 2 trials, 113 participants; I2 = 86%; P = 0.39; Analysis 21.18.1).
No data were available for zero to six months, six to 12 months and above 12 months follow‐up.
No data were available on any time point for self‐harm, suicide‐related outcomes and psychosocial functioning.
Secondary outcomes: impulsivity
Two trials reported continuous data on impulsivity (Carmona í Farrés 2019; Elices 2016).
DBT‐M did not reduce impulsivity at end of treatment compared with DBT‐IE (SMD −0.36, 95% CI −0.77 to 0.06; 2 trials, 91 participants; I2 = 0%; P = 0.09; Analysis 21.18.2).
No data were available for zero to six months, six to 12 months and above 12 months follow‐up.
No data were available on any time point for anger, affective instability, chronic feelings of emptiness, interpersonal problems, abandonment, identity disturbance, dissociation and psychotic‐like symptoms, depression, attrition, and adverse effects.
21.19 DBT‐M versus DBT‐IE (dichotomous)
Primary outcomes
No data were available on any time point for BPD symptom severity, self‐harm, suicide‐related outcomes, and psychosocial functioning.
Secondary outcome: attrition
Two trials reported dichotomous data on attrition (Carmona í Farrés 2019; Elices 2016).
DBT‐IE reduced attrition at end of treatment compared with DBT‐M (RR 1.86, 95% CI 1.07 to 3.23; 2 trials, 134 participants; I2 = 0%; P = 0.03; Analysis 21.19).
No data were available for zero to six months, six to 12 months and above 12 months follow‐up.
No data were available on any time point for anger, affective instability, chronic feelings of emptiness, impulsivity, interpersonal problems, abandonment, identity disturbance, dissociation and psychotic‐like symptoms, depression, and adverse effects.
21.20 DBT mindfulness group (DBT‐M) versus loving‐kindness and compassion mediation (LKM/CM)
Primary outcomes: BPD symptom severity
One trial reported continuous data on BPD symptom severity (Feliu‐Soler 2017).
DBT‐M did not reduce BPD symptom severity at end of treatment compared with LKM/CM (MD 0.04, 95% CI −0.66 to 0.74; 1 trial, 32 participants; P = 0.91; Analysis 21.20).
No data were available for zero to six months, six to 12 months and above 12 months follow‐up.
No data were available on any time point for self‐harm, suicide‐related outcomes and psychosocial functioning.
Secondary outcomes
No data were available on any time point for anger, affective instability, chronic feelings of emptiness, impulsivity, interpersonal problems, abandonment, identity disturbance, dissociation and psychotic‐like symptoms, depression, attrition and adverse effects.
22. Cognitive behavioural therapy (CBT) and related treatments versus active treatment
22.1 CBT versus brief trauma and anxiety‐related group psychoeducation (continuous)
Primary outcomes
BPD symptom severity
One trial reported continuous data on BPD symptom severity (Kredlow 2017b).
CBT did not reduce BPD symptom severity at end of treatment compared with brief trauma and anxiety‐related group psychoeducation (MD −0.26, 95% CI −1.46 to 0.94; 1 trial, 50 participants; P = 0.67; Analysis 22.1.1).
CBT did not reduce BPD symptom severity at zero to six months follow‐up compared with brief trauma and anxiety‐related group psychoeducation (MD −0.39, 95% CI −1.60 to 0.82; 1 trial, 50 participants; P = 0.53; Analysis 22.1.2).
CBT did not reduce BPD symptom severity at six to 12 months follow‐up compared to brief trauma and anxiety‐related group psychoeducation (MD 0.57, 95% CI −0.48 to 1.62; 1 trial, number of 50 participants; P = 0.29; Analysis 22.1.3).
No data were available for above 12 months follow‐up.
Psychosocial functioning
One trial reported continuous data on psychosocial functioning (Kredlow 2017b).
CBT did not improve psychosocial functioning at end of treatment compared with brief trauma and anxiety‐related group psychoeducation (MD −0.64, 95% CI −5.76 to 4.48; 1 trial, 50 participants; P = 0.81; Analysis 22.1.4).
CBT did not improve psychosocial functioning at zero to six months follow‐up compared with brief trauma and anxiety‐related group psychoeducation (MD −1.23, 95% CI −6.94 to 4.48; 1 trial, 50 participants; P = 0.67; Analysis 22.1.5).
CBT did not improve psychosocial functioning at six to 12 months follow‐up compared with brief trauma and anxiety‐related group psychoeducation (MD 0.61, 95% CI −5.00 to 6.22; 1 trial, 50 participants; P = 0.83; Analysis 22.1.6).
No data were available for above 12 months follow‐up.
No data were available on any time point for self‐harm and suicide‐related outcomes.
Secondary outcomes: depression
One trial reported continuous data on depression (Kredlow 2017b).
CBT did not reduce depression at end of treatment compared with brief trauma and anxiety‐related group psychoeducation (MD 0.76, 95% CI −8.20 to 9.72, 1 trial; 50 participants; P = 0.87; Analysis 22.1.7).
CBT did not reduce depression at zero to six months follow‐up compared with brief trauma and anxiety‐related group psychoeducation (MD 3.13, 95% CI −4.05 to 10.31; 1 trial, 50 participants; P = 0.39; Analysis 22.1.8).
CBT did not reduce depression at six to 12 months follow‐up compared with brief trauma and anxiety‐related group psychoeducation (MD 0.77, 95% CI −7.08 to 8.62; 1 trial; 50 participants; P = 0.85; Analysis 22.1.9).
No data were available on any time point for anger, affective instability, chronic feelings of emptiness, impulsivity, interpersonal problems, abandonment, identity disturbance, dissociation and psychotic‐like symptoms, attrition, and adverse effects.
22.2 CBT versus brief trauma and anxiety‐related group psychoeducation (dichotomous)
Primary outcomes
No data were available on any time point for BPD symptom severity, self‐harm, suicide‐related outcomes, and psychosocial functioning.
Secondary outcome: attrition
One trial reported dichotomous data on attrition (Kredlow 2017b).
CBT did not reduce attrition at end of treatment compared with brief trauma and anxiety‐related group psychoeducation (RR 1.99, 95% CI 0.58 to 6.82, 1 trial, 50 participants, P = 0.27; Analysis 22.2).
No data were available on any time point for anger, affective instability, chronic feelings of emptiness, impulsivity, interpersonal problems, abandonment, identity disturbance, dissociation and psychotic‐like symptoms, depression, and adverse effects.
22.3 CBT versus interpersonal therapy (IPT) (continuous)
Primary outcome: psychosocial functioning
One trial reported continuous data on psychosocial functioning (Bellino 2007).
CBT did not improve psychosocial functioning at end of treatment compared with IPT (MD −5.30, 95% CI −12.36 to 1.76; 1 trial, 26 participants; P = 0.14; Analysis 22.3.1).
No data were available for zero to six months, six to 12 months and above 12 months follow‐up.
No data were available on any time point for BPD symptom severity, self‐harm, and suicide‐related outcomes.
Secondary outcomes: depression
One trial reported continuous data on depression (Bellino 2007).
CBT did not reduce depression at end of treatment compared to IPT (MD −0.40, 95% CI −4.72 to 3.92; 1 trial, 26 participants; P = 0.86; Analysis 22.3.2).
No data were available for zero to six months, six to 12 months and above 12 months follow‐up.
No data were available on any time point for anger, affective instability, chronic feelings of emptiness, impulsivity, interpersonal problems, abandonment, identity disturbance, dissociation and psychotic‐like symptoms, attrition and adverse effects.
22.4 CBT versus interpersonal therapy (IPT) (dichotomous)
Primary outcomes
No data were available on any time point for BPD symptom severity, self‐harm, suicide‐related outcomes, and psychosocial functioning.
Secondary outcome: attrition
One trial reported dichotomous data on attrition (Bellino 2007).
CBT did not reduce attrition at end of treatment compared with IPT (RR 2.00, 95% CI 0.42 to 9.42; 1 trial; 32 participants; P = 0.38; Analysis 22.4).
No data were available for zero to six months, six to 12 months and above 12 months follow‐up.
No data were available on any time point for anger, affective instability, chronic feelings of emptiness, impulsivity, interpersonal problems, abandonment, identity disturbance, dissociation and psychotic‐like symptoms, depression, and adverse effects.
22.5 CBT versus Rogerian supportive therapy (continuous)
Primary outcomes
Self‐harm
One trial reported continuous data on self‐harm (Cottraux 2009).
CBT did not reduce self‐harm at end of treatment compared with Rogerian support therapy (MD 0.74, 95% CI −0.03 to 1.51; 1 trial, 38 participants; P = 0.06; Analysis 22.5.1).
CBT did not reduce self‐harm at six to 12 months compared with Rogerian support therapy (MD ‐0.63, 95% CI −1.75 to 0.49; 1 trial, 21 participants; P = 0.27; Analysis 22.5.2).
No data were available for zero to six months and above 12 months follow‐up.
Suicide‐related outcomes
One trial reported continuous data on suicide‐related outcomes (Cottraux 2009).
CBT did not reduce suicide‐related outcomes at end of treatment compared with Rogerian support therapy (MD 0.69, 95% CI −2.60 to 3.9; 1 trial, 38 participants; P = 0.68; Analysis 22.5.3).
CBT did not reduce suicide‐related outcomes at six to 12 months compared with Rogerian support therapy (MD ‐2.43, 95% CI ‐6.14 to 1.28; 1 trial, 21 participants; P = 0.20; Analysis 22.5.4).
No data were available for zero to six months and above 12 months follow‐up.
Psychosocial functioning
One trial reported continuous data on psychosocial functioning (Cottraux 2009).
CBT did not improve psychosocial functioning at end of treatment compared with Rogerian support therapy (MD −0.43, 95% CI −1.31 to 0.45; 1 trial, 38 participants; P = 0.34; Analysis 22.5.5).
CBT did not improve psychosocial functioning at six to 12 months compared with Rogerian support therapy (MD ‐0.98, 95% CI ‐2.02 to 0.06; 1 trial, 21 participants; P = 0.07; Analysis 22.5.6).
No data were available for zero to six months and above 12 months follow‐up.
No data were available on any time point for BPD symptom severity.
Secondary outcomes
Impulsivity
One trial reported continuous data on Impulsivity (Cottraux 2009).
CBT did not reduce impulsivity at end of treatment compared with Rogerian support therapy (MD −1.01, 95% CI −3.85 to 1.83; 1 trial, 38 participants; P = 0.49; Analysis 22.5.7).
CBT did not reduce impulsivity at six to 12 months compared with Rogerian support therapy (MD ‐2.18, 95% CI ‐5.91 to 1.55; 1 trial, 21 participants; P = 0.25; Analysis 22.5.8).
No data were available for zero to six months and above 12 months follow‐up.
Depression
One trial reported continuous data on depression (Cottraux 2009).
CBT did not reduce depression at end of treatment compared with Rogerian support therapy (MD 1.04, 95% CI −5.59 to 7.67; 1 trial, 38 participants; P = 0.76; Analysis 22.5.9).
CBT did reduce depression at six to 12 months compared with Rogerian support therapy (MD ‐5.15, 95% CI ‐9.38 to ‐0.92; 1 trial, 21 participants; P = 0.02; Analysis 22.5.10).
No data were available for zero to six months and above 12 months follow‐up.
No data were available on any time point for anger, affective instability, chronic feelings of emptiness, interpersonal problems, abandonment, identity disturbance, dissociation and psychotic‐like symptoms, attrition, and adverse effects.
22.6 CBT versus Rogerian supportive therapy (dichotomous)
Primary outcomes
No data were available on any time point for BPD symptom severity, self‐harm, suicide‐related outcomes, and psychosocial functioning.
Secondary outcome: attrition
One trial reported dichotomous data on attrition (Cottraux 2009).
CBT did not reduce attrition at end of treatment compared with Rogerian support therapy (RR 0.90, 95% CI 0.51 to 1.60; 1 trial, 38 participants; P = 0.72; Analysis 22.6).
No data were available for zero to six months, six to 12 months and above 12 months follow‐up.
No data were available on any time point for anger, affective instability, chronic feelings of emptiness, impulsivity, interpersonal problems, abandonment, identity disturbance, dissociation and psychotic‐like symptoms, depression, and adverse effects.
22.7 MACT (manual‐assisted cognitive therapy) versus MACT + therapeutic assessment (TA) (continuous)
Primary outcomes
BPD symptom severity
One trial reported continuous data on BPD symptom severity (Morey 2010).
MACT did not reduce BPD symptom severity at end of treatment compared with MACT + TA (MD −3.75, 95% CI −14.17 to 6.67; 1 trial, 16 participants; P = 0.48; Analysis 22.7.1).
No data were available for zero to six months, six to 12 months and above 12 months follow‐up.
Self‐harm
One trial reported continuous data on self‐harm (Morey 2010).
MACT did not reduce self‐harm at end of treatment compared with MACT + TA (MD 1.75, 95% CI −18.71 to 22.21; 1 trial, 16 participants; P = 0.87; Analysis 22.7.2).
No data were available for zero to six months, six to 12 months and above 12 months follow‐up.
Suicide‐related outcomes
One trial reported continuous data on suicide‐related outcomes (Morey 2010).
MACT did not reduce suicide‐related outcomes at end of treatment compared with MACT + TA (MD −0.63, 95% CI −17.71 to 16.45; 1 trial, 16 participants; P = 0.94; Analysis 22.7.3).
No data were available for zero to six months, six to 12 months and above 12 months follow‐up.
No data were available on any time point for psychosocial functioning.
Secondary outcomes
Affective instability
One trial reported continuous data on affective instability (Morey 2010).
MACT did not reduce affective instability at end of treatment compared with MACT + TA (MD −5.25, 95% CI −12.10 to 1.60; 1 trial, 16 participants; P = 0.13; Analysis 22.7.4).
No data were available for zero to six months, six to 12 months and above 12 months follow‐up.
Interpersonal problems
One trial reported continuous data on interpersonal problems (Morey 2010).
MACT did not interpersonal problems at end of treatment compared with MACT + TA (MD −0.50, 95% CI −11.24 to 10.24; 1 trial, 16 participants; P = 0.93; Analysis 22.7.5).
No data were available for zero to six months, six to 12 months and above 12 months follow‐up.
Identity disturbance
One trial reported continuous data on identity disturbance (Morey 2010).
MACT did not reduce identity disturbance at end of treatment compared with MACT + TA (MD −4.88, 95% CI −14.98 to 5.22; 1 trial, 16 participants; P = 0.34; Analysis 22.7.6).
No data were available for zero to six months, six to 12 months and above 12 months follow‐up.
No data were available on any time point for anger, chronic feelings of emptiness, impulsivity, abandonment, dissociation and psychotic‐like symptoms, depression, attrition, and adverse effects.
22.8 MACT versus MACT + TA (dichotomous)
Primary outcomes
No data were available on any time point for BPD symptom severity, self‐harm, suicide‐related outcomes, and psychosocial functioning.
Secondary outcome: attrition
One trial reported dichotomous data on attrition (Morey 2010).
MACT did not reduce attrition at end of treatment compared with MACT + TA (RR 0.80, 95% CI 0.33 to 1.92; 1 trial, 16 participants; P = 0.62; Analysis 22.8).
No data were available for zero to six months, six to 12 months and above 12 months follow‐up.
No data were available on any time point for anger, affective instability, chronic feelings of emptiness, impulsivity, interpersonal problems, abandonment, identity disturbance, dissociation and psychotic‐like symptoms, depression, and adverse effects.
22.9 Meta‐cognitive training for BPD (B‐MCT) versus progressive muscle relaxation (PMR) (continuous)
Primary outcome: BPD symptom severity
One trial reported continuous data on BPD symptom severity (Schilling 2018).
B‐MCT did not reduce BPD symptom severity at end of treatment compared PMR (MD −1.80, 95% CI −4.97 to 1.37; 1 trial, 49 participants; P = 0.27; Analysis 22.9.1).
PMR reduced BPD symptom severity at zero to six months follow‐up compared B‐MCT (MD −3.60, 95% CI −7.16 to −0.04; 1 trial, 39 participants; P = 0.05; Analysis 22.9.2).
No data were available for six to 12 months and above 12 months follow‐up.
No data were available on any time point for self‐harm, suicide‐related outcomes and psychosocial functioning.
Secondary outcomes: depression
One trial reported continuous data on depression (Schilling 2018).
B‐MCT did not reduce depression at end of treatment compared with PMR (MD −3.20, 95% CI −9.91 to 3.51; 1 trial, 54 participants; P = 0.35; Analysis 22.9.3).
B‐MCT reduced depression at zero to six months follow‐up compared with PMR (MD 8.50, 95% CI 2.03 to 14.97; 1 trial, 47 participants, P = 0.01 Analysis 22.9.4).
No data were available for six to 12 months and above 12 months follow‐up.
No data were available on any time point for anger, affective instability, chronic feelings of emptiness, impulsivity, interpersonal problems, abandonment, identity disturbance, dissociation and psychotic‐like symptoms, attrition and adverse effects.
22.10 B‐MCT versus PMR (dichotomous)
Primary outcomes
No data were available on any time point for BPD symptom severity, self‐harm, suicide‐related outcomes, and psychosocial functioning.
Secondary outcome: attrition
One trial reported dichotomous data on attrition (Schilling 2018).
B‐MCT did not reduce attrition at end of treatment compared with PMR (RR 0.95, 95% CI 0.45 to 2.00; 1 trial, 74 participants; P = 0.89; Analysis 22.10).
No data were available for zero to six months, six to 12 months and above 12 months follow‐up.
No data were available on any time point for anger, affective instability, chronic feelings of emptiness, impulsivity, interpersonal problems, abandonment, identity disturbance, dissociation and psychotic‐like symptoms, depression, and adverse effects.
22.11 Motive‐oriented therapeutic relationship (MOTR) versus good psychiatric management (GPM)
Primary outcomes
BPD symptom severity
One trial reported continuous data on BPD symptom severity (Kramer 2014).
MOTR did not reduce BPD symptom severity at end of treatment compared with GPM (MD 0.07, 95% CI −0.38 to 0.52; 1 trial, 74 participants = 74; P = 0.76; Analysis 22.11.1).
No data were available for zero to six months, six to 12 months and above 12 months follow‐up.
Psychosocial functioning
Two trials reported continuous data on psychosocial functioning (Kramer 2011; Kramer 2014).
MOTR group improved psychosocial functioning at end of treatment compared with GPM (SMD −0.45, 95% CI −0.85 to −0.05: 2 trials, 99 participants; I2 = 0%; P = 0.03; Analysis 22.11.2).
No data were available for zero to six months, six to 12 months and above 12 months follow‐up.
No data were available on any time point for self‐harm and suicide‐related outcomes.
Secondary outcomes: interpersonal problems
Two trials reported continuous data on interpersonal problems (Kramer 2011; Kramer 2014).
MOTR group improved interpersonal problems at end of treatment compared with GPM (SMD −0.56, 95% CI −0.97 to −0.16: 2 trials, 99 participants; I2 = 0%; P = 0.006; Analysis 22.11.3).
No data were available for zero to six months, six to 12 months and above 12 months follow‐up.
No data were available on any time point for anger, affective instability, chronic feelings of emptiness, impulsivity, abandonment, identity disturbance, dissociation and psychotic‐like symptoms, depression, attrition, and adverse effects.
22.12 MOTR versus GPM (dichotomous)
Primary outcomes
No data were available on any time point for BPD symptom severity, self‐harm, suicide‐related outcomes, and psychosocial functioning.
Secondary outcome: attrition
Two trials reported dichotomous data on attrition (Kramer 2011; Kramer 2014).
MOTR group did not reduce attrition at end of treatment compared with GPM (RR 0.61, 95% CI 0.26 to 1.41: 2 trials, 110 participants; I2 = 34%; P = 0.25; Analysis 22.12).
No data were available for zero to six months, six to 12 months and above 12 months follow‐up.
No data were available on any time point for anger, affective instability, chronic feelings of emptiness, impulsivity, interpersonal problems, abandonment, identity disturbance, dissociation and psychotic‐like symptoms, depression, and adverse effects.
23. Schema‐focused therapy (SFT) versus active treatment
23.1 SFT versus transference‐focused psychotherapy (TFP) (continuous)
Primary outcome: BPD symptom severity
One trial reported continuous data on BPD symptom severity (Giesen‐Bloo 2006).
SFT reduced BPD symptom severity at end of treatment compared with TFP (MD −4.95, 95% CI −9.59 to −0.31; 1 trial, 86 participants; P = 0.04; Analysis 23.1).
No data were available for zero to six months, six to 12 months and above 12 months follow‐up.
No data were available on any time point for self‐harm, suicide‐related outcomes, and psychosocial functioning.
Secondary outcomes
No data were available on any time point for anger, affective instability, chronic feelings of emptiness, impulsivity, interpersonal problems, abandonment, identity disturbance, dissociation and psychotic‐like symptoms, depression, attrition and adverse effects.
23.2 SFT versus TFP (dichotomous)
Primary outcomes
No data were available on any time point for BPD symptom severity, self‐harm, suicide‐related outcomes, and psychosocial functioning.
Secondary outcome: attrition
One trial reported dichotomous data on attrition (Giesen‐Bloo 2006).
SFT reduced attrition at zero to six months follow‐up compared with TFP (RR 0.52, 95% CI 0.30 to 0.92; 1 trial, 88 participants; P = 0.02; Analysis 23.2).
No data were available for end of treatment, six to 12 months and above 12 months follow‐up.
No data were available on any time point for anger, affective instability, chronic feelings of emptiness, impulsivity, interpersonal problems, abandonment, identity disturbance, dissociation and psychotic‐like symptoms, depression, and adverse effects.
23.3 SFT versus SFT + therapist availability (continuous)
Primary outcome: BPD symptom severity
One trial reported continuous data on BPD symptom severity (Nadort 2009).
SFT did not reduce BPD severity at end of treatment compared with TFP (MD −0.30, 95% CI −5.51 to 4.91; 1 trial, 61 participants; P = 0.91; Analysis 23.3).
No data were available for zero to six months, six to 12 months and above 12 months follow‐up.
No data were available on any time point for self‐harm, suicide‐related outcomes and psychosocial functioning.
Secondary outcomes
No data were available on any time point for anger, affective instability, chronic feelings of emptiness, impulsivity, interpersonal problems, abandonment, identity disturbance, dissociation and psychotic‐like symptoms, depression, attrition and adverse effects.
23.4 SFT versus SFT + therapist availability (dichotomous)
Primary outcomes
No data were available on any time point for BPD symptom severity, self‐harm, suicide‐related outcomes, and psychosocial functioning.
Secondary outcome: attrition
One trial reported dichotomous data on attrition (Nadort 2009).
SFT did not reduce attrition at zero to six months follow‐up compared with TFP (RR 0.91, 95% CI 0.35 to 2.41; 1 trial, 62 participants; P = 0.86; Analysis 23.4).
No data were available for end of treatment, six to 12 months and above 12 months follow‐up.
No data were available on any time point for anger, affective instability, chronic feelings of emptiness, impulsivity, interpersonal problems, abandonment, identity disturbance, dissociation and psychotic‐like symptoms, depression, and adverse effects.
24. Systems training for emotional predictability and problem solving (STEPPS)‐based psychoeducation (STEPPS‐PE) versus cognitive rehabilitation (CR)
24.1 STEPPS‐PE versus CR (continuous)
Primary outcome: BPD symptom severity
One trial reported continuous data on BPD symptom severity (Pascual 2015).
STEPPS‐PE reduced BPD symptom severity at end of treatment compared with cognitive rehabilitation (MD −3.67, 95% CI −6.52 to −0.82; 1 trial, 46 participants; P = 0.01; Analysis 24.1.1).
Cognitive rehabilitation reduced BPD symptom severity at zero to six months follow‐up compared with STEPPS‐PE (MD 4.68, 95% CI 1.42 to 7.94; 1 trial, 42 participants; P = 0.005; Analysis 24.1.2).
No data were available for six to 12 months and above 12 months follow‐up.
No data were available on any time point for self‐harm, suicide‐related outcomes and psychosocial functioning.
Secondary outcomes
Impulsivity
One trial reported continuous data on impulsivity (Pascual 2015).
Cognitive rehabilitation reduced impulsivity at end of treatment compared with STEPPS‐PE (MD 1.99, 95% CI 0.06 to 3.92; 1 trial, 46 participants; P = 0.04; Analysis 24.1.3).
Cognitive rehabilitation reduced impulsivity at zero to six months follow‐up compared with STEPPS‐PE (MD 9.92, 95% CI 7.38 to 12.46; 1 trial, 42 participants; P < 0.001; Analysis 24.1.4).
No data were available for six to 12 months and above 12 months follow‐up.
Depression
One trial reported continuous data on depression (Pascual 2015).
STEPPS‐PE reduced depression at end of treatment compared with cognitive rehabilitation (MD −2.58, 95% CI −3.62 to −1.54; 1 trial, 48 participants; P < 0.001; Analysis 24.1.5).
STEPPS‐PE reduced depression at zero to six months follow‐up compared to cognitive rehabilitation (MD −10.11, 95% CI −11.35 to −8.87; 1 trial, 42 participants; P < 0.001; Analysis 24.1.6).
No data were available for six to 12 months and above 12 months follow‐up.
No data were available on any time point for anger, affective instability, chronic feelings of emptiness, interpersonal problems, abandonment, identity disturbance, dissociation and psychotic‐like symptoms, attrition and adverse effects.
24.2 STEPPS‐PE versus CR (dichotomous)
Primary outcomes
No data were available on any time point for BPD symptom severity, self‐harm, suicide‐related outcomes, and psychosocial functioning.
Secondary outcome: attrition
One trial reported dichotomous data on attrition (Pascual 2015).
STEPPS‐PE did not reduce attrition at end of treatment compared with cognitive rehabilitation (RR 0.76, 95% CI 0.39 to 1.47; 1 trial, 70 participants; P = 0.41; Analysis 24.2).
No data were available for zero to six months, six to 12 months and above 12 months follow‐up.
No data were available on any time point for anger, affective instability, chronic feelings of emptiness, interpersonal problems, abandonment, identity disturbance, dissociation and psychotic‐like symptoms, and adverse effects.
25. Eclectic treatments versus active treatment
25.1 Combined inpatient and outpatient psychotherapy versus outpatient psychotherapy (continuous)
Primary outcome: psychosocial functioning
One trial reported continuous data on psychosocial functioning (Antonsen 2017).
Inpatient and outpatient psychotherapy did not improve psychosocial functioning at end of treatment compared with psychotherapy alone (MD 6.50, 95% CI −0.06 to 13.06; 1 trial, 52 participants; P = 0.05; Analysis 25.1.1).
Inpatient and outpatient psychotherapy did not improve psychosocial functioning at above 12 months follow‐up compared with psychotherapy alone (MD −5.70, 95% CI −13.33 to 1.93; 1 trial, 52 participants; P = 0.14, Analysis 25.1.2).
No data were available for zero to six months and six to 12 months follow‐up.
No data were available on any time point for BPD symptom severity, self‐harm, and suicide‐related outcomes.
Secondary outcomes
Interpersonal problems
One trial reported continuous data on interpersonal problems (Antonsen 2017).
Inpatient and outpatient psychotherapy did not reduce interpersonal problems at end of treatment (three years) compared with psychotherapy alone (MD 0.05, 95% CI −0.24 to 0.34; 1 trial, 52 participants; P = 0.74; Analysis 25.1.3).
Participants in the inpatient and outpatient psychotherapy reported fewer interpersonal problems at above 12 months follow‐up compared with psychotherapy alone (MD −0.42, 95% CI −0.77 to −0.0; 1 trial, 52 participants; P = 0.02; Analysis 25.1.4).
No data were available for zero to six months and six to 12 months follow‐up.
Identity disturbance
One trial reported continuous data on identity disturbance (Antonsen 2017).
Inpatient and outpatient psychotherapy did not reduce identity disturbance at end of treatment (three years) compared with psychotherapy alone (MD −0.25, 95% CI −0.59 to 0.09; 1 trial, 52 participants; P = 0.15; Analysis 25.1.5).
Inpatient and outpatient psychotherapy reported less identity disturbance at above 12 months follow‐up compared with psychotherapy alone (MD −0.47, 95% CI −0.78 to −0.16; 1 trial, 52 participants; P = 0.003; Analysis 25.1.6).
No data were available for zero to six months and six to 12 months follow‐up.
Depression
One trial reported continuous data on depression (Antonsen 2017).
Inpatient and outpatient psychotherapy did not reduce depression at end of treatment (three years) compared with psychotherapy alone (MD −0.40, 95% CI −6.25 to 5.45; 1 trial, 52 participants; P = 0.8; Analysis 25.1.7).
Inpatient and outpatient psychotherapy did not reduce depression at above 12 months follow‐up compared to psychotherapy alone (MD −4.70, 95% CI −11.02 to 1.62; 1 trial, 52 participants; P = 0.14; Analysis 25.1.8).
No data were available for zero to six months and six to 12 months follow‐up.
No data were available on any time point for anger, affective instability, chronic feelings of emptiness, impulsivity, abandonment, dissociation and psychotic‐like symptoms, attrition and adverse effects.
25.2 Combined inpatient and outpatient psychotherapy versus outpatient psychotherapy (dichotomous)
Primary outcomes
No data were available on any time point for BPD symptom severity, self‐harm, suicide‐related outcomes, and psychosocial functioning.
Secondary outcome: attrition
One trial reported dichotomous data on attrition (Antonsen 2017).
Inpatient and outpatient psychotherapy did not reduce attrition at end of treatment (three years) compared with psychotherapy alone (RR 0.62, 95% CI 0.26 to 1.49; 1 trial, 52 participants; P = 0.28; Analysis 25.2).
No data were available for zero to six months, six to 12 months and above 12 months follow‐up.
No data were available on any time point for anger, affective instability, chronic feelings of emptiness, impulsivity, interpersonal problems, abandonment, identity disturbance, dissociation and psychotic‐like symptoms, depression, and adverse effects.
25.3 Integrative BPD‐oriented adolescent family therapy (I‐BAFT) versus individual drug counselling (IDC)
Primary outcome: BPD symptom severity
One trial reported dichotomous data on BPD symptom severity (Santisteban 2015).
Integrative BPD did not reduce BPD severity at end of treatment compared with control (RR 0.91, 95% CI 0.50 to 1.64; 1 trial, 40 participants; P = 0.75; Analysis 25.3.1).
No data were available for zero to six months, six to 12 months and above 12 months follow‐up.
No data were available on any time point for self‐harm, suicide‐related outcomes and psychosocial functioning.
Secondary outcome: attrition
One trial reported dichotomous data on attrition (Santisteban 2015).
Integrative BPD did not reduce attrition at end of treatment compared with control (RR 0.50, 95% CI 0.18 to 1.40; 1 trial, 40 participants; P = 0.19; Analysis 25.3.2).
No data were available for zero to six months, six to 12 months and above 12 months follow‐up.
No data were available on any time point for anger, affective instability, chronic feelings of emptiness, impulsivity, interpersonal problems, abandonment, identity disturbance, dissociation and psychotic‐like symptoms, depression, and adverse effects.
Subgroup analyses
Where data permitted, we conducted our planned subgroup analyses, in addition to two post hoc subgroup analyses, for the primary outcomes of BPD symptom severity and psychosocial functioning. For the 'types of comparisons' subgroup, we also conducted analyses for self‐harm and suicide‐related outcomes. Only subgroups with two or more trials were included in the subgroup analyses.
26. Therapeutic approaches
26.1 BPD symptom severity
We compared the effects of DBT versus MBT versus psychodynamic psychotherapy versus STEPPS versus eclectic treatments for the outcome of BPD symptom severity. We found no evidence of significant differences between the subgroups (test for subgroup differences: Chi2 = 6.88, df = 4 (P = 0.14), I2 = 41.8%): DBT SMD = −0.60 (95% CI −1.05 to −0.14; 3 trials, 149 participants; I2 = 42%; P = 0.01; Analysis 26.1.1); MBT SMD = −0.13 (95% CI −0.38 to 0.11; 5 trials, 267 participants; I2 = 0%; P = 0.28; Analysis 26.1.2); psychodynamic psychotherapy SMD = −0.29 (95% CI −0.66 to 0.09; 4 trials, 222 participants; I2 = 38%; P = 0.13; Analysis 26.1.3); STEPPS SMD = −0.39 (95% CI −0.63 to −0.15; 3 trials, 273 participants; I2 = 0%; P = 0.001; Analysis 26.1.4); and eclectic treatments SMD = −0.90 (95% CI −1.57 to −0.23; 2 trials, 134 participants; I2 = 67%; P = 0.008; Analysis 26.1.5). For illustrative purposes, we present the results of other therapeutic approaches from single trials in Analysis 26.1.6 to Analysis 26.1.10.
26.2 Psychosocial functioning
We compared the effects of DBT versus MBT versus psychodynamic psychotherapy versus eclectic treatments for the outcome of psychosocial functioning. We found no evidence of significant differences between the subgroups (test for subgroup differences: Chi2 = 0.67, df = 3 (P = 0.88), I2 = 0%): DBT SMD = −0.36 (95% CI −0.69 to −0.03; 6 trials, 225 participants; I2 = 31%; P = 0.03; Analysis 26.2.1); MBT SMD = −0.54 (95% CI −1.24 to 0.16; 3 trials, 239 participants; I2 = 83%; P = 0.13; Analysis 26.2.2); psychodynamic psychotherapy SMD = −0.69 (95% CI −1.98 to 0.59; 4 trials, 140 participants; I2 = 92%; P = 0.29; Analysis 26.2.3); and eclectic treatments SMD = −0.57 (95% CI −1.10 to −0.04; 2 trials, 231 participants; I2 = 63%; P = 0.03; Analysis 26.2.11). For illustrative purposes, we present the results of other therapeutic approaches from single trials in Analysis 26.2.5 to Analysis 26.2.11.
27. Age: BPD symptom severity
We compared the effects for the subgroup of 15 to 18 years of age versus above 18 years of age for the outcome of BPD symptom severity. There were significant differences between subgroups (test for subgroup differences: Chi2 = 5.03, df = 1 (P = 0.02), I2 = 80.1%): 15 to 18 years of age SMD = −0.14 (95% CI −0.46 to 0.17; 2 trials, 156 participants; I2 = 0%; P = 0.38; Analysis 27.1.1); and above 18 years of age SMD = −0.57 (95% CI −0.76 to ‐0.37; 20 trials, 1088 participants; I2 = 57%; P < 0.001; Analysis 27.1.2).
28. Duration
28.1 BPD symptom severity
We compared the effects of less than six months versus six to 12 months versus above 12 months duration for the outcome of BPD symptom severity. We found no evidence of significant differences between the subgroups (test for subgroup differences: Chi2 = 3.86, df = 2 (P = 0.15), I2 = 48.2%): less than six months SMD = −0.76 (95% CI −1.10 to −0.42; 8 trials, 525 participants; I2 = 69%; P < 0.001; Analysis 28.1.1); six to 12 months SMD = −0.36 (95% CI −0.60 to −0.12; 11 trials, 606 participants; I2 = 50%; P = 0.003; Analysis 28.1.2); and above 12 months SMD = −0.37 (95% CI −0.75 to 0.01; 3 trials, 113 participants; I2 = 0%; P = 0.06; Analysis 28.1.3).
28.2 Psychosocial functioning
We compared the effects of less than six months versus six to 12 months versus above 12 months durations for the outcome of psychosocial functioning. There were no significant differences between subgroups (test for subgroup differences: Chi2 = 2.24, df = 2 (P = 0.33), I2 = 10.9%): less than six months SMD = −0.31 (95% CI −0.73 to 0.11; 6 trials, 468 participants; I2 = 73%; P = 0.14; Analysis 28.2.1); six to 12 months SMD = −0.25 (95% CI −0.49 to −0.01; 10 trials, 535 participants; I2 = 45%; P = 0.04; Analysis 28.2.2); and above 12 months SMD = −0.86 (95% CI −1.62 to −0.10; 4 trials, 263 participants; I2 = 86%; P = 0.03; Analysis 28.2.3).
29. Mode of therapy
29.1 BPD symptom severity
We compared the effects of individual therapy versus group therapy versus mixed therapy for the outcome of BPD symptom severity. There were significant differences between subgroups (test for subgroup differences: Chi2 = 13.23, df = 2 (P = 0.001), I2 = 84.9%): individual therapy SMD = −0.39 (95% CI −0.63 to −0.16; 8 trials, 520 participants; I2 = 39%; P = 0.001; Analysis 29.1.1); group therapy SMD = −0.89 (95% CI −1.21 to −0.57; 8 trials, 438 participants; I2 = 57%; P < 0.001; Analysis 29.1.2); and mixed therapy SMD = −0.15 (95% CI −0.38 to 0.09; 6 trials, 286 participants; I2 = 0%; P = 0.22; Analysis 29.1.3).
29.2 Psychosocial functioning
We compared the effects of individual therapy versus group therapy versus mixed therapy for the outcome of psychosocial functioning. There were no significant differences between subgroups (test for subgroup differences: Chi2 = 0.89, df = 2 (P = 0.64), I2 = 0%): individual therapy = SMD −0.31 (95% CI −0.75 to 0.12; 8 trials, 570 participants; I2 = 80%; P = 0.16; Analysis 29.2.1); group therapy SMD = −0.44 (95% CI −0.65 to −0.23; 7 trials, 366 participants; I2 = 0%; P < 0.001; Analysis 29.2.2); and mixed therapy SMD = −0.63 (95% CI −1.14 to −0.13; 7 trials, 378 participants; I2 = 80%; P = 0.01; Analysis 29.2.3).
30. Setting
30.1 BPD symptom severity
We compared the effects of inpatient versus outpatient settings for the outcome of BPD symptom severity. There were significant differences between subgroups (test for subgroup differences: Chi2 = 9.18, df = 1 (P = 0.002), I2 = 89.1%): inpatient SMD = −0.07 (95% CI −0.34 to 0.20; 2 trials, 217 participants; I2 = 0%; P = 0.61; Analysis 30.1.1); and outpatient SMD = −0.58 (95% CI −0.77 to −0.39; 20 trials, 1027 participants; I2 = 51%; P < 0.001; Analysis 30.1.2).
30.2 Psychosocial functioning
We compared the effects of inpatient versus outpatient versus combined inpatient and outpatient settings for the outcome of psychosocial functioning. There were significant differences between subgroups (test for subgroup differences: Chi2 = 15.99, df = 2 (P = 0.0003), I2 = 87.5%): inpatient SMD = −0.85 (95% CI −1.24 to −0.46; 2 trials, 179 participants; I2 = 0%; P < 0.001; Analysis 30.2.1); outpatient SMD = −0.31 (95% CI −0.54 to −0.08; 18 trials, 1057 participants; I2 = 67%; P = 0.008; Analysis 30.2.2); and combined inpatient and outpatient SMD = −1.34 (95% CI −1.84 to −0.84; two trials, 78 participants; I2 = 0%; P < 0.001; Analysis 30.2.3).
31. Type of raters
31.1 BPD symptom severity
We compared the effects of self‐rated versus clinician‐rated for the outcome of BPD symptom severity. There were no significant differences between subgroups (test for subgroup differences: Chi2 = 1.79, df = 1 (P = 0.18), I2 = 44.2%): self‐rated SMD = −0.74 (95% CI −1.19 to −0.29; 8 trials, 408 participants; I2 = 77%; P = 0.001; Analysis 31.1.1); and clinician‐rated SMD = −0.42 (95% CI −0.58 to −0.25; 14 trials, 836 participants; I2 = 24%; P < 0.001; Analysis 31.1.2).
31.2 Psychosocial functioning
We compared the effects of self‐rated versus clinician‐rated for the outcome of psychosocial functioning. There were no significant differences between subgroups (test for subgroup differences: Chi2 = 2.86, df = 1 (P = 0.09), I2 = 65.1%): self‐rated SMD = −0.29 (95% CI −0.60 to 0.03; 12 trials, 728 participants; I2 = 76%; P = 0.07; Analysis 31.2.1); and clinician‐rated SMD = −0.66 (95% CI −0.96 to −0.37; 10 trials, 586 participants; I2 = 54%; P < 0.001; Analysis 31.2.2).
32. Types of TAU
32.1 BPD symptom severity
We compared the effects of obligatory TAU versus optional TAU for the outcome of BPD symptom severity. There were no significant differences between subgroups (test for subgroup differences: Chi2 = 0.25, df = 1 (P = 0.61), I2 = 0%): obligatory TAU SMD = −0.50 (95% CI −0.70 to −0.30; 19 trials, 1071 participants; I2 = 60%; P < 0.001; Analysis 32.1.1); and unspecified TAU SMD = −0.63 (95% CI −1.09 to ‐0.17; 3 trials, 173 participants; I2 = 36%; P = 0.007; Analysis 32.1.2).
32.2 Psychosocial functioning
We compared the effects of obligatory TAU versus optional TAU for the outcome of psychosocial functioning. There were no significant differences between subgroups (test for subgroup differences: Chi2 = 3.18, df = 1 (P = 0.07), I2 = 68.6%): obligatory TAU SMD = −0.32 (95% CI −0.56 to −0.09; 17 trials, 1002 participants; I2 = 65%; P = 0.007; Analysis 32.2.1); and unspecified TAU SMD = −0.96 (95% CI −1.62 to −0.30; 5 trials, 312 participants; I2 = 84%; P = 0.004; Analysis 32.2.2).
33. Types of comparison group
33.1 BPD symptom severity
We compared the effects of trials with TAU versus trials with waiting list for the outcome of BPD symptom severity. There were no significant differences between subgroups (test for subgroup differences: Chi2 = 0.01, df = 1 (P = 0.92), I2 = 0%): trials with TAU SMD = −0.52 (95% CI −0.70 to −0.33; 22 trials, 1244 participants; I2 = 57%; P < 0.001; Analysis 33.1.1); and trials with waiting list (SMD −0.49, 95% CI −0.93 to −0.05; 3 trials, 161 participants; I2 = 44%; P = 0.03; Analysis 33.1.2).
33.2 Psychosocial functioning
We compared the effects of trials with TAU versus trials with waiting list for the outcome of psychosocial functioning. There were no significant differences between subgroups (test for subgroup differences: Chi2 = 0.18, df = 1 (P = 0.67), I2 = 0%): trials with TAU SMD = −0.45 (95% CI −0.68 to −0.22; 22 trials, 1314 participants; I2 = 72%; P = 0.0001; Analysis 33.2.1); and trials with waiting list SMD = −0.56 (95% CI −1.01 to −0.11; 5 trials, 219 participants; I2 = 59%; P = 0.01; Analysis 33.2.2).
34. Types of scales
34.1 BPD symptom severity
We compared the effects of ZAN‐BPD versus SCID versus BEST versus BPDSI on the outcome of BPD symptom severity. There were significant differences between subgroups (test for subgroup differences: Chi2 = 15.40, df = 3 (P = 0.002), I2 = 80.5%): ZAN‐BPD SMD = −0.45 (95% CI −0.69 to −0.20; 4 trials, 261 participants; I2 = 0%; P = 0.0004; Analysis 34.1.1); SCID SMD = −0.58 (95% CI −1.16 to −0.00; 3 trials, 112 participants; I2 = 47%; P = 0.05; Analysis 34.1.2); BEST SMD = −1.10 (95% CI −1.47 to −0.72; 4 trials, 147 participants; I2 = 10%; P < 0.001; Analysis 34.1.3); and BPDSI SMD = −0.21 (95% CI −0.45 to 0.04; 4 trials, 267 participants; I2 = 0%; P = 0.10; Analysis 34.1.4. For illustrative purposes, the results of other scales from single trials are report in Analysis 34.1.5 to Analysis 34.1.11.
34.2 Psychosocial functioning
We compared the effects of the GAF versus GAS versus SAS on the outcome of psychosocial functioning. There were no significant differences between subgroups (test for subgroup differences: Chi2 = 1.39, df = 2 (P = 0.50), I2 = 0%): GAF SMD = −0.73 (95% CI −1.41 to −0.05; 4 trials, 204 participants; I2 = 78%; P = 0.04; Analysis 34.2.1); GAS SMD = −0.71 (95% CI −0.96 to −0.46; 4 trials, 330 participants; I2 = 0%; P < 0.001; Analysis 34.2.2); and SAS SMD = −0.23 (95% CI −0.99 to 0.53; 4 trials, 283 participants; I2 = 88%; P = 0.55; Analysis 34.2.3). For illustrative purposes, the results of other scales from single trials are reported in Analysis 34.2.4. to Analysis 34.2.13
Sensitivity analysis
We conducted a TSA as an sensitivity analysis on the significant findings for all primary outcomes and the secondary outcome of depression at end of treatment. The RIS was reached for BPD symptom severity, self‐harm, suicide‐related outcomes and psychosocial functioning. However, due to inconsistency for self‐harm and suicide‐related outcomes, we could only exclude the risk of a false positive finding (type 1 error) for BPD symptom severity and psychosocial functioning. The RIS was not reached for depression.
We used both the fixed‐effect and random‐effects models in all meta‐analyses. However, when there were two or more trials included in an analysis, we chose to report the results of the random‐effects model, which gives greater weight to smaller trials; where only one trial was included in an analysis, we reported the results of the fixed‐effect model. Statistical significance changed in 13 analyses and in those cases we reported the results of both the random‐effects and fixed‐effect models (see Analysis 3.7, Analysis 3.12, Analysis 4.1.3, Analysis 4.5.1, Analysis 4.7.1, Analysis 4.7.2, Analysis 4.7.4, Analysis 5.5.1, Analysis 6.4.1, Analysis 6.7.1, Analysis 14.3, Analysis 15.5, Analysis 18.12).
Discussion
Summary of main results
We considered 400 full‐text reports and, of these, we included 75 trials that randomised a total of 4507 participants. The age ranged from 14.8 to 45.7 mean years, and the majority of included persons were female. The length of the trials ranged from one to 36 months, with most of them performed in outpatient settings. We judged all included trials to be at high risk of bias.
DBT and related treatments were the most intensively studied, with more than one‐third of all included trials comparing DBT to TAU, a waiting list or an alternate active treatment (26 RCTs). Fifteen RCTs investigated the effects of CBT and related treatments, seven of which assessed MBT or eclectic treatments, five evaluated BPD‐specific psychodynamic therapies, four investigated SFT and related treatments, and three assessed STEPPS and IPT, two investigated TFP, PE or MOTR, and one evaluated CAT, ACT, JCP or motivation feedback, respectively.
In the following section, we summarise the main findings for the pooled analyses of psychotherapy versus TAU or waiting list for our primary outcomes (BPD symptom severity, self‐harm, suicide‐related outcomes and psychosocial functioning), and for those secondary outcomes that are not a part of the symptom characteristics of BPD (depression, attrition and adverse effects). We report end‐of‐treatment data. We advise the interested reader to explore the Effects of interventions section for a more elaborated description of the effect of psychotherapy on the remaining secondary outcomes, and follow‐up data. There, they will also find a complete overview of the effects of specific kinds of psychotherapy (such as DBT, MBT, CBT, etc.).
Psychotherapy versus TAU
Comparing the effects of psychotherapy with TAU, we observed significant effects for all primary outcomes at the end of treatment (summary of findings Table 1).
Psychotherapy significantly reduced BPD symptom severity (SMD −0.52, 95% CI −0.70 to −0.33; 22 trials, 1244 participants) compared with TAU. This corresponds to a MD of −3.6 (95% CI −4.4 to −2.08) on the ZAN‐BPD scale, which ranges from 0 to 36. This represents a clinically relevant improvement in BPD symptoms. The MIREDIF on this scale is −3.0 points (Crawford 2018a).
Psychotherapy also showed a significant reduction in self‐harm when measured as a continuous outcome (SMD −0.32, 95% CI −0.49 to −0.14; 13 trials, 616 participants), but not a dichotomous outcome. The significant effect of continuous outcomes corresponds to a MD of −0.816 (95% CI −1.25 to 0.35) on the DSHI, which ranges from 0 to 34. The MIREDIF on this scale is −1.25 points, which corresponds to ½ SD (Farivar 2004). Clinically, this finding does not represent an important reduction in self‐harm for people with BPD.
Additionally, suicide‐related outcomes were significantly reduced in both continuous (SMD −0.34, 95% CI −0.57 to −0.11; 13 trials, 616 participants) and dichotomous outcomes (RR 0.27, 95% CI 0.11 to 0.67; 5 trials, 396 participants). The improvement corresponded to a MD of −0.11 (95% CI −0.19 to −0.034) on the Suicidal Attempt Self Injury Interview. The MIREDIF on this scale is −0.17 points, which corresponds to ½ SD (Farivar 2004). These findings suggest that suicide‐related outcomes improved following treatment, but these improvements did not quite reach a clinically relevant level. However, when it comes to suicide or suicide attempts, any reduction is of importance.
Psychosocial functioning improved significantly following psychotherapy compared with TAU (SMD −0.45, 95% CI −0.68 to −0.22; 22 trials, 1314 participants). This corresponds to a MD of −2.8 (95% CI −4.25 to −1.38) on the GAF Scale, which ranges from 0 to 100. The MIREDIF on this scale is −4.0 points (Amri 2014); therefore, the improvement did not reach clinical relevance.
Regarding our secondary outcomes, we observed a significant reduction in depression for participants receiving psychotherapy compared to TAU (SMD −0.39, 95% CI −0.61 to −0.17; 22 trials, 1570 participants). This corresponds to −2.45 on the Hamilton Depression Scale, and does not quite reach the MIREDIF on this scale, which is 3.0 points (NICE CG90) .
Sufficient data were not available for effect size calculation for the outcome of adverse effects.
Our additional TSA on all significant findings of the primary outcomes found that the RIS was reached for all primary outcomes but not for the secondary outcome of depression. However, only for BPD symptoms severity and psychosocial functioning could we reject the possibility of type 1 error.
Only 15 trials reported on the effect following end of treatment at zero to six months, six to 12 months and > 12 months (Amianto 2011; Andreoli 2016; Bateman 1999; Blum 2008; Davidson 2006; Gleeson 2012; Gregory 2008b; Jørgensen 2013; Kredlow 2017a; Linehan 2006; McMurran 2016; Robinson 2016; Soler 2009; Van den Bosch 2005; Weinberg 2006). There was no effect on BPD severity at follow‐up when assessed as a continuous measure; however, an improvement was observed at > 12 months follow‐up in the number of people presenting with severe BPD. In addition, the number of persons with self‐harm was reduced at the zero to six months, six to 12 months and > 12 months follow‐up time points. Suicide‐related behaviour was reduced at six to 12 months follow‐up, and a reduction in the number of persons with suicidal behaviour was seen at > 12 months follow‐up. There was an improvement in psychosocial functioning at zero to six months follow‐up; however, this was not sustained at six to 12 months or at > 12 months follow‐up time points.
Regarding the secondary outcomes, there was an improvement in depression at zero to six months and > 12 months follow‐up, as well as a reduction in adverse effects at > 12 months follow‐up only. No improvement in anger, affective instability, impulsivity, emptiness, interpersonal problems or abandonment was observed at follow‐up.
Psychotherapy versus waiting list or no treatment
Comparing the effects of psychotherapy with waiting list, we observed effects in favour of psychotherapy for the primary outcomes of BPD severity (SMD −0.49, 95% CI −0.93 to −0.05; 3 trials, 161 participants) and psychosocial functioning (SMD −0.56, 95% CI −1.01 to −0.11; 5 trials, 219 participants. No clear differences were found for self‐harm and suicide‐related outcomes. See summary of findings Table 2.
We moreover observed a significant reduction in depression for participants receiving psychotherapy compared to waiting list or no treatment (SMD −1.28, 95% CI −2.21 to −0.34; 6 trials, 239 participants). No reductions were detected in attrition, and once again, sufficient data were not available for effect size calculation for the outcome of adverse effects.
Only one trial, Bellino 2010, reported on the effect following end of treatment (zero to six months, six to 12 months and > 12 months follow‐up periods). Follow‐up data were reported on psychosocial functioning, in which an improvement was observed at zero to six months and six to 12 months post‐treatment. There was no significant improvement observed at > 12 months post‐treatment. Regarding the secondary outcomes, improvements in both impulsivity and interpersonal problems were observed at zero to six months, six to 12 months and > 12 months post‐treatment. No improvement was observed in affective instability at any of the follow‐up time points.
Individual treatment approaches
Among distinct BPD‐specific therapies, most findings were based on single trials. DBT and MBT had the highest numbers of primary trials, with DBT accounting for roughly one‐third of all included trials, followed by MBT with seven RCTs.
Compared to TAU, we observed significant effects of DBT for the primary outcomes of BPD severity (SMD −0.60, 95% CI −1.05 to −0.14; 3 trials, 149 participants), self‐harm (SMD −0.28, 95% CI −0.48 to −0.07; 7 trials, 376 participants) and psychosocial functioning (SMD −0.36, 95% CI −0.69 to −0.03; 6 trials, 225 participants). MBT was found to have significant effects on self‐harm (RR 0.62, 95% CI 0.49 to 0.80; 3 trials, 252 participants) and suicidality (RR 0.10, 95% CI 0.04, 0.30, 3 trials, 218 participants). See summary of findings Table 3.
Subgroup analysis and investigation of heterogeneity
We had intended to conduct several subgroup analyses, but not all were possible due to a lack of data. See Table 1 for more information.
In one subgroup analysis, we tested for differences between psychotherapeutic approaches appearing in two or more trials. We found no significant subgroup differences between the different therapeutic approaches for BPD symptom severity and psychosocial functioning.
To test the statistical heterogeneity in our analyses of BPD symptom severity and psychosocial functioning, we added a post hoc subgroup analysis exploring the different measurement scales versus each other. We found significant differences between ZAN‐BPD, SCID, BEST and BPDSI, with BEST providing the highest effect estimate. By differentiating between scales, we found that the heterogeneity between trials was I2 = 0% with ZAN‐BPD; I2 = 47% with SCID; I2 = 10% with BEST; and I2 = 0% with BPDSI. The results suggest that much of the statistical heterogeneity found in the analysis of psychotherapy versus TAU for BPD symptom severity was due to the various scales used in trials. We found no significant differences between GAF, GAS and SAS, and no reductions in heterogeneity.
We found significant subgroup differences for BPD symptom severity for age, where the effects of psychotherapy were higher for the subgroup 'older than 18 years of age'; 'mode of therapy', with group therapy being more effective than individual or mixed therapy; and setting, with outpatient groups being more effective than inpatient groups. Additionally, we found significant differences for psychosocial functioning for setting, with the combination of inpatient and outpatient groups and inpatient groups alone showing to be more effective than outpatient groups. We found no subgroup differences for BPD symptom severity for duration and type of raters, or for psychosocial functioning for duration, mode of therapy and types of raters.
trials of psychotherapy versus TAU did not indicate any significant subgroup differences for BPD symptom severity and psychosocial functioning compared with trials of psychotherapy versus waiting list or no treatment. Likewise, we found no subgroup differences for the different types of TAU. Therefore, effect estimates do not seem to differ between comparisons with control groups consisting of any kind of unspecified intervention, such as TAU, standard care or regular appointments, and comparisons with waiting list or no treatment, the participants of which were not paid any special attention at all.
Previous review
In contrast to the previous versions of this review (Binks 2006; Stoffers‐Winterling 2012), we broadened the scope to include the treatment of adolescents also. We were able to include only three RCTs that focused solely on adolescents: the Mehlum 2014 trial on DBT‐A; the Rossouw 2012b trial on MBT‐A; and the Schuppert 2012 trial on ERT, an adaptation of STEPPS for adolescents. Another pilot RCT on HYPE + CAT + SFET included participants from ages 15 to 25 years old, with a mean age of 18.4 years (SD = 2.9) (Gleeson 2012). Subgroup analyses revealed that adolescents benefited less from psychotherapy than those older than 18 years of age. However, the power was much too low to detect any true effects, with sample sizes ranging from 10 participants (subsample of participants with five or more DSM‐IV BPD criteria in the Mehlum 2014 trial) to 97 participants (in Schuppert 2012). Notably, we only included trial samples or subsamples in which at least 70% of participants had full BPD (i.e. fulfilled a minimum of five DSM BPD criteria). Oftentimes, however, adolescents may only fulfil criteria at a subthreshold level while both their personality and BPD are still developing. Nevertheless, they might profit from BPD‐specific treatments in terms of preventing the development of full threshold BPD later in life.
Overall completeness and applicability of evidence
In most cases, we were able to calculate the effect sizes from the data reported in the included trials. If information was missing, we contacted and requested the missing information from the trial authors. Therefore, there is no evident bias within this review as a consequence of inadequate inclusion of existing data.
We rated all trials at high risk of bias, with the most prevalent risk of bias being categorised as 'other risk of bias'; that is insufficient treatment adherence, allegiance bias or attention bias, which might lead to biased data.
Participants
The majority of trials included mainly females, with only two trials solely including males (Bianchini 2019; Kamalabadi 2012). This configuration may reflect the reality of clinical settings, where approximately 75% of all BPD diagnoses are assigned to women (APA 2000). There are, however, contradictory findings pointing towards balanced proportions or an even higher prevalence in men (Sansone 2011). Men with BPD may display a different clinical picture than women, especially with antisocial features being more prevalent in men than in women with BPD (Sansone 2011). Clinically, this may mediate different treatment approaches or special requirements, which may not be reflected in most of the RCT evidence, which stems from either all female or predominantly female samples (see the Characteristics of included studies tables). In addition, in several of the included trials, full antisocial personality disorders or antisocial features were reasons for exclusion. As such, the extent to which the findings in this review are applicable to men with BPD may be limited. Level of functioning at baseline was not available in several of the included trials. However, trials that reported level of functioning using objective measures, such as GAS, GAF, CGI or SFQ, showed that the degree of illness ranged from moderate to severe. Regarding comorbidity, most trials excluded participants with severe mental disorders, organic brain disorders and mental impairments. In sum, the findings of this review may apply mainly to females with a moderate to severe level of illness, and without severe comorbid mental disorders. We do not know how the lack of this information has affected our findings, only that we cannot generalise the findings to men, to females with low levels of illness or to those with severe comorbid mental disorders. On the other hand, several trials concentrated on people with BPD plus distinct comorbidities (i.e. PTSD, depression, eating disorders or substance use disorders). Moreover, subgroups analyses revealed a significant difference, where the effect of psychotherapy on BPD symptom severity and psychosocial functioning seemed lower for adolescents. However, only three trials on adolescents were included in the review, and readers should exercise caution when drawing conclusions.
Some argue that BPD treatment should start before the condition has developed fully, and stress the importance of early assessment and treatment (Chanen 2013; Sharp 2015). Therefore, psychological interventions may also be relevant for patients who have yet to fully fulfil the DSM‐5 criteria. Nevertheless, with respect to the patient sample in this review, we only included adolescent samples if at least 70% of them fulfilled (a minimum five) DSM‐5 criteria for a diagnosis of BPD. We decided to do so in order to assure a minimum level of clinical homogeneity throughout the overall pool of trials.
Interventions
The major psychotherapeutic treatments used in the treatment of BPD (DBT, MBT, SFT, TFP) have been tested in the RCTs included in this review. However, the number of available trials per intervention vary broadly, with the majority of trials investigating DBT; a very limited number of trials assessed SFT and TFP especially, which may not reflect their prevalence in clinical practice. The vast majority of primary trials were conducted in outpatient settings. However, psychotherapy may also be provided on inpatient wards (depending on the respective health system), but only limited evidence was available for this setting. Subgroups analyses showed no evidence of significant differences between psychotherapeutic approaches, indicating that all individual types of psychotherapy are effective in treating people with BPD. Most trials allowed concurrent psychotherapy and psychotropic treatments. As such, it cannot be ruled out that the concurrent treatment may have confounded the corresponding findings. However, we only included trials if possible concurrent treatments were the same for all trial groups.
Some interesting findings revealed that group therapy might be more effective than individual or mixed therapy for reducing BPD symptom severity. However, there was no evidence of subgroup differences for psychosocial functioning. Additionally, outpatient care seemed to be more effective than inpatient care in reducing BPD symptom severity, but not in improving psychosocial functioning, where a combination of inpatient and outpatient treatment was more effective. The duration of treatment does not seem to be a factor in the improvement of BPD symptoms and psychosocial functioning.
Comparisons
The treatments used in the control groups were largely heterogeneous, including TAU, which is a common label for controls. TAU itself may differ between different treatment formats, let alone between different health systems. In some trials, participants receiving TAU were free to use any kind of care, whereas other participants in receipt of TAU were required to receive a minimum standard of care whilst taking part in the trial (see Types of interventions). Consequently, the components of TAU will most certainly vary between countries, as the standard of care is known to differ depending on the national healthcare system.
The use of a control group in randomised trials provides a point of reference from which the effect of a given intervention is measured against. As such, a 'clean' control group is essential when we want to obtain insight into the magnitude of treatment effects and potential adverse effects. In psychiatric research, there is a lack of consensus on what constitutes an appropriate control intervention (Finch 2019). In accordance, we found that control groups across trials were heterogeneous and included, for example, TAU, standard care or waiting list. In 72% of the included trials, either psychotherapeutic treatment was a part of the control intervention or concomitant psychotherapy was allowed while participating in the trial (for more information see Characteristics of included studies tables). As such, a majority of trials compared psychotherapeutic therapy against another intervention that included psychotherapeutic elements. The willingness to let people affected by BPD continue with different variations of psychotherapeutic therapy while included in a control group may indicate a general concern of otherwise withholding them from an important treatment. Yet a drawback of this approach is that it could potentially mask the difference in treatment effects between the control and intervention groups. Concurrently, we found that effects sizes were small, heterogeneous and largely insignificant for the majority of comparisons. There is a substantial need for larger, well‐performed randomised trials that include standardised control groups before we can make firmer conclusions about the effects of psychological therapies in BPD.
Outcomes
The individual trials included a great variety of outcomes, with only minor consensus on what constituted core outcomes for BPD and how these ideally should be assessed. We identified high heterogeneity and significant differences between scales for BPD symptom severity, which might indicate that different scales may give different effect estimates. We found no significant differences between scales for psychosocial functioning, and there were no significant differences for self‐rated and clinician‐rated outcomes. In addition, core symptoms, such as fewer interpersonal conflicts or crises that both caregivers and people with BPD may consider essential when searching for helpful treatments, are sometimes neglected. The outcome of attrition must be interpreted with caution, as the likelihood of leaving a trial may depend on the specific type of control group used. For example, participants assigned to waiting lists may be more likely to leave a trial early than participants assigned to TAU or participants who are provided with regular appointments. Geographical conditions and accessibility of study centres can also play an important role, as rural regions with long distances to study centres may lead to higher dropout rates than urban settings (Blum 2008 trial completer analysis: high dropouts).
Most trials did not consider adverse effects but did consider suicidal or self‐harming behaviour. These outcomes were categorised as primary outcomes in this review (see Appendix 4) and are usually classified as severe adverse effects. Future randomised trials should not only concentrate on these outcomes, but also transparently report non‐serious adverse effects that occur during BPD treatment. Adverse effects of importance would include increased impulsive behaviour or substance use. Such outcomes may occur if psychotherapy induces excessive emotional arousal with which the affected person is not (yet) able to cope (Berk 2009).
For more information, see the Characteristics of included studies tables, where we describe the characteristics of each included trial in greater detail.
Quality of the evidence
We rated the quality of evidence using the GRADE approach, based on the following considerations; risk of bias, inconsistency, indirectness, imprecision and publication bias.
We assessed the risk of bias in all trials in accordance with the Cochrane Handbook for Systematic Reviews of Interventions (Higgins 2019). The majority of the trials were prone to selection bias, as well as attrition and reporting bias. High risk of bias in randomised clinical trials has been shown to overestimate benefits and underestimate harms (Kjaergard 2001; Lundh 2012; Moher 1998; Savović 2012a; Savović 2012b; Schulz 1995; Wood 2008). The results are based on 75 trials that involved a limited number of people (n = 4507). Most trials included small sample sizes, with the number of participants ranging from 7 to 151 in the individual trials. Heterogeneity in the reporting of outcomes and the interventions investigated in the individual trials hindered the pooling of effect estimates. Except for DBT, ERGT, MBT and MOTR, the review findings are based largely on single trial effects that could not be pooled. The small samples and inability to pool results led to imprecise effect estimates.
The highest risk of bias we observed in the individual trials was for the category of 'other bias', covering attention, affiliation or adherence bias. We rated approximately two‐thirds of trials (49 out of 75) as having a high risk of bias, and another 21 RCTs as having an unclear risk of bias, leaving only five (i.e. 6.7%) RCTs at low risk of bias. We rated two‐thirds of trials as having either a high or an unclear risk of bias in terms of both incomplete outcome data and selective reporting (only 19 trials out of 75 had a low risk of bias in these categories). We rated half or more of the trials as having applied appropriate means of random sequence generation, allocation concealment, and blinding of outcome assessment.
From the analyses regarding psychotherapy and DBT versus waiting list or no treatment for suicide‐related outcomes and depression, we found one trial to be an outlier (Mohamadizadeh 2017). The trial was rated at high risk of bias due to unclear risks of bias in all domains. To ensure transparency, we did not exclude it from the analyses. However, sensitivity analyses showed that the trial's inclusion did not change any conclusions on the aforementioned outcomes.
Notably, there were only two RCTs out of 75 that included medication‐free patients only. The majority of trials allowed participants to continue their respective drug treatments. There were no reports of different medication rates between the groups at baseline from any trial. Apart from those trials that included medication as a compulsory part of their respective treatment regimens for both groups (Bellino 2006; Bellino 2007; Bellino 2010; Jahangard 2012), 24 trials reported on actual medication use during the trial observation period: 17 found no difference in medication use between the groups (Antonsen 2017; Blum 2008; Bohus 2013; Bos 2010; Doering 2010; Elices 2016; Gleeson 2012; Leichsenring 2016; Lin 2019; Linehan 2015a; McMain 2009; McMain 2017; Mohamadizadeh 2017; Reneses 2013; Schuppert 2012; Sinnaeve 2018; Van den Bosch 2005); six reported a higher use of medications in their control groups (Bateman 1999; Bateman 2009; Gregory 2008; Linehan 1994; Linehan 2006; Turner 2000); and only one found a higher rate in the active treatment group (Andreoli 2016). Therefore, medication use as a possible confounding variable can be ruled out whenever beneficial effects for the experimental group were observed.
Potential biases in the review process
This review was designed to minimise the risk of potential biases. We developed a protocol, Storebø 2018, for this review in accordance with the Cochrane Handbook for Systematic Reviews of Interventions (Higgins 2019). We conducted extensive searches of relevant databases, with no restrictions in language, publication year, publication type or publication status. Two independent review authors selected appropriate trials, extracted data, assessed the risk of bias and graded the quality of the evidence. Disagreements were resolved through discussion. We conducted a TSA, to estimate the RIS needed to either detect or reject a certain intervention effect.
With regard to our inclusion criteria (Criteria for considering studies for this review), we tried to retain a homogeneous pool of primary trials. However, there were some inconsistencies between trials, particularly pertaining to psychiatric comorbidity of trial participants. For example, although the presence of a substance‐related disorder was a common exclusion criterion (see Types of participants), two trials required participants to have such a disorder (Gregory 2008b; Santisteban 2015), and another trial included a mixed sample of participants with and without substance abuse problems (Van den Bosch 2005). In addition, the severity of illness varied between trials, ranging from severe to mild.
We also went to great effort to try and obtain unpublished data pertaining to BPD subsamples where the full sample included fewer than 70% of participants with full BPD. We were able to obtain such subsample data from some trials, but in other cases, trial authors did not respond. We do not know why they did not respond, but it is possible that the subsample data we received are biased in a positive way (i.e. being associated with desired findings).
Agreements and disagreements with other studies or reviews
This updated review has a new conclusion compared to the review published in 2012 (Stoffers‐Winterling 2012). The 2012 review concluded that there were indications of beneficial effects for psychological therapies for BPD core pathology and associated general psychopathology. The overall findings supported a substantial role for psychotherapy in the treatment of people with BPD. However, the authors also reported that the treatments did not have a very robust evidence base, as there were some concerns regarding the quality of individual trials, and therefore indicated a need for replication trials (Stoffers‐Winterling 2012). Following the update of this review, we are now able to state, for the first time, that BPD‐specific psychotherapy seem to be better than usual or control treatments for reducing BPD severity in persons affected by BPD, with effect sizes of clinical relevance. This change in conclusion may result from the following: in 2012, only 28 trials were available for inclusion, and any comparisons were done on treatment approach levels. This means that the review authors did not pool any kind of BPD‐specific treatment, only DBT, MBT and so on. This new review has used updated methods, including a broader search strategy, and thus a new protocol was published in 2018 (Storebø 2018). What is more, this version is the first to include the required information sizes, for at least some comparisons, on the level of BPD‐specific approaches in general (see summary of findings Table 1), allowing for drawing conclusions on a much more reliable basis.
Our review is in partial agreement with the review by Cristea and colleagues who found that psychotherapy, especially DBT and psychodynamic approaches, are effective for borderline symptoms and related problems (Cristea 2017). Similarly, we found that psychotherapy appears to be more effective than usual treatment at improving BPD symptoms; however, we found no clear differences between the various treatments. We agree that DBT treatments in particular, seem to have a more robust evidence base, due to more clinical trials having been conducted. This discrepancy in conclusions may be due to differences in methodological approach. The study by Cristea and colleagues searched for data in only four databases and included only one publication per trial. They also did not use subsamples of persons with BPD and did not perform an assessment of the overall quality of the evidence. Taken together these limitations suggest that their conclusions may be too optimistic (Faltinsen 2017).
Matthijs Oud and colleagues published a review in 2018 (Oud 2018), which investigated the effects of specialised psychotherapy for BPD. In contrast to our review, they focused on four BPD‐specific treatments (DBT, MBT, SFT, and TFP) and only included adult samples, resulting in the inclusion of 20 trials. In line with the findings of this review, they reported moderate‐quality evidence that psychotherapy is effective in reducing overall BPD severity (SMD of −0.59 compared to our SMD of −0.52). We took a broader approach and included all types of psychotherapy conducted in participants of all ages, which resulted in a more complete picture of the area with a larger evidence base (Oud and colleagues included only 321 participants in their analysis of BPD severity compared to 1244 participants in our analysis of the same outcome).

Study flow diagram

Risk of bias graph: review authors' judgements about each risk of bias item presented as percentages across all included studies.

Risk of bias summary: review authors' judgements about each risk of bias item for each included study.

Trial Sequential Analysis on primary outcome: Psychotherapy ‐ borderline symptom severity at end of treatment

Funnel plot of comparison 1: Psychotherapy versus TAU, outcome: 1.1 Primary outcome: BPD symptom severity.

Trial Sequential Analysis on primary outcome: Psychotherapy ‐ self‐harm at end of treatment

Funnel plot of comparison: 1 Psychotherapy versus TAU, outcome: 1.3 Primary outcome: self‐harm.
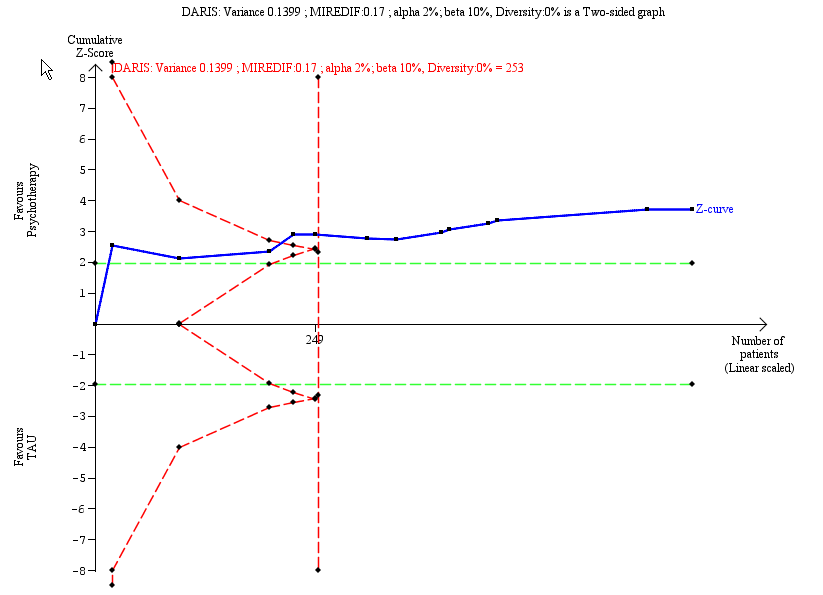
Trial Sequential Analysis on primary outcome: Psychotherapy ‐ suicide‐related outcomes at end of treatment

Funnel plot of comparison: 1 Psychotherapy compared with TAU, outcome: 1.5 Primary outcome: suicide‐related outcomes.

Trial Sequential Analysis on primary outcome: Psychotherapy ‐ psychosocial functioning at end of treatment

Funnel plot of comparison: 1 Psychotherapy compared with TAU, outcome: 1.7 Primary outcome: psychosocial functioning.
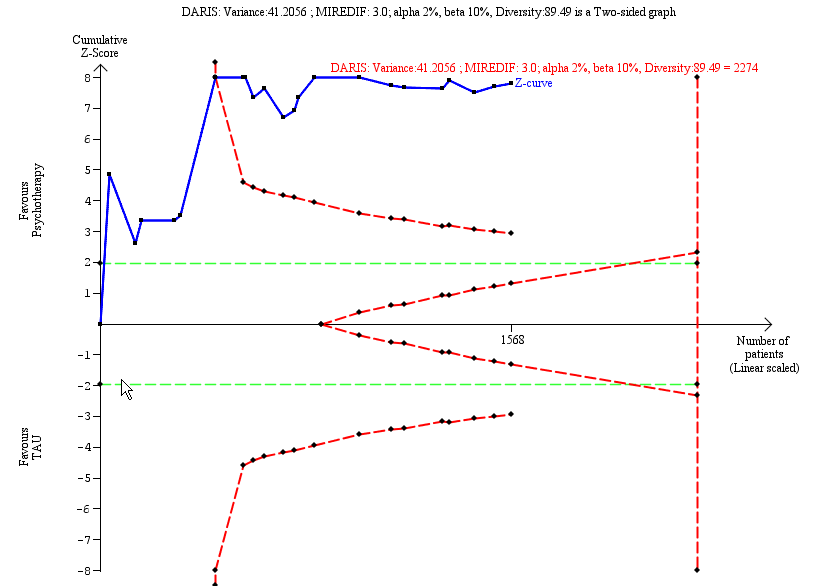
Trial Sequential Analysis on secondary outcome: Psychotherapy ‐ depression at end of treatment

Comparison 1: Psychotherapy vs TAU, Outcome 1: Primary: BPD symptom severity (continuous)

Comparison 1: Psychotherapy vs TAU, Outcome 2: Primary: BPD symptom severity (dichotomous), at above 12 months follow‐up

Comparison 1: Psychotherapy vs TAU, Outcome 3: Primary: self‐harm (continuous)

Comparison 1: Psychotherapy vs TAU, Outcome 4: Primary: self‐harm (dichotomous)

Comparison 1: Psychotherapy vs TAU, Outcome 5: Primary: suicide‐related outcomes (continuous)

Comparison 1: Psychotherapy vs TAU, Outcome 6: Primary: suicide‐related outcomes (dichotomous)

Comparison 1: Psychotherapy vs TAU, Outcome 7: Primary: psychosocial functioning (continuous)

Comparison 1: Psychotherapy vs TAU, Outcome 8: Secondary: anger (continuous)

Comparison 1: Psychotherapy vs TAU, Outcome 9: Secondary: affective instability (continuous)

Comparison 1: Psychotherapy vs TAU, Outcome 10: Secondary: chronic feelings of emptiness (continuous)

Comparison 1: Psychotherapy vs TAU, Outcome 11: Secondary: impulsivity (continuous)

Comparison 1: Psychotherapy vs TAU, Outcome 12: Secondary: impulsivity (dichotomous), at end of treatment

Comparison 1: Psychotherapy vs TAU, Outcome 13: Secondary: interpersonal problems (continuous)

Comparison 1: Psychotherapy vs TAU, Outcome 14: Secondary: abandonment (continuous)

Comparison 1: Psychotherapy vs TAU, Outcome 15: Secondary: identity disturbance (continuous)

Comparison 1: Psychotherapy vs TAU, Outcome 16: Secondary: dissociation and psychotic‐like symptoms (continuous)

Comparison 1: Psychotherapy vs TAU, Outcome 17: Secondary: depression (continuous)

Comparison 1: Psychotherapy vs TAU, Outcome 18: Secondary: depression (dichotomous), at end of treatment

Comparison 1: Psychotherapy vs TAU, Outcome 19: Secondary: attrition (dichotomous)

Comparison 1: Psychotherapy vs TAU, Outcome 20: Secondary: non‐serious adverse effects (dichotomous), at end of treatment

Comparison 1: Psychotherapy vs TAU, Outcome 21: Secondary: serious adverse effects (dichotomous), at end of treatment

Comparison 2: Acceptance and commitment therapy (ACT) vs TAU, Outcome 1: Primary: BPD symptom severity (continuous), at end of treatment

Comparison 2: Acceptance and commitment therapy (ACT) vs TAU, Outcome 2: Secondary: affective instability (continuous), at end of treatment

Comparison 2: Acceptance and commitment therapy (ACT) vs TAU, Outcome 3: Secondary: depression (continuous), at end of treatment

Comparison 2: Acceptance and commitment therapy (ACT) vs TAU, Outcome 4: Secondary: attrition (dichotomous), at end of treatment

Comparison 3: Dialectical behavior therapy (DBT) vs TAU, Outcome 1: Primary: BPD symptom severity (continuous), at end of treatment

Comparison 3: Dialectical behavior therapy (DBT) vs TAU, Outcome 2: Primary, self‐harm (continuous)

Comparison 3: Dialectical behavior therapy (DBT) vs TAU, Outcome 3: Primary: suicide‐related outcomes (continuous), at end of treatment

Comparison 3: Dialectical behavior therapy (DBT) vs TAU, Outcome 4: Primary: suicide‐related outcomes, attempts (dichotomous), at end of treatment

Comparison 3: Dialectical behavior therapy (DBT) vs TAU, Outcome 5: Primary: psychosocial functioning (continuous), at end of treatment

Comparison 3: Dialectical behavior therapy (DBT) vs TAU, Outcome 6: Secondary: anger (continuous)

Comparison 3: Dialectical behavior therapy (DBT) vs TAU, Outcome 7: Secondary: affective instability (continuous), at end of treatment

Comparison 3: Dialectical behavior therapy (DBT) vs TAU, Outcome 8: Secondary: chronic feelings of emptiness (continuous), at end of treatment

Comparison 3: Dialectical behavior therapy (DBT) vs TAU, Outcome 9: Secondary: impulsivity (continuous)

Comparison 3: Dialectical behavior therapy (DBT) vs TAU, Outcome 10: Secondary: interpersonal problems (continuous), at end of treatment

Comparison 3: Dialectical behavior therapy (DBT) vs TAU, Outcome 11: Secondary: dissociation and psychotic‐like symptoms (continuous), at end of treatment

Comparison 3: Dialectical behavior therapy (DBT) vs TAU, Outcome 12: Secondary: depression (continuous)

Comparison 3: Dialectical behavior therapy (DBT) vs TAU, Outcome 13: Secondary: attrition (dichotomous)

Comparison 3: Dialectical behavior therapy (DBT) vs TAU, Outcome 14: Secondary: adverse effects (dichotomous), at end of treatment

Comparison 3: Dialectical behavior therapy (DBT) vs TAU, Outcome 15: Secondary: serious adverse effects (dichotomous), at end of treatment

Comparison 4: Mentalisation based therapy (MBT) vs TAU, Outcome 1: Primary: BPD symptom severity (continuous)

Comparison 4: Mentalisation based therapy (MBT) vs TAU, Outcome 2: Primary: self‐harm (continuous), at end of treatment

Comparison 4: Mentalisation based therapy (MBT) vs TAU, Outcome 3: Primary: self‐harm (dichotomous)

Comparison 4: Mentalisation based therapy (MBT) vs TAU, Outcome 4: Primary: suicide‐related outcomes (dichotomous)

Comparison 4: Mentalisation based therapy (MBT) vs TAU, Outcome 5: Primary: psychosocial functioning (continuous)

Comparison 4: Mentalisation based therapy (MBT) vs TAU, Outcome 6: Secondary: interpersonal problems (continuous)

Comparison 4: Mentalisation based therapy (MBT) vs TAU, Outcome 7: Secondary: depression (continuous)

Comparison 4: Mentalisation based therapy (MBT) vs TAU, Outcome 8: Secondary: depression (dichotomous), at end of treatment

Comparison 4: Mentalisation based therapy (MBT) vs TAU, Outcome 9: Secondary: attrition (dichotomous), at end of treatment

Comparison 4: Mentalisation based therapy (MBT) vs TAU, Outcome 10: Secondary: adverse effects (dichotomous), at end of treatment

Comparison 4: Mentalisation based therapy (MBT) vs TAU, Outcome 11: Mentalisation‐based treatment for eating disorders (MBT‐ED) versus specialist supportive clinical management (SSCM‐ED) (generic inverse variance)

Comparison 5: Cognitive behavioural therapy (CBT) and related treatments vs TAU, Outcome 1: Primary: BPD symptom severity (continuous)

Comparison 5: Cognitive behavioural therapy (CBT) and related treatments vs TAU, Outcome 2: Primary: BPD symptom severity (dichotomous), at above 12 months follow‐up

Comparison 5: Cognitive behavioural therapy (CBT) and related treatments vs TAU, Outcome 3: Primary: self‐harm (continuous)

Comparison 5: Cognitive behavioural therapy (CBT) and related treatments vs TAU, Outcome 4: Primary: self‐harm (dichotomous), at end of treatment

Comparison 5: Cognitive behavioural therapy (CBT) and related treatments vs TAU, Outcome 5: Primary: suicide‐related outcomes (continuous)

Comparison 5: Cognitive behavioural therapy (CBT) and related treatments vs TAU, Outcome 6: Primary: psychosocial functioning (continuous)

Comparison 5: Cognitive behavioural therapy (CBT) and related treatments vs TAU, Outcome 7: Secondary: interpersonal problems (continuous)

Comparison 5: Cognitive behavioural therapy (CBT) and related treatments vs TAU, Outcome 8: Secondary: dissociation and psychotic‐like symptoms (continuous)

Comparison 5: Cognitive behavioural therapy (CBT) and related treatments vs TAU, Outcome 9: Secondary: depression (continuous)

Comparison 5: Cognitive behavioural therapy (CBT) and related treatments vs TAU, Outcome 10: Secondary: attrition (dichotomous), at end of treatment

Comparison 5: Cognitive behavioural therapy (CBT) and related treatments vs TAU, Outcome 11: Secondary: adverse effects (dichotomous), at end of treatment

Comparison 6: Psychodynamic psychotherapy vs TAU, Outcome 1: Primary: BPD symptom severity (continuous)

Comparison 6: Psychodynamic psychotherapy vs TAU, Outcome 2: Primary: self‐harm (continuous)

Comparison 6: Psychodynamic psychotherapy vs TAU, Outcome 3: Primary: suicide‐related outcomes (continuous)

Comparison 6: Psychodynamic psychotherapy vs TAU, Outcome 4: Primary: psychosocial functioning (continuous)

Comparison 6: Psychodynamic psychotherapy vs TAU, Outcome 5: Secondary: anger (continuous)

Comparison 6: Psychodynamic psychotherapy vs TAU, Outcome 6: Secondary: affective instability (continuous)

Comparison 6: Psychodynamic psychotherapy vs TAU, Outcome 7: Secondary: chronic feelings of emptiness (continuous)

Comparison 6: Psychodynamic psychotherapy vs TAU, Outcome 8: Secondary: impulsivity (continuous)

Comparison 6: Psychodynamic psychotherapy vs TAU, Outcome 9: Secondary: interpersonal problems (continuous)

Comparison 6: Psychodynamic psychotherapy vs TAU, Outcome 10: Secondary: abandonment (continuous)

Comparison 6: Psychodynamic psychotherapy vs TAU, Outcome 11: Secondary: identity disturbance (continuous)

Comparison 6: Psychodynamic psychotherapy vs TAU, Outcome 12: Secondary: dissociation and psychotic‐like symptoms (continuous)

Comparison 6: Psychodynamic psychotherapy vs TAU, Outcome 13: Secondary: depression (continuous)

Comparison 6: Psychodynamic psychotherapy vs TAU, Outcome 14: Secondary: attrition (dichotomous), at end of treatment

Comparison 7: Schema‐focused therapy (SFT) vs TAU, Outcome 1: Primary: BPD symptom severity (continuous), at end of treatment

Comparison 7: Schema‐focused therapy (SFT) vs TAU, Outcome 2: Primary: psychosocial functioning (continuous), at end of treatment

Comparison 7: Schema‐focused therapy (SFT) vs TAU, Outcome 3: Secondary: affective instability (continuous), at end of treatment

Comparison 7: Schema‐focused therapy (SFT) vs TAU, Outcome 4: Secondary: impulsivity (continuous), at end of treatment

Comparison 7: Schema‐focused therapy (SFT) vs TAU, Outcome 5: Secondary: interpersonal problems (continuous), at end of treatment

Comparison 7: Schema‐focused therapy (SFT) vs TAU, Outcome 6: Secondary: dissociation and psychotic‐like symptoms (continuous), at end of treatment

Comparison 7: Schema‐focused therapy (SFT) vs TAU, Outcome 7: Secondary: attrition (dichotomous), at end of treatment

Comparison 8: Systems training for emotional predictability and problem solving (STEPPS) vs TAU, Outcome 1: Primary: BPD symptom severity (continuous), at end of treatment

Comparison 8: Systems training for emotional predictability and problem solving (STEPPS) vs TAU, Outcome 2: Primary: self‐harm (dichtomous), at end of treatment

Comparison 8: Systems training for emotional predictability and problem solving (STEPPS) vs TAU, Outcome 3: Primary: psychosocial functioning (continuous)

Comparison 8: Systems training for emotional predictability and problem solving (STEPPS) vs TAU, Outcome 4: Secondary: affective instability (continuous), at end of treatment

Comparison 8: Systems training for emotional predictability and problem solving (STEPPS) vs TAU, Outcome 5: Secondary: impulsivity (continuous), at end of treatment

Comparison 8: Systems training for emotional predictability and problem solving (STEPPS) vs TAU, Outcome 6: Secondary: impulsivity (dichotomous), at end of treatment

Comparison 8: Systems training for emotional predictability and problem solving (STEPPS) vs TAU, Outcome 7: Secondary: interpersonal problems (continuous), at end of treatment

Comparison 8: Systems training for emotional predictability and problem solving (STEPPS) vs TAU, Outcome 8: Secondary: dissociation and psychotic‐like symptoms (continuous), at end of treatment

Comparison 8: Systems training for emotional predictability and problem solving (STEPPS) vs TAU, Outcome 9: Secondary: depression (continuous), at end of treatment

Comparison 8: Systems training for emotional predictability and problem solving (STEPPS) vs TAU, Outcome 10: Secondary: attrition (dichotomous), at end of treatment

Comparison 9: Cognitive analytic therapy (CAT) vs TAU, Outcome 1: Primary: suicide‐related outcomes (continuous)

Comparison 9: Cognitive analytic therapy (CAT) vs TAU, Outcome 2: Primary: psychosocial functioning (continuous)

Comparison 9: Cognitive analytic therapy (CAT) vs TAU, Outcome 3: Secondary: anger (continuous)

Comparison 9: Cognitive analytic therapy (CAT) vs TAU, Outcome 4: Secondary: dissociation and psychotic‐like symptoms (continuous)

Comparison 9: Cognitive analytic therapy (CAT) vs TAU, Outcome 5: Secondary: depression (continuous)

Comparison 9: Cognitive analytic therapy (CAT) vs TAU, Outcome 6: Secondary: attrition (dichotomous), at end of treatment

Comparison 10: Motivation feedback (MF) vs TAU, Outcome 1: Primary: psychosocial functioning, at end of treatment

Comparison 11: Psychoeducation vs TAU, Outcome 1: Secondary: depression (continuous), at end of treatment

Comparison 11: Psychoeducation vs TAU, Outcome 2: Secondary: attrition (dichotomous), at end of treatment

Comparison 12: Transference‐focused psychotherapy (TFP) vs TAU, Outcome 1: Primary: BPD symptom severity (continuous), at end of treatment

Comparison 12: Transference‐focused psychotherapy (TFP) vs TAU, Outcome 2: Primary: self‐harm (dichotomous), at end of treatment

Comparison 12: Transference‐focused psychotherapy (TFP) vs TAU, Outcome 3: Primary: suicide‐related outcomes (dichotomous), at end of treatment

Comparison 12: Transference‐focused psychotherapy (TFP) vs TAU, Outcome 4: Primary: psychosocial functioning (continuous), at end of treatment

Comparison 12: Transference‐focused psychotherapy (TFP) vs TAU, Outcome 5: Secondary: depression (continuous), at end of treatment

Comparison 12: Transference‐focused psychotherapy (TFP) vs TAU, Outcome 6: Secondary: attrition (dichotomous), at end of treatment

Comparison 13: Once‐only interventions (individual setting) vs TAU, Outcome 1: Primary: self‐harm (continuous), at end of treatment

Comparison 13: Once‐only interventions (individual setting) vs TAU, Outcome 2: Primary: psychosocial functioning (continuous), at end of treatment

Comparison 13: Once‐only interventions (individual setting) vs TAU, Outcome 3: Secondary: depression (continuous), at end of treatment

Comparison 13: Once‐only interventions (individual setting) vs TAU, Outcome 4: Secondary: attrition (dichotomous), at end of treatment

Comparison 14: Eclectic treatments vs TAU, Outcome 1: Primary: BPD symptom severity (continuous), at end of treatment

Comparison 14: Eclectic treatments vs TAU, Outcome 2: Primary: self‐harm (continuous), at end of treatment

Comparison 14: Eclectic treatments vs TAU, Outcome 3: Primary: suicide‐related outcomes (continuous), at end of treatment

Comparison 14: Eclectic treatments vs TAU, Outcome 4: Primary: psychosocial functioning (continuous)

Comparison 14: Eclectic treatments vs TAU, Outcome 5: Secondary: anger (continuous), at end of treatment

Comparison 14: Eclectic treatments vs TAU, Outcome 6: Secondary: affective instability (continuous), at end of treatment

Comparison 14: Eclectic treatments vs TAU, Outcome 7: Secondary: chronic feelings of emptiness (continuous), at end of treatment

Comparison 14: Eclectic treatments vs TAU, Outcome 8: Secondary: impulsivity (continuous), at end of treatment

Comparison 14: Eclectic treatments vs TAU, Outcome 9: Secondary: interpersonal problems (continuous), at end of treatment

Comparison 14: Eclectic treatments vs TAU, Outcome 10: Secondary: abandonment (continuous), at end of treatment

Comparison 14: Eclectic treatments vs TAU, Outcome 11: Secondary: identity disturbance (continuous), at end of treatment

Comparison 14: Eclectic treatments vs TAU, Outcome 12: Secondary: depression (continuous), at end of treatment

Comparison 14: Eclectic treatments vs TAU, Outcome 13: Secondary: attrition (dichotomuous), at end of treatment

Comparison 14: Eclectic treatments vs TAU, Outcome 14: Secondary: adverse effects (dichotomous), at end of treatment

Comparison 15: Psychotherapy vs waiting list or no treatment, Outcome 1: Primary: BPD symptom severity (continuous), at end of treatment

Comparison 15: Psychotherapy vs waiting list or no treatment, Outcome 2: Primary: self‐harm (continuous), at end of treatment

Comparison 15: Psychotherapy vs waiting list or no treatment, Outcome 3: Primary: suicide‐related outcomes (continuous), at end of treatment

Comparison 15: Psychotherapy vs waiting list or no treatment, Outcome 4: Primary: psychosocial functioning (continuous)

Comparison 15: Psychotherapy vs waiting list or no treatment, Outcome 5: Secondary: anger (continuous), at end of treatment

Comparison 15: Psychotherapy vs waiting list or no treatment, Outcome 6: Secondary: affective instability (continuous)

Comparison 15: Psychotherapy vs waiting list or no treatment, Outcome 7: Secondary: chronic feelings of emptiness (continuous), at end of treatment

Comparison 15: Psychotherapy vs waiting list or no treatment, Outcome 8: Secondary: impulsivity (continuous)

Comparison 15: Psychotherapy vs waiting list or no treatment, Outcome 9: Secondary: interpersonal problems (continuous)

Comparison 15: Psychotherapy vs waiting list or no treatment, Outcome 10: Secondary: abandonment (continuous), at end of treatment

Comparison 15: Psychotherapy vs waiting list or no treatment, Outcome 11: Secondary: identity disturbance (continuous), at end of treatment

Comparison 15: Psychotherapy vs waiting list or no treatment, Outcome 12: Secondary: dissociation and psychotic‐like symptoms (continuous), at end of treatment

Comparison 15: Psychotherapy vs waiting list or no treatment, Outcome 13: Secondary: depression (continuous), at end of treatment

Comparison 15: Psychotherapy vs waiting list or no treatment, Outcome 14: Secondary: attrition (dichotomous), at end of treatment

Comparison 16: Dialectical behavior therapy (DBT) vs waiting list or no treatment, Outcome 1: Primary: BPD symptom severity (continuous), at end of treatment

Comparison 16: Dialectical behavior therapy (DBT) vs waiting list or no treatment, Outcome 2: Primary: self‐harm (continuous), at end of treatment

Comparison 16: Dialectical behavior therapy (DBT) vs waiting list or no treatment, Outcome 3: Primary: suicide‐related outcomes (continuous), at end of treatment

Comparison 16: Dialectical behavior therapy (DBT) vs waiting list or no treatment, Outcome 4: Primary: psychosocial functioning (continuous), at end of treatment

Comparison 16: Dialectical behavior therapy (DBT) vs waiting list or no treatment, Outcome 5: Secondary: anger (continuous), at end of treatment

Comparison 16: Dialectical behavior therapy (DBT) vs waiting list or no treatment, Outcome 6: Secondary: affective instability (continuous), at end of treatment

Comparison 16: Dialectical behavior therapy (DBT) vs waiting list or no treatment, Outcome 7: Secondary: impulsivity (continuous), at end of treatment

Comparison 16: Dialectical behavior therapy (DBT) vs waiting list or no treatment, Outcome 8: Secondary: dissociation and psychotic‐like symptoms (continuous), at end of treatment

Comparison 16: Dialectical behavior therapy (DBT) vs waiting list or no treatment, Outcome 9: Secondary: depression (continuous), at end of treatment

Comparison 16: Dialectical behavior therapy (DBT) vs waiting list or no treatment, Outcome 10: DBT‐couple therapy (CDBT) vs waiting list (generic inverse variance)

Comparison 17: Schema‐focused therapy (SFT) vs no treatment, Outcome 1: Primary: suicide‐related outcomes (continuous), at end of treatment

Comparison 17: Schema‐focused therapy (SFT) vs no treatment, Outcome 2: Secondary: depression (continuous), at end of treatment

Comparison 18: Interpersonal psychotherapy (IPT) vs waiting list, Outcome 1: Primary: BPD symptom severity (continuous), at end of treatment

Comparison 18: Interpersonal psychotherapy (IPT) vs waiting list, Outcome 2: Primary: self‐harm (continuous), at end of treatment

Comparison 18: Interpersonal psychotherapy (IPT) vs waiting list, Outcome 3: Primary: psychosocial functioning (continuous)

Comparison 18: Interpersonal psychotherapy (IPT) vs waiting list, Outcome 4: Secondary: anger (continuous), at end of treatment

Comparison 18: Interpersonal psychotherapy (IPT) vs waiting list, Outcome 5: Secondary: affective instability (continuous)

Comparison 18: Interpersonal psychotherapy (IPT) vs waiting list, Outcome 6: Secondary: chronic feelings of emptiness (continuous), at end of treatment

Comparison 18: Interpersonal psychotherapy (IPT) vs waiting list, Outcome 7: Secondary: impulsivity (continuous)

Comparison 18: Interpersonal psychotherapy (IPT) vs waiting list, Outcome 8: Secondary: interpersonal problems (continuous)

Comparison 18: Interpersonal psychotherapy (IPT) vs waiting list, Outcome 9: Secondary: abandonment (continuous), at end of treatment

Comparison 18: Interpersonal psychotherapy (IPT) vs waiting list, Outcome 10: Secondary: identity disturbance (continuous), at end of treatment

Comparison 18: Interpersonal psychotherapy (IPT) vs waiting list, Outcome 11: Secondary: dissociation and psychotic‐like symptoms (continuous), at end of treatment

Comparison 18: Interpersonal psychotherapy (IPT) vs waiting list, Outcome 12: Secondary outcome: depression (continuous), at end of treatment

Comparison 18: Interpersonal psychotherapy (IPT) vs waiting list, Outcome 13: Secondary outcome: attrition (dichotomous), at end of treatment

Comparison 19: Once‐only interventions (individual setting) vs waiting list, Outcome 1: Secondary: impulsivity (continuous), at end of treatment

Comparison 19: Once‐only interventions (individual setting) vs waiting list, Outcome 2: Secondary: interpersonal problems (continuous), at end of treatment

Comparison 19: Once‐only interventions (individual setting) vs waiting list, Outcome 3: Secondary: attrition (dichotomous), at end of treatment

Comparison 20: Eclectic treatments vs waiting list, Outcome 1: Primary outcome: psychosocial functioning (continuous), at end of treatment

Comparison 20: Eclectic treatments vs waiting list, Outcome 2: Secondary outcome: interpersonal problems (continuous), at end of treatment

Comparison 21: Dialectical behavior therapy (DBT) and related treatments vs active treatment, Outcome 1: Standard DBT (DBT) vs client‐centred therapy (CCT) (continuous)

Comparison 21: Dialectical behavior therapy (DBT) and related treatments vs active treatment, Outcome 2: DBT vs CCT, secondary: attrition (dichotomous), at end of treatment

Comparison 21: Dialectical behavior therapy (DBT) and related treatments vs active treatment, Outcome 3: Standard DBT (DBT) vs good psychiatric management (GPM) (continuous)

Comparison 21: Dialectical behavior therapy (DBT) and related treatments vs active treatment, Outcome 4: DBT vs GPM, secondary: attrition (dichotomous), at end of treatment

Comparison 21: Dialectical behavior therapy (DBT) and related treatments vs active treatment, Outcome 5: Standard DBT (DBT) vs individual DBT therapy + activities group (DBT‐I) (continuous)

Comparison 21: Dialectical behavior therapy (DBT) and related treatments vs active treatment, Outcome 6: DBT vs DBT‐I, secondary: attrition (dichotomous), at end of treatment

Comparison 21: Dialectical behavior therapy (DBT) and related treatments vs active treatment, Outcome 7: Standard DBT (DBT) vs skills training group + individual case management (DBT‐S) (continuous)

Comparison 21: Dialectical behavior therapy (DBT) and related treatments vs active treatment, Outcome 8: DBT vs DBT‐S, secondary: attrition (dichotomous), at 6‐12 months follow‐up

Comparison 21: Dialectical behavior therapy (DBT) and related treatments vs active treatment, Outcome 9: Standard DBT (DBT) vs step‐down DBT (DBT‐SD) (continuous)

Comparison 21: Dialectical behavior therapy (DBT) and related treatments vs active treatment, Outcome 10: DBT vs DBT‐SD, secondary: attrition (dichotomous), at end of treatment

Comparison 21: Dialectical behavior therapy (DBT) and related treatments vs active treatment, Outcome 11: Standard DBT (DBT) vs DBT Prolonged Exposure (PE) (continuous)

Comparison 21: Dialectical behavior therapy (DBT) and related treatments vs active treatment, Outcome 12: DBT vs DBT‐PE, secondary: attrition (dichotomous), at 0‐6 months follow‐up

Comparison 21: Dialectical behavior therapy (DBT) and related treatments vs active treatment, Outcome 13: DBT skills group + case management (DBT‐S) vs DBT individual therapy + activity group (DBT‐I) (continuous)

Comparison 21: Dialectical behavior therapy (DBT) and related treatments vs active treatment, Outcome 14: DBT‐S vs DBT‐I, secondary: attrition (dichotomous), at 6‐12 months follow‐up

Comparison 21: Dialectical behavior therapy (DBT) and related treatments vs active treatment, Outcome 15: DBT skills group (DBT‐S) vs cognitive therapy group (CT‐G) (continuous)

Comparison 21: Dialectical behavior therapy (DBT) and related treatments vs active treatment, Outcome 16: DBT‐S vs CT‐G, secondary: attrition (dichotomous), at end of treatment

Comparison 21: Dialectical behavior therapy (DBT) and related treatments vs active treatment, Outcome 17: DBT skills group (DBT‐S) vs schema‐focused therapy group (SFT‐G)

Comparison 21: Dialectical behavior therapy (DBT) and related treatments vs active treatment, Outcome 18: DBT mindfulness group (DBT‐M) vs DBT interpersonal effectiveness group (DBT‐IE) (continuous)

Comparison 21: Dialectical behavior therapy (DBT) and related treatments vs active treatment, Outcome 19: DBT‐M vs DBT‐IE, secondary: attrition (dichotomous), at end of treatment

Comparison 21: Dialectical behavior therapy (DBT) and related treatments vs active treatment, Outcome 20: DBT mindfulness group (DBT‐M) vs loving‐kindness and compassion meditation (LK/CM), primary: BPD symptom severity (continuous), at end of treatment

Comparison 22: Cognitive behavioural therapy (CBT) and related treatments vs active treatment, Outcome 1: CBT vs trauma‐ and anxiety‐related group psychoeducation (continuous)

Comparison 22: Cognitive behavioural therapy (CBT) and related treatments vs active treatment, Outcome 2: CBT vs trauma‐ and anxiety‐related group psychoeducation, secondary: attrition (dichotomous), at end of treatment

Comparison 22: Cognitive behavioural therapy (CBT) and related treatments vs active treatment, Outcome 3: CBT vs interpersonal psychotherapy (IPT) (continuous)

Comparison 22: Cognitive behavioural therapy (CBT) and related treatments vs active treatment, Outcome 4: CBT vs IPT, secondary: attrition (dichotomous), at end of treatment

Comparison 22: Cognitive behavioural therapy (CBT) and related treatments vs active treatment, Outcome 5: CBT vs Rogerian supportive therapy (continuous)

Comparison 22: Cognitive behavioural therapy (CBT) and related treatments vs active treatment, Outcome 6: CBT vs Rogerian supportive therapy, secondary: attrition (dichotomous), end of treatment

Comparison 22: Cognitive behavioural therapy (CBT) and related treatments vs active treatment, Outcome 7: MACT (Manual‐assisted Cognitive Therapy) vs MACT + therapeutic assessment (MACT + TA) (continuous)

Comparison 22: Cognitive behavioural therapy (CBT) and related treatments vs active treatment, Outcome 8: MACT vs MACT + TA, secondary: attrition (dichotomous), at end of treatment

Comparison 22: Cognitive behavioural therapy (CBT) and related treatments vs active treatment, Outcome 9: Meta‐Cognitive training for BPD (B‐MCT) vs progressive muscle relaxation training (PMR)

Comparison 22: Cognitive behavioural therapy (CBT) and related treatments vs active treatment, Outcome 10: B‐MCT vs progressive muscle relaxation (PMR) training + TAU (dichotomous). Secondary: attrition (dichotomous), at end of treatment

Comparison 22: Cognitive behavioural therapy (CBT) and related treatments vs active treatment, Outcome 11: MOTR (Motive‐Oriented Therapeutic Relationship) vs Good Psychiatric Management (GPM) (continuous)

Comparison 22: Cognitive behavioural therapy (CBT) and related treatments vs active treatment, Outcome 12: MOTR vs (GPM), secondary: attrition (dichotomous), at end of treatment

Comparison 23: Schema‐focused therapy (SFT) vs active treatment, Outcome 1: SFT vs TFP. Primary: BPD symptom severity (continuous), at end of treatment

Comparison 23: Schema‐focused therapy (SFT) vs active treatment, Outcome 2: SFT vs TFP. Secondary: attrition (dichotomous), at 0‐6 months follow‐up

Comparison 23: Schema‐focused therapy (SFT) vs active treatment, Outcome 3: SFT vs SFT + therapist availability (TA). Primary: BPD symptom severity (continuous), at end of treatment

Comparison 23: Schema‐focused therapy (SFT) vs active treatment, Outcome 4: SFT vs SFT + TA. Secondary: attrition (dichotomous), 0‐6 months follow‐up

Comparison 24: Systems training for emotional predictability and problem solving‐based psychoeducation (STEPPS‐PE) vs cognitive rehabilitation (CR), Outcome 1: STEPPS‐PE vs CR

Comparison 24: Systems training for emotional predictability and problem solving‐based psychoeducation (STEPPS‐PE) vs cognitive rehabilitation (CR), Outcome 2: STEPPS‐PE vs CR. Secondary: attrition (dichotomous), at end of treatment

Comparison 25: Eclectic treatments vs active treatment, Outcome 1: Combined inpatient and outpatient psychotherapy versus outpatient psychotherapy

Comparison 25: Eclectic treatments vs active treatment, Outcome 2: Combined inpatient and outpatient psychotherapy versus outpatient psychotherapy. Secondary: attrition (dichotomous), at end of treatment

Comparison 25: Eclectic treatments vs active treatment, Outcome 3: integrative BPD‐oriented adolescent family therapy (I‐BAFT) vs individual drug counselling (IDC)

Comparison 26: Subgroup analysis: therapeutic approaches, Outcome 1: BPD symptom severity

Comparison 26: Subgroup analysis: therapeutic approaches, Outcome 2: Psychosocial functioning

Comparison 27: Subgroup analysis: age, Outcome 1: BPD symptom severity

Comparison 28: Subgroup analysis: duration, Outcome 1: BPD symptom severity

Comparison 28: Subgroup analysis: duration, Outcome 2: Psychosocial functioning

Comparison 29: Subgroup analysis: mode of therapy, Outcome 1: BPD symptom severity

Comparison 29: Subgroup analysis: mode of therapy, Outcome 2: Psychosocial functioning

Comparison 30: Subgroup analysis: setting, Outcome 1: BPD symptom severity

Comparison 30: Subgroup analysis: setting, Outcome 2: Psychosocial functioning

Comparison 31: Subgroup analysis: types of raters, Outcome 1: BPD symptom severity

Comparison 31: Subgroup analysis: types of raters, Outcome 2: Psychosocial functioning

Comparison 32: Subgroup analysis: types of TAU, Outcome 1: BPD symptom severity

Comparison 32: Subgroup analysis: types of TAU, Outcome 2: Psychosocial functioning

Comparison 33: Subgroup analysis: type of comparison group, Outcome 1: BPD symptom severity

Comparison 33: Subgroup analysis: type of comparison group, Outcome 2: Psychosocial functioning

Comparison 34: Subgroup analysis: types of scales, Outcome 1: BPD symptom severity

Comparison 34: Subgroup analysis: types of scales, Outcome 2: Psychosocial functioning

Comparison 35: TSA sensitivity analyses: psychotherapy versus TAU, Outcome 1: Primary: BPD symptom severity, at end of treatment

Comparison 35: TSA sensitivity analyses: psychotherapy versus TAU, Outcome 2: Primary: self‐harm

Comparison 35: TSA sensitivity analyses: psychotherapy versus TAU, Outcome 3: Primary: suicide‐related outcomes

Comparison 35: TSA sensitivity analyses: psychotherapy versus TAU, Outcome 4: Primary: psychosocial functioning, at end of treatment

Comparison 35: TSA sensitivity analyses: psychotherapy versus TAU, Outcome 5: Secondary: depression
| Psychotherapy versus treatment‐as‐usual | ||||||
| Patient or population: borderline personality disorder Settings: inpatient and outpatient Intervention: psychotherapy Comparison: treatment‐as‐usual (TAU) | ||||||
| Outcomes | Illustrative comparative risks* (95% CI) | Relative effect(95% CI) | Number of participants (RCTs) | Quality of the evidence (GRADE) | Comments | |
|---|---|---|---|---|---|---|
| Assumed risk | Corresponding risk | |||||
| TAU | Psychotherapy | |||||
| BPD symptom severity Measured by: clinicians and self‐rated Timing of outcome assessment: end of treatment | ‐ | The mean score in the intervention groups was 0.52 SD lower (0.70 lower to 0.33 lower) | ‐ | 1244 (22 RCTs) | ⊕⊕⊕⊝ Moderatea | The SMD of −0.52 corresponds to −3.6 on the Zanarini BPD scale. The MIREDIF on this scale is 3.0 points TSA adjusted Cl = −5.49 to −1.90 on the Zanarini BPD scale TSA RIS = 901 |
| Self‐harm (frequency) Measured by: clinicians and self‐rated Timing of outcome assessment: end of treatment | ‐ | The mean score in the intervention groups was 0.32 SD lower (0.49 lower to 0.14 lower) | ‐ | 616 (13 RCTs) | ⊕⊕⊝⊝ | The SMD of −0. 32 corresponds to −0.82 on the DSHI. The MIREDIF on this scale is −1.25 points (½ SD) TSA adjusted CI = −0.59 to −0.08 on the DSHI TSA RIS = 97 |
| Suicide‐related outcomes (suicidality) Measured by: clinicians and self‐rated Timing of outcome assessment: end of treatment | ‐ | The mean score in the intervention groups was 0.34 SD lower (0.57 lower to 0.11 lower) | ‐ | 666 (13 RCTs) | ⊕⊕⊝⊝ Lowa,b | The SMD of −0. 34 corresponds to −0.11 on the SASII. The MIREDIF on this scale is −0.17 points (½ SD) TSA adjusted CI = −0.18 to −0.04 on the SASII TSA RIS = 253 |
| Psychosocial functioning Measured by: clinicians and self‐rated Timing of outcome assessment: end of treatment | ‐ | The mean score in the intervention groups was 0.45 SD lower (0.68 lower to 0.22 lower) | ‐ | 1314 (22 RCTs) | ⊕⊕⊝⊝ | The SMD of −0.45 corresponds to −2.8 on the GAF. The MIREDIF on this scale is −4.0 points TSA adjusted CI = −3.97 to −1.94 on the GAF TSA RIS = 947 |
| Depression Measured by: clinicians and self‐rated Timing of outcome assessment: end of treatment | ‐ | The mean score in the intervention groups was 0.39 SD lower (0.61 lower to 0.17 lower) | ‐ | 1568 (22 RCTs) | ⊕⊝⊝⊝ | The SMD of ‐0.45 corresponds to −2.45 on the Hamilton Depression Scale. The MIREDIF on this scale is 3.0 points TSA adjusted CI = −3.34 to −1.72 on the Hamilton Depression Scale TSA RIS = 2274 |
| Attrition Timing of outcome assessment: end of treatment | 328 per 1000 | 328 per 1000 (95% CI 56 fewer to 66 higher) | RR 1.00 (95% CI 0.83 to 1.20) | 2225 (32 RCTs) | ⊕⊕⊝⊝ | ‐ |
| Adverse effects Timing of outcome assessment: end of treatment | 74 per 1000 | 6 per 1000 (95% CI 41 fewer to 65 higher) | RR 0.92 (95% CI 0.45 to 1.88) | 381 (2 RCTs) | ⊕⊕⊝⊝ | ‐ |
| *The basis for the assumed risk (e.g. the median control group risk across studies) is provided in footnotes. The corresponding risk (and its 95% CI) is based on the assumed risk in the comparison group and the relative effect of the intervention (and its 95% CI). CI: Confidence interval; DSHI: Deliberate Self‐Harm Inventory; GAF: Global Assessment of Functioning scale; MIREDIF: Minimum relevant difference; RCTs: Randomised controlled trials; RIS: Required information size; RR: Risk Ratio; SASII: Suicide Attempt Self‐Injury Interview; SD: Standard deviation; SMD: Standardised mean difference; TAU: treatment‐as‐usual; TSA: Trial Sequential Analysis | ||||||
| GRADE Working Group grades of evidence | ||||||
| aWe downgraded the quality of this evidence by one level due to risk of bias (other bias). | ||||||
| Psychotherapy versus waiting list or no treatment | ||||||
| Patient or population: borderline personality disorder Settings: inpatient and outpatient Intervention: psychotherapy Comparison: waiting list or no treatment | ||||||
| Outcomes | Illustrative comparative risks* (95% CI) | Relative effect (95% CI) | Number of participants (RCTs) | Quality of the evidence (GRADE) | Comments | |
|---|---|---|---|---|---|---|
| Assumed risk | Corresponding risk | |||||
| Waiting list or no treatment | Psychotherapy | |||||
| BPD symptom severity Measured by: clinicians and self‐rated Timing of outcome assessment: end of treatment | ‐ | The mean score in the intervention groups was 0.49 SD lower (0.93 lower to 0.05 lower) | ‐ | 161 (3 RCTs) | ⊕⊕⊝⊝ | An SMD of 0.49 represents a moderate effect. |
| Self‐harm Measured by: clinicians and self‐rated Timing of outcome assessment: end of treatment | ‐ | The mean score in the intervention groups was0.17 SD lower (0.52 lower to 0.18 higher) | ‐ | 128 (2 RCTs) | ⊕⊕⊝⊝ | An SMD of 0.17 represents a small effect. |
| Suicide‐related outcomes Measured by: self‐rated Timing of outcome assessment: end of treatment | ‐ | The mean score in the intervention groups was 5.62 SD lower (16.39 lower to 5.16 higher) | ‐ | 108 (2 RCTs) | ⊕⊝⊝⊝ Verylowa,b,c | An SMD of 5.62 represents a large effect. |
| Psychosocial functioning Measured by: clinicians and self‐rated Timing of outcome assessment: end of treatment | ‐ | The mean score in the intervention groups was 0.56 SD lower (1.01 lower to 0.11 lower) | ‐ | 219 (5 RCTs) | ⊕⊕⊝⊝ | An SMD of 0.56 represents a moderate effect. |
| Depression Measured by: clinicians and self‐rated Timing of outcome assessment: end of treatment | ‐ | The mean score in the intervention groups was 1.28 SD lower (2.21 lower to 0.34 lower) | ‐ | 239 (6 RCTs) | ⊕⊕⊝⊝ | An effect size of 1.28 represents a large effect. |
| Attrition Timing of outcome assessment: end of treatment | 81 per 1000 | 147 per 1000 (95% CI 118 fewer to 74 higher) | RR 0.55 (95% CI 0.20 to 1.50) | 144 (3 RCTs) | ⊕⊝⊝⊝ | ‐ |
| Adverse effects (not measured | See comments | See comments | ‐ | ‐ | ‐ | No studies were found that assessed this outcome |
| *The basis for the assumed risk (e.g. the median control group risk across studies) is provided in footnotes. The corresponding risk (and its 95% CI) is based on the assumed risk in the comparison group and the relative effect of the intervention (and its 95% CI). CI: Confidence interval; RCTs: Randomised controlled trials; RR: Risk ratio; SMD: Standardized mean difference | ||||||
| GRADE Working Group grades of evidence | ||||||
| aWe downgraded the quality of this evidence by one level due to risk of bias. | ||||||
| Dialectical behavioural therapy or mentalisation‐based therapy versus treatment‐as‐usual | ||||||
| Patient or population: borderline personality disorder Settings: inpatient and outpatient Intervention: dialectical behavioural therapy (DBT) or mentalisation‐based therapy (MBT) Comparison: treatment‐as‐usual (TAU) | ||||||
| Outcomes | Illustrative comparative risks* (95% CI) | Relative effect (95% CI) | Number of participants (RCTs) | Quality of the evidence (GRADE) | Comments | |
|---|---|---|---|---|---|---|
| Assumed risk | Corresponding risk | |||||
| TAU | DBT or MBT | |||||
| DBT | ||||||
| BPD severity Measured by: clinicians Timing of outcome assessment: end of treatment | ‐ | The mean score in the intervention groups was 0.60 SD lower (1.05 lower to 0.14 lower) | ‐ | 149 (3 RCTs) | ⊕⊕⊝⊝ | An SMD of 0.60 represents a moderate effect. |
| Self‐harm Measured by: clinicians Timing of outcome assessment: end of treatment | ‐ | The mean score in the intervention groups was | ‐ | 376 (7 RCTs) | ⊕⊕⊝⊝ | An SMD of 0.28 represents a small effect. |
| Psychosocial functioning Measured by: clinicians and self‐rated Timing of outcome assessment: end of treatment | ‐ | The mean score in the intervention groups was 0.36 SD lower (0.69 lower to 0.03 lower) | ‐ | 225 (6 RCTs) | ⊕⊕⊝⊝ | An SMD of 0.36 represents a small effect. |
| MBT | ||||||
| Self‐harm Measured by: clinicians Timing of outcome assessment: end of treatment | 631 per 1000 | 240 per 1000 (95% CI 334 fewer to 126 fewer) | RR 0.62 (95% CI 0.49 to 0.80) | 252 (3 RCTs) | ⊕⊕⊝⊝ | ‐ |
| Suicide‐related outcomes Measured by: clinicians Timing of outcome assessment: end of treatment | 298 per 1000 | 268 per 1000 (95% CI 286 fewer to 209 fewer) | RR 0.10 (95% CI 0.04 to 0.30) | 218 (3 RCTs) | ⊕⊕⊝⊝ | ‐ |
| *The basis for the assumed risk (e.g. the median control group risk across studies) is provided in footnotes. The corresponding risk (and its 95% CI) is based on the assumed risk in the comparison group and the relative effect of the intervention (and its 95% CI). CI: Confidence interval; DBT: Dialectical behavioural therapy; MBT: Mentalisation‐based therapy; RCTs: Randomised controlled trials; RR: Risk ratio; SMD: Standardized mean difference; TAU: Treatment‐as‐usual | ||||||
| GRADE Working Group grades of evidence | ||||||
| aWe downgraded the quality of this evidence by one level due to risk of bias. | ||||||
| Section | Protocol (Storebø 2018) | Review |
|---|---|---|
| Unit of analysis issues | Cross‐over trials We would have included cross‐over trials. We planned to include data up to the point of first cross‐over (first period only; Curtin 2002). We did not intend to use data from subsequent periods due to the likelihood of carry‐over effects from the preceding treatment(s). We planned not to combine repeated participant interventions in one meta‐analysis. | We did not include any cross‐over trial. |
| Cluster‐randomised trials Had trials used cluster randomisation, we would have anticipated that investigators would have presented their results after appropriately controlling for clustering effects (robust standard errors or hierarchical linear models). If it had been unclear whether a cluster‐randomised trial had used appropriate controls for clustering, we would have contacted the investigators for further information. We would have requested and re‐analysed individual patient data using multilevel models that controlled for clustering, if appropriate controls had not been used. Following this, we would have analysed effect sizes and standard errors in RevMan 5 (Review Manager 2014), using the generic inverse method (Higgins 2011). If there had been insufficient information to control for clustering, we would have entered outcome data using individuals as the units of analysis, and then conducted a sensitivity analysis to assess the potential biasing effects of inadequately controlled cluster‐randomised trials (Donner 2002). If individual participant data had not been available, we would have looked for information on intra‐class correlation coefficients to adjust for the potential clustering effects. | We did not include any cluster‐randomised trial. | |
| Adjustment for multiplicity We planned to adjust the P values and CIs for multiplicity due to the many secondary outcome comparisons following the method described by Jakobsen 2014. | We only adjusted the primary outcomes and one secondary outcomes for multiplicity, i.e. those outcomes presented in the SoF table. | |
| Dealing with missing data | Had dichotomous data not been presented on the basis of ITT data, we would have added the number of participants lost in each group to the participants with unfavourable results, acting on the assumption that most people with BPD do not get lost at random. | We were unable to perform this analysis due to insufficient information |
| Subgroup analysis and investigation of heterogeneity | We intended to conduct subgroup analyses to make hypotheses about the subgroups mentioned below.
| We did not conduct these preplanned analyses because of lack of data. |
| Sensitivity analysis | We intended to assess the impact of heterogeneity on the overall pooled effect estimate by removing studies ('outliers') that contributed to heterogeneity. We intended to remove outliers one by one and assess the impact on the overall outcome.
| We were not able to perform these analyses, due to a lack of sufficient data. |
| TSA | We intended to calculate post hoc, low bias, risk diversity‐adjusted required information size TSA analyses for the primary outcomes. | We were not able to perform these analyses with low risk of bias trials. |
| BPD: borderline personality disorder; CI: confidence interval;ITT: intention to treat; TAU: treatment‐as‐usual | ||
| Outcome or subgroup title | No. of studies | No. of participants | Statistical method | Effect size |
| 1.1 Primary: BPD symptom severity (continuous) Show forest plot | 23 | Std. Mean Difference (IV, Random, 95% CI) | Subtotals only | |
| 1.1.1 End of treatment | 22 | 1244 | Std. Mean Difference (IV, Random, 95% CI) | ‐0.52 [‐0.70, ‐0.33] |
| 1.1.2 0‐6 months follow‐up | 2 | 41 | Std. Mean Difference (IV, Random, 95% CI) | ‐0.59 [‐1.23, 0.05] |
| 1.1.3 6‐12 months follow‐up | 2 | 157 | Std. Mean Difference (IV, Random, 95% CI) | ‐0.04 [‐0.36, 0.27] |
| 1.1.4 12 months and over follow‐up | 2 | 97 | Std. Mean Difference (IV, Random, 95% CI) | ‐0.94 [‐2.58, 0.70] |
| 1.2 Primary: BPD symptom severity (dichotomous), at above 12 months follow‐up Show forest plot | 1 | Risk Ratio (IV, Fixed, 95% CI) | Subtotals only | |
| 1.3 Primary: self‐harm (continuous) Show forest plot | 13 | Std. Mean Difference (IV, Random, 95% CI) | Subtotals only | |
| 1.3.1 End of treatment | 13 | 616 | Std. Mean Difference (IV, Random, 95% CI) | ‐0.32 [‐0.49, ‐0.14] |
| 1.3.2 0‐6 months follow‐up | 1 | 28 | Std. Mean Difference (IV, Random, 95% CI) | ‐0.52 [‐1.28, 0.23] |
| 1.3.3 6‐12 months follow‐up | 3 | 174 | Std. Mean Difference (IV, Random, 95% CI) | ‐0.18 [‐0.48, 0.12] |
| 1.4 Primary: self‐harm (dichotomous) Show forest plot | 6 | Risk Ratio (IV, Random, 95% CI) | Subtotals only | |
| 1.4.1 End of treatment | 6 | 513 | Risk Ratio (IV, Random, 95% CI) | 0.85 [0.63, 1.14] |
| 1.4.2 0‐6 months follow‐up | 1 | 41 | Risk Ratio (IV, Random, 95% CI) | 0.14 [0.04, 0.56] |
| 1.4.3 6‐12 months follow‐up | 1 | 41 | Risk Ratio (IV, Random, 95% CI) | 0.27 [0.10, 0.68] |
| 1.4.4 12 months and over follow‐up | 1 | 41 | Risk Ratio (IV, Random, 95% CI) | 0.33 [0.15, 0.76] |
| 1.5 Primary: suicide‐related outcomes (continuous) Show forest plot | 13 | Std. Mean Difference (IV, Random, 95% CI) | Subtotals only | |
| 1.5.1 End of treatment | 13 | 666 | Std. Mean Difference (IV, Random, 95% CI) | ‐0.34 [‐0.57, ‐0.11] |
| 1.5.2 0‐6 months follow‐up | 2 | 36 | Std. Mean Difference (IV, Random, 95% CI) | ‐0.43 [‐1.10, 0.23] |
| 1.5.3 6‐12 months follow‐up | 2 | 109 | Std. Mean Difference (IV, Random, 95% CI) | ‐0.42 [‐0.80, ‐0.04] |
| 1.5.4 Above 12 months follow‐up | 1 | 76 | Std. Mean Difference (IV, Random, 95% CI) | ‐0.31 [‐0.77, 0.14] |
| 1.6 Primary: suicide‐related outcomes (dichotomous) Show forest plot | 5 | Risk Ratio (IV, Random, 95% CI) | Subtotals only | |
| 1.6.1 End of treatment | 5 | 396 | Risk Ratio (IV, Random, 95% CI) | 0.27 [0.11, 0.67] |
| 1.6.2 0‐6 months follow‐up | 1 | 41 | Risk Ratio (IV, Random, 95% CI) | 0.25 [0.06, 1.05] |
| 1.6.3 Above 12 months follow‐up | 1 | 41 | Risk Ratio (IV, Random, 95% CI) | 0.29 [0.11, 0.74] |
| 1.7 Primary: psychosocial functioning (continuous) Show forest plot | 23 | Std. Mean Difference (IV, Random, 95% CI) | Subtotals only | |
| 1.7.1 End of treatment | 22 | 1314 | Std. Mean Difference (IV, Random, 95% CI) | ‐0.45 [‐0.68, ‐0.22] |
| 1.7.2 0‐6 months follow‐up | 1 | 9 | Std. Mean Difference (IV, Random, 95% CI) | ‐1.23 [‐2.74, 0.29] |
| 1.7.3 6‐12 months follow‐up | 3 | 247 | Std. Mean Difference (IV, Random, 95% CI) | ‐0.09 [‐0.40, 0.23] |
| 1.7.4 Above 12 months follow‐up | 6 | 499 | Std. Mean Difference (IV, Random, 95% CI) | ‐0.27 [‐0.60, 0.05] |
| 1.8 Secondary: anger (continuous) Show forest plot | 8 | Std. Mean Difference (IV, Random, 95% CI) | Subtotals only | |
| 1.8.1 End of treatment | 8 | 323 | Std. Mean Difference (IV, Random, 95% CI) | ‐0.38 [‐0.64, ‐0.12] |
| 1.8.2 0‐6 months follow‐up | 1 | 8 | Std. Mean Difference (IV, Random, 95% CI) | ‐1.20 [‐2.82, 0.41] |
| 1.8.3 6‐12 months follow‐up | 2 | 111 | Std. Mean Difference (IV, Random, 95% CI) | ‐0.12 [‐0.50, 0.25] |
| 1.8.4 Above 12 months follow‐up | 1 | 80 | Std. Mean Difference (IV, Random, 95% CI) | 0.02 [‐0.42, 0.46] |
| 1.9 Secondary: affective instability (continuous) Show forest plot | 12 | Std. Mean Difference (IV, Random, 95% CI) | Subtotals only | |
| 1.9.1 End of treatment | 12 | 620 | Std. Mean Difference (IV, Random, 95% CI) | ‐0.68 [‐0.98, ‐0.39] |
| 1.9.2 6‐12 months follow‐up | 1 | 33 | Std. Mean Difference (IV, Random, 95% CI) | ‐0.52 [‐1.21, 0.18] |
| 1.10 Secondary: chronic feelings of emptiness (continuous) Show forest plot | 4 | Std. Mean Difference (IV, Random, 95% CI) | Subtotals only | |
| 1.10.1 End of treatment | 4 | 187 | Std. Mean Difference (IV, Random, 95% CI) | ‐0.39 [‐0.69, ‐0.10] |
| 1.10.2 6‐12 months follow‐up | 1 | 33 | Std. Mean Difference (IV, Random, 95% CI) | ‐0.58 [‐1.28, 0.11] |
| 1.11 Secondary: impulsivity (continuous) Show forest plot | 10 | Std. Mean Difference (IV, Random, 95% CI) | Subtotals only | |
| 1.11.1 End of treatment | 10 | 491 | Std. Mean Difference (IV, Random, 95% CI) | ‐0.54 [‐0.84, ‐0.25] |
| 1.11.2 6‐12 months follow‐up | 2 | 77 | Std. Mean Difference (IV, Random, 95% CI) | 0.32 [‐0.13, 0.77] |
| 1.12 Secondary: impulsivity (dichotomous), at end of treatment Show forest plot | 1 | Risk Ratio (IV, Fixed, 95% CI) | Subtotals only | |
| 1.13 Secondary: interpersonal problems (continuous) Show forest plot | 18 | Std. Mean Difference (IV, Random, 95% CI) | Subtotals only | |
| 1.13.1 End of treatment | 18 | 1159 | Std. Mean Difference (IV, Random, 95% CI) | ‐0.42 [‐0.68, ‐0.16] |
| 1.13.2 0‐6 months follow‐up | 1 | 53 | Std. Mean Difference (IV, Random, 95% CI) | ‐0.41 [‐1.01, 0.20] |
| 1.13.3 6‐12 months follow‐up | 2 | 132 | Std. Mean Difference (IV, Random, 95% CI) | ‐0.17 [‐0.65, 0.32] |
| 1.13.4 Above 12 months follow‐up | 3 | 172 | Std. Mean Difference (IV, Random, 95% CI) | 0.00 [‐0.54, 0.54] |
| 1.14 Secondary: abandonment (continuous) Show forest plot | 2 | Std. Mean Difference (IV, Random, 95% CI) | Subtotals only | |
| 1.14.1 End of treatment | 2 | 84 | Std. Mean Difference (IV, Random, 95% CI) | ‐0.22 [‐0.66, 0.21] |
| 1.14.2 6‐12 months follow‐up | 1 | 33 | Std. Mean Difference (IV, Random, 95% CI) | ‐0.39 [‐1.08, 0.30] |
| 1.15 Secondary: identity disturbance (continuous) Show forest plot | 4 | Std. Mean Difference (IV, Random, 95% CI) | Subtotals only | |
| 1.15.1 End of treatment | 4 | 250 | Std. Mean Difference (IV, Random, 95% CI) | ‐0.37 [‐0.84, 0.10] |
| 1.15.2 6‐12 months follow‐up | 1 | 33 | Std. Mean Difference (IV, Random, 95% CI) | ‐1.09 [‐1.83, ‐0.35] |
| 1.16 Secondary: dissociation and psychotic‐like symptoms (continuous) Show forest plot | 6 | Std. Mean Difference (IV, Random, 95% CI) | Subtotals only | |
| 1.16.1 End of treatment | 6 | 244 | Std. Mean Difference (IV, Random, 95% CI) | ‐0.47 [‐0.85, ‐0.10] |
| 1.16.2 0‐6 months follow‐up | 2 | 35 | Std. Mean Difference (IV, Random, 95% CI) | ‐0.97 [‐1.69, ‐0.26] |
| 1.16.3 6‐12 months follow‐up | 1 | 33 | Std. Mean Difference (IV, Random, 95% CI) | ‐0.59 [‐1.29, 0.11] |
| 1.16.4 12 months and over follow‐up | 1 | 24 | Std. Mean Difference (IV, Random, 95% CI) | ‐0.01 [‐0.81, 0.79] |
| 1.17 Secondary: depression (continuous) Show forest plot | 22 | Std. Mean Difference (IV, Random, 95% CI) | Subtotals only | |
| 1.17.1 End of treatment | 22 | 1568 | Std. Mean Difference (IV, Random, 95% CI) | ‐0.39 [‐0.61, ‐0.17] |
| 1.17.2 0‐6 months follow‐up | 4 | 125 | Std. Mean Difference (IV, Random, 95% CI) | ‐0.80 [‐1.26, ‐0.34] |
| 1.17.3 6‐12 months follow‐up | 3 | 260 | Std. Mean Difference (IV, Random, 95% CI) | ‐0.40 [‐0.95, 0.16] |
| 1.17.4 12 months and over follow‐up | 5 | 311 | Std. Mean Difference (IV, Random, 95% CI) | ‐0.40 [‐0.74, ‐0.06] |
| 1.18 Secondary: depression (dichotomous), at end of treatment Show forest plot | 1 | Risk Ratio (IV, Fixed, 95% CI) | Subtotals only | |
| 1.19 Secondary: attrition (dichotomous) Show forest plot | 33 | Risk Ratio (M‐H, Random, 95% CI) | Subtotals only | |
| 1.19.1 End of treatment | 32 | 2225 | Risk Ratio (M‐H, Random, 95% CI) | 1.00 [0.83, 1.20] |
| 1.19.2 0‐6 months follow‐up | 1 | 60 | Risk Ratio (M‐H, Random, 95% CI) | 0.58 [0.34, 1.00] |
| 1.20 Secondary: non‐serious adverse effects (dichotomous), at end of treatment Show forest plot | 2 | 381 | Risk Ratio (M‐H, Random, 95% CI) | 0.92 [0.45, 1.88] |
| 1.21 Secondary: serious adverse effects (dichotomous), at end of treatment Show forest plot | 4 | 571 | Risk Ratio (IV, Fixed, 95% CI) | 0.86 [0.14, 5.09] |
| Outcome or subgroup title | No. of studies | No. of participants | Statistical method | Effect size |
| 2.1 Primary: BPD symptom severity (continuous), at end of treatment Show forest plot | 1 | Mean Difference (IV, Fixed, 95% CI) | Subtotals only | |
| 2.2 Secondary: affective instability (continuous), at end of treatment Show forest plot | 1 | Mean Difference (IV, Fixed, 95% CI) | Subtotals only | |
| 2.3 Secondary: depression (continuous), at end of treatment Show forest plot | 1 | Mean Difference (IV, Fixed, 95% CI) | Subtotals only | |
| 2.4 Secondary: attrition (dichotomous), at end of treatment Show forest plot | 1 | Risk Ratio (M‐H, Fixed, 95% CI) | Subtotals only | |
| Outcome or subgroup title | No. of studies | No. of participants | Statistical method | Effect size |
| 3.1 Primary: BPD symptom severity (continuous), at end of treatment Show forest plot | 3 | 149 | Std. Mean Difference (IV, Random, 95% CI) | ‐0.60 [‐1.05, ‐0.14] |
| 3.2 Primary, self‐harm (continuous) Show forest plot | 7 | Std. Mean Difference (IV, Random, 95% CI) | Subtotals only | |
| 3.2.1 End of treatment | 7 | 376 | Std. Mean Difference (IV, Random, 95% CI) | ‐0.28 [‐0.48, ‐0.07] |
| 3.2.2 6‐12 months follow‐up | 2 | 141 | Std. Mean Difference (IV, Random, 95% CI) | ‐0.26 [‐0.59, 0.07] |
| 3.3 Primary: suicide‐related outcomes (continuous), at end of treatment Show forest plot | 5 | 231 | Std. Mean Difference (IV, Random, 95% CI) | ‐0.23 [‐0.68, 0.23] |
| 3.4 Primary: suicide‐related outcomes, attempts (dichotomous), at end of treatment Show forest plot | 1 | Risk Ratio (M‐H, Fixed, 95% CI) | Subtotals only | |
| 3.5 Primary: psychosocial functioning (continuous), at end of treatment Show forest plot | 6 | 225 | Std. Mean Difference (IV, Random, 95% CI) | ‐0.36 [‐0.69, ‐0.03] |
| 3.6 Secondary: anger (continuous) Show forest plot | 5 | Std. Mean Difference (IV, Random, 95% CI) | Subtotals only | |
| 3.6.1 End of treatment | 5 | 230 | Std. Mean Difference (IV, Random, 95% CI) | ‐0.47 [‐0.86, ‐0.09] |
| 3.6.2 6‐12 months follow‐up | 1 | 78 | Std. Mean Difference (IV, Random, 95% CI) | ‐0.17 [‐0.62, 0.27] |
| 3.6.3 Above 12 months follow‐up | 1 | 80 | Std. Mean Difference (IV, Random, 95% CI) | 0.02 [‐0.42, 0.46] |
| 3.7 Secondary: affective instability (continuous), at end of treatment Show forest plot | 2 | 80 | Std. Mean Difference (IV, Random, 95% CI) | ‐0.57 [‐1.64, 0.51] |
| 3.8 Secondary: chronic feelings of emptiness (continuous), at end of treatment Show forest plot | 1 | Mean Difference (IV, Fixed, 95% CI) | Subtotals only | |
| 3.9 Secondary: impulsivity (continuous) Show forest plot | 3 | Std. Mean Difference (IV, Random, 95% CI) | Subtotals only | |
| 3.9.1 End of treatment | 3 | 128 | Std. Mean Difference (IV, Random, 95% CI) | ‐0.35 [‐0.71, ‐0.00] |
| 3.9.2 6‐12 months follow‐up | 1 | 44 | Std. Mean Difference (IV, Random, 95% CI) | 0.30 [‐0.30, 0.90] |
| 3.10 Secondary: interpersonal problems (continuous), at end of treatment Show forest plot | 3 | 148 | Std. Mean Difference (IV, Random, 95% CI) | ‐0.12 [‐0.45, 0.20] |
| 3.11 Secondary: dissociation and psychotic‐like symptoms (continuous), at end of treatment Show forest plot | 4 | 194 | Std. Mean Difference (IV, Random, 95% CI) | ‐0.45 [‐0.73, ‐0.16] |
| 3.12 Secondary: depression (continuous) Show forest plot | 5 | Std. Mean Difference (IV, Random, 95% CI) | Subtotals only | |
| 3.12.1 End of treatment | 5 | 219 | Std. Mean Difference (IV, Random, 95% CI) | ‐0.47 [‐0.98, 0.03] |
| 3.12.2 6‐12 months follow‐up | 1 | 81 | Std. Mean Difference (IV, Random, 95% CI) | ‐0.23 [‐0.67, 0.21] |
| 3.13 Secondary: attrition (dichotomous) Show forest plot | 11 | Risk Ratio (M‐H, Random, 95% CI) | Subtotals only | |
| 3.13.1 End of treatment | 10 | 591 | Risk Ratio (M‐H, Random, 95% CI) | 1.27 [0.70, 2.31] |
| 3.13.2 0‐6 months follow‐up | 1 | 60 | Risk Ratio (M‐H, Random, 95% CI) | 0.58 [0.34, 1.00] |
| 3.14 Secondary: adverse effects (dichotomous), at end of treatment Show forest plot | 1 | Risk Ratio (M‐H, Fixed, 95% CI) | Subtotals only | |
| 3.15 Secondary: serious adverse effects (dichotomous), at end of treatment Show forest plot | 1 | Risk Ratio (M‐H, Fixed, 95% CI) | Subtotals only | |
| Outcome or subgroup title | No. of studies | No. of participants | Statistical method | Effect size |
| 4.1 Primary: BPD symptom severity (continuous) Show forest plot | 6 | Std. Mean Difference (IV, Random, 95% CI) | Subtotals only | |
| 4.1.1 End of treatment | 5 | 267 | Std. Mean Difference (IV, Random, 95% CI) | ‐0.13 [‐0.38, 0.11] |
| 4.1.2 0‐6 months follow‐up | 1 | 15 | Std. Mean Difference (IV, Random, 95% CI) | ‐0.40 [‐1.49, 0.68] |
| 4.1.3 Above 12 months follow‐up | 2 | 97 | Std. Mean Difference (IV, Random, 95% CI) | ‐0.94 [‐2.58, 0.70] |
| 4.2 Primary: self‐harm (continuous), at end of treatment Show forest plot | 1 | Mean Difference (IV, Fixed, 95% CI) | Subtotals only | |
| 4.3 Primary: self‐harm (dichotomous) Show forest plot | 3 | Risk Ratio (IV, Random, 95% CI) | Subtotals only | |
| 4.3.1 End of treatment | 3 | 252 | Risk Ratio (IV, Random, 95% CI) | 0.62 [0.49, 0.80] |
| 4.3.2 0‐6 months follow‐up | 1 | 41 | Risk Ratio (IV, Random, 95% CI) | 0.14 [0.04, 0.56] |
| 4.3.3 6‐12 months follow‐up | 1 | 41 | Risk Ratio (IV, Random, 95% CI) | 0.27 [0.10, 0.68] |
| 4.3.4 Above 12 months follow‐up | 1 | 41 | Risk Ratio (IV, Random, 95% CI) | 0.33 [0.15, 0.76] |
| 4.4 Primary: suicide‐related outcomes (dichotomous) Show forest plot | 3 | Risk Ratio (M‐H, Random, 95% CI) | Subtotals only | |
| 4.4.1 End of treatment | 3 | 218 | Risk Ratio (M‐H, Random, 95% CI) | 0.10 [0.04, 0.30] |
| 4.4.2 0‐6 months follow‐up | 1 | 41 | Risk Ratio (M‐H, Random, 95% CI) | 0.25 [0.06, 1.05] |
| 4.4.3 Above 12 months follow‐up | 1 | 41 | Risk Ratio (M‐H, Random, 95% CI) | 0.29 [0.11, 0.74] |
| 4.5 Primary: psychosocial functioning (continuous) Show forest plot | 3 | Std. Mean Difference (IV, Random, 95% CI) | Subtotals only | |
| 4.5.1 End of treatment | 3 | 239 | Std. Mean Difference (IV, Random, 95% CI) | ‐0.54 [‐1.24, 0.16] |
| 4.5.2 Above 12 months follow‐up | 2 | 104 | Std. Mean Difference (IV, Random, 95% CI) | ‐0.41 [‐0.97, 0.15] |
| 4.6 Secondary: interpersonal problems (continuous) Show forest plot | 5 | Std. Mean Difference (IV, Random, 95% CI) | Subtotals only | |
| 4.6.1 End of treatment | 5 | 357 | Std. Mean Difference (IV, Random, 95% CI) | ‐0.68 [‐1.33, ‐0.02] |
| 4.6.2 0‐6 months follow‐up | 1 | 53 | Std. Mean Difference (IV, Random, 95% CI) | ‐0.41 [‐1.01, 0.20] |
| 4.6.3 Above 12 months follow‐up | 2 | 96 | Std. Mean Difference (IV, Random, 95% CI) | ‐0.28 [‐0.71, 0.14] |
| 4.7 Secondary: depression (continuous) Show forest plot | 4 | Std. Mean Difference (IV, Random, 95% CI) | Subtotals only | |
| 4.7.1 End of treatment | 4 | 333 | Std. Mean Difference (IV, Random, 95% CI) | ‐0.58 [‐1.22, 0.05] |
| 4.7.2 0‐6 months follow‐up | 2 | 91 | Std. Mean Difference (IV, Random, 95% CI) | ‐0.81 [‐1.69, 0.07] |
| 4.7.3 6‐12 months follow‐up | 1 | 37 | Std. Mean Difference (IV, Random, 95% CI) | ‐1.17 [‐1.88, ‐0.45] |
| 4.7.4 Above 12 months follow‐up | 2 | 90 | Std. Mean Difference (IV, Random, 95% CI) | ‐0.72 [‐1.55, 0.10] |
| 4.8 Secondary: depression (dichotomous), at end of treatment Show forest plot | 1 | Risk Ratio (IV, Fixed, 95% CI) | Subtotals only | |
| 4.9 Secondary: attrition (dichotomous), at end of treatment Show forest plot | 7 | 552 | Risk Ratio (M‐H, Random, 95% CI) | 0.99 [0.79, 1.25] |
| 4.10 Secondary: adverse effects (dichotomous), at end of treatment Show forest plot | 1 | Risk Ratio (M‐H, Fixed, 95% CI) | Subtotals only | |
| 4.11 Mentalisation‐based treatment for eating disorders (MBT‐ED) versus specialist supportive clinical management (SSCM‐ED) (generic inverse variance) Show forest plot | 1 | Mean Difference (IV, Fixed, 95% CI) | Subtotals only | |
| 4.11.1 Primary: psychosocial functioning (continuous), at end of treatment | 1 | Mean Difference (IV, Fixed, 95% CI) | ‐0.07 [‐0.86, 0.72] | |
| 4.11.2 Primary: psychosocial functioning (dichotomous), at 0‐6 months follow‐up | 1 | Mean Difference (IV, Fixed, 95% CI) | ‐0.44 [‐1.52, 0.64] | |
| 4.11.3 Secondary: interpersonal problems (continuous), at end of treatment | 1 | Mean Difference (IV, Fixed, 95% CI) | ‐0.10 [‐0.89, 0.69] | |
| 4.11.4 Secondary: interpersonal problems (continuous), at 0‐6 months follow‐up | 1 | Mean Difference (IV, Fixed, 95% CI) | ‐0.06 [‐1.15, 1.03] | |
| 4.11.5 Secondary: depression (continuous), at end of treatment | 1 | Mean Difference (IV, Fixed, 95% CI) | 0.19 [‐0.60, 0.98] | |
| 4.11.6 Secondary: depression (continuous), at 0‐6 months follow‐up | 1 | Mean Difference (IV, Fixed, 95% CI) | 0.51 [‐0.62, 1.64] | |
| Outcome or subgroup title | No. of studies | No. of participants | Statistical method | Effect size |
| 5.1 Primary: BPD symptom severity (continuous) Show forest plot | 1 | Mean Difference (IV, Fixed, 95% CI) | Subtotals only | |
| 5.1.1 End of treatment | 1 | 26 | Mean Difference (IV, Fixed, 95% CI) | ‐3.08 [‐4.99, ‐1.17] |
| 5.1.2 0‐6 months follow‐up | 1 | 26 | Mean Difference (IV, Fixed, 95% CI) | ‐2.02 [‐4.23, 0.19] |
| 5.2 Primary: BPD symptom severity (dichotomous), at above 12 months follow‐up Show forest plot | 1 | 76 | Risk Ratio (IV, Fixed, 95% CI) | 0.91 [0.56, 1.48] |
| 5.3 Primary: self‐harm (continuous) Show forest plot | 1 | Mean Difference (IV, Fixed, 95% CI) | Subtotals only | |
| 5.3.1 End of treatment | 1 | 28 | Mean Difference (IV, Fixed, 95% CI) | ‐3.03 [‐5.68, ‐0.38] |
| 5.3.2 0‐6 months follow‐up | 1 | 28 | Mean Difference (IV, Fixed, 95% CI) | ‐4.71 [‐11.60, 2.18] |
| 5.4 Primary: self‐harm (dichotomous), at end of treatment Show forest plot | 1 | Risk Ratio (IV, Fixed, 95% CI) | Subtotals only | |
| 5.5 Primary: suicide‐related outcomes (continuous) Show forest plot | 2 | Std. Mean Difference (IV, Random, 95% CI) | Subtotals only | |
| 5.5.1 End of treatment | 2 | 104 | Std. Mean Difference (IV, Random, 95% CI) | ‐0.47 [‐1.02, 0.08] |
| 5.5.2 0‐6 months follow‐up | 1 | 28 | Std. Mean Difference (IV, Random, 95% CI) | ‐0.45 [‐1.20, 0.31] |
| 5.5.3 6‐12 months follow‐up | 1 | 76 | Std. Mean Difference (IV, Random, 95% CI) | ‐0.44 [‐0.89, 0.02] |
| 5.5.4 Above 12 months follow‐up | 1 | 76 | Std. Mean Difference (IV, Random, 95% CI) | ‐0.31 [‐0.77, 0.14] |
| 5.6 Primary: psychosocial functioning (continuous) Show forest plot | 2 | Std. Mean Difference (IV, Random, 95% CI) | Subtotals only | |
| 5.6.1 End of treatment | 1 | 99 | Std. Mean Difference (IV, Random, 95% CI) | 0.00 [‐0.39, 0.39] |
| 5.6.2 6‐12 months follow‐up | 1 | 90 | Std. Mean Difference (IV, Random, 95% CI) | 0.13 [‐0.28, 0.55] |
| 5.6.3 Above 12 months follow‐up | 2 | 209 | Std. Mean Difference (IV, Random, 95% CI) | 0.04 [‐0.36, 0.43] |
| 5.7 Secondary: interpersonal problems (continuous) Show forest plot | 1 | Mean Difference (IV, Fixed, 95% CI) | Subtotals only | |
| 5.7.1 End of treatment | 1 | 99 | Mean Difference (IV, Fixed, 95% CI) | 5.40 [‐3.70, 14.50] |
| 5.7.2 6‐12 months follow‐up | 1 | 99 | Mean Difference (IV, Fixed, 95% CI) | 0.30 [‐9.17, 9.77] |
| 5.7.3 Above 12 months follow‐up | 1 | 76 | Mean Difference (IV, Fixed, 95% CI) | 11.70 [0.72, 22.68] |
| 5.8 Secondary: dissociation and psychotic‐like symptoms (continuous) Show forest plot | 1 | Mean Difference (IV, Fixed, 95% CI) | Subtotals only | |
| 5.8.1 End of treatment | 1 | 26 | Mean Difference (IV, Fixed, 95% CI) | ‐2.30 [‐8.84, 4.24] |
| 5.8.2 0‐6 months follow‐up | 1 | 26 | Mean Difference (IV, Fixed, 95% CI) | ‐13.40 [‐24.49, ‐2.31] |
| 5.9 Secondary: depression (continuous) Show forest plot | 5 | Std. Mean Difference (IV, Random, 95% CI) | Subtotals only | |
| 5.9.1 End of treatment | 5 | 314 | Std. Mean Difference (IV, Random, 95% CI) | ‐0.21 [‐0.77, 0.35] |
| 5.9.2 0‐6 months follow‐up | 1 | 26 | Std. Mean Difference (IV, Random, 95% CI) | ‐0.96 [‐1.78, ‐0.14] |
| 5.9.3 6‐12 months follow‐up | 1 | 99 | Std. Mean Difference (IV, Random, 95% CI) | ‐0.29 [‐0.69, 0.11] |
| 5.9.4 Above 12 months follow‐up | 2 | 197 | Std. Mean Difference (IV, Random, 95% CI) | ‐0.15 [‐0.43, 0.13] |
| 5.10 Secondary: attrition (dichotomous), at end of treatment Show forest plot | 1 | Risk Ratio (M‐H, Fixed, 95% CI) | Subtotals only | |
| 5.11 Secondary: adverse effects (dichotomous), at end of treatment Show forest plot | 2 | Risk Ratio (M‐H, Random, 95% CI) | Subtotals only | |
| 5.11.1 Non‐serious adverse effects | 1 | 306 | Risk Ratio (M‐H, Random, 95% CI) | 0.92 [0.45, 1.88] |
| 5.11.2 Serious adverse effects | 2 | 326 | Risk Ratio (M‐H, Random, 95% CI) | 2.65 [0.31, 22.93] |
| Outcome or subgroup title | No. of studies | No. of participants | Statistical method | Effect size |
| 6.1 Primary: BPD symptom severity (continuous) Show forest plot | 4 | Std. Mean Difference (IV, Random, 95% CI) | Subtotals only | |
| 6.1.1 End of treatment | 4 | 222 | Std. Mean Difference (IV, Random, 95% CI) | ‐0.29 [‐0.66, 0.09] |
| 6.1.2 6‐12 months follow‐up | 1 | 33 | Std. Mean Difference (IV, Random, 95% CI) | ‐0.31 [‐1.00, 0.38] |
| 6.2 Primary: self‐harm (continuous) Show forest plot | 1 | Std. Mean Difference (IV, Random, 95% CI) | Subtotals only | |
| 6.2.1 End of treatment | 1 | 33 | Std. Mean Difference (IV, Random, 95% CI) | 0.12 [‐0.56, 0.80] |
| 6.2.2 6‐12 months follow‐up | 1 | 33 | Std. Mean Difference (IV, Random, 95% CI) | 0.14 [‐0.55, 0.82] |
| 6.3 Primary: suicide‐related outcomes (continuous) Show forest plot | 3 | Std. Mean Difference (IV, Random, 95% CI) | Subtotals only | |
| 6.3.1 End of treatment | 3 | 101 | Std. Mean Difference (IV, Random, 95% CI) | ‐0.22 [‐0.62, 0.17] |
| 6.3.2 6‐12 months follow‐up | 1 | 33 | Std. Mean Difference (IV, Random, 95% CI) | ‐0.38 [‐1.07, 0.31] |
| 6.4 Primary: psychosocial functioning (continuous) Show forest plot | 4 | Std. Mean Difference (IV, Random, 95% CI) | Subtotals only | |
| 6.4.1 End of treatment | 4 | 140 | Std. Mean Difference (IV, Random, 95% CI) | ‐0.69 [‐1.98, 0.59] |
| 6.4.2 6‐12 months follow‐up | 1 | 33 | Std. Mean Difference (IV, Random, 95% CI) | 0.05 [‐0.64, 0.73] |
| 6.4.3 Above 12 months follow‐up | 1 | 16 | Std. Mean Difference (IV, Random, 95% CI) | ‐0.40 [‐1.39, 0.60] |
| 6.5 Secondary: anger (continuous) Show forest plot | 1 | Mean Difference (IV, Fixed, 95% CI) | Subtotals only | |
| 6.5.1 End of treatment | 1 | 33 | Mean Difference (IV, Fixed, 95% CI) | 0.00 [‐0.86, 0.86] |
| 6.5.2 6‐12 months follow‐up | 1 | 33 | Mean Difference (IV, Fixed, 95% CI) | 0.00 [‐0.89, 0.89] |
| 6.6 Secondary: affective instability (continuous) Show forest plot | 3 | Std. Mean Difference (IV, Random, 95% CI) | Subtotals only | |
| 6.6.1 End of treatment | 3 | 116 | Std. Mean Difference (IV, Random, 95% CI) | ‐0.50 [‐0.87, ‐0.13] |
| 6.6.2 6‐12 months follow‐up | 1 | 33 | Std. Mean Difference (IV, Random, 95% CI) | ‐0.52 [‐1.21, 0.18] |
| 6.7 Secondary: chronic feelings of emptiness (continuous) Show forest plot | 2 | Std. Mean Difference (IV, Random, 95% CI) | Subtotals only | |
| 6.7.1 End of treatment | 2 | 77 | Std. Mean Difference (IV, Random, 95% CI) | ‐0.49 [‐1.02, 0.04] |
| 6.7.2 6‐12 months follow‐up | 1 | 33 | Std. Mean Difference (IV, Random, 95% CI) | ‐0.58 [‐1.28, 0.11] |
| 6.8 Secondary: impulsivity (continuous) Show forest plot | 2 | Std. Mean Difference (IV, Random, 95% CI) | Subtotals only | |
| 6.8.1 End of treatment | 2 | 77 | Std. Mean Difference (IV, Random, 95% CI) | ‐0.39 [‐0.85, 0.07] |
| 6.8.2 6‐12 months follow‐up | 1 | 33 | Std. Mean Difference (IV, Random, 95% CI) | 0.35 [‐0.34, 1.04] |
| 6.9 Secondary: interpersonal problems (continuous) Show forest plot | 4 | Std. Mean Difference (IV, Random, 95% CI) | Subtotals only | |
| 6.9.1 End of treatment | 4 | 238 | Std. Mean Difference (IV, Random, 95% CI) | ‐0.21 [‐0.71, 0.29] |
| 6.9.2 6‐12 months follow‐up | 1 | 33 | Std. Mean Difference (IV, Random, 95% CI) | ‐0.51 [‐1.20, 0.19] |
| 6.10 Secondary: abandonment (continuous) Show forest plot | 1 | Mean Difference (IV, Fixed, 95% CI) | Subtotals only | |
| 6.10.1 End of treatment | 1 | 33 | Mean Difference (IV, Fixed, 95% CI) | ‐0.20 [‐0.95, 0.55] |
| 6.10.2 6‐12 months follow‐up | 1 | 33 | Mean Difference (IV, Fixed, 95% CI) | ‐0.40 [‐1.08, 0.28] |
| 6.11 Secondary: identity disturbance (continuous) Show forest plot | 3 | Std. Mean Difference (IV, Random, 95% CI) | Subtotals only | |
| 6.11.1 End of treatment | 3 | 199 | Std. Mean Difference (IV, Random, 95% CI) | ‐0.38 [‐1.02, 0.27] |
| 6.11.2 6‐12 months follow‐up | 1 | 33 | Std. Mean Difference (IV, Random, 95% CI) | ‐1.09 [‐1.83, ‐0.35] |
| 6.12 Secondary: dissociation and psychotic‐like symptoms (continuous) Show forest plot | 2 | Std. Mean Difference (IV, Random, 95% CI) | Subtotals only | |
| 6.12.1 End of treatment | 2 | 57 | Std. Mean Difference (IV, Random, 95% CI) | ‐0.18 [‐0.96, 0.60] |
| 6.12.2 6‐12 months follow‐up | 1 | 33 | Std. Mean Difference (IV, Random, 95% CI) | ‐0.59 [‐1.29, 0.11] |
| 6.12.3 Above 12 months follow‐up | 1 | 24 | Std. Mean Difference (IV, Random, 95% CI) | ‐0.01 [‐0.81, 0.79] |
| 6.13 Secondary: depression (continuous) Show forest plot | 3 | Std. Mean Difference (IV, Random, 95% CI) | Subtotals only | |
| 6.13.1 End of treatment | 3 | 190 | Std. Mean Difference (IV, Random, 95% CI) | ‐0.17 [‐0.81, 0.47] |
| 6.13.2 Above 12 months follow‐up | 1 | 24 | Std. Mean Difference (IV, Random, 95% CI) | ‐0.68 [‐1.51, 0.15] |
| 6.14 Secondary: attrition (dichotomous), at end of treatment Show forest plot | 3 | 210 | Risk Ratio (M‐H, Random, 95% CI) | 0.90 [0.56, 1.47] |
| Outcome or subgroup title | No. of studies | No. of participants | Statistical method | Effect size |
| 7.1 Primary: BPD symptom severity (continuous), at end of treatment Show forest plot | 1 | Mean Difference (IV, Fixed, 95% CI) | Subtotals only | |
| 7.2 Primary: psychosocial functioning (continuous), at end of treatment Show forest plot | 1 | Mean Difference (IV, Fixed, 95% CI) | Subtotals only | |
| 7.3 Secondary: affective instability (continuous), at end of treatment Show forest plot | 1 | Mean Difference (IV, Fixed, 95% CI) | Subtotals only | |
| 7.4 Secondary: impulsivity (continuous), at end of treatment Show forest plot | 1 | Mean Difference (IV, Fixed, 95% CI) | Subtotals only | |
| 7.5 Secondary: interpersonal problems (continuous), at end of treatment Show forest plot | 1 | Mean Difference (IV, Fixed, 95% CI) | Subtotals only | |
| 7.6 Secondary: dissociation and psychotic‐like symptoms (continuous), at end of treatment Show forest plot | 1 | Mean Difference (IV, Fixed, 95% CI) | Subtotals only | |
| 7.7 Secondary: attrition (dichotomous), at end of treatment Show forest plot | 1 | Risk Ratio (M‐H, Fixed, 95% CI) | Subtotals only | |
| Outcome or subgroup title | No. of studies | No. of participants | Statistical method | Effect size |
| 8.1 Primary: BPD symptom severity (continuous), at end of treatment Show forest plot | 3 | Std. Mean Difference (IV, Random, 95% CI) | Subtotals only | |
| 8.1.1 End of treatment | 3 | 273 | Std. Mean Difference (IV, Random, 95% CI) | ‐0.39 [‐0.63, ‐0.15] |
| 8.1.2 6‐12 months follow‐up | 1 | 124 | Std. Mean Difference (IV, Random, 95% CI) | 0.03 [‐0.33, 0.38] |
| 8.2 Primary: self‐harm (dichtomous), at end of treatment Show forest plot | 1 | Risk Ratio (M‐H, Fixed, 95% CI) | Subtotals only | |
| 8.3 Primary: psychosocial functioning (continuous) Show forest plot | 1 | Mean Difference (IV, Fixed, 95% CI) | Subtotals only | |
| 8.3.1 End of treatment | 1 | 124 | Mean Difference (IV, Fixed, 95% CI) | ‐7.00 [‐11.43, ‐2.57] |
| 8.3.2 6‐12 months follow‐up | 1 | 124 | Mean Difference (IV, Fixed, 95% CI) | ‐5.90 [‐12.49, 0.69] |
| 8.4 Secondary: affective instability (continuous), at end of treatment Show forest plot | 2 | 221 | Std. Mean Difference (IV, Random, 95% CI) | ‐0.25 [‐0.52, 0.02] |
| 8.5 Secondary: impulsivity (continuous), at end of treatment Show forest plot | 1 | Mean Difference (IV, Fixed, 95% CI) | Subtotals only | |
| 8.6 Secondary: impulsivity (dichotomous), at end of treatment Show forest plot | 1 | Risk Ratio (IV, Fixed, 95% CI) | Subtotals only | |
| 8.7 Secondary: interpersonal problems (continuous), at end of treatment Show forest plot | 2 | 177 | Std. Mean Difference (IV, Random, 95% CI) | ‐0.38 [‐0.67, ‐0.08] |
| 8.8 Secondary: dissociation and psychotic‐like symptoms (continuous), at end of treatment Show forest plot | 1 | Mean Difference (IV, Fixed, 95% CI) | Subtotals only | |
| 8.9 Secondary: depression (continuous), at end of treatment Show forest plot | 1 | Mean Difference (IV, Fixed, 95% CI) | Subtotals only | |
| 8.9.1 End of treatment | 1 | 124 | Mean Difference (IV, Fixed, 95% CI) | ‐3.80 [‐9.34, 1.74] |
| 8.9.2 6‐12 months follow‐up | 1 | 124 | Mean Difference (IV, Fixed, 95% CI) | 0.60 [‐8.42, 9.62] |
| 8.10 Secondary: attrition (dichotomous), at end of treatment Show forest plot | 1 | Risk Ratio (M‐H, Fixed, 95% CI) | Subtotals only | |
| Outcome or subgroup title | No. of studies | No. of participants | Statistical method | Effect size |
| 9.1 Primary: suicide‐related outcomes (continuous) Show forest plot | 1 | Mean Difference (IV, Fixed, 95% CI) | Subtotals only | |
| 9.1.1 End of treatment | 1 | 9 | Mean Difference (IV, Fixed, 95% CI) | ‐1.40 [‐4.21, 1.41] |
| 9.1.2 0‐6 months follow‐up | 1 | 8 | Mean Difference (IV, Fixed, 95% CI) | ‐0.50 [‐2.05, 1.05] |
| 9.2 Primary: psychosocial functioning (continuous) Show forest plot | 1 | Mean Difference (IV, Fixed, 95% CI) | Subtotals only | |
| 9.2.1 End of treatment | 1 | 9 | Mean Difference (IV, Fixed, 95% CI) | ‐16.40 [‐31.20, ‐1.60] |
| 9.2.2 0‐6 months follow‐up | 1 | 9 | Mean Difference (IV, Fixed, 95% CI) | ‐15.80 [‐29.36, ‐2.24] |
| 9.3 Secondary: anger (continuous) Show forest plot | 1 | Mean Difference (IV, Fixed, 95% CI) | Subtotals only | |
| 9.3.1 End of treatment | 1 | 9 | Mean Difference (IV, Fixed, 95% CI) | ‐1.90 [‐7.97, 4.17] |
| 9.3.2 0‐6 months follow‐up | 1 | 8 | Mean Difference (IV, Fixed, 95% CI) | ‐4.50 [‐9.01, 0.01] |
| 9.4 Secondary: dissociation and psychotic‐like symptoms (continuous) Show forest plot | 1 | Mean Difference (IV, Fixed, 95% CI) | Subtotals only | |
| 9.4.1 End of treatment | 1 | 9 | Mean Difference (IV, Fixed, 95% CI) | ‐6.10 [‐15.01, 2.81] |
| 9.4.2 0‐6 months follow‐up | 1 | 9 | Mean Difference (IV, Fixed, 95% CI) | ‐11.70 [‐24.02, 0.62] |
| 9.5 Secondary: depression (continuous) Show forest plot | 1 | Mean Difference (IV, Fixed, 95% CI) | Subtotals only | |
| 9.5.1 End of treatment | 1 | 9 | Mean Difference (IV, Fixed, 95% CI) | ‐9.70 [‐20.10, 0.70] |
| 9.5.2 0‐6 months follow‐up | 1 | 8 | Mean Difference (IV, Fixed, 95% CI) | ‐3.70 [‐11.99, 4.59] |
| 9.6 Secondary: attrition (dichotomous), at end of treatment Show forest plot | 1 | Risk Ratio (M‐H, Fixed, 95% CI) | Subtotals only | |
| Outcome or subgroup title | No. of studies | No. of participants | Statistical method | Effect size |
| 10.1 Primary: psychosocial functioning, at end of treatment Show forest plot | 1 | Mean Difference (IV, Fixed, 95% CI) | Subtotals only | |
| Outcome or subgroup title | No. of studies | No. of participants | Statistical method | Effect size |
| 11.1 Secondary: depression (continuous), at end of treatment Show forest plot | 1 | Mean Difference (IV, Fixed, 95% CI) | Subtotals only | |
| 11.2 Secondary: attrition (dichotomous), at end of treatment Show forest plot | 1 | Odds Ratio (M‐H, Fixed, 95% CI) | Subtotals only | |
| Outcome or subgroup title | No. of studies | No. of participants | Statistical method | Effect size |
| 12.1 Primary: BPD symptom severity (continuous), at end of treatment Show forest plot | 1 | Mean Difference (IV, Fixed, 95% CI) | Subtotals only | |
| 12.2 Primary: self‐harm (dichotomous), at end of treatment Show forest plot | 1 | Risk Ratio (M‐H, Fixed, 95% CI) | Subtotals only | |
| 12.3 Primary: suicide‐related outcomes (dichotomous), at end of treatment Show forest plot | 1 | Risk Ratio (M‐H, Fixed, 95% CI) | Subtotals only | |
| 12.4 Primary: psychosocial functioning (continuous), at end of treatment Show forest plot | 1 | Mean Difference (IV, Fixed, 95% CI) | Subtotals only | |
| 12.5 Secondary: depression (continuous), at end of treatment Show forest plot | 1 | Mean Difference (IV, Fixed, 95% CI) | Subtotals only | |
| 12.6 Secondary: attrition (dichotomous), at end of treatment Show forest plot | 1 | Risk Ratio (M‐H, Fixed, 95% CI) | Subtotals only | |
| Outcome or subgroup title | No. of studies | No. of participants | Statistical method | Effect size |
| 13.1 Primary: self‐harm (continuous), at end of treatment Show forest plot | 1 | Mean Difference (IV, Fixed, 95% CI) | Subtotals only | |
| 13.2 Primary: psychosocial functioning (continuous), at end of treatment Show forest plot | 1 | Mean Difference (IV, Fixed, 95% CI) | Subtotals only | |
| 13.3 Secondary: depression (continuous), at end of treatment Show forest plot | 1 | Mean Difference (IV, Fixed, 95% CI) | Subtotals only | |
| 13.4 Secondary: attrition (dichotomous), at end of treatment Show forest plot | 1 | Risk Ratio (M‐H, Fixed, 95% CI) | Subtotals only | |
| Outcome or subgroup title | No. of studies | No. of participants | Statistical method | Effect size |
| 14.1 Primary: BPD symptom severity (continuous), at end of treatment Show forest plot | 3 | 134 | Std. Mean Difference (IV, Random, 95% CI) | ‐0.90 [‐1.57, ‐0.23] |
| 14.2 Primary: self‐harm (continuous), at end of treatment Show forest plot | 2 | 83 | Std. Mean Difference (IV, Random, 95% CI) | ‐0.84 [‐1.29, ‐0.39] |
| 14.3 Primary: suicide‐related outcomes (continuous), at end of treatment Show forest plot | 2 | 221 | Std. Mean Difference (IV, Random, 95% CI) | ‐0.55 [‐1.29, 0.19] |
| 14.4 Primary: psychosocial functioning (continuous) Show forest plot | 2 | Std. Mean Difference (IV, Random, 95% CI) | Subtotals only | |
| 14.4.1 End of treatment | 2 | 231 | Std. Mean Difference (IV, Random, 95% CI) | ‐0.57 [‐1.10, ‐0.04] |
| 14.4.2 Above 12 months follow‐up | 1 | 170 | Std. Mean Difference (IV, Random, 95% CI) | ‐0.64 [‐1.04, ‐0.24] |
| 14.5 Secondary: anger (continuous), at end of treatment Show forest plot | 1 | Mean Difference (IV, Fixed, 95% CI) | Subtotals only | |
| 14.6 Secondary: affective instability (continuous), at end of treatment Show forest plot | 3 | 134 | Std. Mean Difference (IV, Random, 95% CI) | ‐0.95 [‐1.74, ‐0.15] |
| 14.7 Secondary: chronic feelings of emptiness (continuous), at end of treatment Show forest plot | 1 | Mean Difference (IV, Fixed, 95% CI) | Subtotals only | |
| 14.8 Secondary: impulsivity (continuous), at end of treatment Show forest plot | 3 | 134 | Std. Mean Difference (IV, Random, 95% CI) | ‐0.76 [‐1.30, ‐0.22] |
| 14.9 Secondary: interpersonal problems (continuous), at end of treatment Show forest plot | 2 | 112 | Std. Mean Difference (IV, Random, 95% CI) | ‐0.62 [‐1.09, ‐0.15] |
| 14.10 Secondary: abandonment (continuous), at end of treatment Show forest plot | 1 | Mean Difference (IV, Fixed, 95% CI) | Subtotals only | |
| 14.11 Secondary: identity disturbance (continuous), at end of treatment Show forest plot | 1 | Mean Difference (IV, Fixed, 95% CI) | Subtotals only | |
| 14.12 Secondary: depression (continuous), at end of treatment Show forest plot | 4 | 304 | Std. Mean Difference (IV, Random, 95% CI) | ‐0.82 [‐1.38, ‐0.26] |
| 14.13 Secondary: attrition (dichotomuous), at end of treatment Show forest plot | 4 | 326 | Risk Ratio (M‐H, Random, 95% CI) | 1.06 [0.85, 1.32] |
| 14.14 Secondary: adverse effects (dichotomous), at end of treatment Show forest plot | 1 | Risk Ratio (M‐H, Fixed, 95% CI) | Subtotals only | |
| Outcome or subgroup title | No. of studies | No. of participants | Statistical method | Effect size |
| 15.1 Primary: BPD symptom severity (continuous), at end of treatment Show forest plot | 3 | 161 | Std. Mean Difference (IV, Random, 95% CI) | ‐0.49 [‐0.93, ‐0.05] |
| 15.2 Primary: self‐harm (continuous), at end of treatment Show forest plot | 2 | 128 | Std. Mean Difference (IV, Random, 95% CI) | ‐0.17 [‐0.52, 0.18] |
| 15.3 Primary: suicide‐related outcomes (continuous), at end of treatment Show forest plot | 2 | 108 | Std. Mean Difference (IV, Random, 95% CI) | ‐5.62 [‐16.39, 5.16] |
| 15.4 Primary: psychosocial functioning (continuous) Show forest plot | 5 | Std. Mean Difference (IV, Random, 95% CI) | Subtotals only | |
| 15.4.1 End of treatment | 5 | 219 | Std. Mean Difference (IV, Random, 95% CI) | ‐0.56 [‐1.01, ‐0.11] |
| 15.4.2 0‐6 months follow‐up | 1 | 30 | Std. Mean Difference (IV, Random, 95% CI) | ‐0.89 [‐1.65, ‐0.13] |
| 15.4.3 6‐12 months follow‐up | 1 | 30 | Std. Mean Difference (IV, Random, 95% CI) | ‐1.04 [‐1.81, ‐0.27] |
| 15.4.4 Above 12 months follow‐up | 1 | 28 | Std. Mean Difference (IV, Random, 95% CI) | ‐0.38 [‐1.14, 0.37] |
| 15.5 Secondary: anger (continuous), at end of treatment Show forest plot | 2 | 128 | Std. Mean Difference (IV, Random, 95% CI) | ‐0.58 [‐1.70, 0.55] |
| 15.6 Secondary: affective instability (continuous) Show forest plot | 2 | Std. Mean Difference (IV, Random, 95% CI) | Subtotals only | |
| 15.6.1 End of treatment | 2 | 128 | Std. Mean Difference (IV, Random, 95% CI) | ‐0.99 [‐1.36, ‐0.62] |
| 15.6.2 0‐6 months follow‐up | 1 | 30 | Std. Mean Difference (IV, Random, 95% CI) | ‐0.47 [‐1.20, 0.26] |
| 15.6.3 6‐12 months follow‐up | 1 | 30 | Std. Mean Difference (IV, Random, 95% CI) | ‐0.38 [‐1.10, 0.34] |
| 15.6.4 Above 12 months follow‐up | 1 | 30 | Std. Mean Difference (IV, Random, 95% CI) | ‐0.28 [‐1.01, 0.44] |
| 15.7 Secondary: chronic feelings of emptiness (continuous), at end of treatment Show forest plot | 1 | Mean Difference (IV, Fixed, 95% CI) | Subtotals only | |
| 15.8 Secondary: impulsivity (continuous) Show forest plot | 3 | Std. Mean Difference (IV, Random, 95% CI) | Subtotals only | |
| 15.8.1 End of treatment | 3 | 178 | Std. Mean Difference (IV, Random, 95% CI) | ‐0.52 [‐0.82, ‐0.22] |
| 15.8.2 0‐6 months follow‐up | 1 | 30 | Std. Mean Difference (IV, Random, 95% CI) | ‐0.90 [‐1.66, ‐0.14] |
| 15.8.3 6‐12 months follow‐up | 1 | 30 | Std. Mean Difference (IV, Random, 95% CI) | ‐0.79 [‐1.54, ‐0.04] |
| 15.8.4 Above 12 months follow‐up | 1 | 30 | Std. Mean Difference (IV, Random, 95% CI) | ‐0.75 [‐1.50, ‐0.01] |
| 15.9 Secondary: interpersonal problems (continuous) Show forest plot | 3 | Std. Mean Difference (IV, Random, 95% CI) | Subtotals only | |
| 15.9.1 End of treatment | 3 | 120 | Std. Mean Difference (IV, Random, 95% CI) | ‐0.85 [‐1.23, ‐0.47] |
| 15.9.2 0‐6 months follow‐up | 1 | 30 | Std. Mean Difference (IV, Random, 95% CI) | ‐1.40 [‐2.21, ‐0.59] |
| 15.9.3 6‐12 months follow‐up | 1 | 30 | Std. Mean Difference (IV, Random, 95% CI) | ‐0.90 [‐1.66, ‐0.14] |
| 15.9.4 Above 12 months follow‐up | 1 | 30 | Std. Mean Difference (IV, Random, 95% CI) | ‐0.86 [‐1.62, ‐0.11] |
| 15.10 Secondary: abandonment (continuous), at end of treatment Show forest plot | 1 | Mean Difference (IV, Fixed, 95% CI) | Subtotals only | |
| 15.11 Secondary: identity disturbance (continuous), at end of treatment Show forest plot | 1 | Mean Difference (IV, Fixed, 95% CI) | Subtotals only | |
| 15.12 Secondary: dissociation and psychotic‐like symptoms (continuous), at end of treatment Show forest plot | 2 | 77 | Std. Mean Difference (IV, Random, 95% CI) | ‐0.13 [‐0.65, 0.39] |
| 15.13 Secondary: depression (continuous), at end of treatment Show forest plot | 6 | 239 | Std. Mean Difference (IV, Random, 95% CI) | ‐1.28 [‐2.21, ‐0.34] |
| 15.14 Secondary: attrition (dichotomous), at end of treatment Show forest plot | 3 | 144 | Risk Ratio (M‐H, Random, 95% CI) | 0.55 [0.20, 1.50] |
| Outcome or subgroup title | No. of studies | No. of participants | Statistical method | Effect size |
| 16.1 Primary: BPD symptom severity (continuous), at end of treatment Show forest plot | 2 | 117 | Std. Mean Difference (IV, Random, 95% CI) | ‐0.71 [‐1.08, ‐0.33] |
| 16.2 Primary: self‐harm (continuous), at end of treatment Show forest plot | 1 | Mean Difference (IV, Fixed, 95% CI) | Subtotals only | |
| 16.3 Primary: suicide‐related outcomes (continuous), at end of treatment Show forest plot | 2 | 108 | Std. Mean Difference (IV, Random, 95% CI) | ‐5.62 [‐16.39, 5.16] |
| 16.4 Primary: psychosocial functioning (continuous), at end of treatment Show forest plot | 2 | 117 | Std. Mean Difference (IV, Random, 95% CI) | ‐0.73 [‐1.11, ‐0.36] |
| 16.5 Secondary: anger (continuous), at end of treatment Show forest plot | 1 | Mean Difference (IV, Fixed, 95% CI) | Subtotals only | |
| 16.6 Secondary: affective instability (continuous), at end of treatment Show forest plot | 1 | Mean Difference (IV, Fixed, 95% CI) | Subtotals only | |
| 16.7 Secondary: impulsivity (continuous), at end of treatment Show forest plot | 1 | Mean Difference (IV, Fixed, 95% CI) | Subtotals only | |
| 16.8 Secondary: dissociation and psychotic‐like symptoms (continuous), at end of treatment Show forest plot | 1 | Mean Difference (IV, Fixed, 95% CI) | Subtotals only | |
| 16.9 Secondary: depression (continuous), at end of treatment Show forest plot | 3 | 141 | Std. Mean Difference (IV, Random, 95% CI) | ‐3.20 [‐5.57, ‐0.83] |
| 16.10 DBT‐couple therapy (CDBT) vs waiting list (generic inverse variance) Show forest plot | 1 | Mean Difference (IV, Fixed, 95% CI) | Subtotals only | |
| 16.10.1 Primary: BPD severity (continuous), at end of treatment | 1 | Mean Difference (IV, Fixed, 95% CI) | ‐27.15 [‐31.59, ‐22.71] | |
| 16.10.2 Primary: suicide‐related outcomes (continuous), at end of treatment | 1 | Mean Difference (IV, Fixed, 95% CI) | ‐0.94 [‐1.24, ‐0.64] | |
| 16.10.3 Primary: psychosocial functioning (continuous), at end of treatment | 1 | Mean Difference (IV, Fixed, 95% CI) | ‐10.70 [‐12.31, ‐9.09] | |
| 16.10.4 Secondary: anger (continuous), at end of treatment | 1 | Mean Difference (IV, Fixed, 95% CI) | ‐1.42 [‐1.72, ‐1.12] | |
| 16.10.5 Secondary: affective instability (continuous), at end of treatment | 1 | Mean Difference (IV, Fixed, 95% CI) | ‐4.01 [‐5.44, ‐2.58] | |
| 16.10.6 Secondary: chronic feelings of emptiness (continuous), at end of treatment | 1 | Mean Difference (IV, Fixed, 95% CI) | ‐3.54 [‐4.81, ‐2.27] | |
| 16.10.7 Secondary: impulsivity (continuous), at end of treatment | 1 | Mean Difference (IV, Fixed, 95% CI) | ‐0.51 [‐0.72, ‐0.30] | |
| 16.10.8 Secondary: interpersonal problems (continuous), at end of treatment | 1 | Mean Difference (IV, Fixed, 95% CI) | ‐1.98 [‐2.47, ‐1.49] | |
| 16.10.9 Secondary: abandonment (continuous), at end of treatment | 1 | Mean Difference (IV, Fixed, 95% CI) | ‐0.86 [‐1.09, ‐0.63] | |
| 16.10.10 Secondary: identity disturbance (continuous), at end of treatment | 1 | Mean Difference (IV, Fixed, 95% CI) | ‐2.44 [‐2.77, ‐2.11] | |
| 16.10.11 Secondary: dissociation or psychotic‐like symptoms (continuous), at end of treatment | 1 | Mean Difference (IV, Fixed, 95% CI) | ‐1.92 [‐2.46, ‐1.38] | |
| 16.10.12 Secondary: depression (continuous), at end of treatment | 1 | Mean Difference (IV, Fixed, 95% CI) | ‐10.43 [‐11.86, ‐9.00] | |
| Outcome or subgroup title | No. of studies | No. of participants | Statistical method | Effect size |
| 17.1 Primary: suicide‐related outcomes (continuous), at end of treatment Show forest plot | 1 | Mean Difference (IV, Fixed, 95% CI) | Subtotals only | |
| 17.2 Secondary: depression (continuous), at end of treatment Show forest plot | 1 | Mean Difference (IV, Fixed, 95% CI) | Subtotals only | |
| Outcome or subgroup title | No. of studies | No. of participants | Statistical method | Effect size |
| 18.1 Primary: BPD symptom severity (continuous), at end of treatment Show forest plot | 1 | Mean Difference (IV, Fixed, 95% CI) | Subtotals only | |
| 18.2 Primary: self‐harm (continuous), at end of treatment Show forest plot | 1 | Mean Difference (IV, Fixed, 95% CI) | Subtotals only | |
| 18.3 Primary: psychosocial functioning (continuous) Show forest plot | 2 | Std. Mean Difference (IV, Random, 95% CI) | Subtotals only | |
| 18.3.1 End of treatment | 2 | 76 | Std. Mean Difference (IV, Random, 95% CI) | ‐0.03 [‐0.48, 0.42] |
| 18.3.2 0‐6 months follow‐up | 1 | 30 | Std. Mean Difference (IV, Random, 95% CI) | ‐0.89 [‐1.65, ‐0.13] |
| 18.3.3 6‐12 months follow‐up | 1 | 30 | Std. Mean Difference (IV, Random, 95% CI) | ‐1.04 [‐1.81, ‐0.27] |
| 18.3.4 Above 12 months follow‐up | 1 | 28 | Std. Mean Difference (IV, Random, 95% CI) | ‐0.38 [‐1.14, 0.37] |
| 18.4 Secondary: anger (continuous), at end of treatment Show forest plot | 1 | Mean Difference (IV, Fixed, 95% CI) | Subtotals only | |
| 18.5 Secondary: affective instability (continuous) Show forest plot | 1 | Mean Difference (IV, Fixed, 95% CI) | Subtotals only | |
| 18.5.1 End of treatment | 1 | 44 | Mean Difference (IV, Fixed, 95% CI) | ‐1.02 [‐1.66, ‐0.38] |
| 18.5.2 0‐6 months follow‐up | 1 | 30 | Mean Difference (IV, Fixed, 95% CI) | ‐0.46 [‐1.15, 0.23] |
| 18.5.3 6‐12 months follow‐up | 1 | 30 | Mean Difference (IV, Fixed, 95% CI) | ‐0.39 [‐1.12, 0.34] |
| 18.5.4 Above 12 months follow‐up | 1 | 30 | Mean Difference (IV, Fixed, 95% CI) | ‐0.34 [‐1.17, 0.49] |
| 18.6 Secondary: chronic feelings of emptiness (continuous), at end of treatment Show forest plot | 1 | Mean Difference (IV, Fixed, 95% CI) | Subtotals only | |
| 18.7 Secondary: impulsivity (continuous) Show forest plot | 1 | Mean Difference (IV, Fixed, 95% CI) | Subtotals only | |
| 18.7.1 End of treatment | 1 | 44 | Mean Difference (IV, Fixed, 95% CI) | ‐1.03 [‐1.69, ‐0.37] |
| 18.7.2 0‐6 months follow‐up | 1 | 30 | Mean Difference (IV, Fixed, 95% CI) | ‐1.10 [‐1.95, ‐0.25] |
| 18.7.3 6‐12 months follow‐up | 1 | 30 | Mean Difference (IV, Fixed, 95% CI) | ‐1.10 [‐2.06, ‐0.14] |
| 18.7.4 Above 12 months follow‐up | 1 | 30 | Mean Difference (IV, Fixed, 95% CI) | ‐1.09 [‐2.09, ‐0.09] |
| 18.8 Secondary: interpersonal problems (continuous) Show forest plot | 1 | Mean Difference (IV, Fixed, 95% CI) | Subtotals only | |
| 18.8.1 End of treatment | 1 | 44 | Mean Difference (IV, Fixed, 95% CI) | ‐1.14 [‐1.94, ‐0.34] |
| 18.8.2 0‐6 months follow‐up | 1 | 30 | Mean Difference (IV, Fixed, 95% CI) | ‐2.00 [‐2.98, ‐1.02] |
| 18.8.3 6‐12 months follow‐up | 1 | 30 | Mean Difference (IV, Fixed, 95% CI) | ‐1.56 [‐2.74, ‐0.38] |
| 18.8.4 Above 12 months follow‐up | 1 | 30 | Mean Difference (IV, Fixed, 95% CI) | ‐1.48 [‐2.63, ‐0.33] |
| 18.9 Secondary: abandonment (continuous), at end of treatment Show forest plot | 1 | Mean Difference (IV, Fixed, 95% CI) | Subtotals only | |
| 18.10 Secondary: identity disturbance (continuous), at end of treatment Show forest plot | 1 | Mean Difference (IV, Fixed, 95% CI) | Subtotals only | |
| 18.11 Secondary: dissociation and psychotic‐like symptoms (continuous), at end of treatment Show forest plot | 1 | Mean Difference (IV, Fixed, 95% CI) | Subtotals only | |
| 18.12 Secondary outcome: depression (continuous), at end of treatment Show forest plot | 3 | 98 | Std. Mean Difference (IV, Random, 95% CI) | ‐0.52 [‐1.11, 0.06] |
| 18.13 Secondary outcome: attrition (dichotomous), at end of treatment Show forest plot | 2 | 94 | Risk Ratio (M‐H, Random, 95% CI) | 0.55 [0.20, 1.50] |
| Outcome or subgroup title | No. of studies | No. of participants | Statistical method | Effect size |
| 19.1 Secondary: impulsivity (continuous), at end of treatment Show forest plot | 1 | Mean Difference (IV, Fixed, 95% CI) | Subtotals only | |
| 19.2 Secondary: interpersonal problems (continuous), at end of treatment Show forest plot | 1 | Mean Difference (IV, Fixed, 95% CI) | Subtotals only | |
| 19.3 Secondary: attrition (dichotomous), at end of treatment Show forest plot | 1 | Risk Ratio (M‐H, Fixed, 95% CI) | Subtotals only | |
| Outcome or subgroup title | No. of studies | No. of participants | Statistical method | Effect size |
| 20.1 Primary outcome: psychosocial functioning (continuous), at end of treatment Show forest plot | 1 | Mean Difference (IV, Fixed, 95% CI) | Subtotals only | |
| 20.2 Secondary outcome: interpersonal problems (continuous), at end of treatment Show forest plot | 1 | Mean Difference (IV, Fixed, 95% CI) | Subtotals only | |
| Outcome or subgroup title | No. of studies | No. of participants | Statistical method | Effect size |
| 21.1 Standard DBT (DBT) vs client‐centred therapy (CCT) (continuous) Show forest plot | 1 | Mean Difference (IV, Fixed, 95% CI) | Subtotals only | |
| 21.1.1 Primary: self‐harm (continuous), at end of treatment | 1 | 24 | Mean Difference (IV, Fixed, 95% CI) | ‐2.75 [‐4.42, ‐1.08] |
| 21.1.2 Primary: suicide‐related outcomes (continuous), at end of treatment | 1 | 24 | Mean Difference (IV, Fixed, 95% CI) | ‐7.75 [‐14.66, ‐0.84] |
| 21.1.3 Secondary: anger (continuous), at end of treatment | 1 | 24 | Mean Difference (IV, Fixed, 95% CI) | ‐1.00 [‐1.98, ‐0.02] |
| 21.1.4 Secondary: impulsivity (continuous), at end of treatment | 1 | 24 | Mean Difference (IV, Fixed, 95% CI) | ‐1.50 [‐2.60, ‐0.40] |
| 21.1.5 Secondary: dissociation and psychotic‐like symptoms (continuous), at end of treatment | 1 | 24 | Mean Difference (IV, Fixed, 95% CI) | ‐7.16 [‐12.15, ‐2.17] |
| 21.1.6 Secondary: depression (continuous), at end of treatment | 1 | 24 | Mean Difference (IV, Fixed, 95% CI) | ‐9.16 [‐14.79, ‐3.53] |
| 21.2 DBT vs CCT, secondary: attrition (dichotomous), at end of treatment Show forest plot | 1 | Risk Ratio (M‐H, Fixed, 95% CI) | Subtotals only | |
| 21.3 Standard DBT (DBT) vs good psychiatric management (GPM) (continuous) Show forest plot | 1 | Mean Difference (IV, Fixed, 95% CI) | Subtotals only | |
| 21.3.1 Primary: BPD severity (continuous), at end of treatment | 1 | 180 | Mean Difference (IV, Fixed, 95% CI) | ‐0.23 [‐1.97, 1.51] |
| 21.3.2 Primary: self‐harm (continuous), at end of treatment | 1 | 180 | Mean Difference (IV, Fixed, 95% CI) | ‐8.58 [‐19.38, 2.22] |
| 21.3.3 Secondary: anger (continuous), at end of treatment | 1 | 180 | Mean Difference (IV, Fixed, 95% CI) | ‐0.15 [‐1.65, 1.35] |
| 21.3.4 Secondary: interpersonal problems (continuous), at end of treatment | 1 | 180 | Mean Difference (IV, Fixed, 95% CI) | ‐1.34 [‐15.36, 12.68] |
| 21.3.5 Secondary: depression (continuous), at end of treatment | 1 | 180 | Mean Difference (IV, Fixed, 95% CI) | ‐2.65 [‐7.18, 1.88] |
| 21.4 DBT vs GPM, secondary: attrition (dichotomous), at end of treatment Show forest plot | 1 | Risk Ratio (M‐H, Fixed, 95% CI) | Subtotals only | |
| 21.5 Standard DBT (DBT) vs individual DBT therapy + activities group (DBT‐I) (continuous) Show forest plot | 1 | Mean Difference (IV, Fixed, 95% CI) | Subtotals only | |
| 21.5.1 Primary: self‐harm (continuous), at end of treatment | 1 | 66 | Mean Difference (IV, Fixed, 95% CI) | ‐10.40 [‐22.99, 2.19] |
| 21.5.2 Primary: self‐harm (continuous), at 6‐12 months follow‐up | 1 | 66 | Mean Difference (IV, Fixed, 95% CI) | ‐8.10 [‐19.59, 3.39] |
| 21.5.3 Primary: suicide‐related outcomes (continuous), at end of treatment | 1 | 66 | Mean Difference (IV, Fixed, 95% CI) | 0.50 [‐1.37, 2.37] |
| 21.5.4 Primary: suicide‐related outcomes (continuous), at 6‐12 months follow‐up | 1 | 66 | Mean Difference (IV, Fixed, 95% CI) | ‐1.60 [‐2.79, ‐0.41] |
| 21.5.5 Secondary: depression (continuous), at end of treatment | 1 | 66 | Mean Difference (IV, Fixed, 95% CI) | ‐5.90 [‐9.74, ‐2.06] |
| 21.5.6 Secondary: depression (continuous), at 6‐12 months follow‐up | 1 | 66 | Mean Difference (IV, Fixed, 95% CI) | 1.30 [‐3.10, 5.70] |
| 21.6 DBT vs DBT‐I, secondary: attrition (dichotomous), at end of treatment Show forest plot | 1 | Risk Ratio (M‐H, Fixed, 95% CI) | Subtotals only | |
| 21.7 Standard DBT (DBT) vs skills training group + individual case management (DBT‐S) (continuous) Show forest plot | 1 | Mean Difference (IV, Fixed, 95% CI) | Subtotals only | |
| 21.7.1 Primary: self‐harm (continuous), at end of treatment | 1 | 66 | Mean Difference (IV, Fixed, 95% CI) | 0.30 [‐8.42, 9.02] |
| 21.7.2 Primary: self‐harm (continuous), at 6‐12 months follow‐up | 1 | 66 | Mean Difference (IV, Fixed, 95% CI) | ‐1.50 [‐9.04, 6.04] |
| 21.7.3 Primary: suicide‐related outcomes (continuous), at end of treatment | 1 | 66 | Mean Difference (IV, Fixed, 95% CI) | 0.80 [‐1.06, 2.66] |
| 21.7.4 Primary: suicide‐related outcomes (continuous), at 6‐12 months follow‐up | 1 | 66 | Mean Difference (IV, Fixed, 95% CI) | 0.50 [‐0.02, 1.02] |
| 21.7.5 Secondary: depression (continuous), at end of treatment | 1 | 66 | Mean Difference (IV, Fixed, 95% CI) | 1.90 [‐1.60, 5.40] |
| 21.7.6 Secondary: depression (continuous), at 6‐12 months follow‐up | 1 | 66 | Mean Difference (IV, Fixed, 95% CI) | 3.30 [‐0.90, 7.50] |
| 21.8 DBT vs DBT‐S, secondary: attrition (dichotomous), at 6‐12 months follow‐up Show forest plot | 1 | Risk Ratio (M‐H, Fixed, 95% CI) | Subtotals only | |
| 21.9 Standard DBT (DBT) vs step‐down DBT (DBT‐SD) (continuous) Show forest plot | 1 | Mean Difference (IV, Fixed, 95% CI) | Subtotals only | |
| 21.9.1 Primary: BPD symptom severity (continuous), at end of treatment | 1 | 38 | Mean Difference (IV, Fixed, 95% CI) | ‐2.83 [‐11.21, 5.55] |
| 21.9.2 Primary: self‐harm (continuous), at end of treatment | 1 | 38 | Mean Difference (IV, Fixed, 95% CI) | 4.10 [‐4.07, 12.27] |
| 21.9.3 Primary: suicide‐related outcomes (continuous), at end of treatment | 1 | 38 | Mean Difference (IV, Fixed, 95% CI) | 0.30 [‐0.73, 1.33] |
| 21.9.4 Secondary: anger (continuous), at end of treatment | 1 | 41 | Mean Difference (IV, Fixed, 95% CI) | ‐0.53 [‐1.48, 0.43] |
| 21.9.5 Secondary: affective instability (continuous), at end of treatment | 1 | 41 | Mean Difference (IV, Fixed, 95% CI) | ‐0.71 [‐2.51, 1.09] |
| 21.9.6 Secondary: chronic feeling of emptiness (continuous), at end of treatment | 1 | 41 | Mean Difference (IV, Fixed, 95% CI) | 0.18 [‐1.68, 2.04] |
| 21.9.7 Secondary: impulsivity (continuous), at end of treatment | 1 | 41 | Mean Difference (IV, Fixed, 95% CI) | 0.24 [‐0.26, 0.75] |
| 21.9.8 Secondary: interpersonal problems (continuous), at end of treatment | 1 | 41 | Mean Difference (IV, Fixed, 95% CI) | ‐1.31 [‐2.05, ‐0.57] |
| 21.9.9 Secondary: abandonment (continuous), at end of treatment | 1 | 41 | Mean Difference (IV, Fixed, 95% CI) | ‐1.11 [‐2.14, ‐0.08] |
| 21.9.10 Secondary: dissociation and psychotic‐like symptoms (continuous), at end of treatment | 1 | 41 | Mean Difference (IV, Fixed, 95% CI) | ‐0.44 [‐1.56, 0.68] |
| 21.10 DBT vs DBT‐SD, secondary: attrition (dichotomous), at end of treatment Show forest plot | 1 | 84 | Risk Ratio (M‐H, Fixed, 95% CI) | 0.37 [0.17, 0.78] |
| 21.11 Standard DBT (DBT) vs DBT Prolonged Exposure (PE) (continuous) Show forest plot | 1 | Mean Difference (IV, Fixed, 95% CI) | Subtotals only | |
| 21.11.1 Primary: self‐harm (continuous), end of treatment | 1 | 18 | Mean Difference (IV, Fixed, 95% CI) | 0.10 [‐1.86, 2.06] |
| 21.11.2 Primary: self‐harm (continuous), at 0‐6 months follow‐up | 1 | 18 | Mean Difference (IV, Fixed, 95% CI) | ‐0.30 [‐1.09, 0.49] |
| 21.11.3 Primary: suicide‐related outcomes (continuous), end of treatment | 1 | 18 | Mean Difference (IV, Fixed, 95% CI) | Not estimable |
| 21.11.4 Primary: suicide‐related outcomes (continuous), at 0‐6 months follow‐up | 1 | 18 | Mean Difference (IV, Fixed, 95% CI) | Not estimable |
| 21.11.5 Primary: psychosocial functioning (continuous), end of treatment | 1 | 18 | Mean Difference (IV, Fixed, 95% CI) | 5.27 [‐2.06, 12.60] |
| 21.11.6 Primary: psychosocial functioning (continuous), at 0‐6 months follow‐up | 1 | 18 | Mean Difference (IV, Fixed, 95% CI) | 2.00 [‐6.27, 10.27] |
| 21.11.7 Secondary: interpersonal problems (continuous), end of treatment | 1 | 18 | Mean Difference (IV, Fixed, 95% CI) | 0.14 [‐0.42, 0.70] |
| 21.11.8 Secondary: interpersonal problems (continuous), at 0‐6 months follow‐up | 1 | 18 | Mean Difference (IV, Fixed, 95% CI) | 0.19 [‐0.48, 0.86] |
| 21.11.9 Secondary: dissociation or psychotic‐like symptoms (continuous), end of treatment | 1 | 18 | Mean Difference (IV, Fixed, 95% CI) | 4.60 [‐9.24, 18.44] |
| 21.11.10 Secondary: dissociation or psychotic‐like symptoms (continuous), at 0‐6 months follow‐up | 1 | 18 | Mean Difference (IV, Fixed, 95% CI) | 6.00 [‐9.46, 21.46] |
| 21.11.11 Secondary: depression (continuous), end of treatment | 1 | 18 | Mean Difference (IV, Fixed, 95% CI) | 3.70 [‐3.19, 10.59] |
| 21.11.12 Secondary: depression (continuous), at 0‐6 months follow‐up | 1 | 18 | Mean Difference (IV, Fixed, 95% CI) | 4.30 [‐1.08, 9.68] |
| 21.12 DBT vs DBT‐PE, secondary: attrition (dichotomous), at 0‐6 months follow‐up Show forest plot | 1 | Risk Ratio (M‐H, Fixed, 95% CI) | Subtotals only | |
| 21.13 DBT skills group + case management (DBT‐S) vs DBT individual therapy + activity group (DBT‐I) (continuous) Show forest plot | 1 | Mean Difference (IV, Fixed, 95% CI) | Subtotals only | |
| 21.13.1 Primary: self‐harm (continuous), at end of treatment | 1 | 66 | Mean Difference (IV, Fixed, 95% CI) | ‐10.70 [‐22.47, 1.07] |
| 21.13.2 Primary: self‐harming behaviour (continuous), at 6‐12 months follow‐up | 1 | 66 | Mean Difference (IV, Fixed, 95% CI) | ‐6.60 [‐19.72, 6.52] |
| 21.13.3 Primary: suicide‐related outcomes (continuous), at end of treatment | 1 | 66 | Mean Difference (IV, Fixed, 95% CI) | ‐0.30 [‐1.72, 1.12] |
| 21.13.4 Primary: suicide‐related outcomes (continuous), at 6‐12 months follow‐up | 1 | 66 | Mean Difference (IV, Fixed, 95% CI) | ‐2.10 [‐3.21, ‐0.99] |
| 21.13.5 Secondary: depression (continuous), at end of treatment | 1 | 66 | Mean Difference (IV, Fixed, 95% CI) | ‐7.80 [‐11.27, ‐4.33] |
| 21.13.6 Secondary: depression (continuous), at 6‐12 months follow‐up | 1 | 66 | Mean Difference (IV, Fixed, 95% CI) | ‐2.00 [‐6.44, 2.44] |
| 21.14 DBT‐S vs DBT‐I, secondary: attrition (dichotomous), at 6‐12 months follow‐up Show forest plot | 1 | Risk Ratio (M‐H, Fixed, 95% CI) | Subtotals only | |
| 21.15 DBT skills group (DBT‐S) vs cognitive therapy group (CT‐G) (continuous) Show forest plot | 1 | Mean Difference (IV, Fixed, 95% CI) | Subtotals only | |
| 21.15.1 Primary: BPD symptom severity (continuous), at end of treatment | 1 | 82 | Mean Difference (IV, Fixed, 95% CI) | 0.26 [‐0.13, 0.65] |
| 21.15.2 Primary: BPD symptom severity (continuous), at 0‐6 months follow‐up | 1 | 82 | Mean Difference (IV, Fixed, 95% CI) | ‐0.96 [‐1.15, ‐0.77] |
| 21.15.3 Primary: suicide‐related outcomes (continuous), at end of treatment | 1 | 82 | Mean Difference (IV, Fixed, 95% CI) | 0.46 [‐2.47, 3.39] |
| 21.15.4 Primary: suicide‐related outcomes (continuous), at 0‐6 months follow‐up | 1 | 82 | Mean Difference (IV, Fixed, 95% CI) | ‐2.69 [‐4.89, ‐0.49] |
| 21.15.5 Secondary: depression (continuous), at end of treatment | 1 | 82 | Mean Difference (IV, Fixed, 95% CI) | ‐2.12 [‐5.25, 1.01] |
| 21.15.6 Secondary: depression (continuous), at 0‐6 months follow‐up | 1 | 82 | Mean Difference (IV, Fixed, 95% CI) | ‐1.60 [‐5.07, 1.87] |
| 21.16 DBT‐S vs CT‐G, secondary: attrition (dichotomous), at end of treatment Show forest plot | 1 | Risk Ratio (M‐H, Random, 95% CI) | Subtotals only | |
| 21.17 DBT skills group (DBT‐S) vs schema‐focused therapy group (SFT‐G) Show forest plot | 1 | Mean Difference (IV, Random, 95% CI) | Subtotals only | |
| 21.17.1 Primary: suicide‐related outcomes (continuous), at end of treatment | 1 | 24 | Mean Difference (IV, Random, 95% CI) | 0.92 [‐0.36, 2.20] |
| 21.17.2 Secondary: depression (continuous), at end of treatment | 1 | 24 | Mean Difference (IV, Random, 95% CI) | 4.33 [2.57, 6.09] |
| 21.18 DBT mindfulness group (DBT‐M) vs DBT interpersonal effectiveness group (DBT‐IE) (continuous) Show forest plot | 2 | Std. Mean Difference (IV, Random, 95% CI) | Subtotals only | |
| 21.18.1 Primary: BPD symptom severity (continuous), at end of treatment | 2 | 113 | Std. Mean Difference (IV, Random, 95% CI) | ‐0.45 [‐1.47, 0.58] |
| 21.18.2 Secondary: impulsivity (continuous), at end of treatment | 2 | 91 | Std. Mean Difference (IV, Random, 95% CI) | ‐0.36 [‐0.77, 0.06] |
| 21.19 DBT‐M vs DBT‐IE, secondary: attrition (dichotomous), at end of treatment Show forest plot | 2 | 134 | Risk Ratio (M‐H, Random, 95% CI) | 1.86 [1.07, 3.23] |
| 21.20 DBT mindfulness group (DBT‐M) vs loving‐kindness and compassion meditation (LK/CM), primary: BPD symptom severity (continuous), at end of treatment Show forest plot | 1 | Mean Difference (IV, Fixed, 95% CI) | Subtotals only | |
| Outcome or subgroup title | No. of studies | No. of participants | Statistical method | Effect size |
| 22.1 CBT vs trauma‐ and anxiety‐related group psychoeducation (continuous) Show forest plot | 1 | Mean Difference (IV, Fixed, 95% CI) | Subtotals only | |
| 22.1.1 Primary: BPD symptom severity (continuous), at end of treatment | 1 | 50 | Mean Difference (IV, Fixed, 95% CI) | ‐0.26 [‐1.46, 0.94] |
| 22.1.2 Primary: BPD symptom severity (continuous), at 0‐6 months follow‐up | 1 | 50 | Mean Difference (IV, Fixed, 95% CI) | ‐0.39 [‐1.60, 0.82] |
| 22.1.3 Primary: BPD symptom severity (continuous), at 6‐12 months follow‐up | 1 | 50 | Mean Difference (IV, Fixed, 95% CI) | 0.57 [‐0.48, 1.62] |
| 22.1.4 Primary: psychosocial functioning (continuous), at end of treatment | 1 | 50 | Mean Difference (IV, Fixed, 95% CI) | ‐0.64 [‐5.76, 4.48] |
| 22.1.5 Primary: psychosocial functioning (continuous), at 0‐6 months follow‐up | 1 | 50 | Mean Difference (IV, Fixed, 95% CI) | ‐1.23 [‐6.94, 4.48] |
| 22.1.6 Primary: psychosocial functioning (continuous), at 6‐12 months follow‐up | 1 | 50 | Mean Difference (IV, Fixed, 95% CI) | 0.61 [‐5.00, 6.22] |
| 22.1.7 Secondary: depression (continuous), at end of treatment | 1 | 50 | Mean Difference (IV, Fixed, 95% CI) | 0.76 [‐8.20, 9.72] |
| 22.1.8 Secondary: depression (continuous), at 0‐6 months follow‐up | 1 | 50 | Mean Difference (IV, Fixed, 95% CI) | 3.13 [‐4.05, 10.31] |
| 22.1.9 Secondary: depression (continuous), at 6‐12 months follow‐up | 1 | 50 | Mean Difference (IV, Fixed, 95% CI) | 0.77 [‐7.08, 8.62] |
| 22.2 CBT vs trauma‐ and anxiety‐related group psychoeducation, secondary: attrition (dichotomous), at end of treatment Show forest plot | 1 | Risk Ratio (M‐H, Fixed, 95% CI) | Subtotals only | |
| 22.3 CBT vs interpersonal psychotherapy (IPT) (continuous) Show forest plot | 1 | Mean Difference (IV, Fixed, 95% CI) | Subtotals only | |
| 22.3.1 Primary: psychosocial functioning (continuous), at end of treatment | 1 | 26 | Mean Difference (IV, Fixed, 95% CI) | ‐5.30 [‐12.36, 1.76] |
| 22.3.2 Secondary: depression (continuous), at end of treatment | 1 | 26 | Mean Difference (IV, Fixed, 95% CI) | ‐0.40 [‐4.72, 3.92] |
| 22.4 CBT vs IPT, secondary: attrition (dichotomous), at end of treatment Show forest plot | 1 | Risk Ratio (M‐H, Fixed, 95% CI) | Subtotals only | |
| 22.5 CBT vs Rogerian supportive therapy (continuous) Show forest plot | 1 | Mean Difference (IV, Fixed, 95% CI) | Subtotals only | |
| 22.5.1 Primary: self‐harm (continuous), end of treatment | 1 | 38 | Mean Difference (IV, Fixed, 95% CI) | 0.74 [‐0.03, 1.51] |
| 22.5.2 Primary: self‐harm (continuous), at 6‐12 months follow‐up | 1 | 21 | Mean Difference (IV, Fixed, 95% CI) | ‐0.63 [‐1.75, 0.49] |
| 22.5.3 Primary: suicide‐related outcomes (continuous), at end of treatment | 1 | 38 | Mean Difference (IV, Fixed, 95% CI) | 0.69 [‐2.60, 3.98] |
| 22.5.4 Primary: suicide‐related outcomes (continuous), at 6‐12 months follow‐up | 1 | 21 | Mean Difference (IV, Fixed, 95% CI) | ‐2.43 [‐6.14, 1.28] |
| 22.5.5 Primary: psychosocial functioning (continuous), at end of treatment | 1 | 38 | Mean Difference (IV, Fixed, 95% CI) | ‐0.43 [‐1.31, 0.45] |
| 22.5.6 Primary: psychosocial functioning (continuous), at 6‐12 months follow‐up | 1 | 21 | Mean Difference (IV, Fixed, 95% CI) | ‐0.98 [‐2.02, 0.06] |
| 22.5.7 Secondary: impulsivity (continuous), at end of treatment | 1 | 38 | Mean Difference (IV, Fixed, 95% CI) | ‐1.01 [‐3.85, 1.83] |
| 22.5.8 Secondary: impulsivity (continuous), at 6‐12 months follow‐up | 1 | 21 | Mean Difference (IV, Fixed, 95% CI) | ‐2.18 [‐5.91, 1.55] |
| 22.5.9 Secondary: depression (continuous), at end of treatment | 1 | 38 | Mean Difference (IV, Fixed, 95% CI) | 1.04 [‐5.59, 7.67] |
| 22.5.10 Secondary: depression (continuous), at 6‐12 months follow‐up | 1 | 21 | Mean Difference (IV, Fixed, 95% CI) | ‐5.15 [‐9.38, ‐0.92] |
| 22.6 CBT vs Rogerian supportive therapy, secondary: attrition (dichotomous), end of treatment Show forest plot | 1 | Risk Ratio (M‐H, Fixed, 95% CI) | Subtotals only | |
| 22.7 MACT (Manual‐assisted Cognitive Therapy) vs MACT + therapeutic assessment (MACT + TA) (continuous) Show forest plot | 1 | Mean Difference (IV, Random, 95% CI) | Subtotals only | |
| 22.7.1 Primary: BPD symptom severity (continuous), at end of treatment | 1 | 16 | Mean Difference (IV, Random, 95% CI) | ‐3.75 [‐14.17, 6.67] |
| 22.7.2 Primary: self‐harm (continuous), at end of treatment | 1 | 16 | Mean Difference (IV, Random, 95% CI) | 1.75 [‐18.71, 22.21] |
| 22.7.3 Primary: suicide‐related outcomes (continuous), at end of treatment | 1 | 16 | Mean Difference (IV, Random, 95% CI) | ‐0.63 [‐17.71, 16.45] |
| 22.7.4 Secondary: affective instability (continuous), at end of treatment | 1 | 16 | Mean Difference (IV, Random, 95% CI) | ‐5.25 [‐12.10, 1.60] |
| 22.7.5 Secondary: interpersonal problems (continuous), at end of treatment | 1 | 16 | Mean Difference (IV, Random, 95% CI) | ‐0.50 [‐11.24, 10.24] |
| 22.7.6 Secondary: identity disturbance (continuous), at end of treatment | 1 | 16 | Mean Difference (IV, Random, 95% CI) | ‐4.88 [‐14.98, 5.22] |
| 22.8 MACT vs MACT + TA, secondary: attrition (dichotomous), at end of treatment Show forest plot | 1 | Risk Ratio (M‐H, Fixed, 95% CI) | Subtotals only | |
| 22.9 Meta‐Cognitive training for BPD (B‐MCT) vs progressive muscle relaxation training (PMR) Show forest plot | 1 | Mean Difference (IV, Fixed, 95% CI) | Subtotals only | |
| 22.9.1 Primary: BPD symptom severity (continuous), at end of treatment | 1 | 49 | Mean Difference (IV, Fixed, 95% CI) | ‐1.80 [‐4.97, 1.37] |
| 22.9.2 Primary: BPD symptom severity (continuous), at 0‐6 months follow up | 1 | 39 | Mean Difference (IV, Fixed, 95% CI) | ‐3.60 [‐7.16, ‐0.04] |
| 22.9.3 Secondary: depression (continuous), at end of treatment | 1 | 54 | Mean Difference (IV, Fixed, 95% CI) | ‐3.20 [‐9.91, 3.51] |
| 22.9.4 Secondary: depression (continuous), at 0‐6 months follow‐up | 1 | 47 | Mean Difference (IV, Fixed, 95% CI) | 8.50 [2.03, 14.97] |
| 22.10 B‐MCT vs progressive muscle relaxation (PMR) training + TAU (dichotomous). Secondary: attrition (dichotomous), at end of treatment Show forest plot | 1 | Risk Ratio (M‐H, Fixed, 95% CI) | Subtotals only | |
| 22.11 MOTR (Motive‐Oriented Therapeutic Relationship) vs Good Psychiatric Management (GPM) (continuous) Show forest plot | 2 | Std. Mean Difference (IV, Random, 95% CI) | Subtotals only | |
| 22.11.1 Primary: BPD symptom severity (continuous), at end of treatment | 1 | 74 | Std. Mean Difference (IV, Random, 95% CI) | 0.07 [‐0.39, 0.53] |
| 22.11.2 Primary: psychosocial functioning (continuous), at end of treatment | 2 | 99 | Std. Mean Difference (IV, Random, 95% CI) | ‐0.45 [‐0.85, ‐0.05] |
| 22.11.3 Secondary: interpersonal problems (continuous), at end of treatment | 2 | 99 | Std. Mean Difference (IV, Random, 95% CI) | ‐0.56 [‐0.97, ‐0.16] |
| 22.12 MOTR vs (GPM), secondary: attrition (dichotomous), at end of treatment Show forest plot | 2 | 110 | Risk Ratio (M‐H, Random, 95% CI) | 0.61 [0.26, 1.41] |
| Outcome or subgroup title | No. of studies | No. of participants | Statistical method | Effect size |
| 23.1 SFT vs TFP. Primary: BPD symptom severity (continuous), at end of treatment Show forest plot | 1 | Mean Difference (IV, Fixed, 95% CI) | Subtotals only | |
| 23.2 SFT vs TFP. Secondary: attrition (dichotomous), at 0‐6 months follow‐up Show forest plot | 1 | Risk Ratio (M‐H, Fixed, 95% CI) | Subtotals only | |
| 23.3 SFT vs SFT + therapist availability (TA). Primary: BPD symptom severity (continuous), at end of treatment Show forest plot | 1 | Mean Difference (IV, Fixed, 95% CI) | Subtotals only | |
| 23.4 SFT vs SFT + TA. Secondary: attrition (dichotomous), 0‐6 months follow‐up Show forest plot | 1 | Risk Ratio (M‐H, Fixed, 95% CI) | Subtotals only | |
| Outcome or subgroup title | No. of studies | No. of participants | Statistical method | Effect size |
| 24.1 STEPPS‐PE vs CR Show forest plot | 1 | Mean Difference (IV, Fixed, 95% CI) | Subtotals only | |
| 24.1.1 Primary: BPD symptom severity (continuous), at end of treatment | 1 | 46 | Mean Difference (IV, Fixed, 95% CI) | ‐3.67 [‐6.52, ‐0.82] |
| 24.1.2 Primary: BPD symptom severity (continuous), at 0‐6 months follow‐up | 1 | 42 | Mean Difference (IV, Fixed, 95% CI) | 4.68 [1.42, 7.94] |
| 24.1.3 Secondary: impulsivity (continuous), at end of treatment | 1 | 46 | Mean Difference (IV, Fixed, 95% CI) | 1.99 [0.06, 3.92] |
| 24.1.4 Secondary: impulsivity (continuous), at 0‐6 months follow‐up | 1 | 42 | Mean Difference (IV, Fixed, 95% CI) | 9.92 [7.38, 12.46] |
| 24.1.5 Secondary: depression (continuous), at end of treatment | 1 | 48 | Mean Difference (IV, Fixed, 95% CI) | ‐2.58 [‐3.62, ‐1.54] |
| 24.1.6 Secondary: depression (continuous), at 0‐6 months follow‐up | 1 | 42 | Mean Difference (IV, Fixed, 95% CI) | ‐10.11 [‐11.35, ‐8.87] |
| 24.2 STEPPS‐PE vs CR. Secondary: attrition (dichotomous), at end of treatment Show forest plot | 1 | Risk Ratio (M‐H, Fixed, 95% CI) | Subtotals only | |
| Outcome or subgroup title | No. of studies | No. of participants | Statistical method | Effect size |
| 25.1 Combined inpatient and outpatient psychotherapy versus outpatient psychotherapy Show forest plot | 1 | Mean Difference (IV, Fixed, 95% CI) | Subtotals only | |
| 25.1.1 Primary: psychosocial functioning (continuous), at end of treatment | 1 | 52 | Mean Difference (IV, Fixed, 95% CI) | 6.50 [‐0.06, 13.06] |
| 25.1.2 Primary: psychosocial functioning (continuous), at above 12 months follow‐up | 1 | 52 | Mean Difference (IV, Fixed, 95% CI) | ‐5.70 [‐13.33, 1.93] |
| 25.1.3 Secondary: interpersonal problems (continuous), at end of treatment | 1 | 52 | Mean Difference (IV, Fixed, 95% CI) | 0.05 [‐0.24, 0.34] |
| 25.1.4 Secondary: interpersonal problems (continuous), at above 12 months follow‐up | 1 | 52 | Mean Difference (IV, Fixed, 95% CI) | ‐0.42 [‐0.77, ‐0.07] |
| 25.1.5 Secondary: identity disturbance (continuous), at end of treatment | 1 | 52 | Mean Difference (IV, Fixed, 95% CI) | ‐0.25 [‐0.59, 0.09] |
| 25.1.6 Secondary: identity disturbance (continuous), at above 12 months follow‐up | 1 | 52 | Mean Difference (IV, Fixed, 95% CI) | ‐0.47 [‐0.78, ‐0.16] |
| 25.1.7 Secondary: depression (continuous), at end of treatment | 1 | 52 | Mean Difference (IV, Fixed, 95% CI) | ‐0.40 [‐6.25, 5.45] |
| 25.1.8 Secondary: depression (continuous), at above 12 months follow‐up | 1 | 52 | Mean Difference (IV, Fixed, 95% CI) | ‐4.70 [‐11.02, 1.62] |
| 25.2 Combined inpatient and outpatient psychotherapy versus outpatient psychotherapy. Secondary: attrition (dichotomous), at end of treatment Show forest plot | 1 | Risk Ratio (M‐H, Fixed, 95% CI) | Subtotals only | |
| 25.3 integrative BPD‐oriented adolescent family therapy (I‐BAFT) vs individual drug counselling (IDC) Show forest plot | 1 | Risk Ratio (M‐H, Fixed, 95% CI) | Subtotals only | |
| 25.3.1 Primary: BPD symptom severity (dichotomous), at end of treatment | 1 | 40 | Risk Ratio (M‐H, Fixed, 95% CI) | 0.91 [0.50, 1.64] |
| 25.3.2 Secondary: attrition (dichotomous), at 6‐12 months follow‐up | 1 | 40 | Risk Ratio (M‐H, Fixed, 95% CI) | 0.50 [0.18, 1.40] |
| Outcome or subgroup title | No. of studies | No. of participants | Statistical method | Effect size |
| 26.1 BPD symptom severity Show forest plot | 23 | Std. Mean Difference (IV, Random, 95% CI) | Subtotals only | |
| 26.1.1 DBT | 3 | 149 | Std. Mean Difference (IV, Random, 95% CI) | ‐0.60 [‐1.05, ‐0.14] |
| 26.1.2 MBT | 5 | 267 | Std. Mean Difference (IV, Random, 95% CI) | ‐0.13 [‐0.38, 0.11] |
| 26.1.3 Psychodynamic psychotherapy | 4 | 222 | Std. Mean Difference (IV, Random, 95% CI) | ‐0.29 [‐0.66, 0.09] |
| 26.1.4 STEPPS | 3 | 273 | Std. Mean Difference (IV, Random, 95% CI) | ‐0.39 [‐0.63, ‐0.15] |
| 26.1.5 Eclectic treatments | 3 | 134 | Std. Mean Difference (IV, Random, 95% CI) | ‐0.90 [‐1.57, ‐0.23] |
| 26.1.6 ACT | 1 | 41 | Std. Mean Difference (IV, Random, 95% CI) | ‐1.22 [‐1.89, ‐0.55] |
| 26.1.7 CBT | 1 | 26 | Std. Mean Difference (IV, Random, 95% CI) | ‐1.28 [‐2.14, ‐0.42] |
| 26.1.8 SFT | 1 | 28 | Std. Mean Difference (IV, Random, 95% CI) | ‐1.66 [‐2.54, ‐0.78] |
| 26.1.9 CAT | 1 | 9 | Std. Mean Difference (IV, Random, 95% CI) | ‐0.53 [‐1.88, 0.83] |
| 26.1.10 Tranference‐focused psychotherapy | 1 | 104 | Std. Mean Difference (IV, Random, 95% CI) | ‐0.55 [‐0.95, ‐0.16] |
| 26.2 Psychosocial functioning Show forest plot | 22 | Std. Mean Difference (IV, Random, 95% CI) | Subtotals only | |
| 26.2.1 DBT | 6 | 225 | Std. Mean Difference (IV, Random, 95% CI) | ‐0.36 [‐0.69, ‐0.03] |
| 26.2.2 MBT | 3 | 239 | Std. Mean Difference (IV, Random, 95% CI) | ‐0.54 [‐1.24, 0.16] |
| 26.2.3 Psychodynamic psychotherapy | 4 | 140 | Std. Mean Difference (IV, Random, 95% CI) | ‐0.69 [‐1.98, 0.59] |
| 26.2.4 Eclectic treatments | 2 | 231 | Std. Mean Difference (IV, Random, 95% CI) | ‐0.57 [‐1.10, ‐0.04] |
| 26.2.5 CBT | 1 | 99 | Std. Mean Difference (IV, Random, 95% CI) | 0.00 [‐0.39, 0.39] |
| 26.2.6 SFT | 1 | 28 | Std. Mean Difference (IV, Random, 95% CI) | ‐1.20 [‐2.03, ‐0.38] |
| 26.2.7 STEPPS | 1 | 124 | Std. Mean Difference (IV, Random, 95% CI) | ‐0.55 [‐0.91, ‐0.19] |
| 26.2.8 CAT | 1 | 9 | Std. Mean Difference (IV, Random, 95% CI) | ‐1.22 [‐2.73, 0.30] |
| 26.2.9 Motivation feedback | 1 | 43 | Std. Mean Difference (IV, Random, 95% CI) | ‐0.07 [‐0.69, 0.55] |
| 26.2.10 Tranference‐focused psychotherapy | 1 | 104 | Std. Mean Difference (IV, Random, 95% CI) | ‐0.34 [‐0.73, 0.05] |
| 26.2.11 Once‐only intervention | 1 | 72 | Std. Mean Difference (IV, Random, 95% CI) | 0.03 [‐0.43, 0.49] |
| Outcome or subgroup title | No. of studies | No. of participants | Statistical method | Effect size |
| 27.1 BPD symptom severity Show forest plot | 22 | Std. Mean Difference (IV, Random, 95% CI) | Subtotals only | |
| 27.1.1 15 to 18 years old | 2 | 156 | Std. Mean Difference (IV, Random, 95% CI) | ‐0.14 [‐0.46, 0.17] |
| 27.1.2 Above 18 years old | 20 | 1088 | Std. Mean Difference (IV, Random, 95% CI) | ‐0.57 [‐0.76, ‐0.37] |
| Outcome or subgroup title | No. of studies | No. of participants | Statistical method | Effect size |
| 28.1 BPD symptom severity Show forest plot | 22 | Std. Mean Difference (IV, Random, 95% CI) | Subtotals only | |
| 28.1.1 Less than 6 months | 8 | 525 | Std. Mean Difference (IV, Random, 95% CI) | ‐0.76 [‐1.10, ‐0.42] |
| 28.1.2 6 to 12 months | 11 | 606 | Std. Mean Difference (IV, Random, 95% CI) | ‐0.36 [‐0.60, ‐0.12] |
| 28.1.3 Above 12 months | 3 | 113 | Std. Mean Difference (IV, Random, 95% CI) | ‐0.37 [‐0.75, 0.01] |
| 28.2 Psychosocial functioning Show forest plot | 20 | Std. Mean Difference (IV, Random, 95% CI) | Subtotals only | |
| 28.2.1 Less than 6 months | 6 | 468 | Std. Mean Difference (IV, Random, 95% CI) | ‐0.31 [‐0.73, 0.11] |
| 28.2.2 6 to 12 months | 10 | 535 | Std. Mean Difference (IV, Random, 95% CI) | ‐0.25 [‐0.49, ‐0.01] |
| 28.2.3 Over 12 months | 4 | 263 | Std. Mean Difference (IV, Random, 95% CI) | ‐0.86 [‐1.62, ‐0.10] |
| Outcome or subgroup title | No. of studies | No. of participants | Statistical method | Effect size |
| 29.1 BPD symptom severity Show forest plot | 22 | Std. Mean Difference (IV, Random, 95% CI) | Subtotals only | |
| 29.1.1 Individual therapy | 8 | 520 | Std. Mean Difference (IV, Random, 95% CI) | ‐0.39 [‐0.63, ‐0.16] |
| 29.1.2 Group therapy | 8 | 438 | Std. Mean Difference (IV, Random, 95% CI) | ‐0.89 [‐1.21, ‐0.57] |
| 29.1.3 Mixed therapy | 6 | 286 | Std. Mean Difference (IV, Random, 95% CI) | ‐0.15 [‐0.38, 0.09] |
| 29.2 Psychosocial functioning Show forest plot | 22 | Std. Mean Difference (IV, Random, 95% CI) | Subtotals only | |
| 29.2.1 Individual therapy | 8 | 570 | Std. Mean Difference (IV, Random, 95% CI) | ‐0.31 [‐0.75, 0.12] |
| 29.2.2 Group therapy | 7 | 366 | Std. Mean Difference (IV, Random, 95% CI) | ‐0.44 [‐0.65, ‐0.23] |
| 29.2.3 Mixed therapy | 7 | 378 | Std. Mean Difference (IV, Random, 95% CI) | ‐0.63 [‐1.14, ‐0.13] |
| Outcome or subgroup title | No. of studies | No. of participants | Statistical method | Effect size |
| 30.1 BPD symptom severity Show forest plot | 22 | Std. Mean Difference (IV, Random, 95% CI) | Subtotals only | |
| 30.1.1 Inpatient | 2 | 217 | Std. Mean Difference (IV, Random, 95% CI) | ‐0.07 [‐0.34, 0.20] |
| 30.1.2 Outpatient | 20 | 1027 | Std. Mean Difference (IV, Random, 95% CI) | ‐0.58 [‐0.77, ‐0.39] |
| 30.2 Psychosocial functioning Show forest plot | 22 | Std. Mean Difference (IV, Random, 95% CI) | Subtotals only | |
| 30.2.1 Inpatient | 2 | 179 | Std. Mean Difference (IV, Random, 95% CI) | ‐0.85 [‐1.24, ‐0.46] |
| 30.2.2 Outpatient | 18 | 1057 | Std. Mean Difference (IV, Random, 95% CI) | ‐0.31 [‐0.54, ‐0.08] |
| 30.2.3 Inpatient and outpatient | 2 | 78 | Std. Mean Difference (IV, Random, 95% CI) | ‐1.34 [‐1.84, ‐0.84] |
| Outcome or subgroup title | No. of studies | No. of participants | Statistical method | Effect size |
| 31.1 BPD symptom severity Show forest plot | 22 | Std. Mean Difference (IV, Random, 95% CI) | Subtotals only | |
| 31.1.1 Self‐rated | 8 | 408 | Std. Mean Difference (IV, Random, 95% CI) | ‐0.74 [‐1.19, ‐0.29] |
| 31.1.2 Clinician‐rated | 14 | 836 | Std. Mean Difference (IV, Random, 95% CI) | ‐0.42 [‐0.58, ‐0.25] |
| 31.2 Psychosocial functioning Show forest plot | 22 | Std. Mean Difference (IV, Random, 95% CI) | Subtotals only | |
| 31.2.1 Self‐rated | 12 | 728 | Std. Mean Difference (IV, Random, 95% CI) | ‐0.29 [‐0.60, 0.03] |
| 31.2.2 Clinician‐rated | 10 | 586 | Std. Mean Difference (IV, Random, 95% CI) | ‐0.66 [‐0.96, ‐0.37] |
| Outcome or subgroup title | No. of studies | No. of participants | Statistical method | Effect size |
| 32.1 BPD symptom severity Show forest plot | 22 | Std. Mean Difference (IV, Random, 95% CI) | Subtotals only | |
| 32.1.1 Obligatory TAU | 19 | 1071 | Std. Mean Difference (IV, Random, 95% CI) | ‐0.50 [‐0.70, ‐0.30] |
| 32.1.2 Optional TAU | 3 | 173 | Std. Mean Difference (IV, Random, 95% CI) | ‐0.63 [‐1.09, ‐0.17] |
| 32.2 Psychosocial functioning Show forest plot | 22 | Std. Mean Difference (IV, Random, 95% CI) | Subtotals only | |
| 32.2.1 Obligatory TAU | 17 | 1002 | Std. Mean Difference (IV, Random, 95% CI) | ‐0.32 [‐0.56, ‐0.09] |
| 32.2.2 Optional TAU | 5 | 312 | Std. Mean Difference (IV, Random, 95% CI) | ‐0.96 [‐1.62, ‐0.30] |
| Outcome or subgroup title | No. of studies | No. of participants | Statistical method | Effect size |
| 33.1 BPD symptom severity Show forest plot | 25 | Std. Mean Difference (IV, Random, 95% CI) | Subtotals only | |
| 33.1.1 TAU | 22 | 1244 | Std. Mean Difference (IV, Random, 95% CI) | ‐0.52 [‐0.70, ‐0.33] |
| 33.1.2 Waiting list | 3 | 161 | Std. Mean Difference (IV, Random, 95% CI) | ‐0.49 [‐0.93, ‐0.05] |
| 33.2 Psychosocial functioning Show forest plot | 27 | Std. Mean Difference (IV, Random, 95% CI) | Subtotals only | |
| 33.2.1 TAU | 22 | 1314 | Std. Mean Difference (IV, Random, 95% CI) | ‐0.45 [‐0.68, ‐0.22] |
| 33.2.2 Waiting list | 5 | 219 | Std. Mean Difference (IV, Random, 95% CI) | ‐0.56 [‐1.01, ‐0.11] |
| Outcome or subgroup title | No. of studies | No. of participants | Statistical method | Effect size |
| 34.1 BPD symptom severity Show forest plot | 22 | Std. Mean Difference (IV, Random, 95% CI) | Subtotals only | |
| 34.1.1 ZAN‐BPD | 4 | 261 | Std. Mean Difference (IV, Random, 95% CI) | ‐0.45 [‐0.69, ‐0.20] |
| 34.1.2 SCID | 3 | 112 | Std. Mean Difference (IV, Random, 95% CI) | ‐0.58 [‐1.16, ‐0.00] |
| 34.1.3 BEST | 4 | 147 | Std. Mean Difference (IV, Random, 95% CI) | ‐1.10 [‐1.47, ‐0.72] |
| 34.1.4 BPDSI | 4 | 267 | Std. Mean Difference (IV, Random, 95% CI) | ‐0.21 [‐0.45, 0.04] |
| 34.1.5 BPP‐40 | 1 | 52 | Std. Mean Difference (IV, Random, 95% CI) | ‐0.55 [‐1.11, 0.00] |
| 34.1.6 CGI‐BPD | 1 | 33 | Std. Mean Difference (IV, Random, 95% CI) | 0.00 [‐0.68, 0.68] |
| 34.1.7 CCGI‐BPD | 1 | 59 | Std. Mean Difference (IV, Random, 95% CI) | ‐1.01 [‐1.55, ‐0.47] |
| 34.1.8 BPT | 1 | 122 | Std. Mean Difference (IV, Random, 95% CI) | ‐0.07 [‐0.43, 0.28] |
| 34.1.9 BPFS‐C | 1 | 59 | Std. Mean Difference (IV, Random, 95% CI) | ‐0.01 [‐0.52, 0.50] |
| 34.1.10 BSI | 1 | 28 | Std. Mean Difference (IV, Random, 95% CI) | ‐1.66 [‐2.54, ‐0.78] |
| 34.1.11 Mean number of DSM‐IV symptoms | 1 | 104 | Std. Mean Difference (IV, Random, 95% CI) | ‐0.55 [‐0.95, ‐0.16] |
| 34.2 Psychosocial functioning Show forest plot | 22 | Std. Mean Difference (IV, Random, 95% CI) | Subtotals only | |
| 34.2.1 GAF | 4 | 204 | Std. Mean Difference (IV, Random, 95% CI) | ‐0.73 [‐1.41, ‐0.05] |
| 34.2.2 GAS | 4 | 330 | Std. Mean Difference (IV, Random, 95% CI) | ‐0.71 [‐0.96, ‐0.46] |
| 34.2.3 SAS | 4 | 283 | Std. Mean Difference (IV, Random, 95% CI) | ‐0.23 [‐0.99, 0.53] |
| 34.2.4 SPS | 1 | 24 | Std. Mean Difference (IV, Random, 95% CI) | ‐2.17 [‐3.22, ‐1.13] |
| 34.2.5 QQ45 | 1 | 41 | Std. Mean Difference (IV, Random, 95% CI) | ‐0.47 [‐1.09, 0.15] |
| 34.2.6 WSAS | 1 | 72 | Std. Mean Difference (IV, Random, 95% CI) | 0.03 [‐0.43, 0.49] |
| 34.2.7 CORE‐OM | 1 | 41 | Std. Mean Difference (IV, Random, 95% CI) | 0.29 [‐0.34, 0.92] |
| 34.2.8 BDQ | 1 | 48 | Std. Mean Difference (IV, Random, 95% CI) | ‐0.42 [‐1.00, 0.16] |
| 34.2.9 SOFAS | 1 | 9 | Std. Mean Difference (IV, Random, 95% CI) | ‐1.22 [‐2.73, 0.30] |
| 34.2.10 SFQ | 1 | 99 | Std. Mean Difference (IV, Random, 95% CI) | 0.00 [‐0.39, 0.39] |
| 34.2.11 SDS | 1 | 61 | Std. Mean Difference (IV, Random, 95% CI) | ‐0.28 [‐0.78, 0.23] |
| 34.2.12 CGI | 1 | 59 | Std. Mean Difference (IV, Random, 95% CI) | ‐0.29 [‐0.80, 0.22] |
| 34.2.13 HoNOS | 1 | 43 | Std. Mean Difference (IV, Random, 95% CI) | ‐0.07 [‐0.69, 0.55] |
| Outcome or subgroup title | No. of studies | No. of participants | Statistical method | Effect size |
| 35.1 Primary: BPD symptom severity, at end of treatment Show forest plot | 22 | 1244 | Std. Mean Difference (IV, Random, 95% CI) | ‐0.47 [‐0.63, ‐0.31] |
| 35.2 Primary: self‐harm Show forest plot | 13 | 616 | Mean Difference (IV, Random, 95% CI) | ‐0.42 [‐0.69, ‐0.15] |
| 35.3 Primary: suicide‐related outcomes Show forest plot | 13 | 676 | Std. Mean Difference (IV, Random, 95% CI) | ‐0.30 [‐0.47, ‐0.14] |
| 35.4 Primary: psychosocial functioning, at end of treatment Show forest plot | 22 | 1314 | Std. Mean Difference (IV, Random, 95% CI) | ‐0.36 [‐0.55, ‐0.17] |
| 35.5 Secondary: depression Show forest plot | 22 | 1568 | Std. Mean Difference (IV, Random, 95% CI) | ‐0.34 [‐0.54, ‐0.14] |